Wikipedia edits (dz)
This is the bipartite edit network of the Dzongkha Wikipedia. It contains users
and pages from the Dzongkha Wikipedia, connected by edit events. Each edge
represents an edit. The dataset includes the timestamp of each edit.
Metadata
Statistics
| Size | n = | 2,362
|
| Left size | n1 = | 621
|
| Right size | n2 = | 1,741
|
| Volume | m = | 17,931
|
| Unique edge count | m̿ = | 6,922
|
| Wedge count | s = | 448,869
|
| Claw count | z = | 28,222,323
|
| Cross count | x = | 2,112,740,104
|
| Square count | q = | 1,553,202
|
| 4-Tour count | T4 = | 14,243,244
|
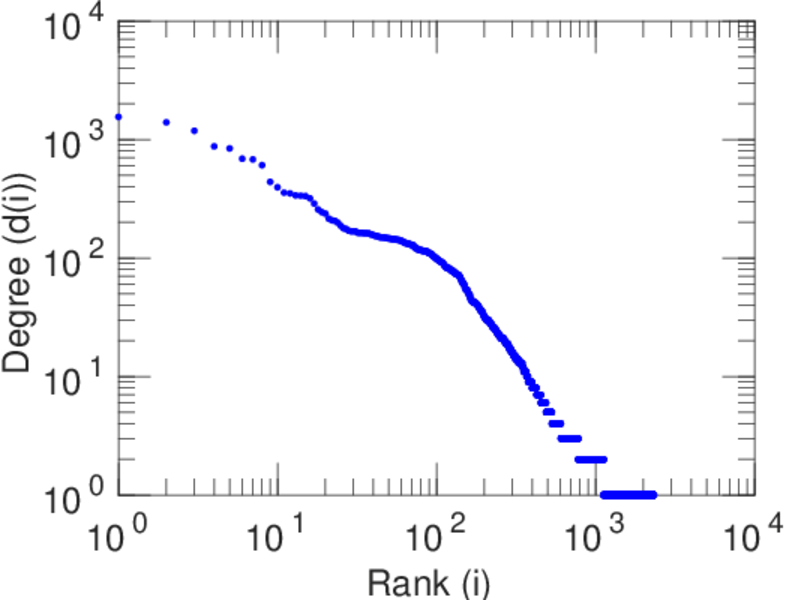
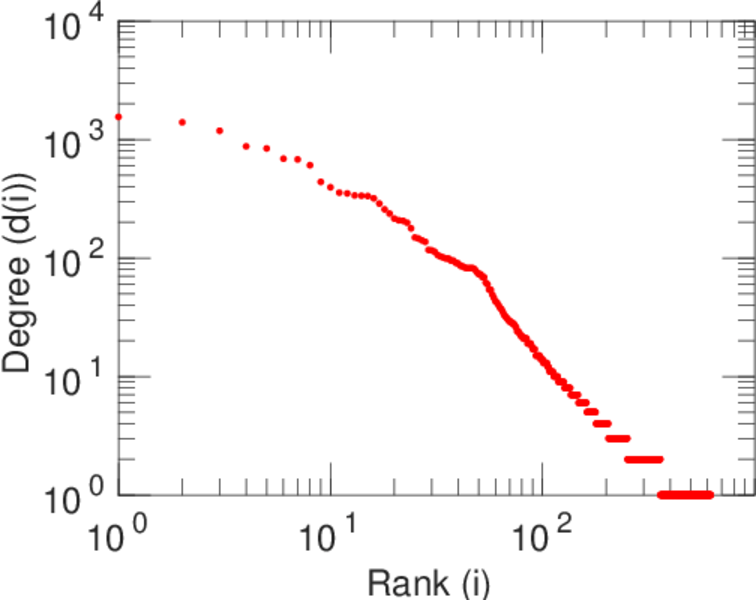
| Maximum degree | dmax = | 1,551
|
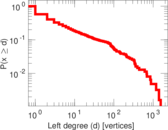
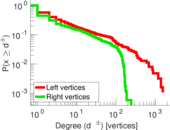
| Maximum left degree | d1max = | 1,551
|
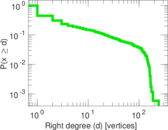
| Maximum right degree | d2max = | 244
|
| Average degree | d = | 15.182 9
|
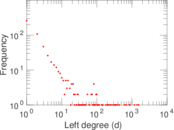
| Average left degree | d1 = | 28.874 4
|
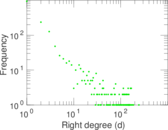
| Average right degree | d2 = | 10.299 3
|
| Fill | p = | 0.006 402 38
|
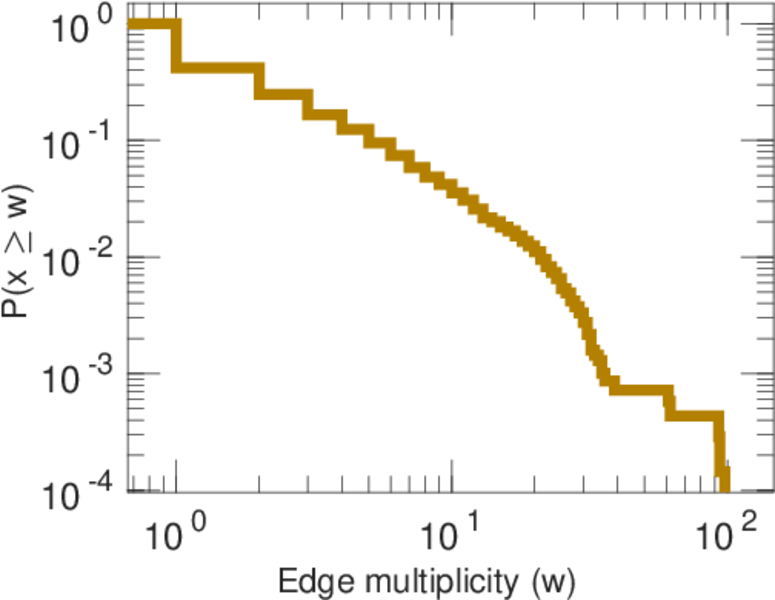
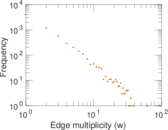
| Average edge multiplicity | m̃ = | 2.590 44
|
| Size of LCC | N = | 1,707
|
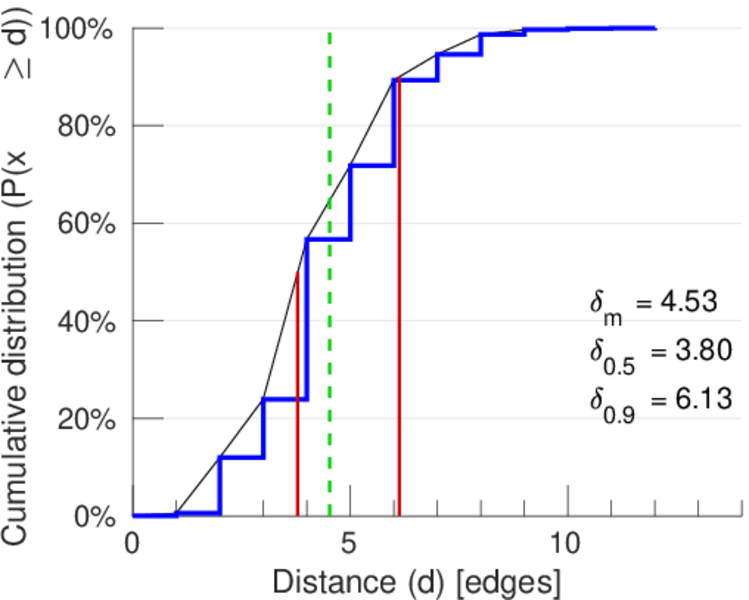
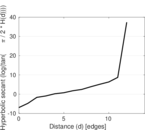
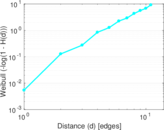
| Diameter | δ = | 13
|
| 50-Percentile effective diameter | δ0.5 = | 3.796 17
|
| 90-Percentile effective diameter | δ0.9 = | 6.130 14
|
| Median distance | δM = | 4
|
| Mean distance | δm = | 4.529 55
|
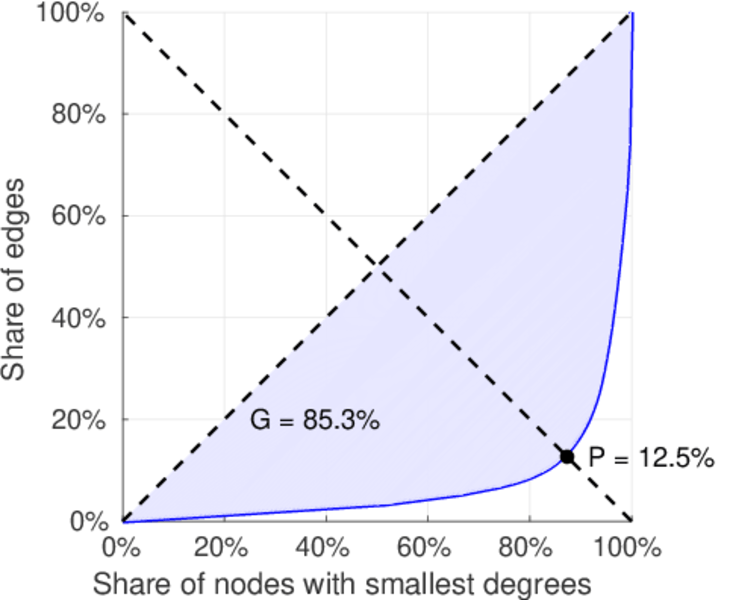
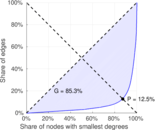
| Gini coefficient | G = | 0.855 480
|
| Balanced inequality ratio | P = | 0.131 504
|
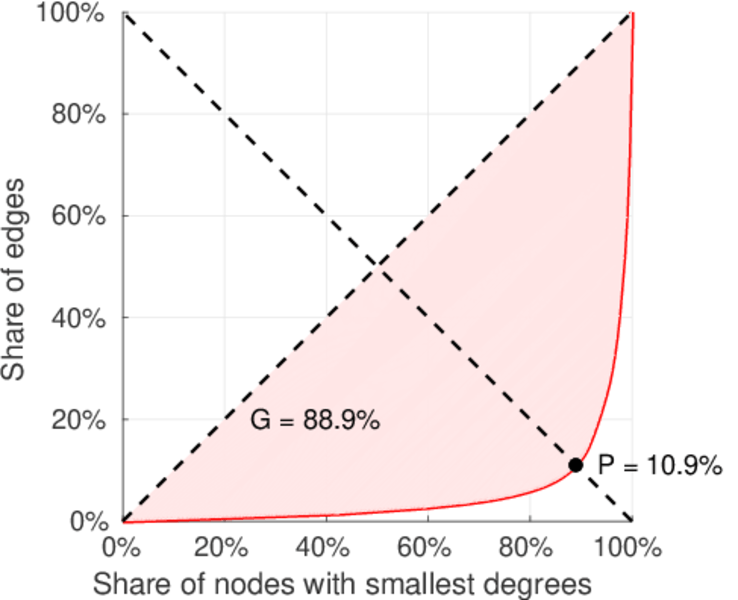
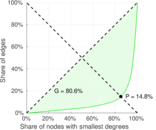
| Left balanced inequality ratio | P1 = | 0.108 862
|
| Right balanced inequality ratio | P2 = | 0.147 566
|
| Relative edge distribution entropy | Her = | 0.813 706
|
| Power law exponent | γ = | 2.542 34
|
| Tail power law exponent | γt = | 1.921 00
|
| Tail power law exponent with p | γ3 = | 1.921 00
|
| p-value | p = | 0.000 00
|
| Left tail power law exponent with p | γ3,1 = | 1.721 00
|
| Left p-value | p1 = | 0.000 00
|
| Right tail power law exponent with p | γ3,2 = | 2.021 00
|
| Right p-value | p2 = | 0.000 00
|
| Degree assortativity | ρ = | −0.120 824
|
| Degree assortativity p-value | pρ = | 6.273 36 × 10−24
|
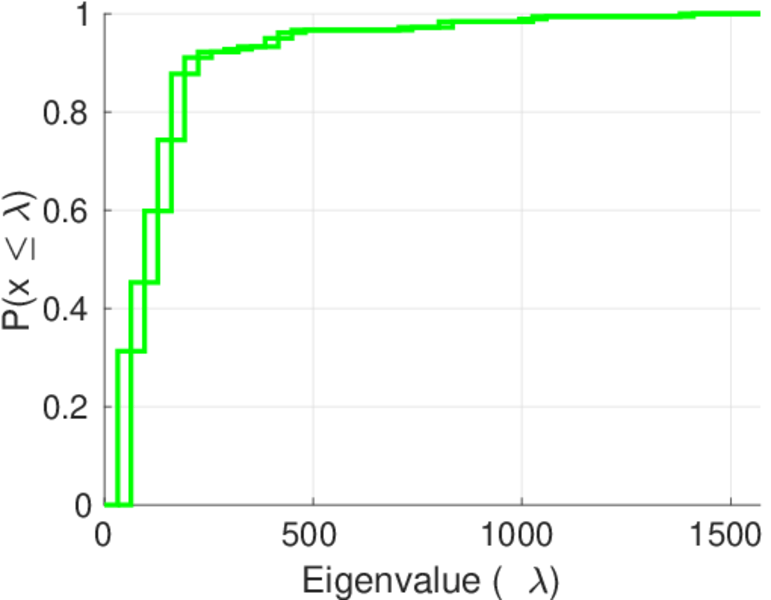
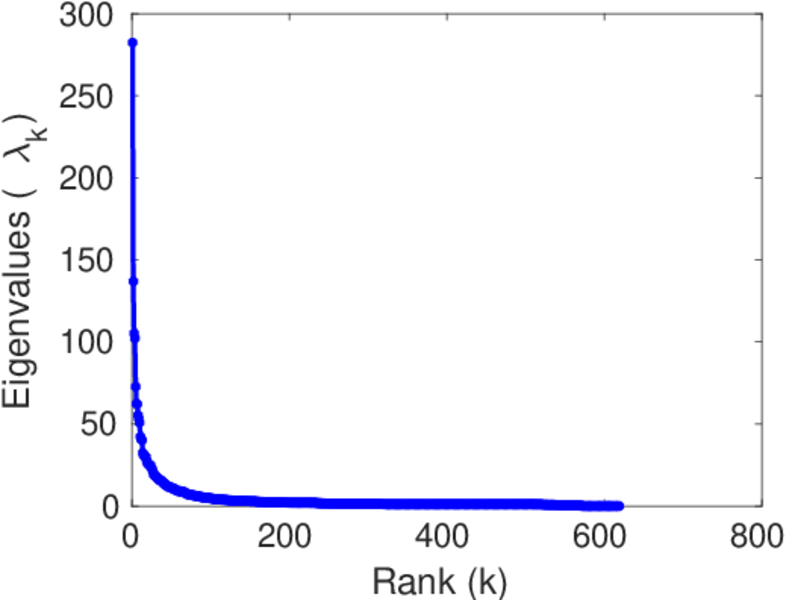
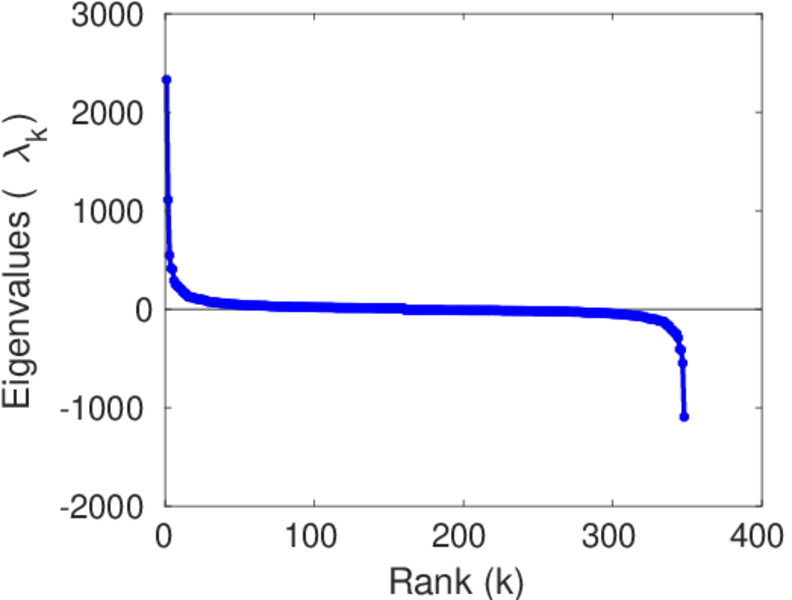
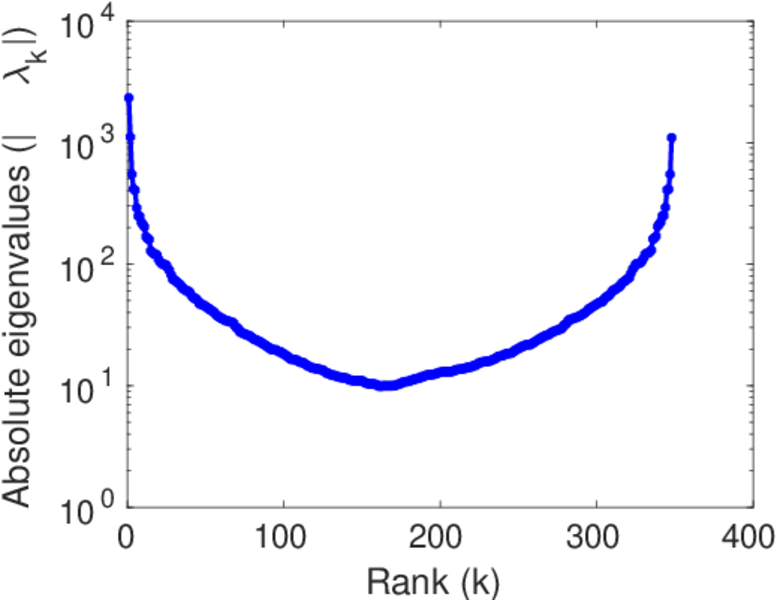
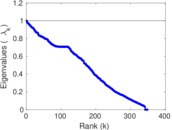
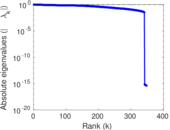
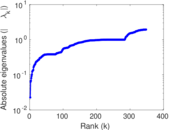
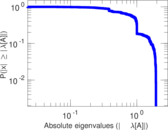
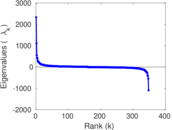
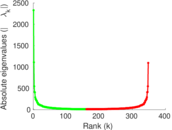
| Spectral norm | α = | 282.279
|
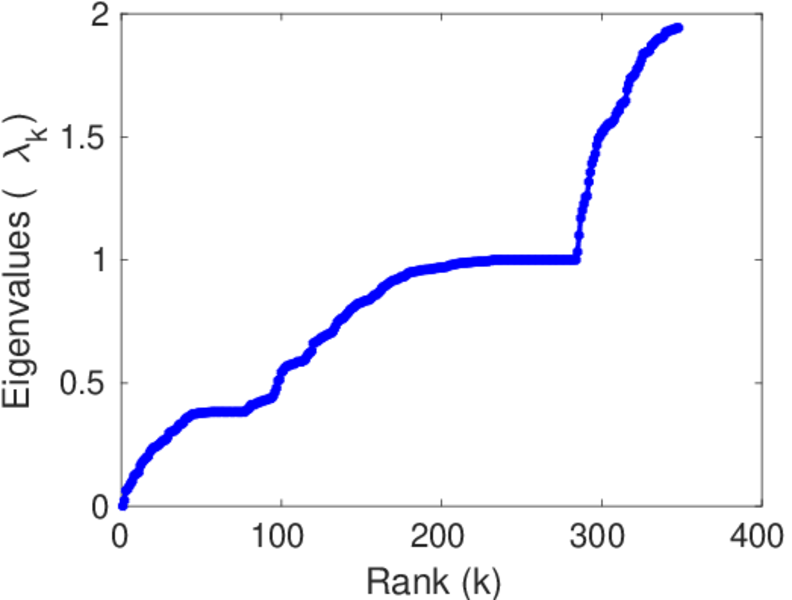
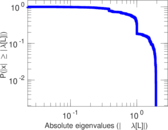
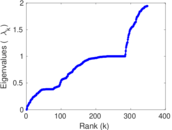
| Algebraic connectivity | a = | 0.022 553 2
|
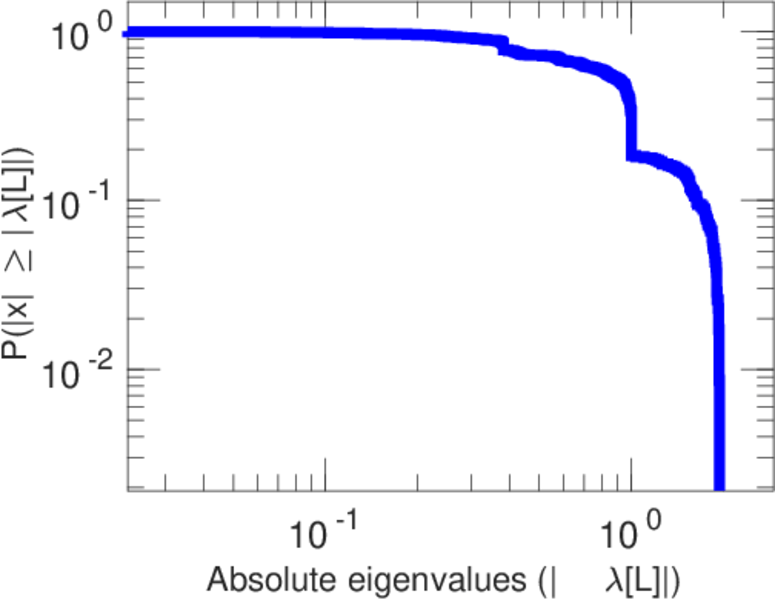
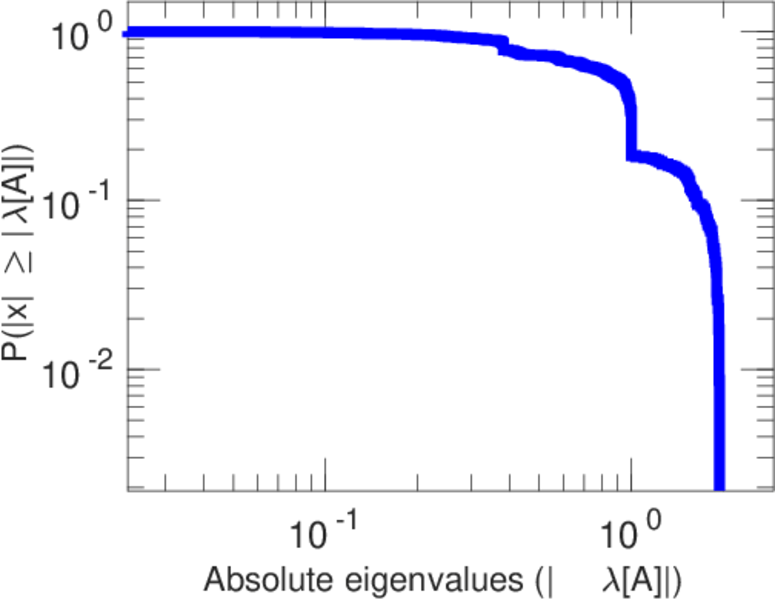
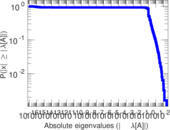
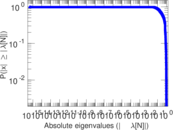
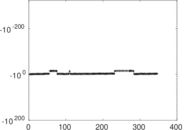
| Spectral separation | |λ1[A] / λ2[A]| = | 2.062 35
|
| Controllability | C = | 1,185
|
| Relative controllability | Cr = | 0.509 239
|
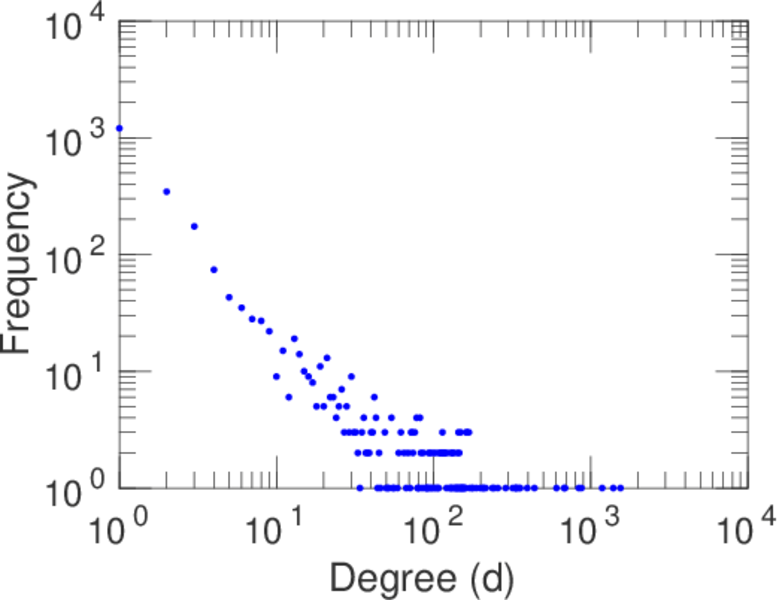
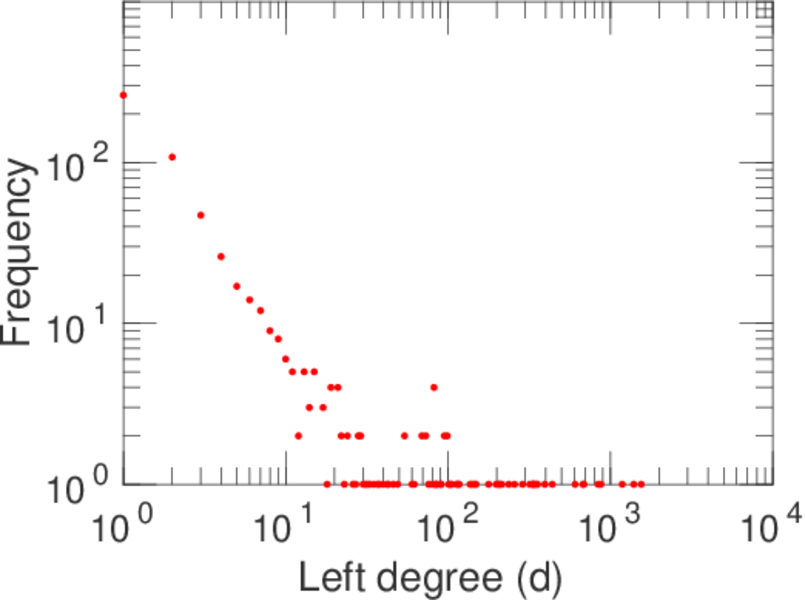
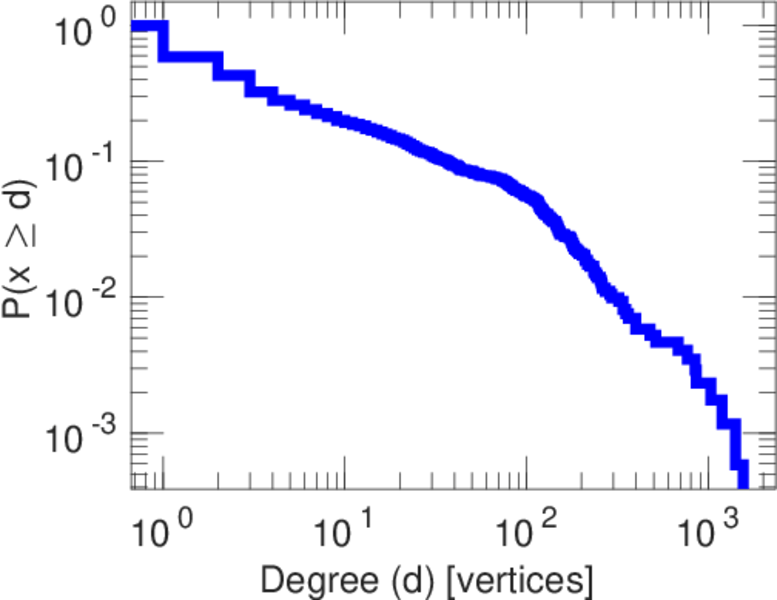
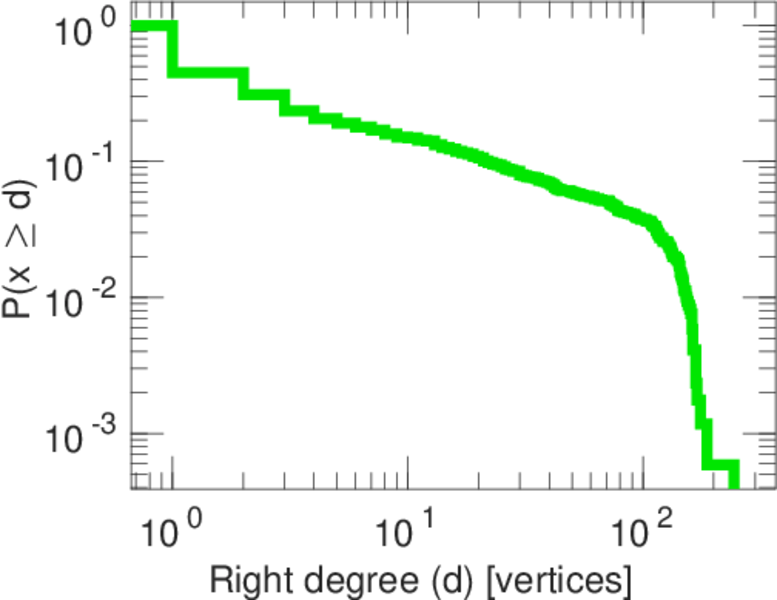
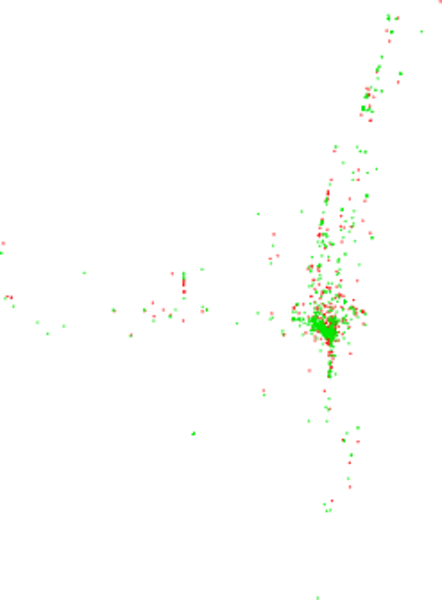
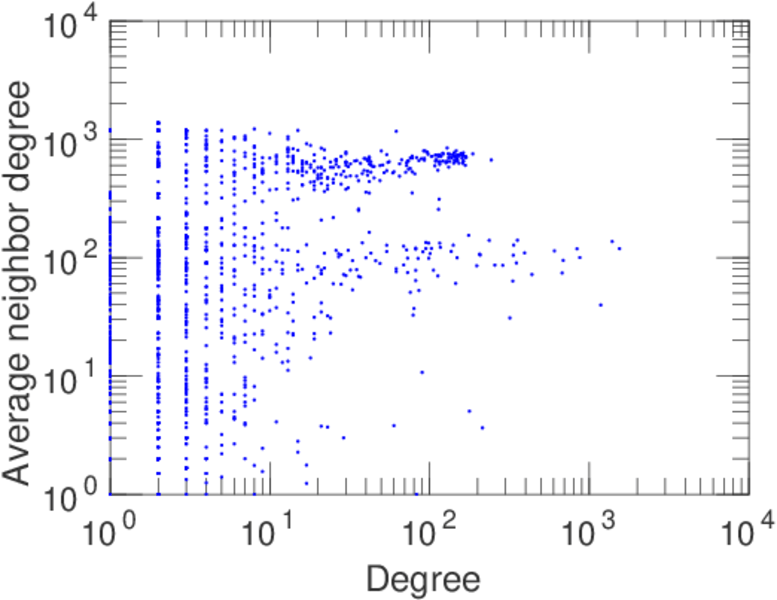
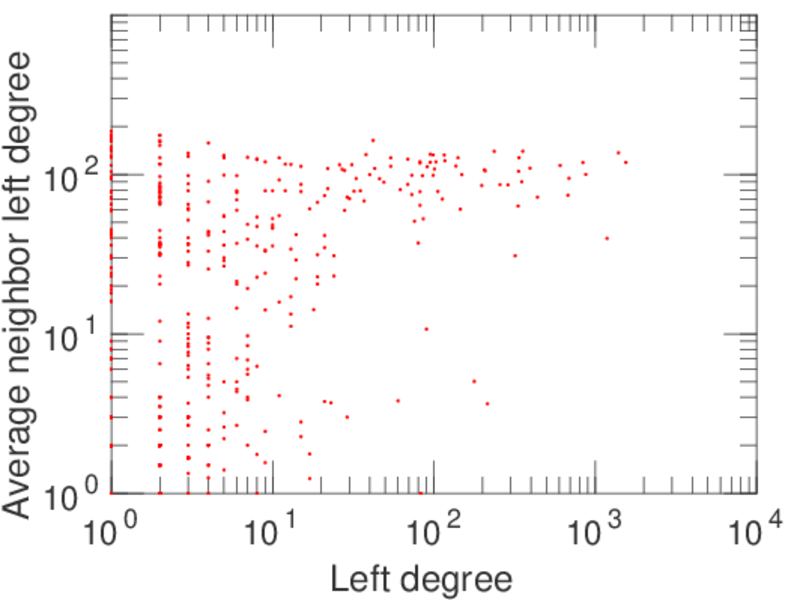
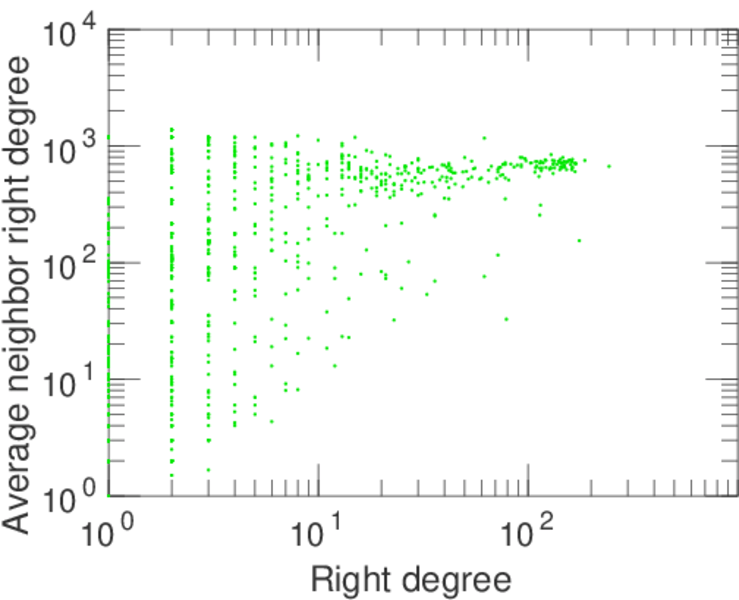
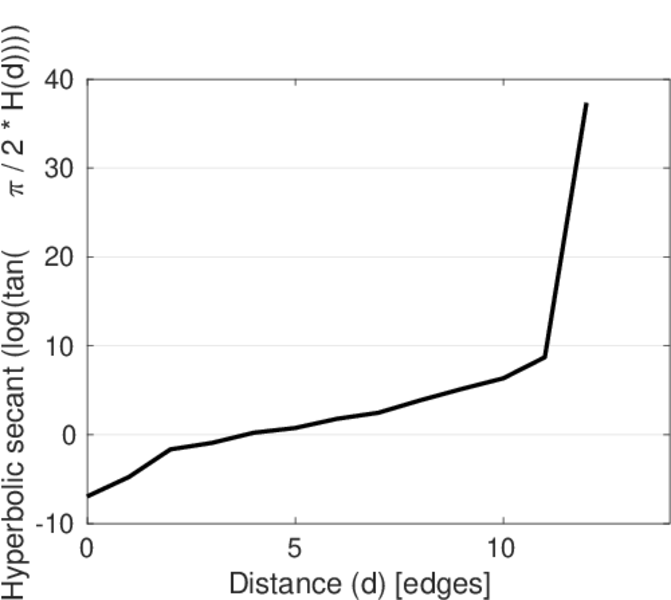
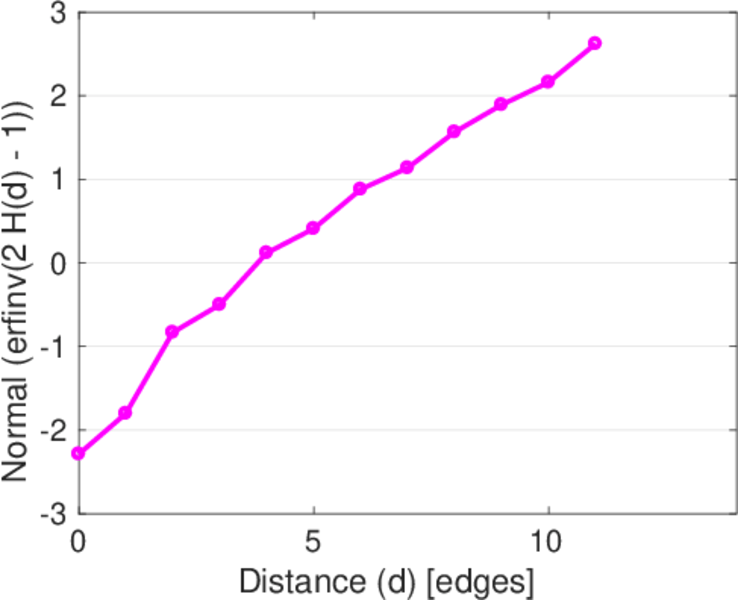
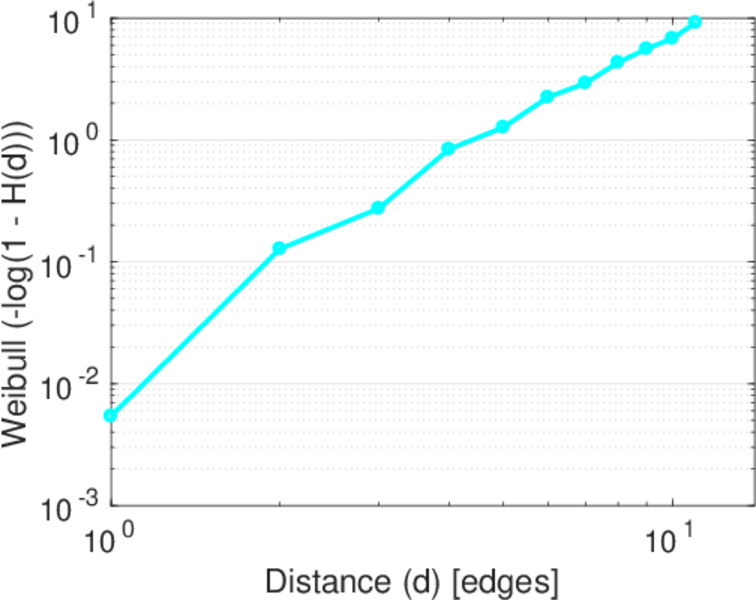
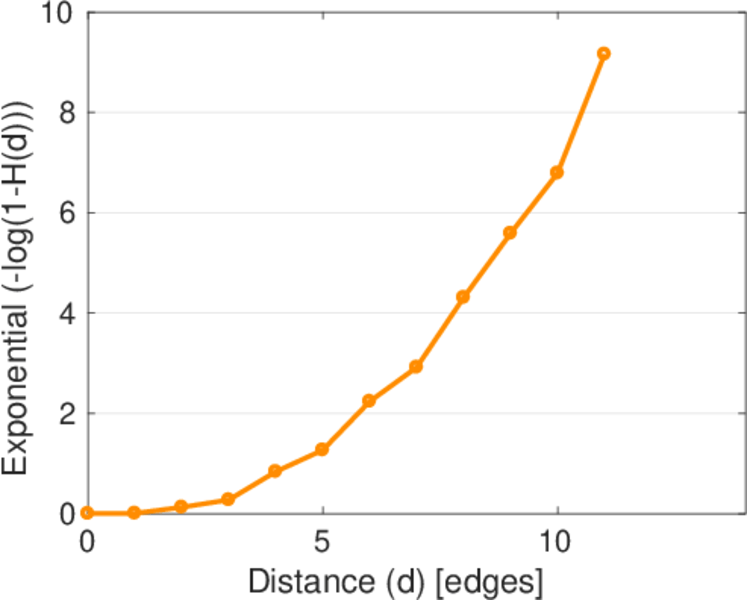
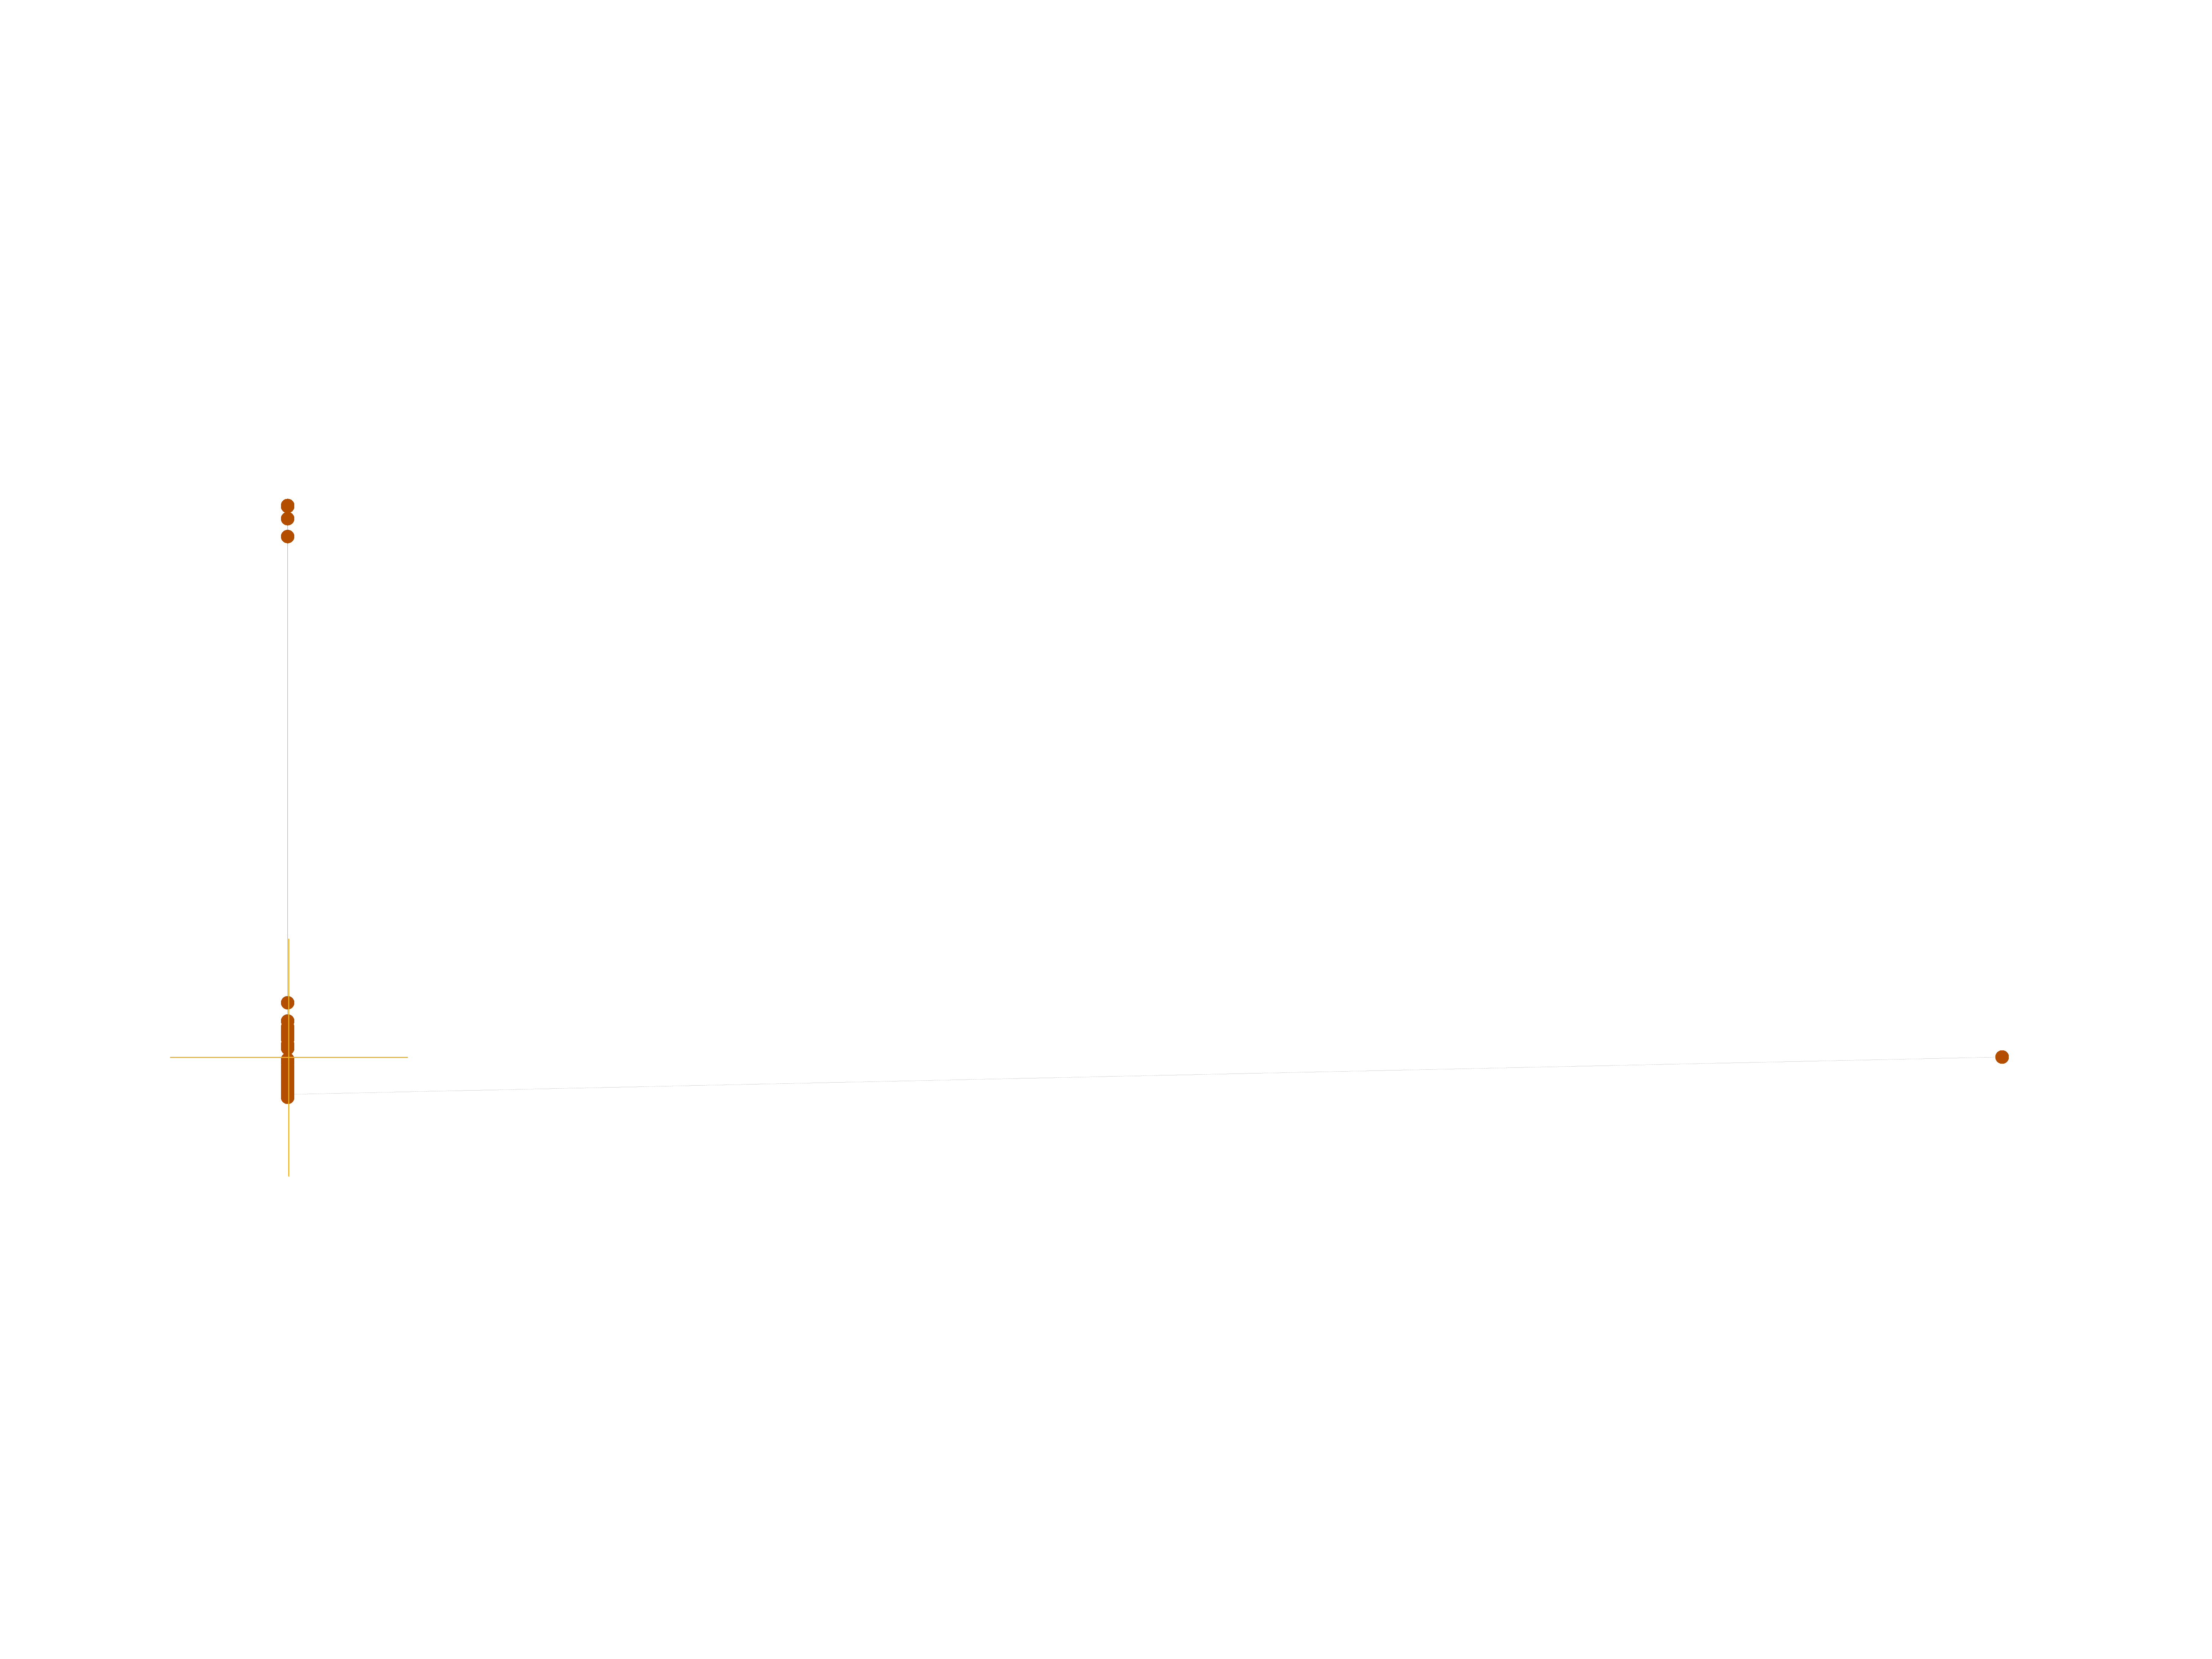
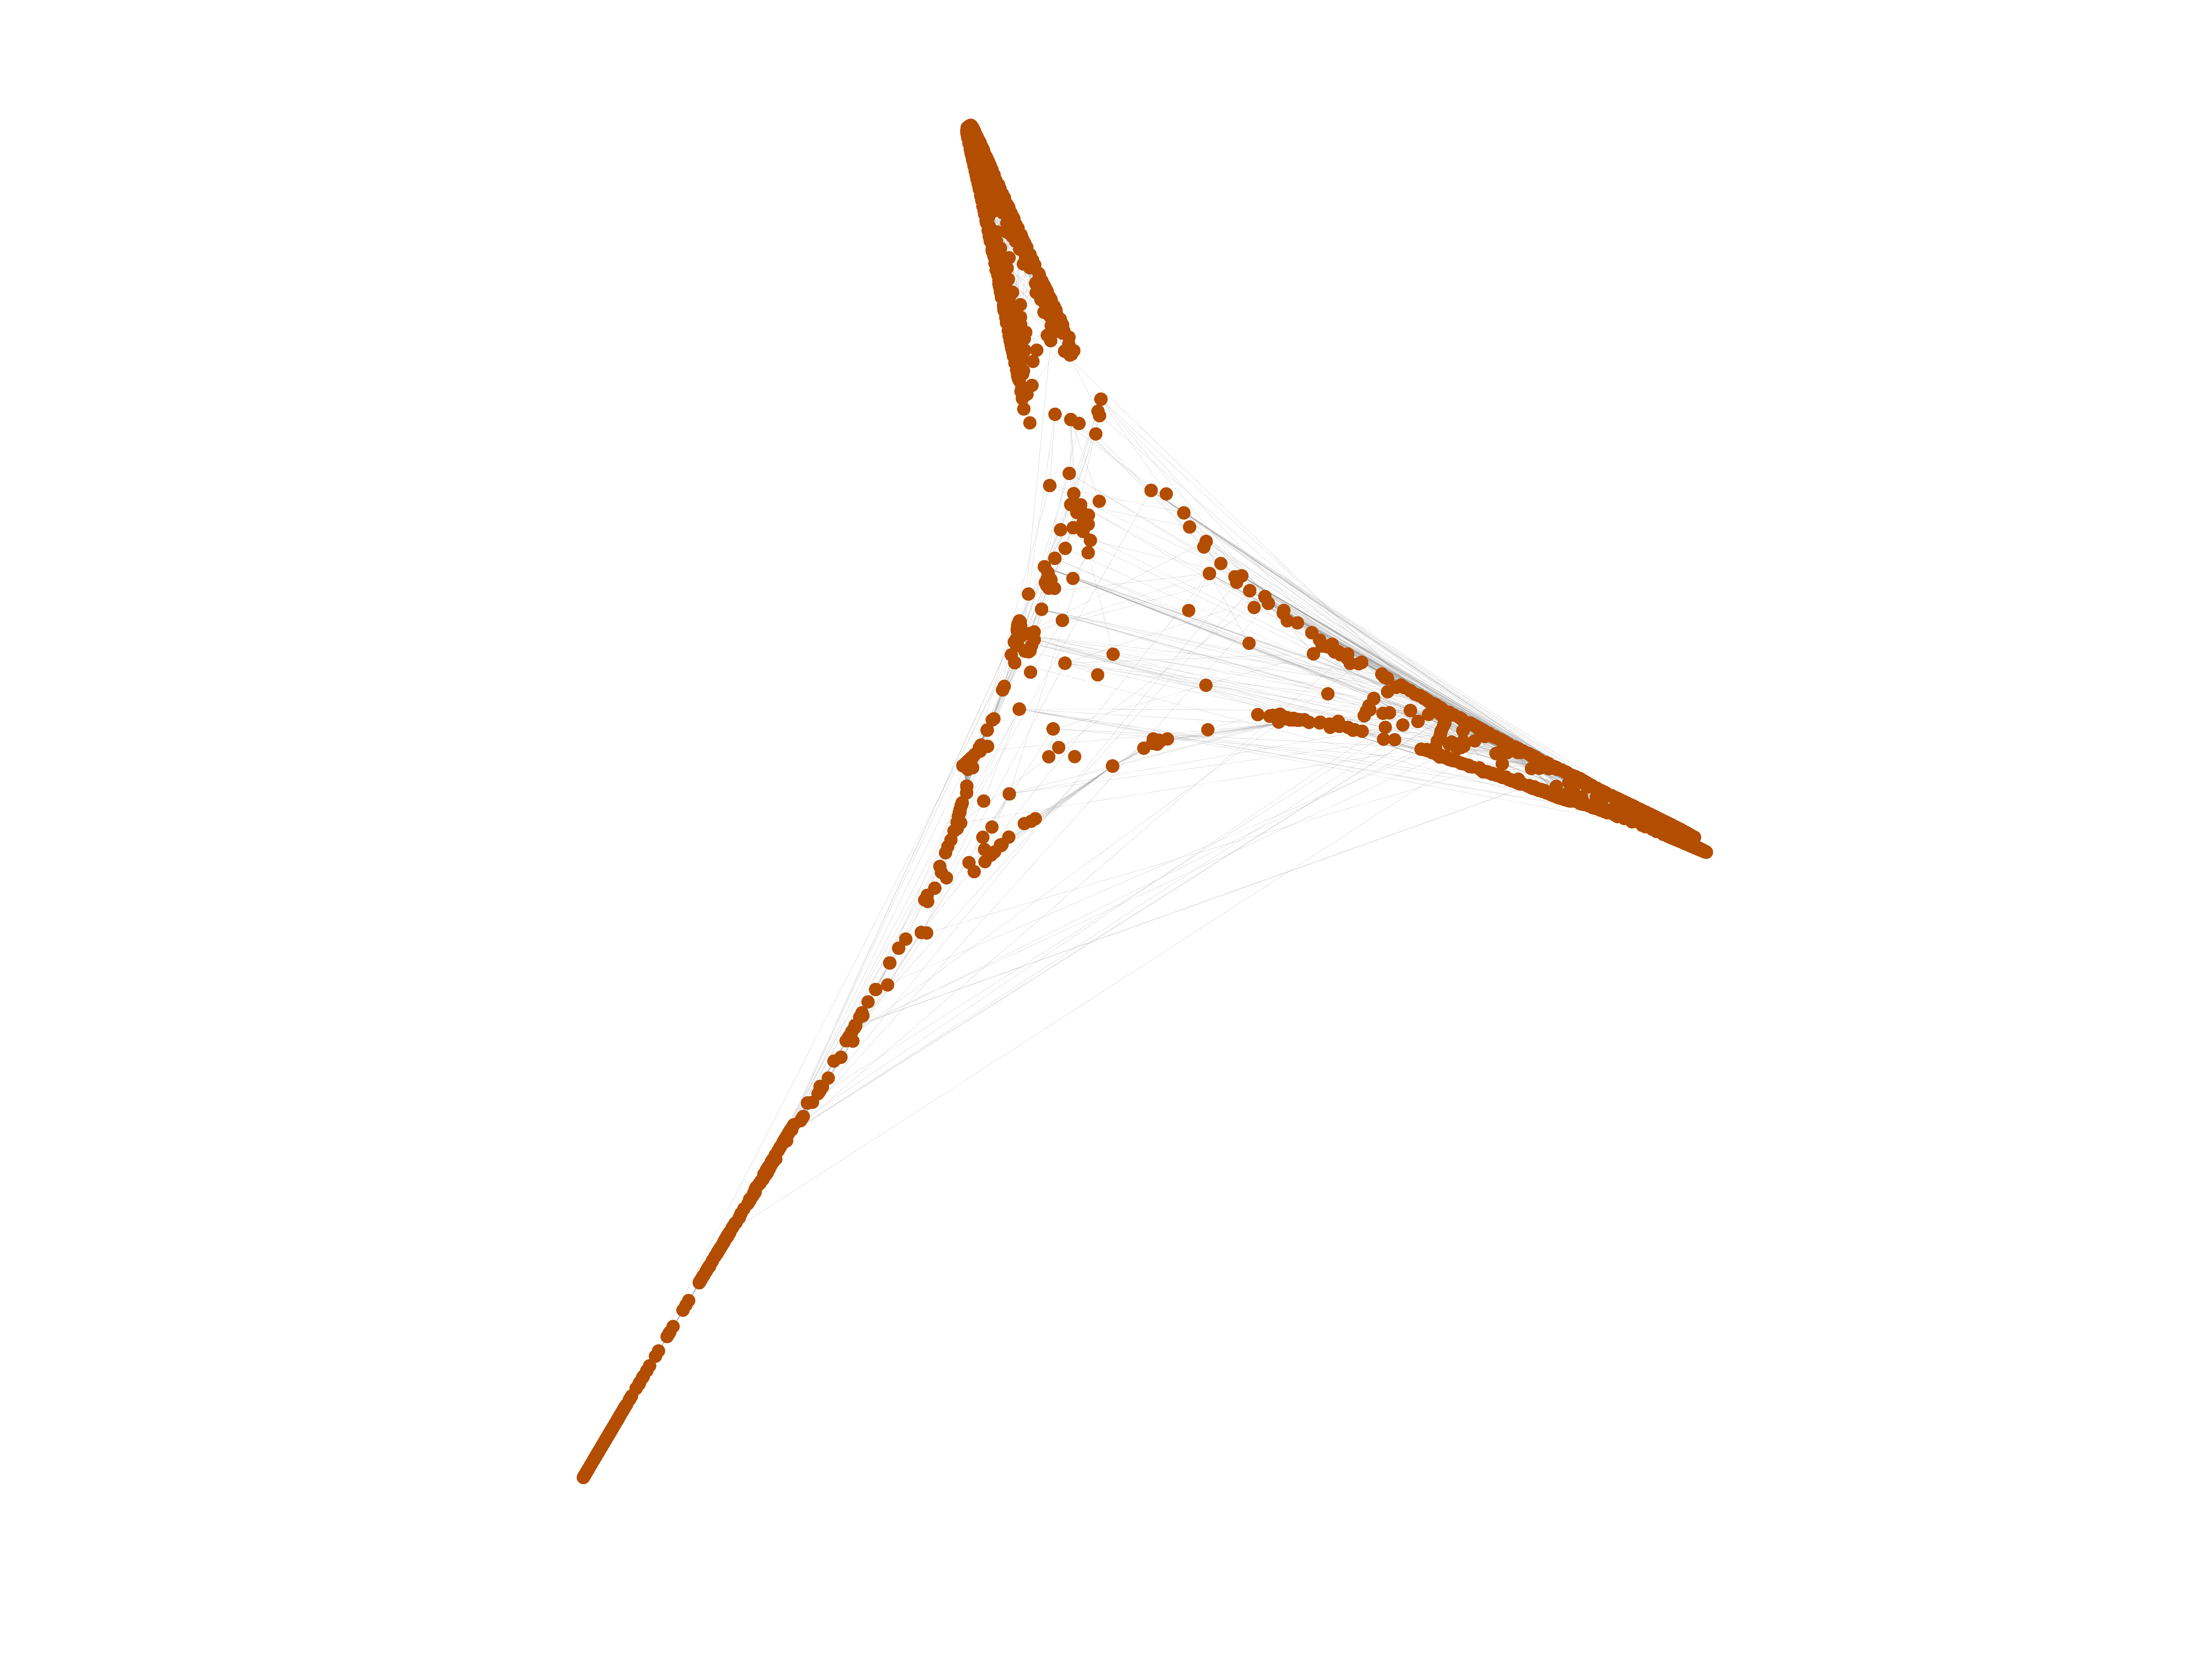
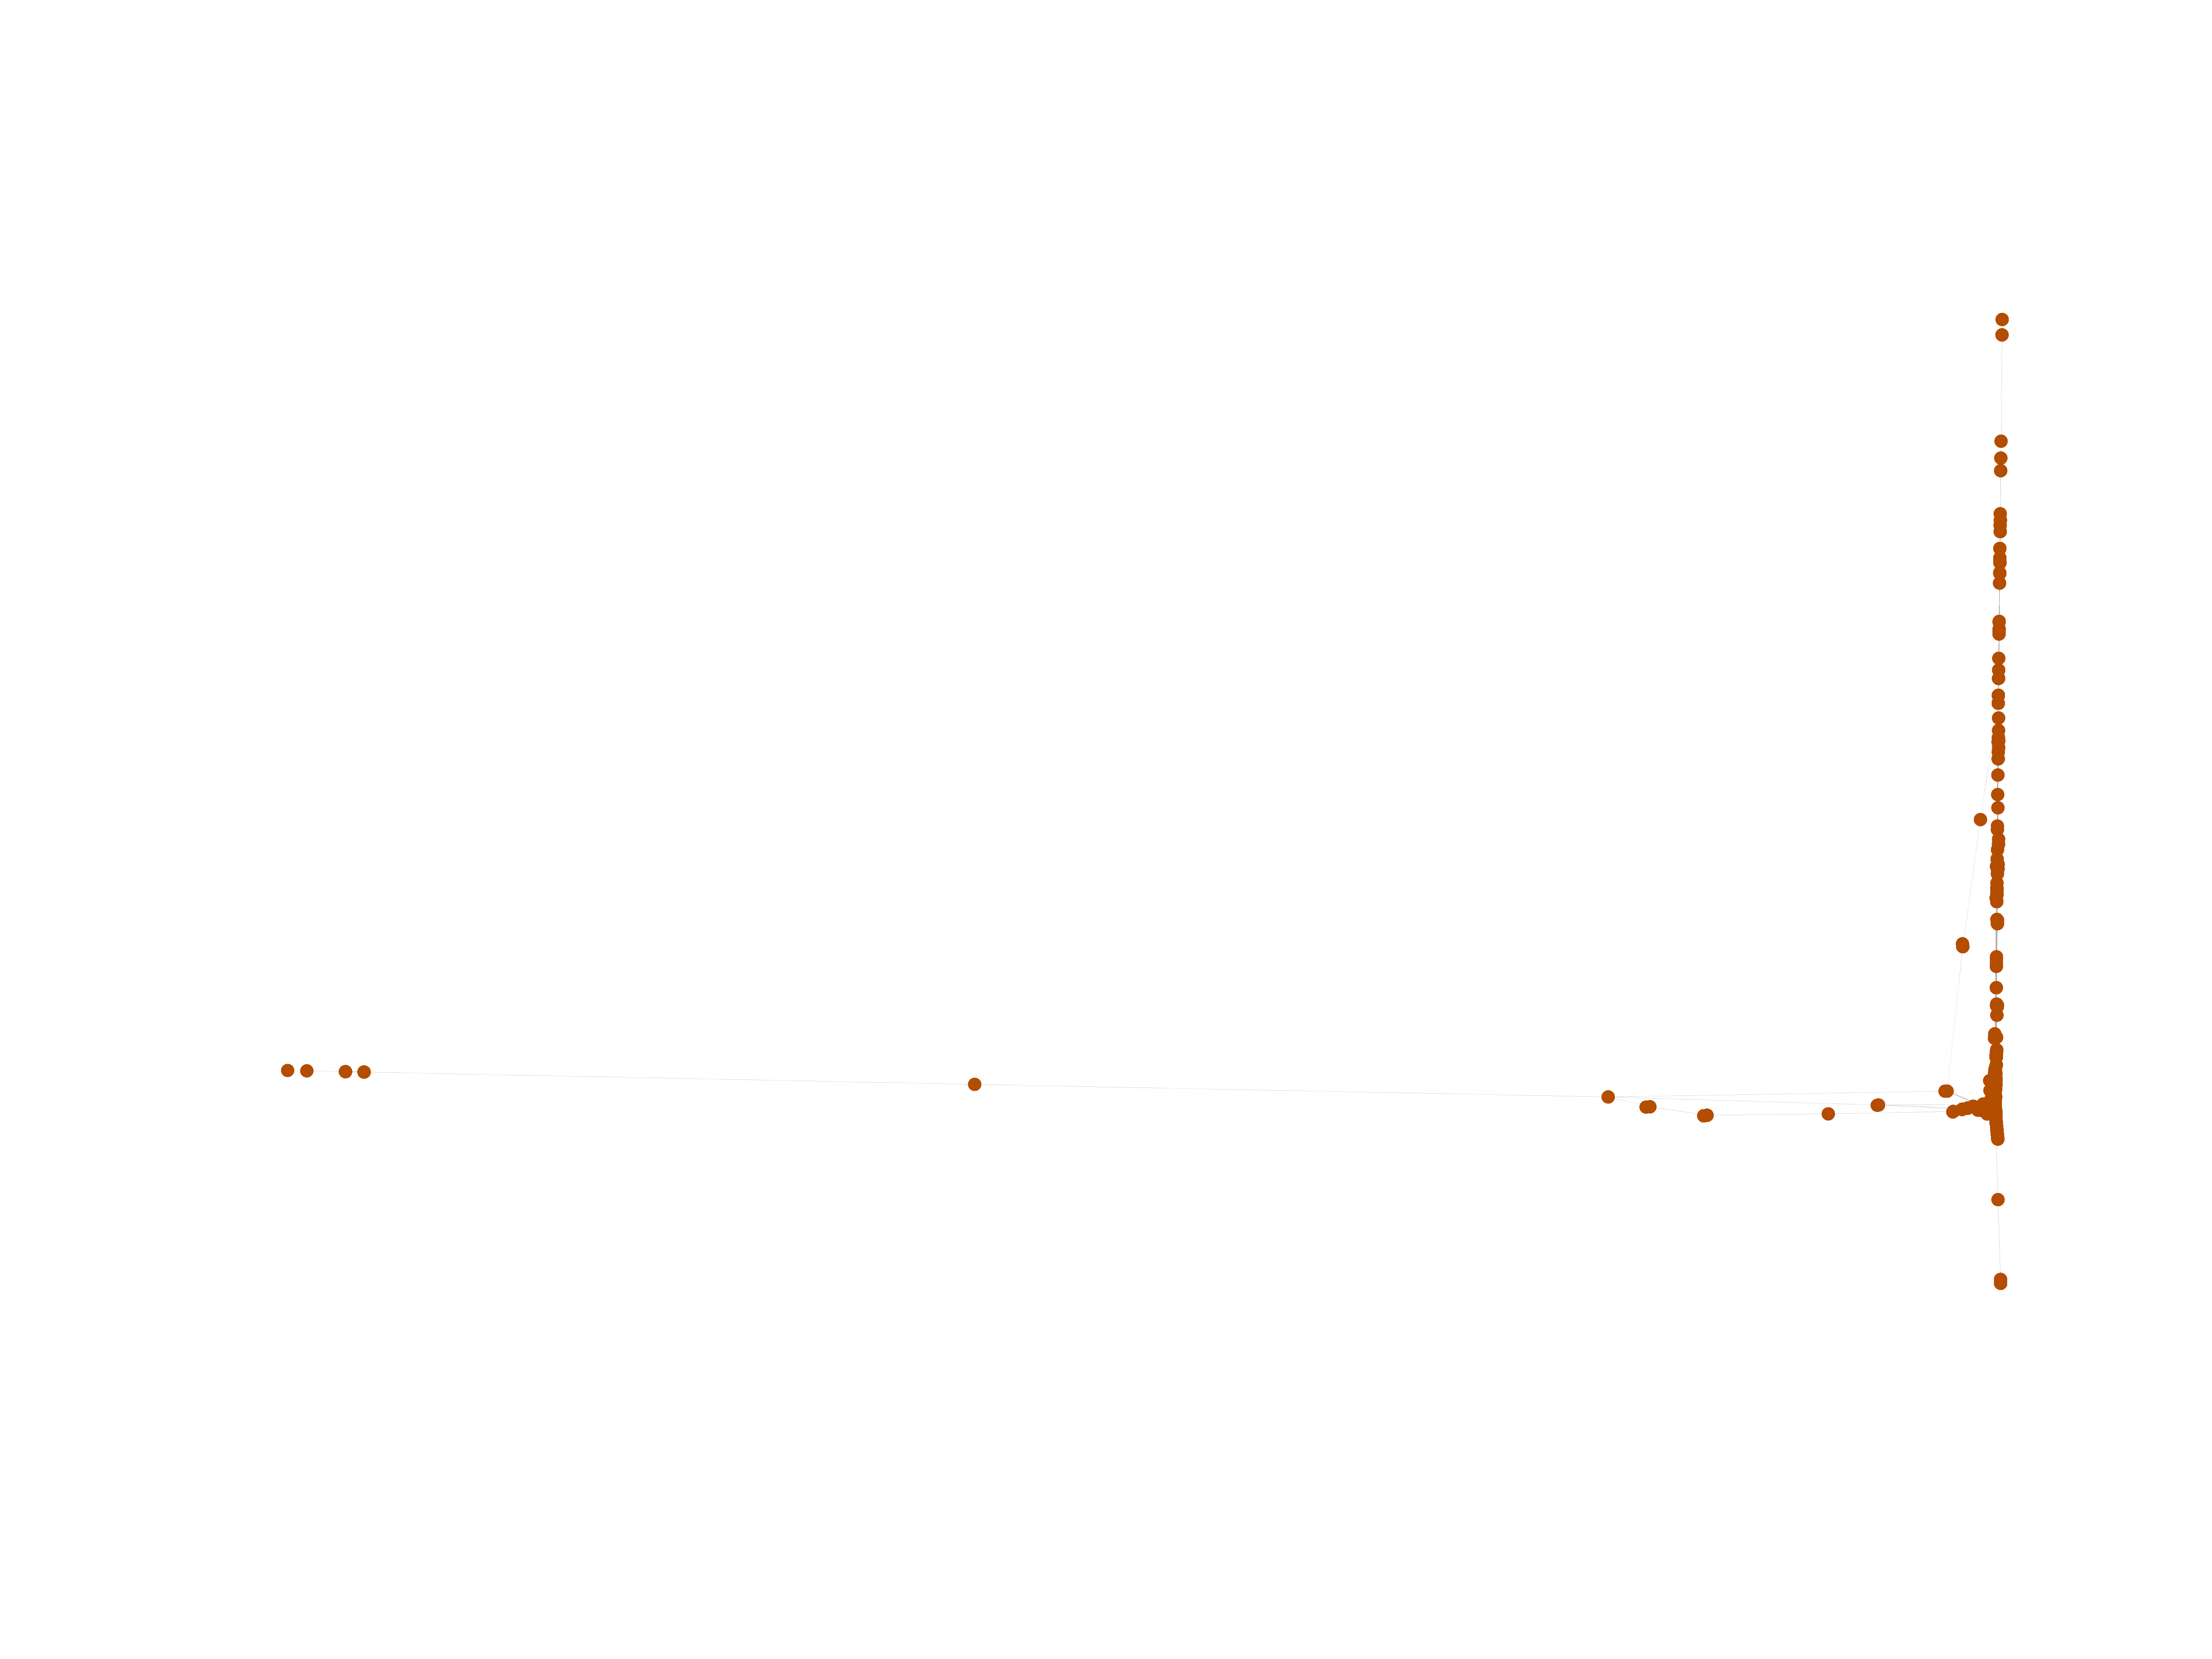
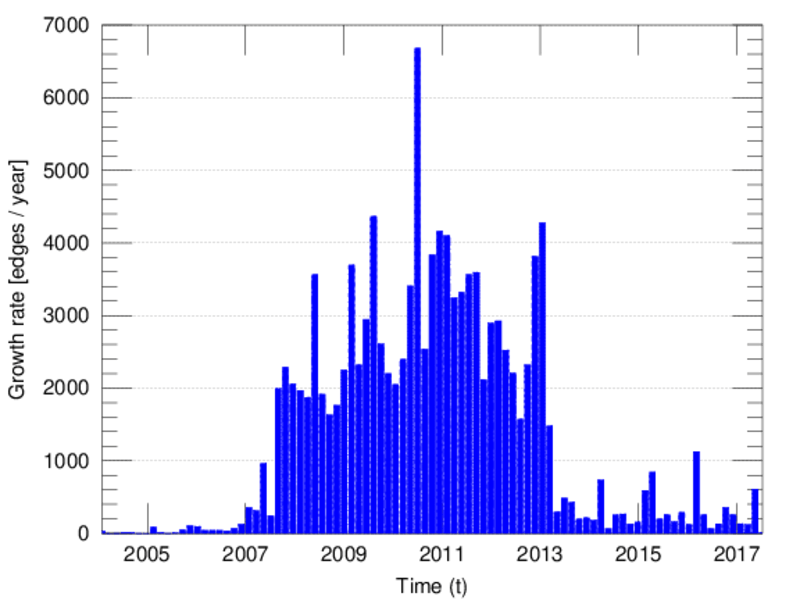
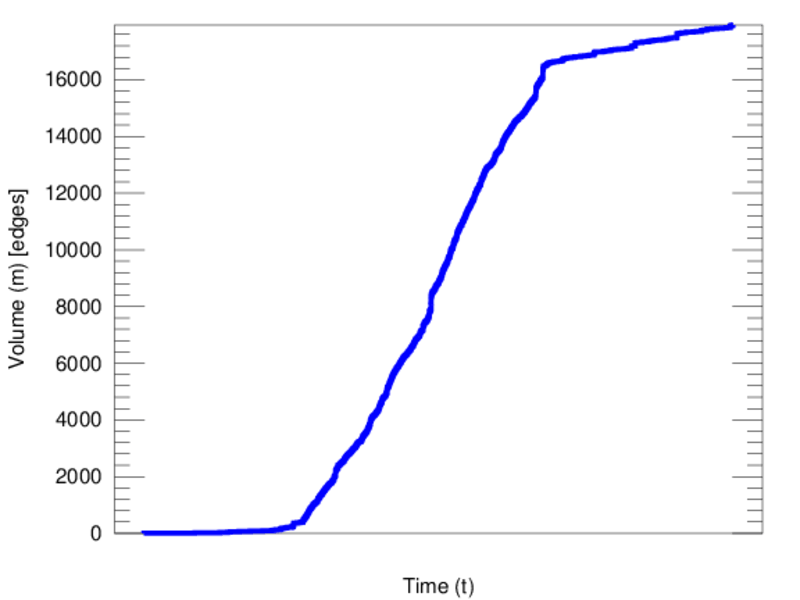
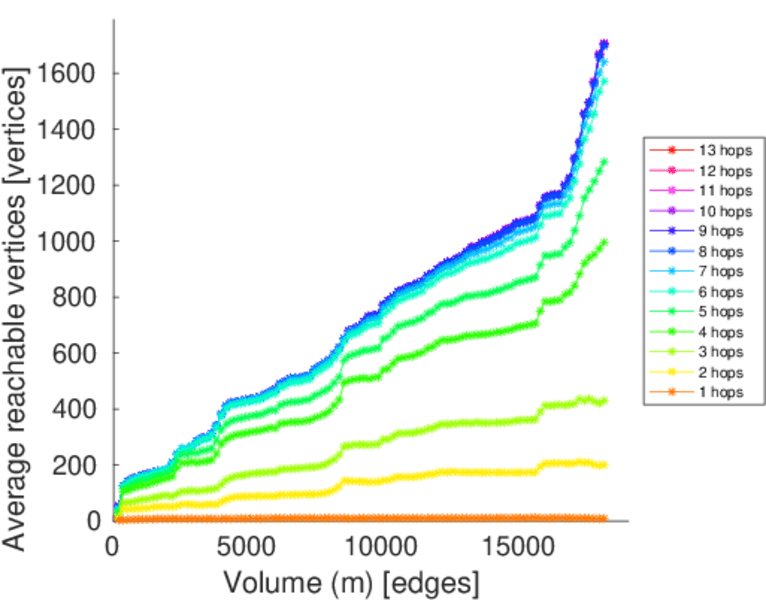
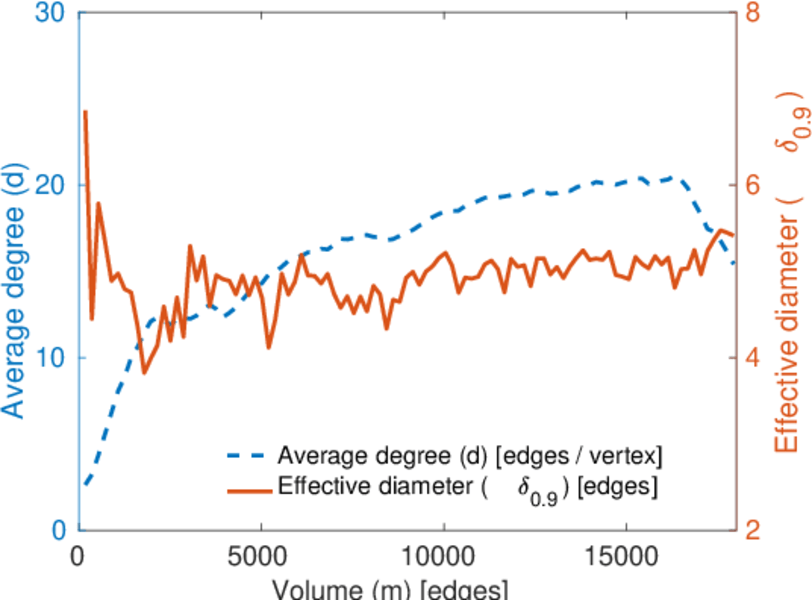
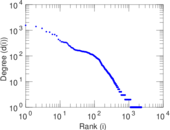
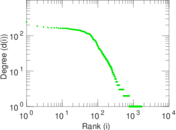
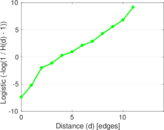
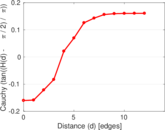
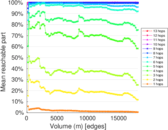
Plots


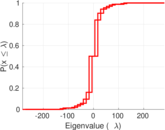
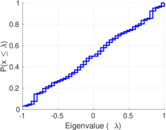


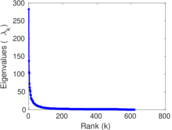
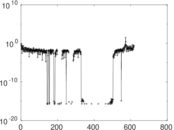
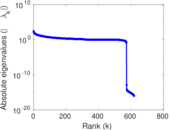
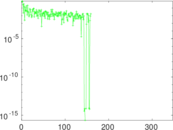
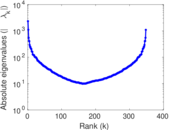
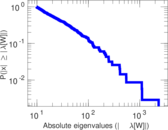
Matrix decompositions plots


Downloads
References
|
[1]
|
Jérôme Kunegis.
KONECT – The Koblenz Network Collection.
In Proc. Int. Conf. on World Wide Web Companion, pages
1343–1350, 2013.
[ http ]
|
|
[2]
|
Wikimedia Foundation.
Wikimedia downloads.
http://dumps.wikimedia.org/, January 2010.
|
 KONECT ‣ Networks ‣
Buy Me a Coffee
KONECT ‣ Networks ‣
Buy Me a Coffee