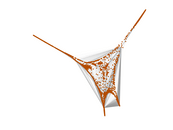
Wikinews edits (el)
This is the bipartite edit network of the Greek Wikinews. It contains users and
pages from the Greek Wikinews, connected by edit events. Each edge represents
an edit. The dataset includes the timestamp of each edit.
Metadata
Statistics
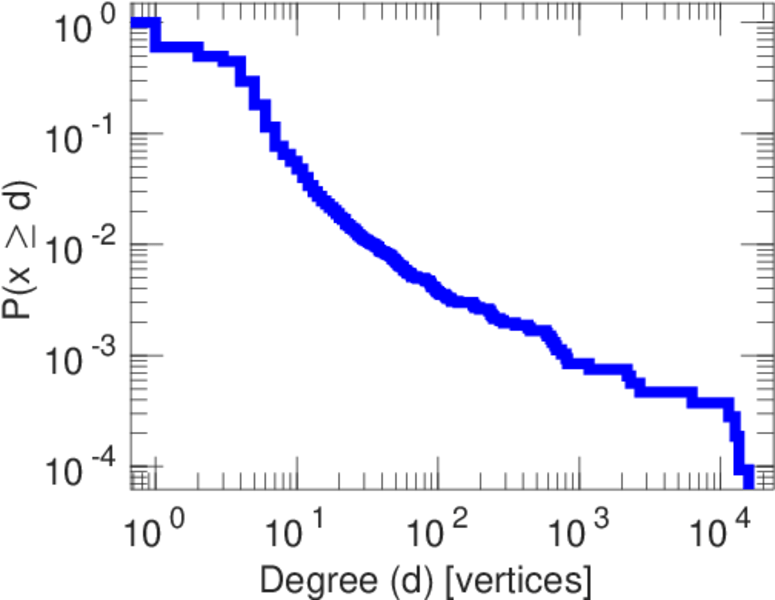
| Size | n = | 10,982
|
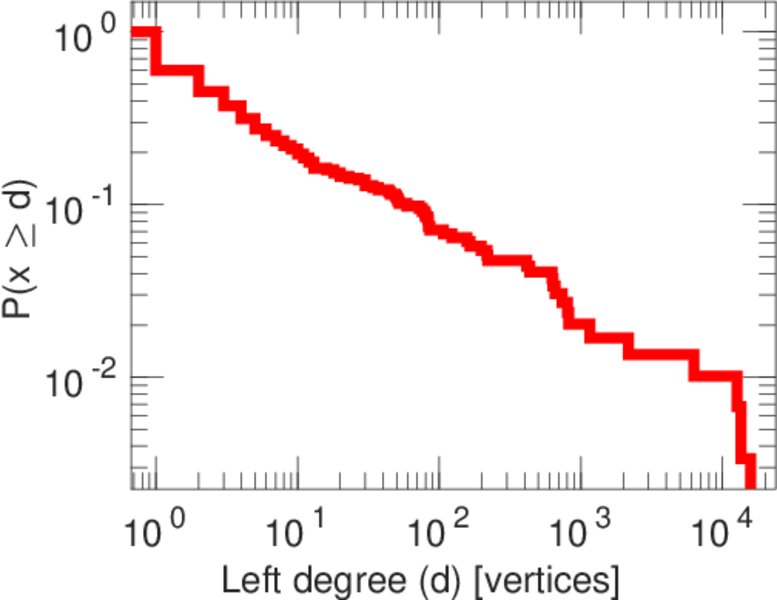
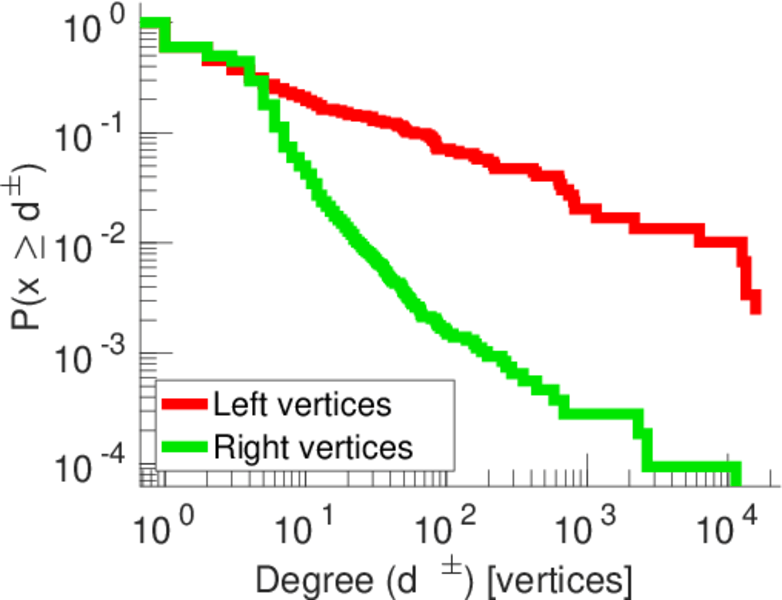
| Left size | n1 = | 295
|
| Right size | n2 = | 10,687
|
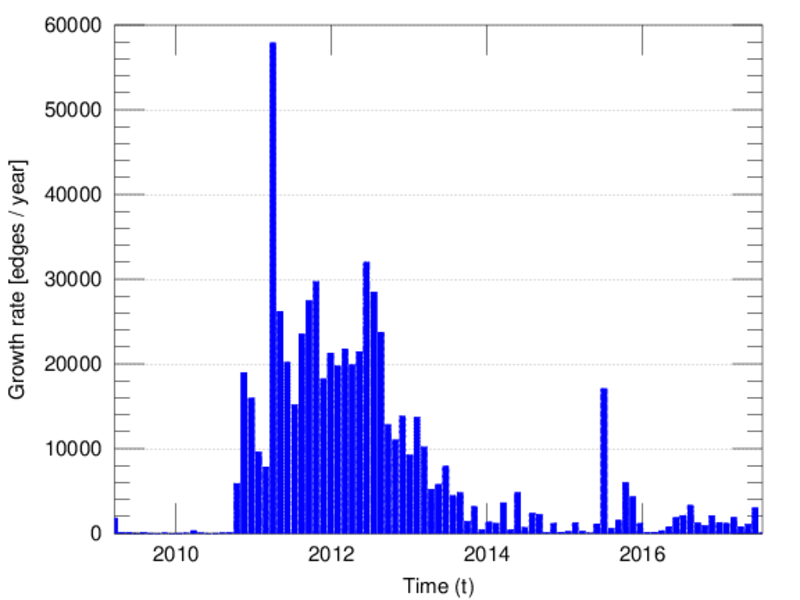
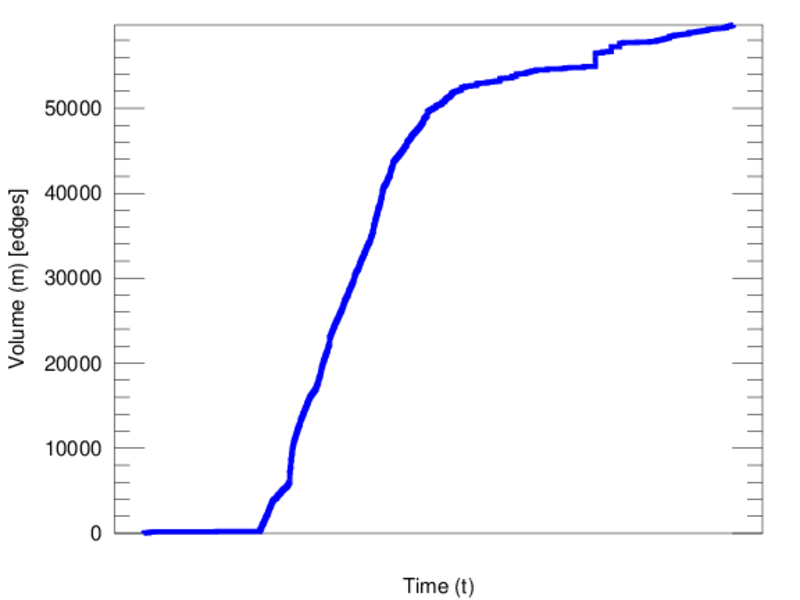
| Volume | m = | 59,782
|
| Unique edge count | m̿ = | 20,435
|
| Wedge count | s = | 28,412,048
|
| Claw count | z = | 38,734,512,883
|
| Cross count | x = | 44,016,268,187,142
|
| Square count | q = | 6,013,337
|
| 4-Tour count | T4 = | 161,837,910
|
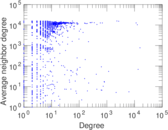
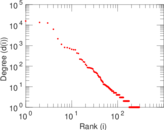
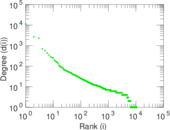
| Maximum degree | dmax = | 15,753
|
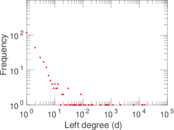
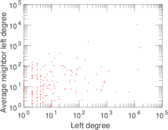
| Maximum left degree | d1max = | 15,753
|
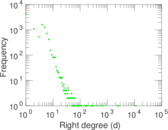
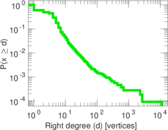
| Maximum right degree | d2max = | 11,408
|
| Average degree | d = | 10.887 3
|
| Average left degree | d1 = | 202.651
|
| Average right degree | d2 = | 5.593 90
|
| Fill | p = | 0.006 481 82
|
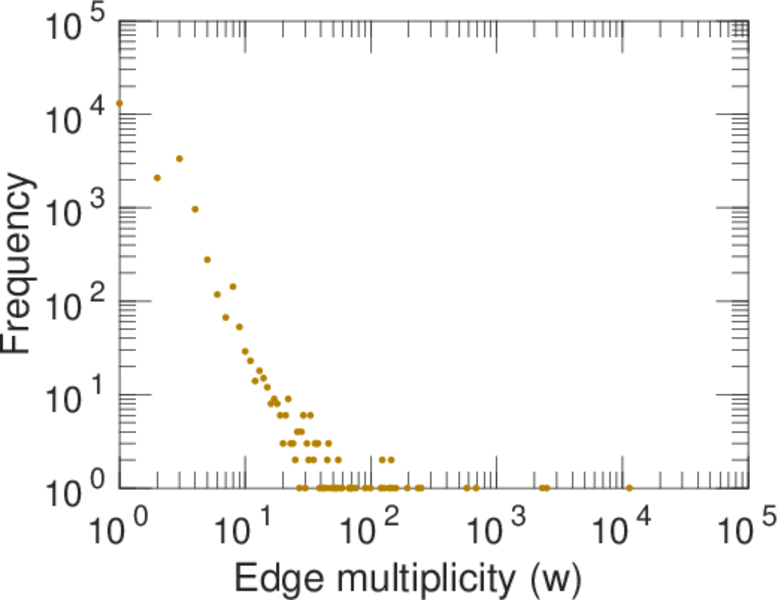
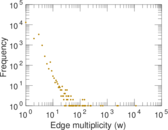
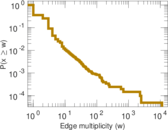
| Average edge multiplicity | m̃ = | 2.925 47
|
| Size of LCC | N = | 10,773
|
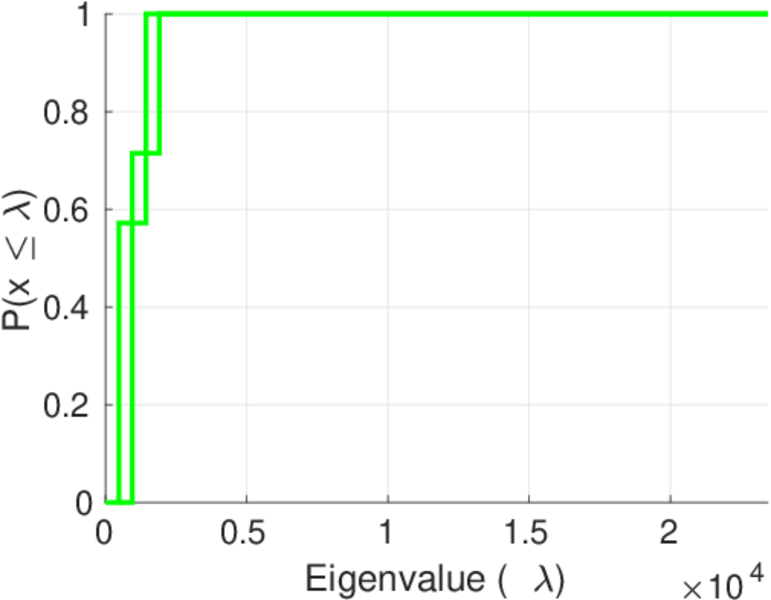
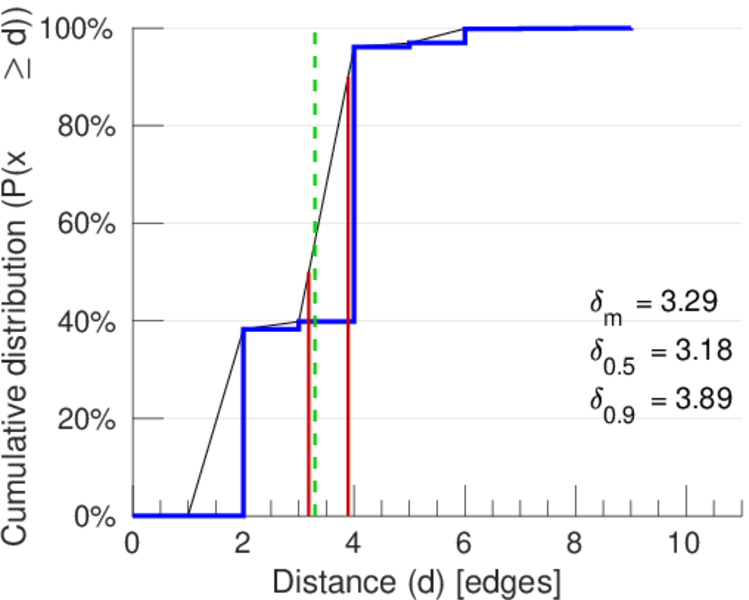
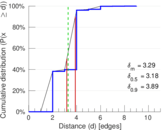
| Diameter | δ = | 12
|
| 50-Percentile effective diameter | δ0.5 = | 3.180 81
|
| 90-Percentile effective diameter | δ0.9 = | 3.891 25
|
| Median distance | δM = | 4
|
| Mean distance | δm = | 3.290 89
|
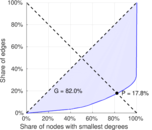
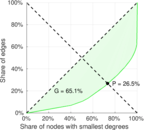
| Gini coefficient | G = | 0.823 617
|
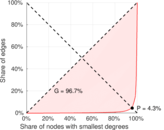
| Balanced inequality ratio | P = | 0.173 514
|
| Left balanced inequality ratio | P1 = | 0.042 638 3
|
| Right balanced inequality ratio | P2 = | 0.265 498
|
| Relative edge distribution entropy | Her = | 0.704 607
|
| Power law exponent | γ = | 2.935 37
|
| Tail power law exponent | γt = | 3.101 00
|
| Tail power law exponent with p | γ3 = | 3.101 00
|
| p-value | p = | 0.000 00
|
| Left tail power law exponent with p | γ3,1 = | 1.641 00
|
| Left p-value | p1 = | 0.101 000
|
| Right tail power law exponent with p | γ3,2 = | 5.371 00
|
| Right p-value | p2 = | 0.000 00
|
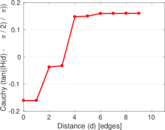
| Degree assortativity | ρ = | −0.331 248
|
| Degree assortativity p-value | pρ = | 0.000 00
|
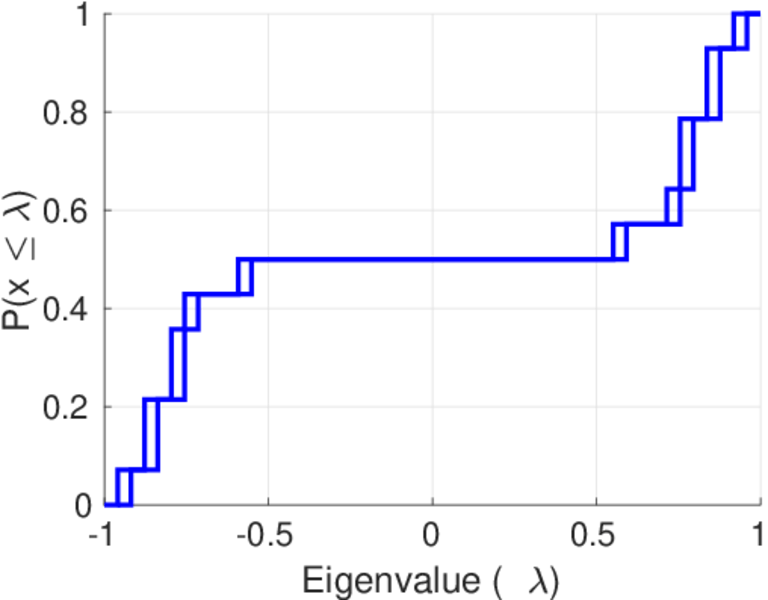
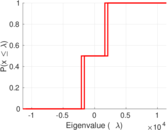
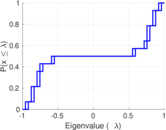
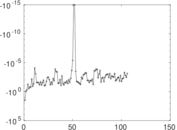
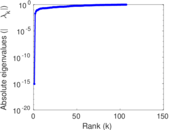
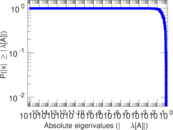
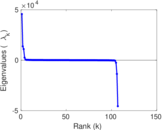
| Spectral norm | α = | 11,415.4
|
| Algebraic connectivity | a = | 0.019 913 5
|
| Spectral separation | |λ1[A] / λ2[A]| = | 3.340 85
|
| Controllability | C = | 10,414
|
| Relative controllability | Cr = | 0.948 970
|
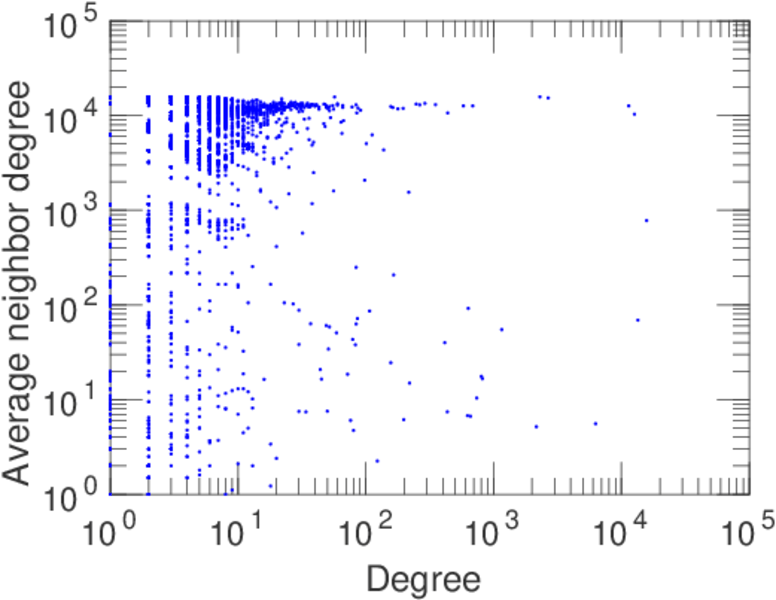
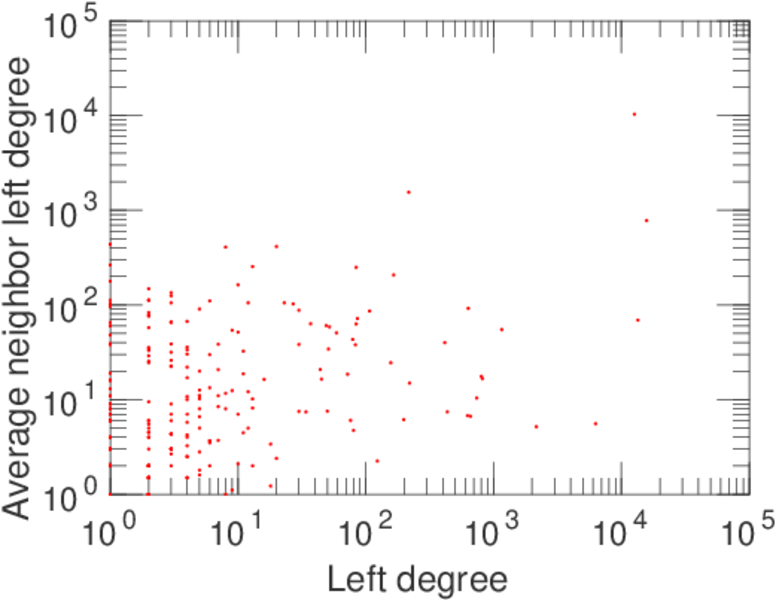
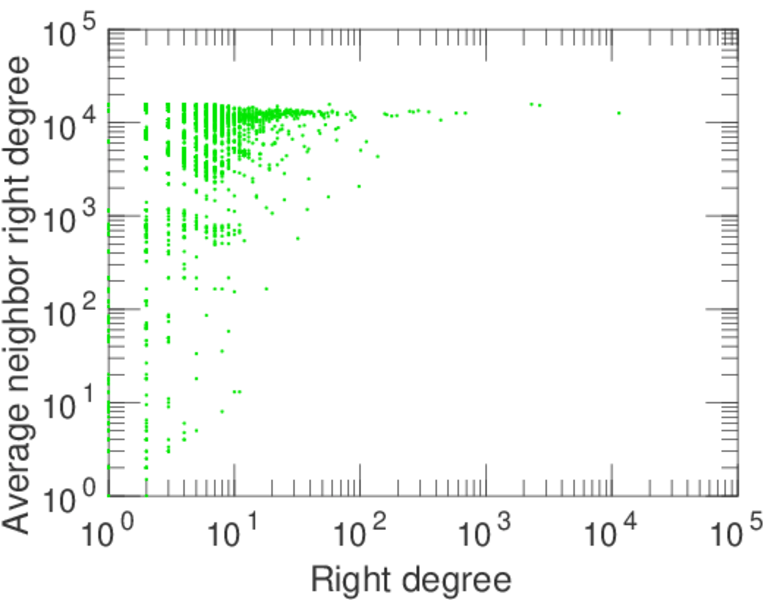
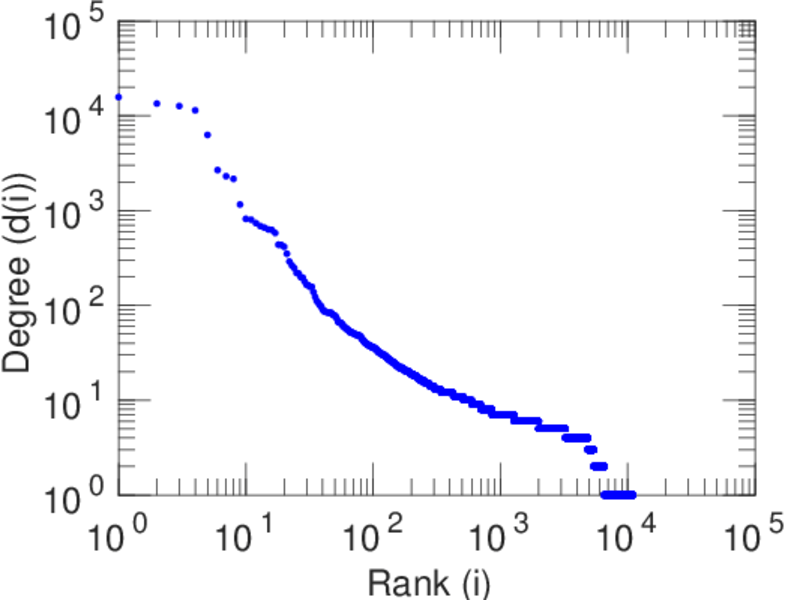
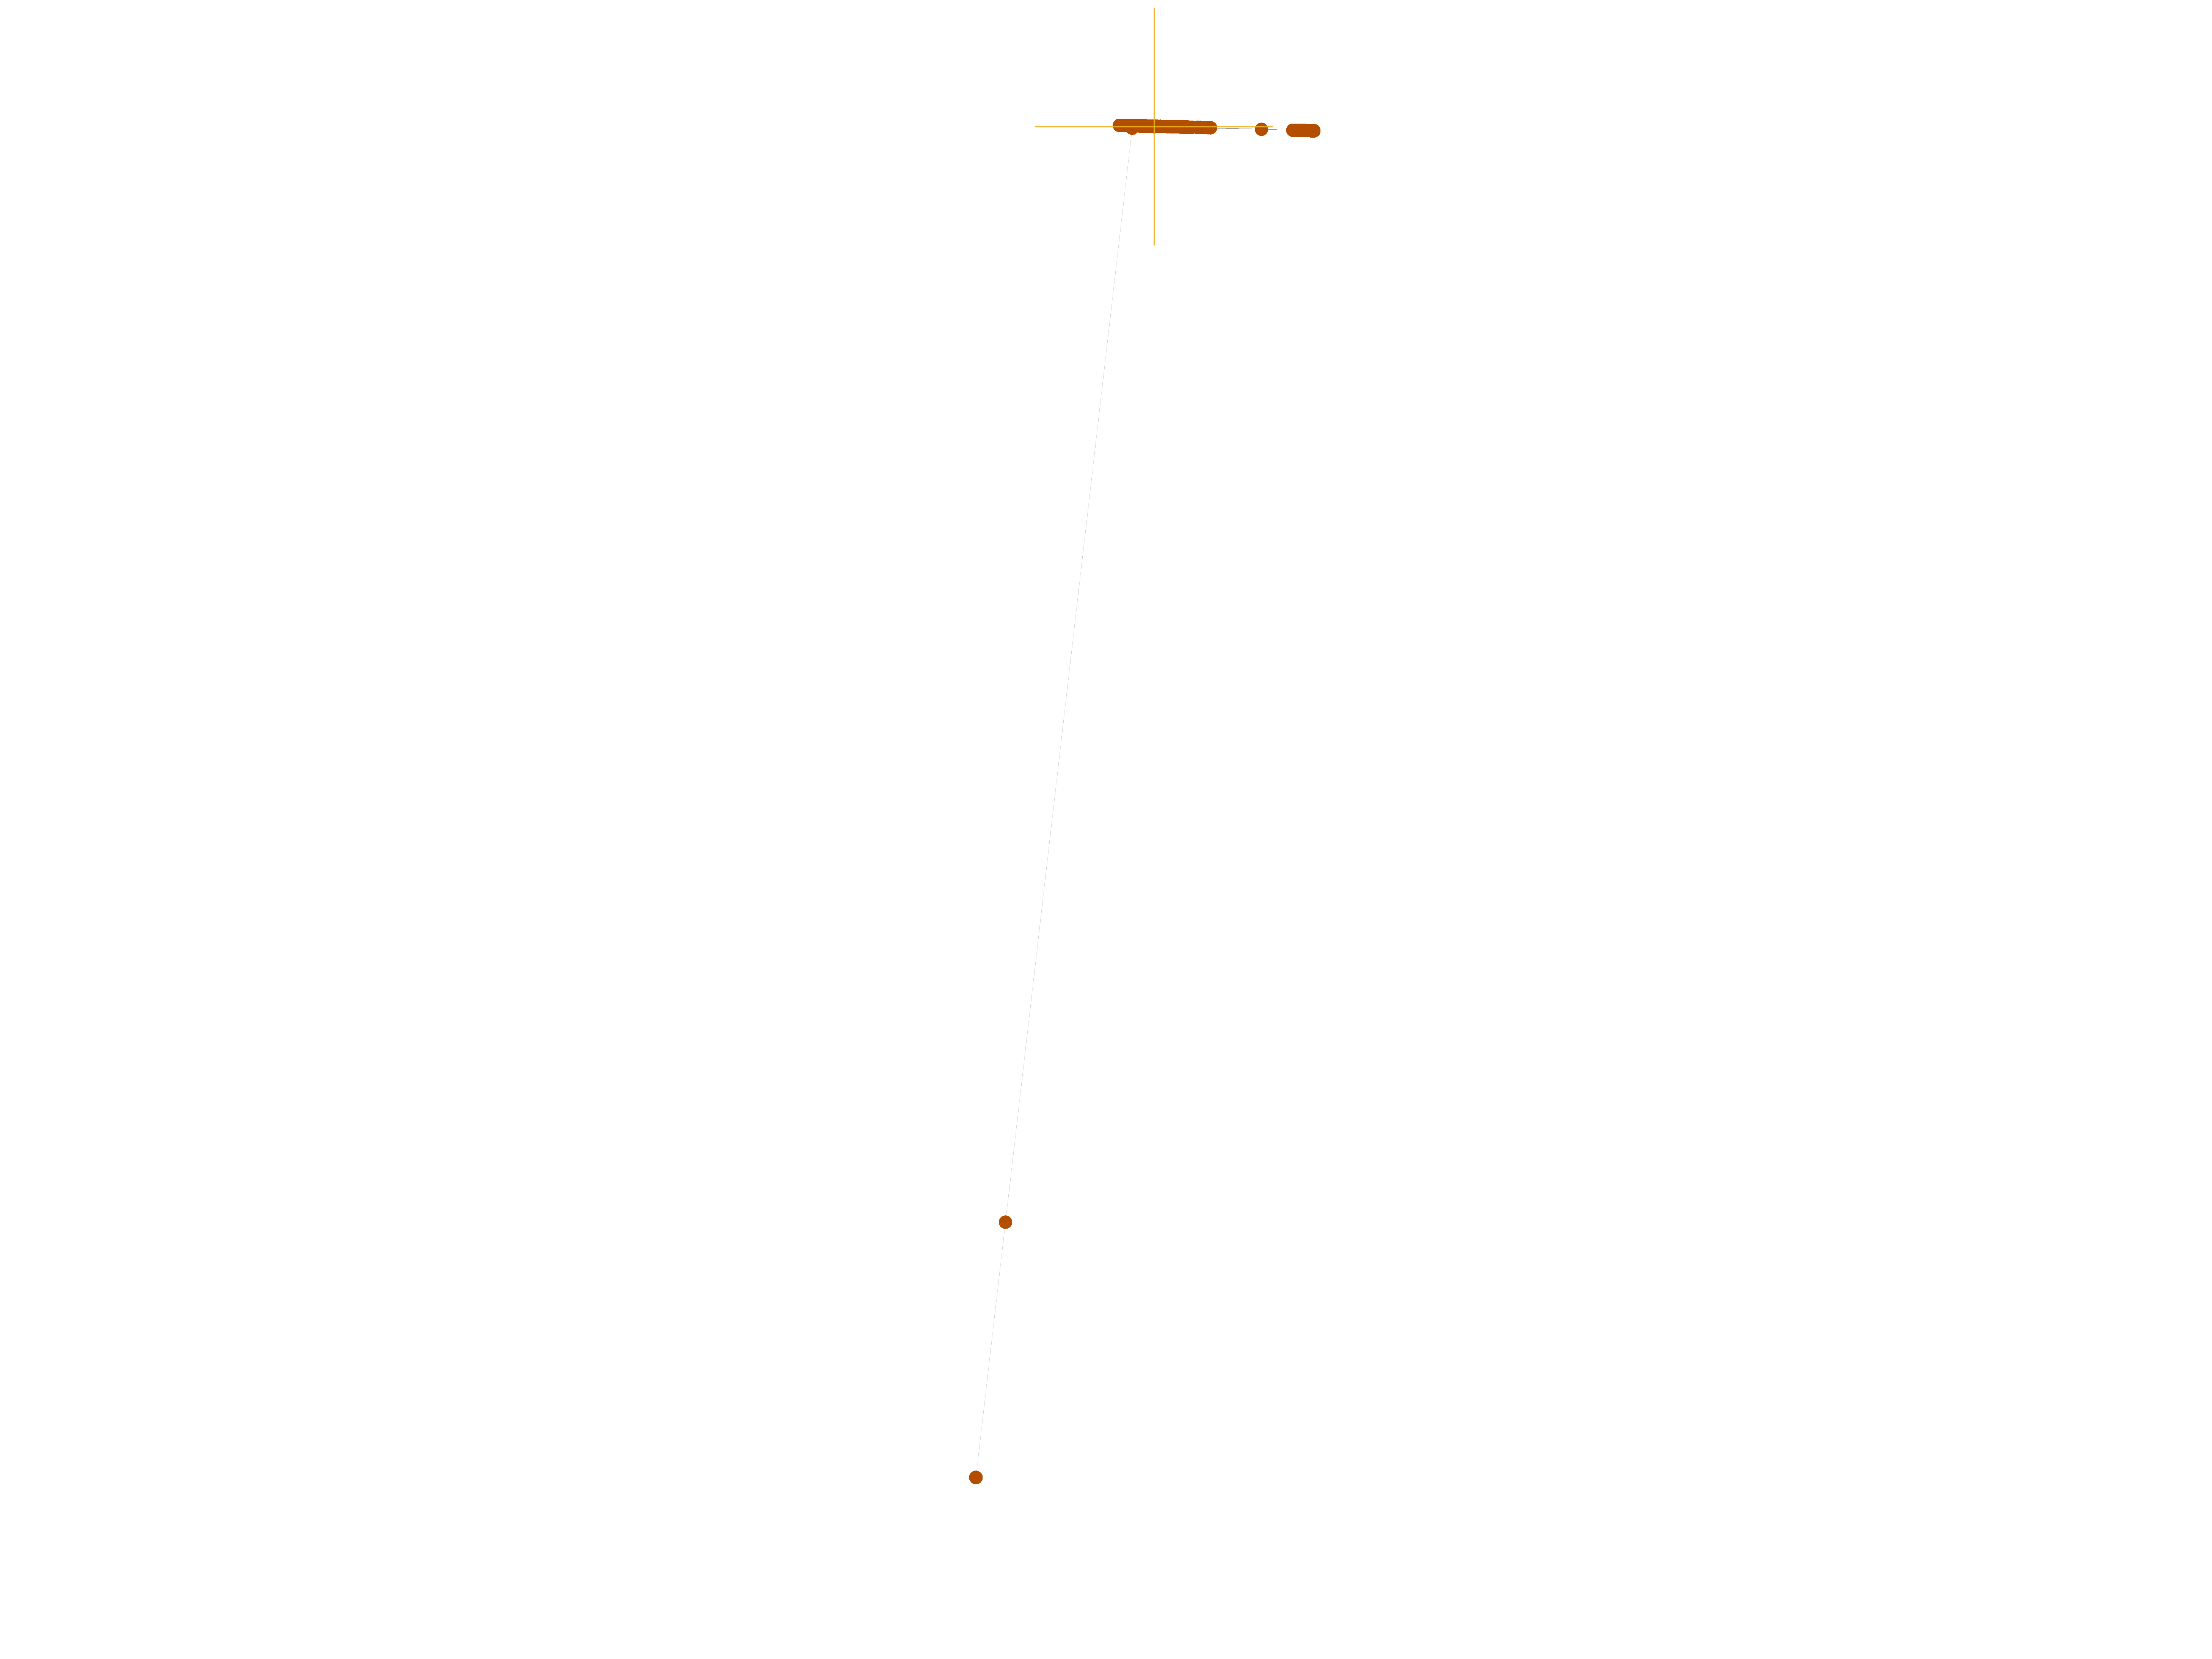
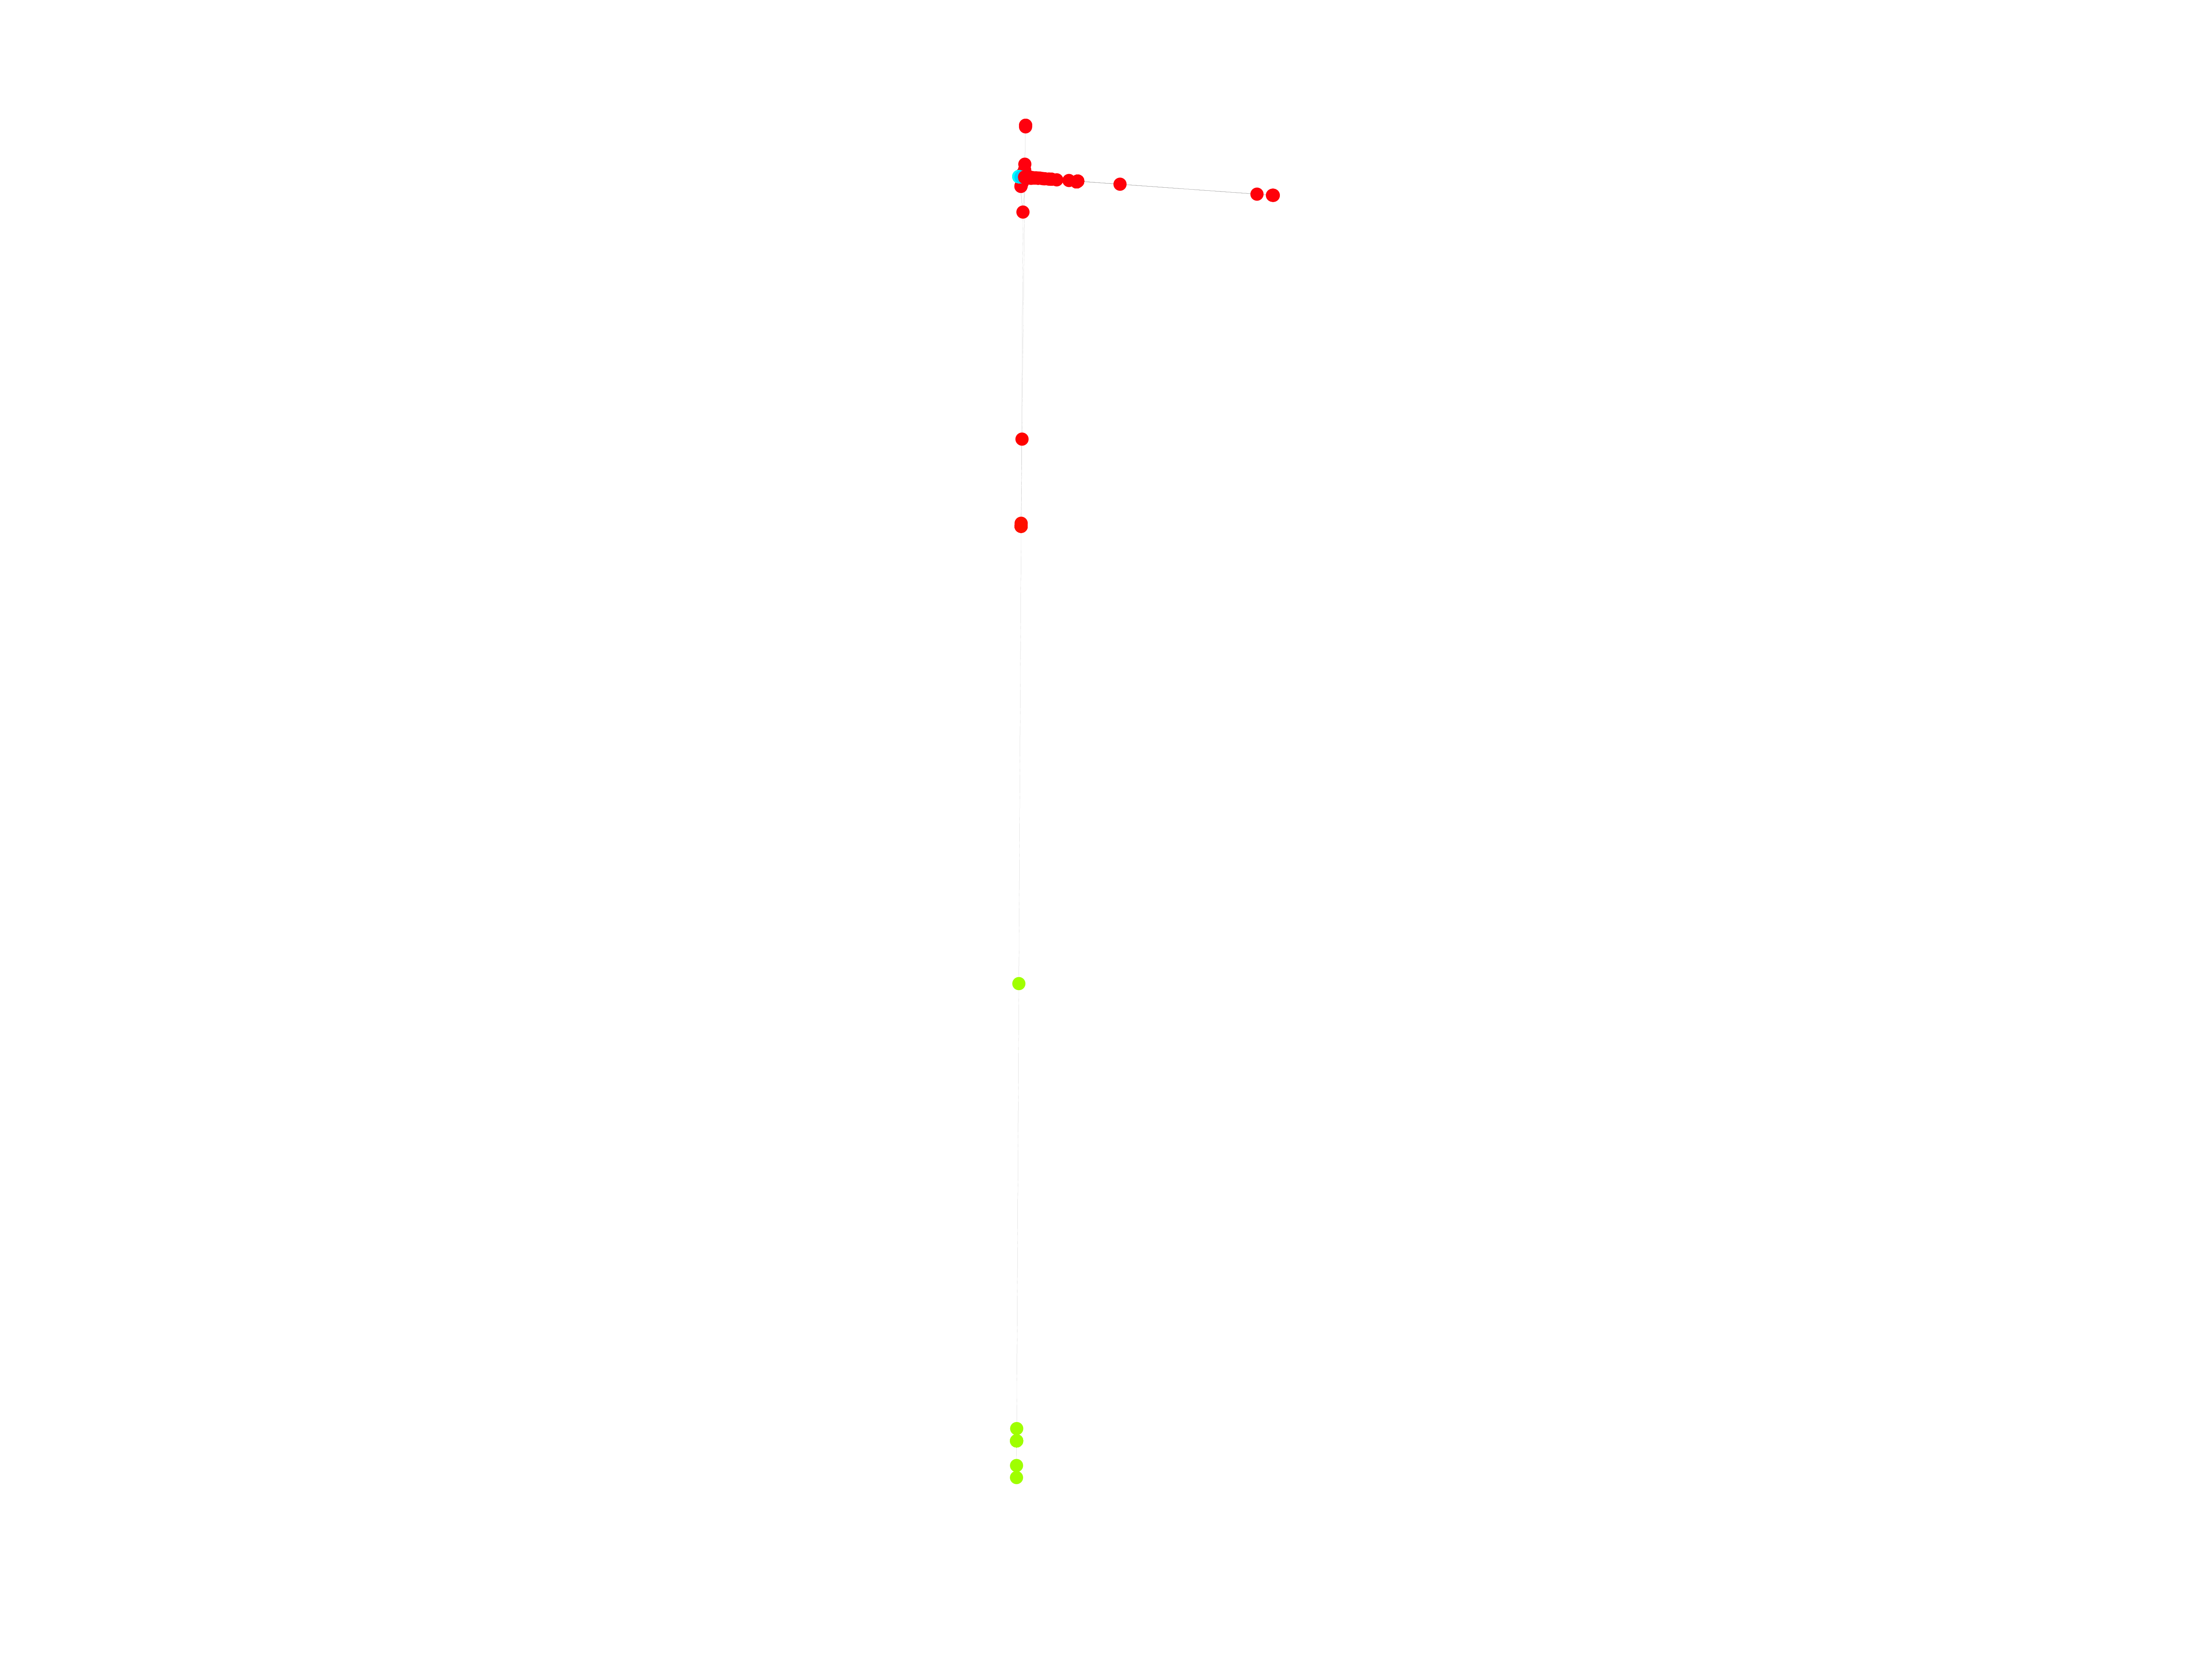
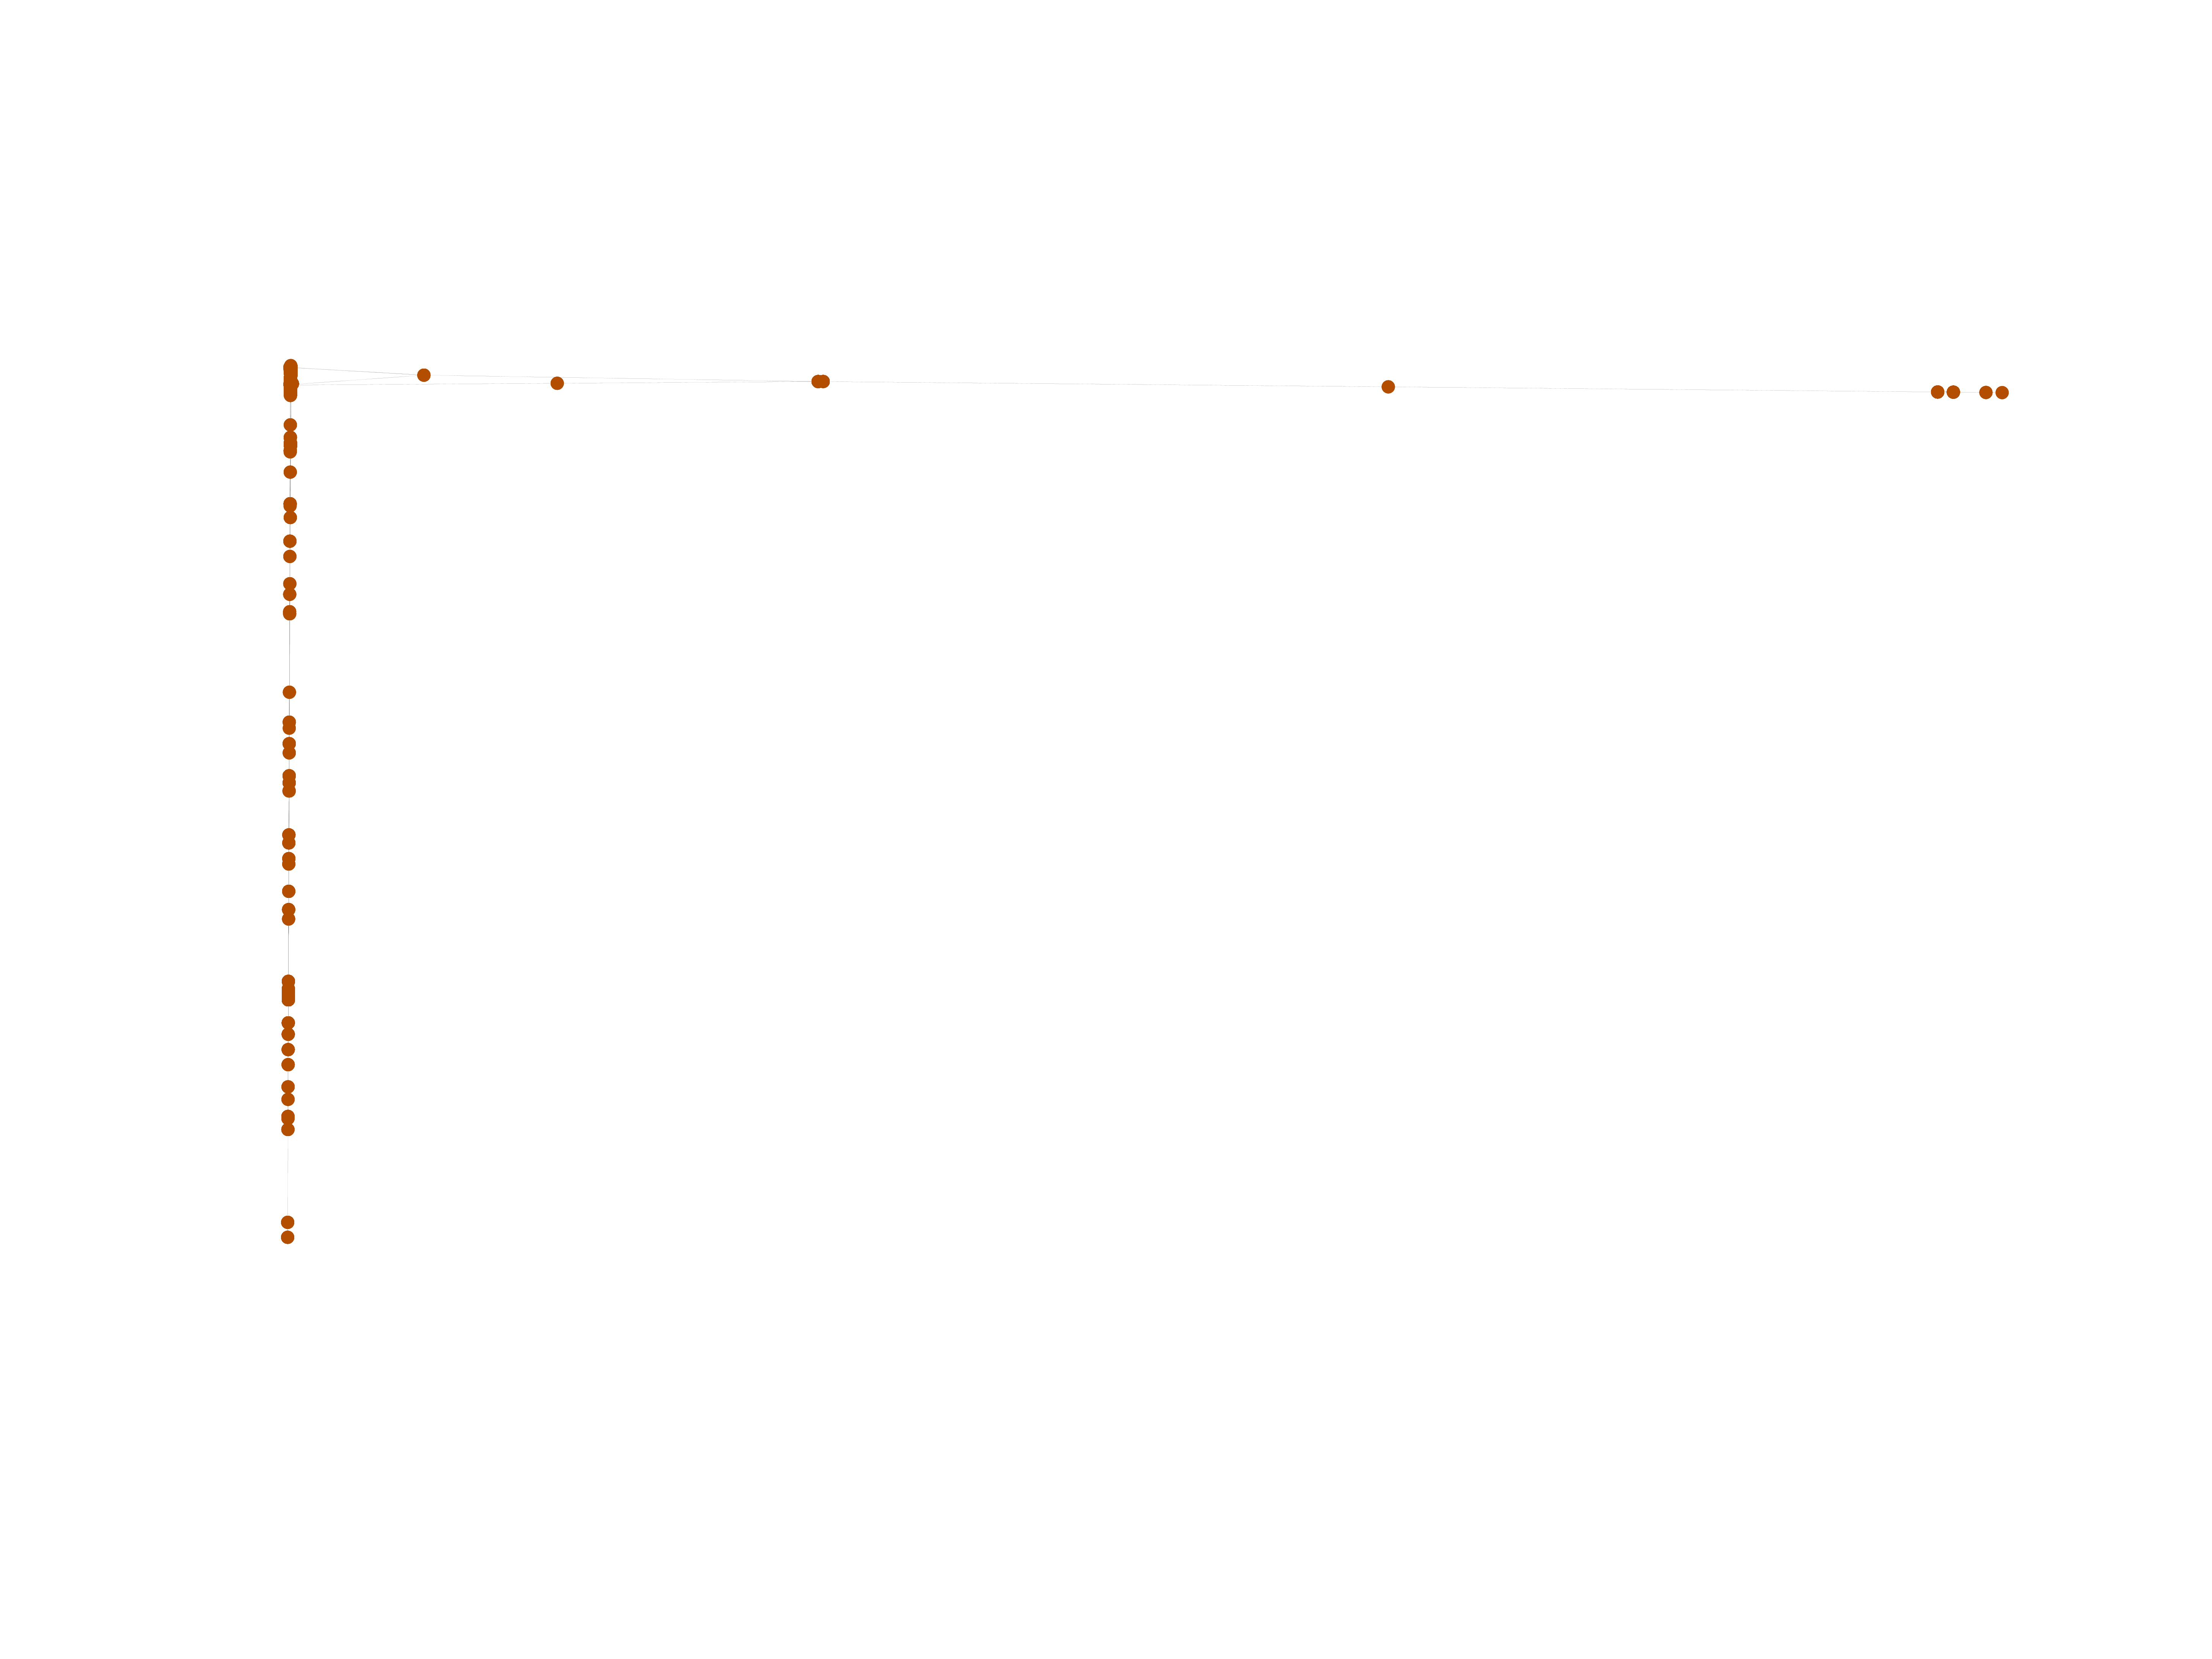
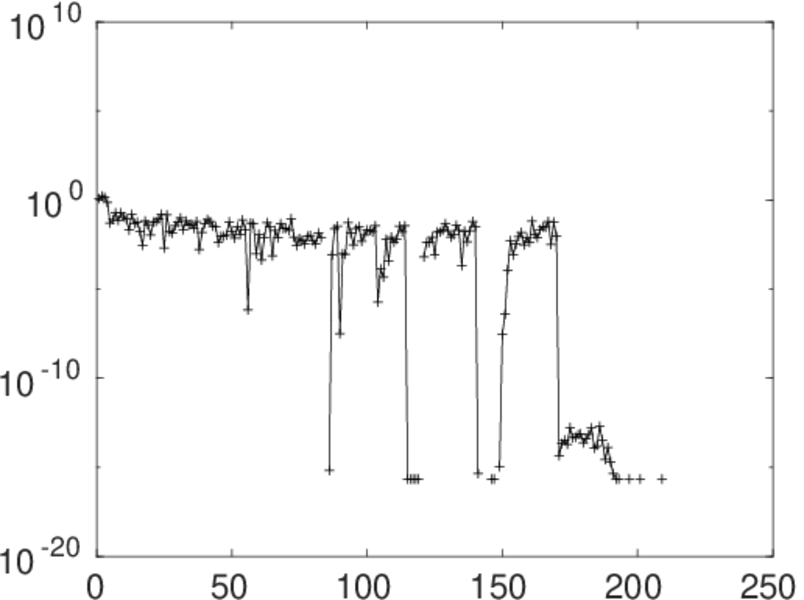
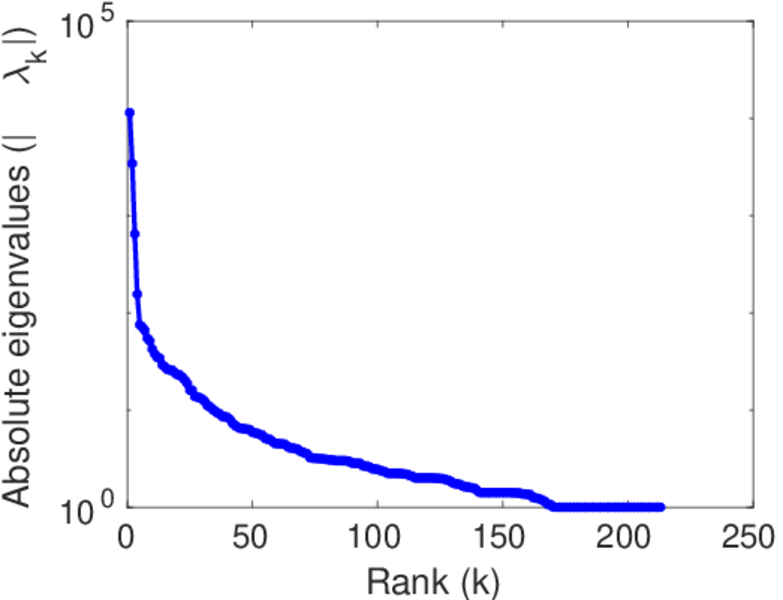
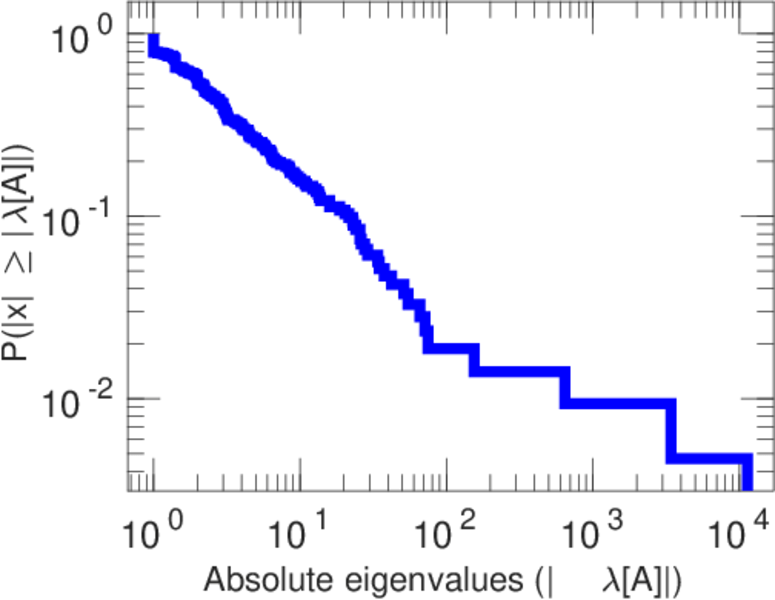
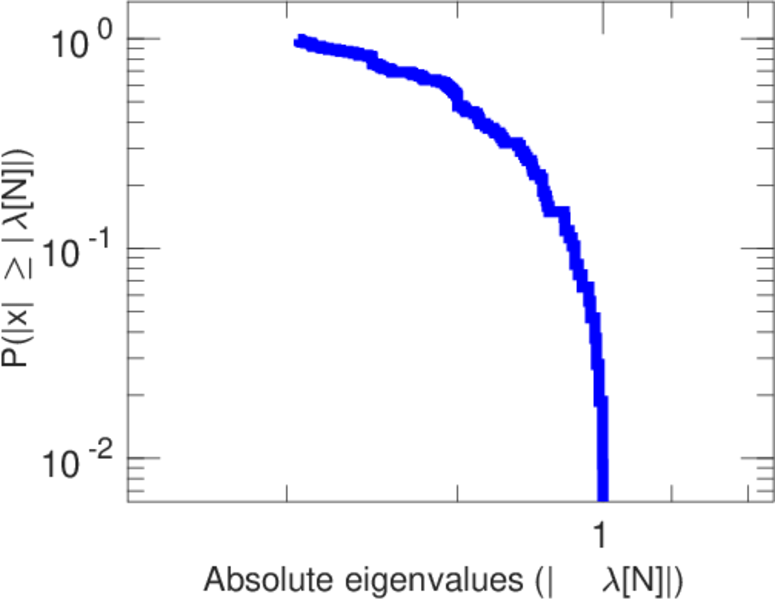
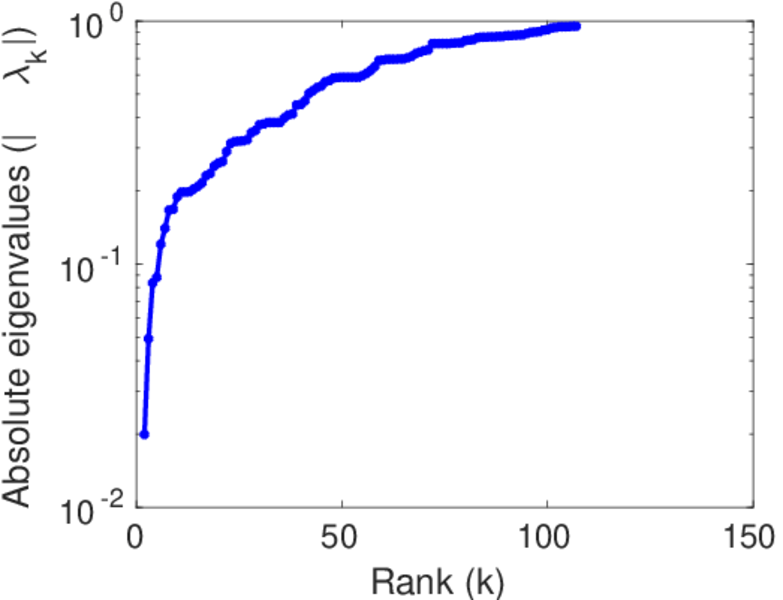
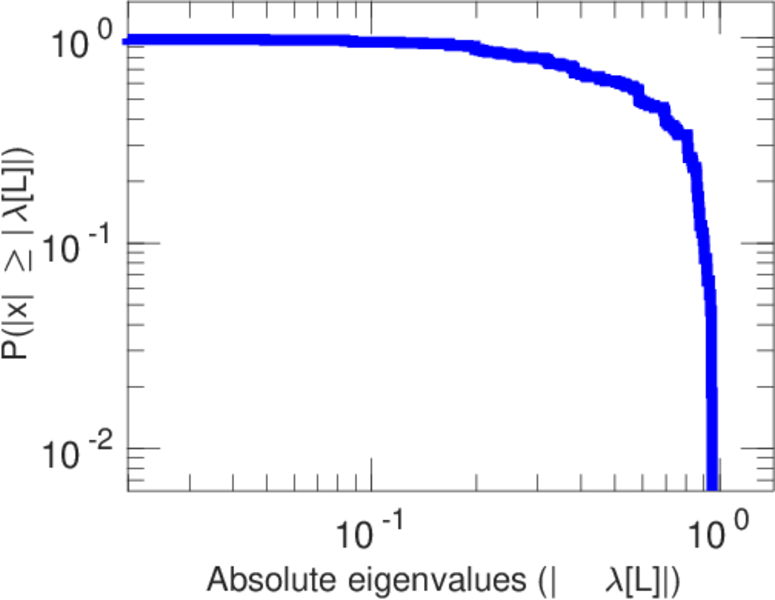
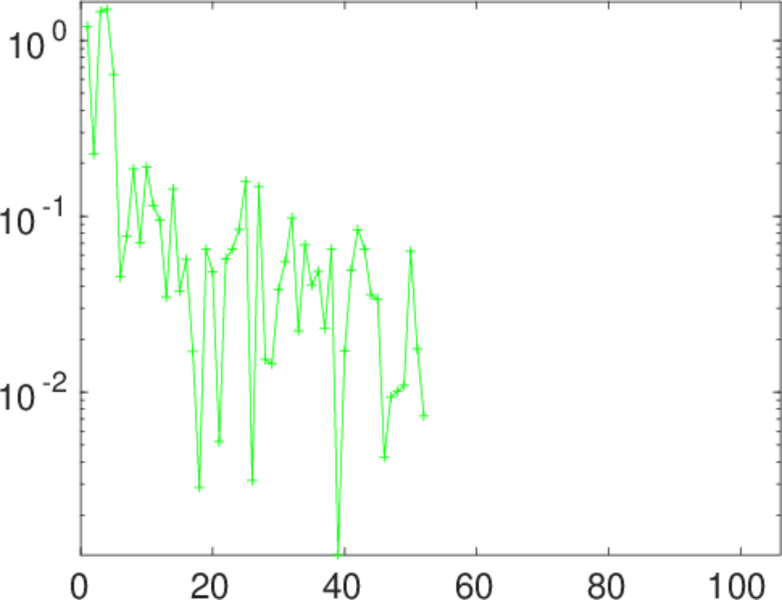
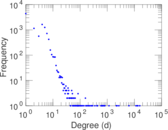
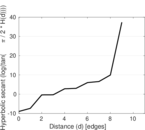
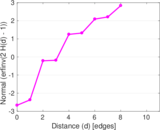
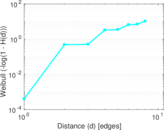
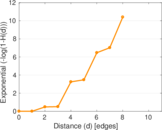
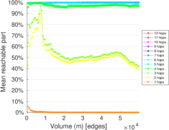
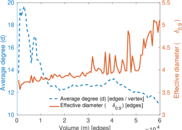
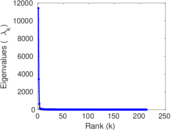
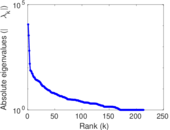
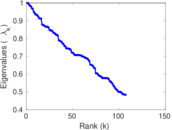
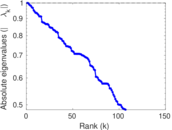
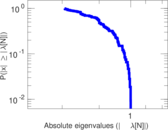
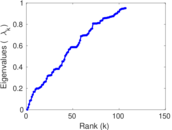
Plots


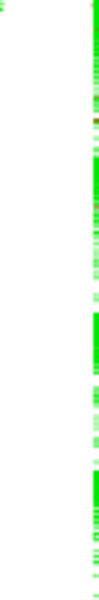
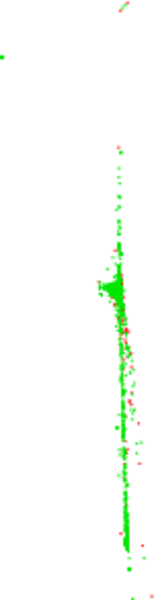
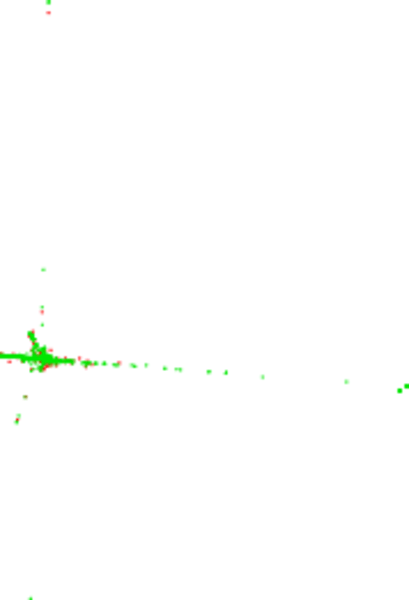
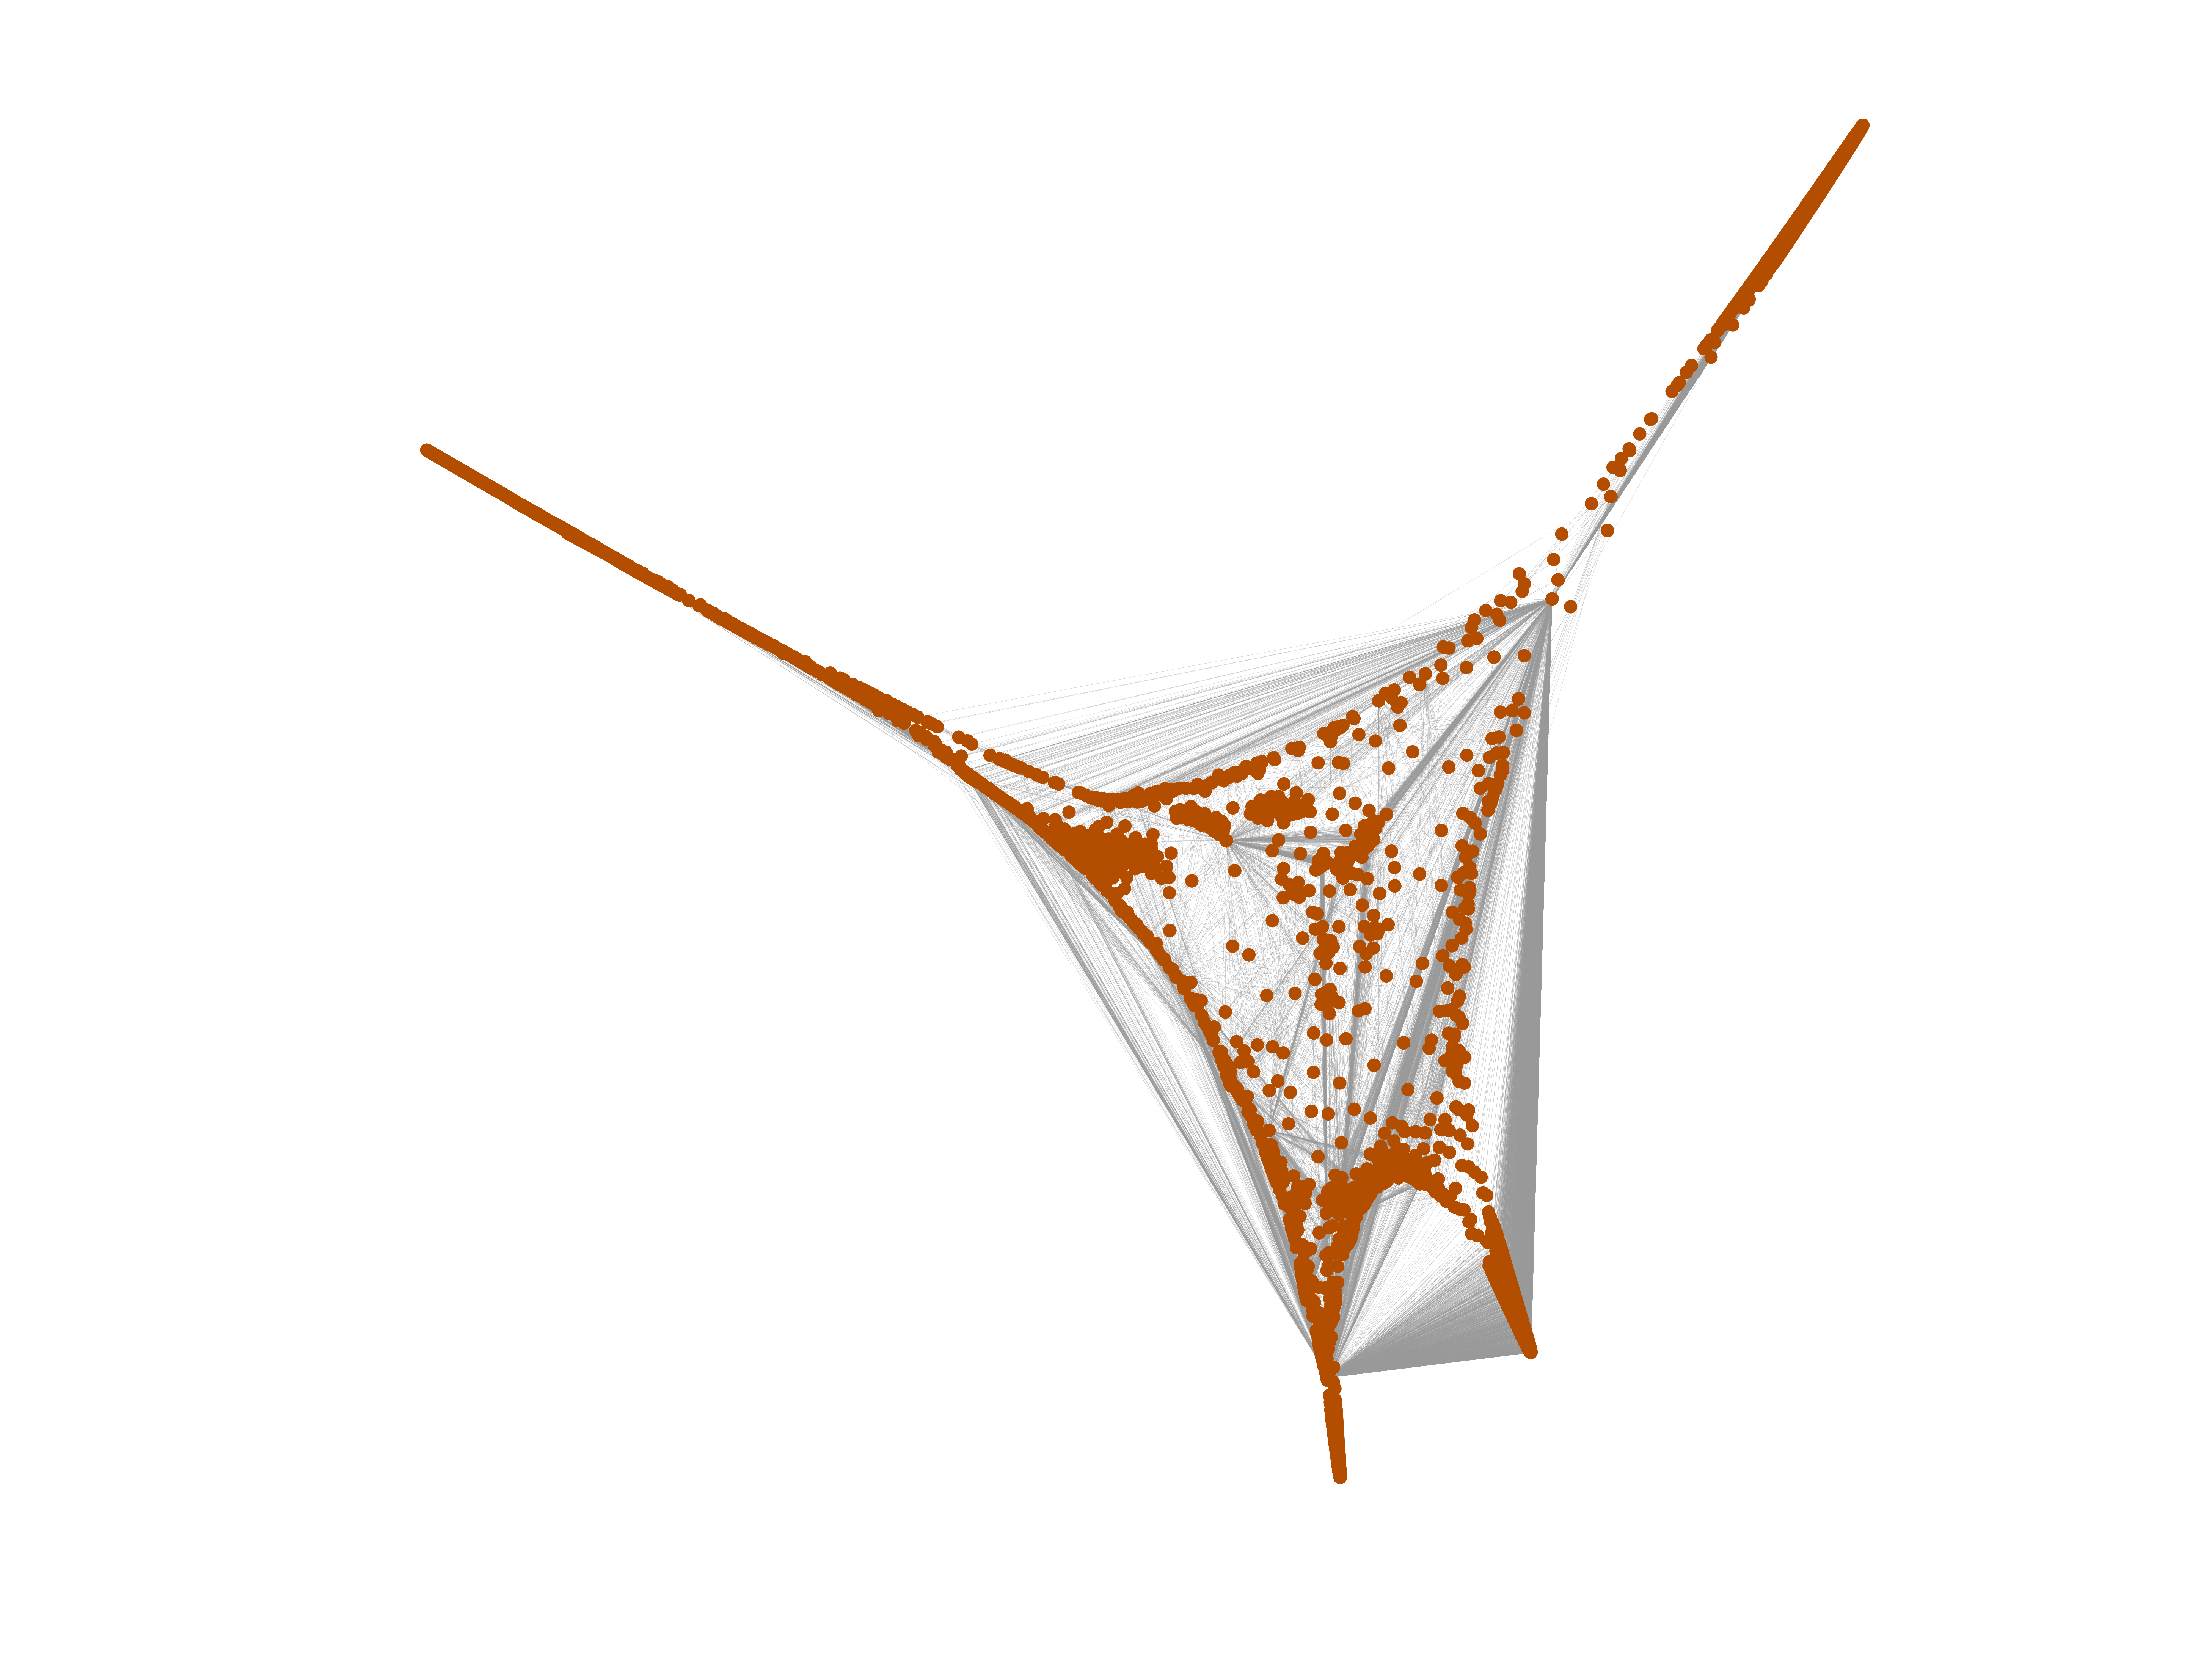
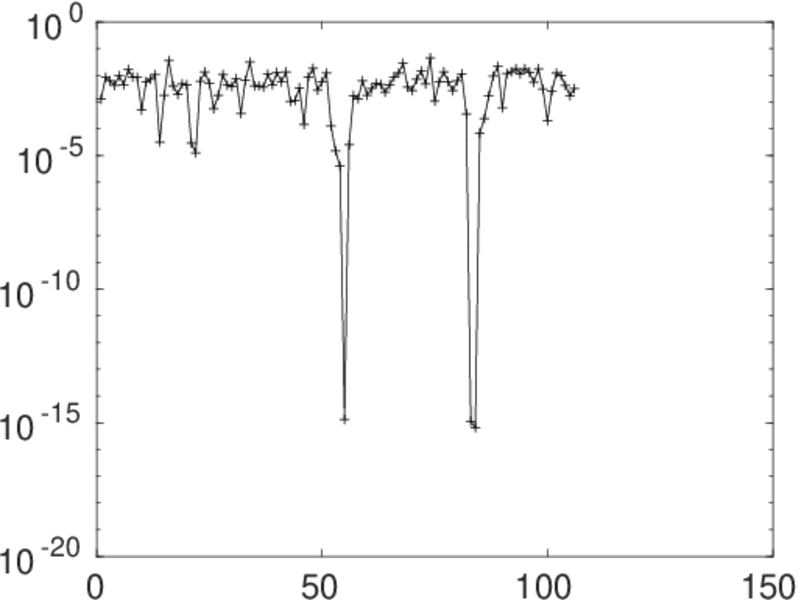
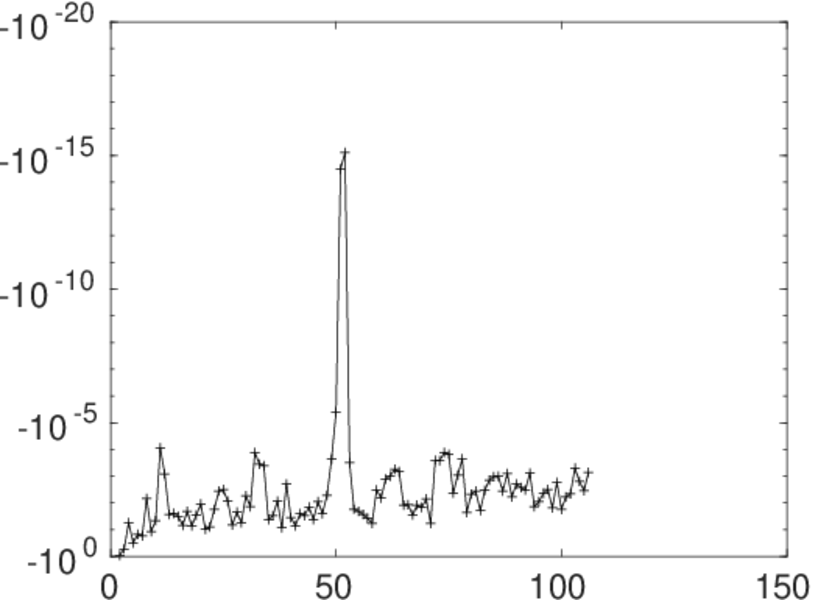
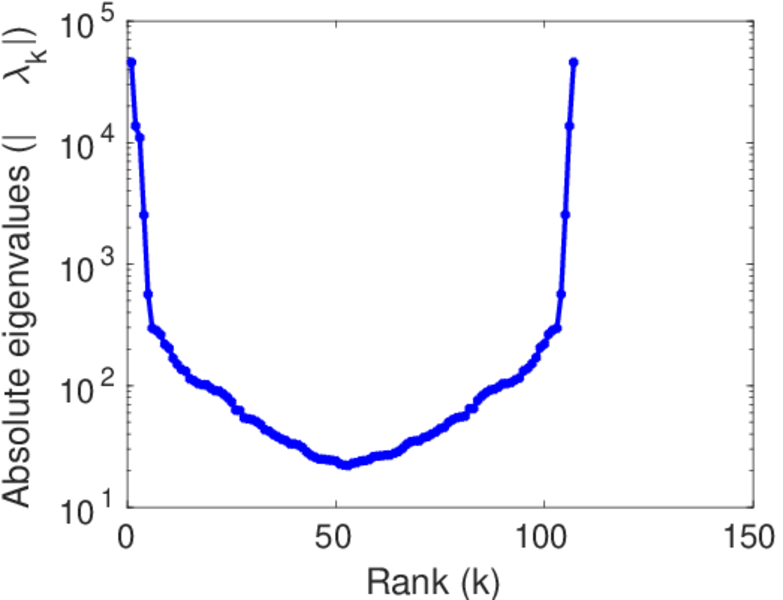
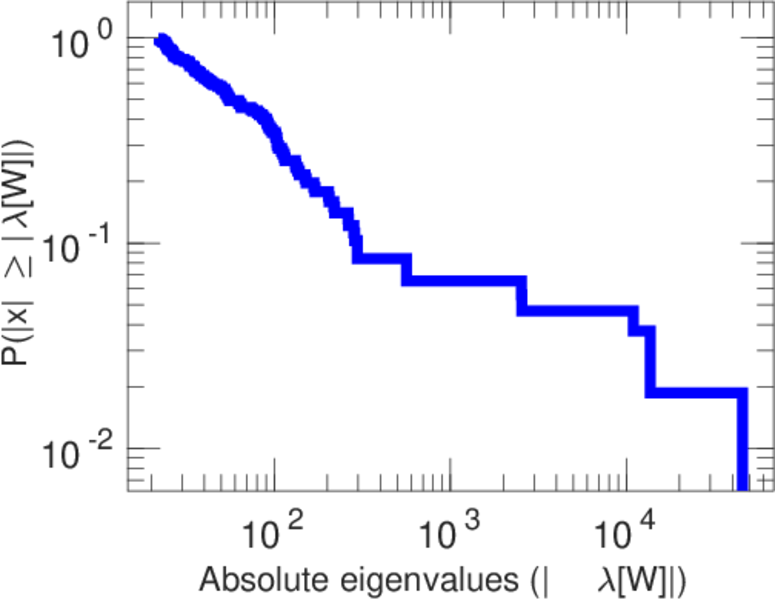
Matrix decompositions plots


Downloads
References
|
[1]
|
Jérôme Kunegis.
KONECT – The Koblenz Network Collection.
In Proc. Int. Conf. on World Wide Web Companion, pages
1343–1350, 2013.
[ http ]
|
|
[2]
|
Wikimedia Foundation.
Wikimedia downloads.
http://dumps.wikimedia.org/, January 2010.
|
 KONECT ‣ Networks ‣
Buy Me a Coffee
KONECT ‣ Networks ‣
Buy Me a Coffee