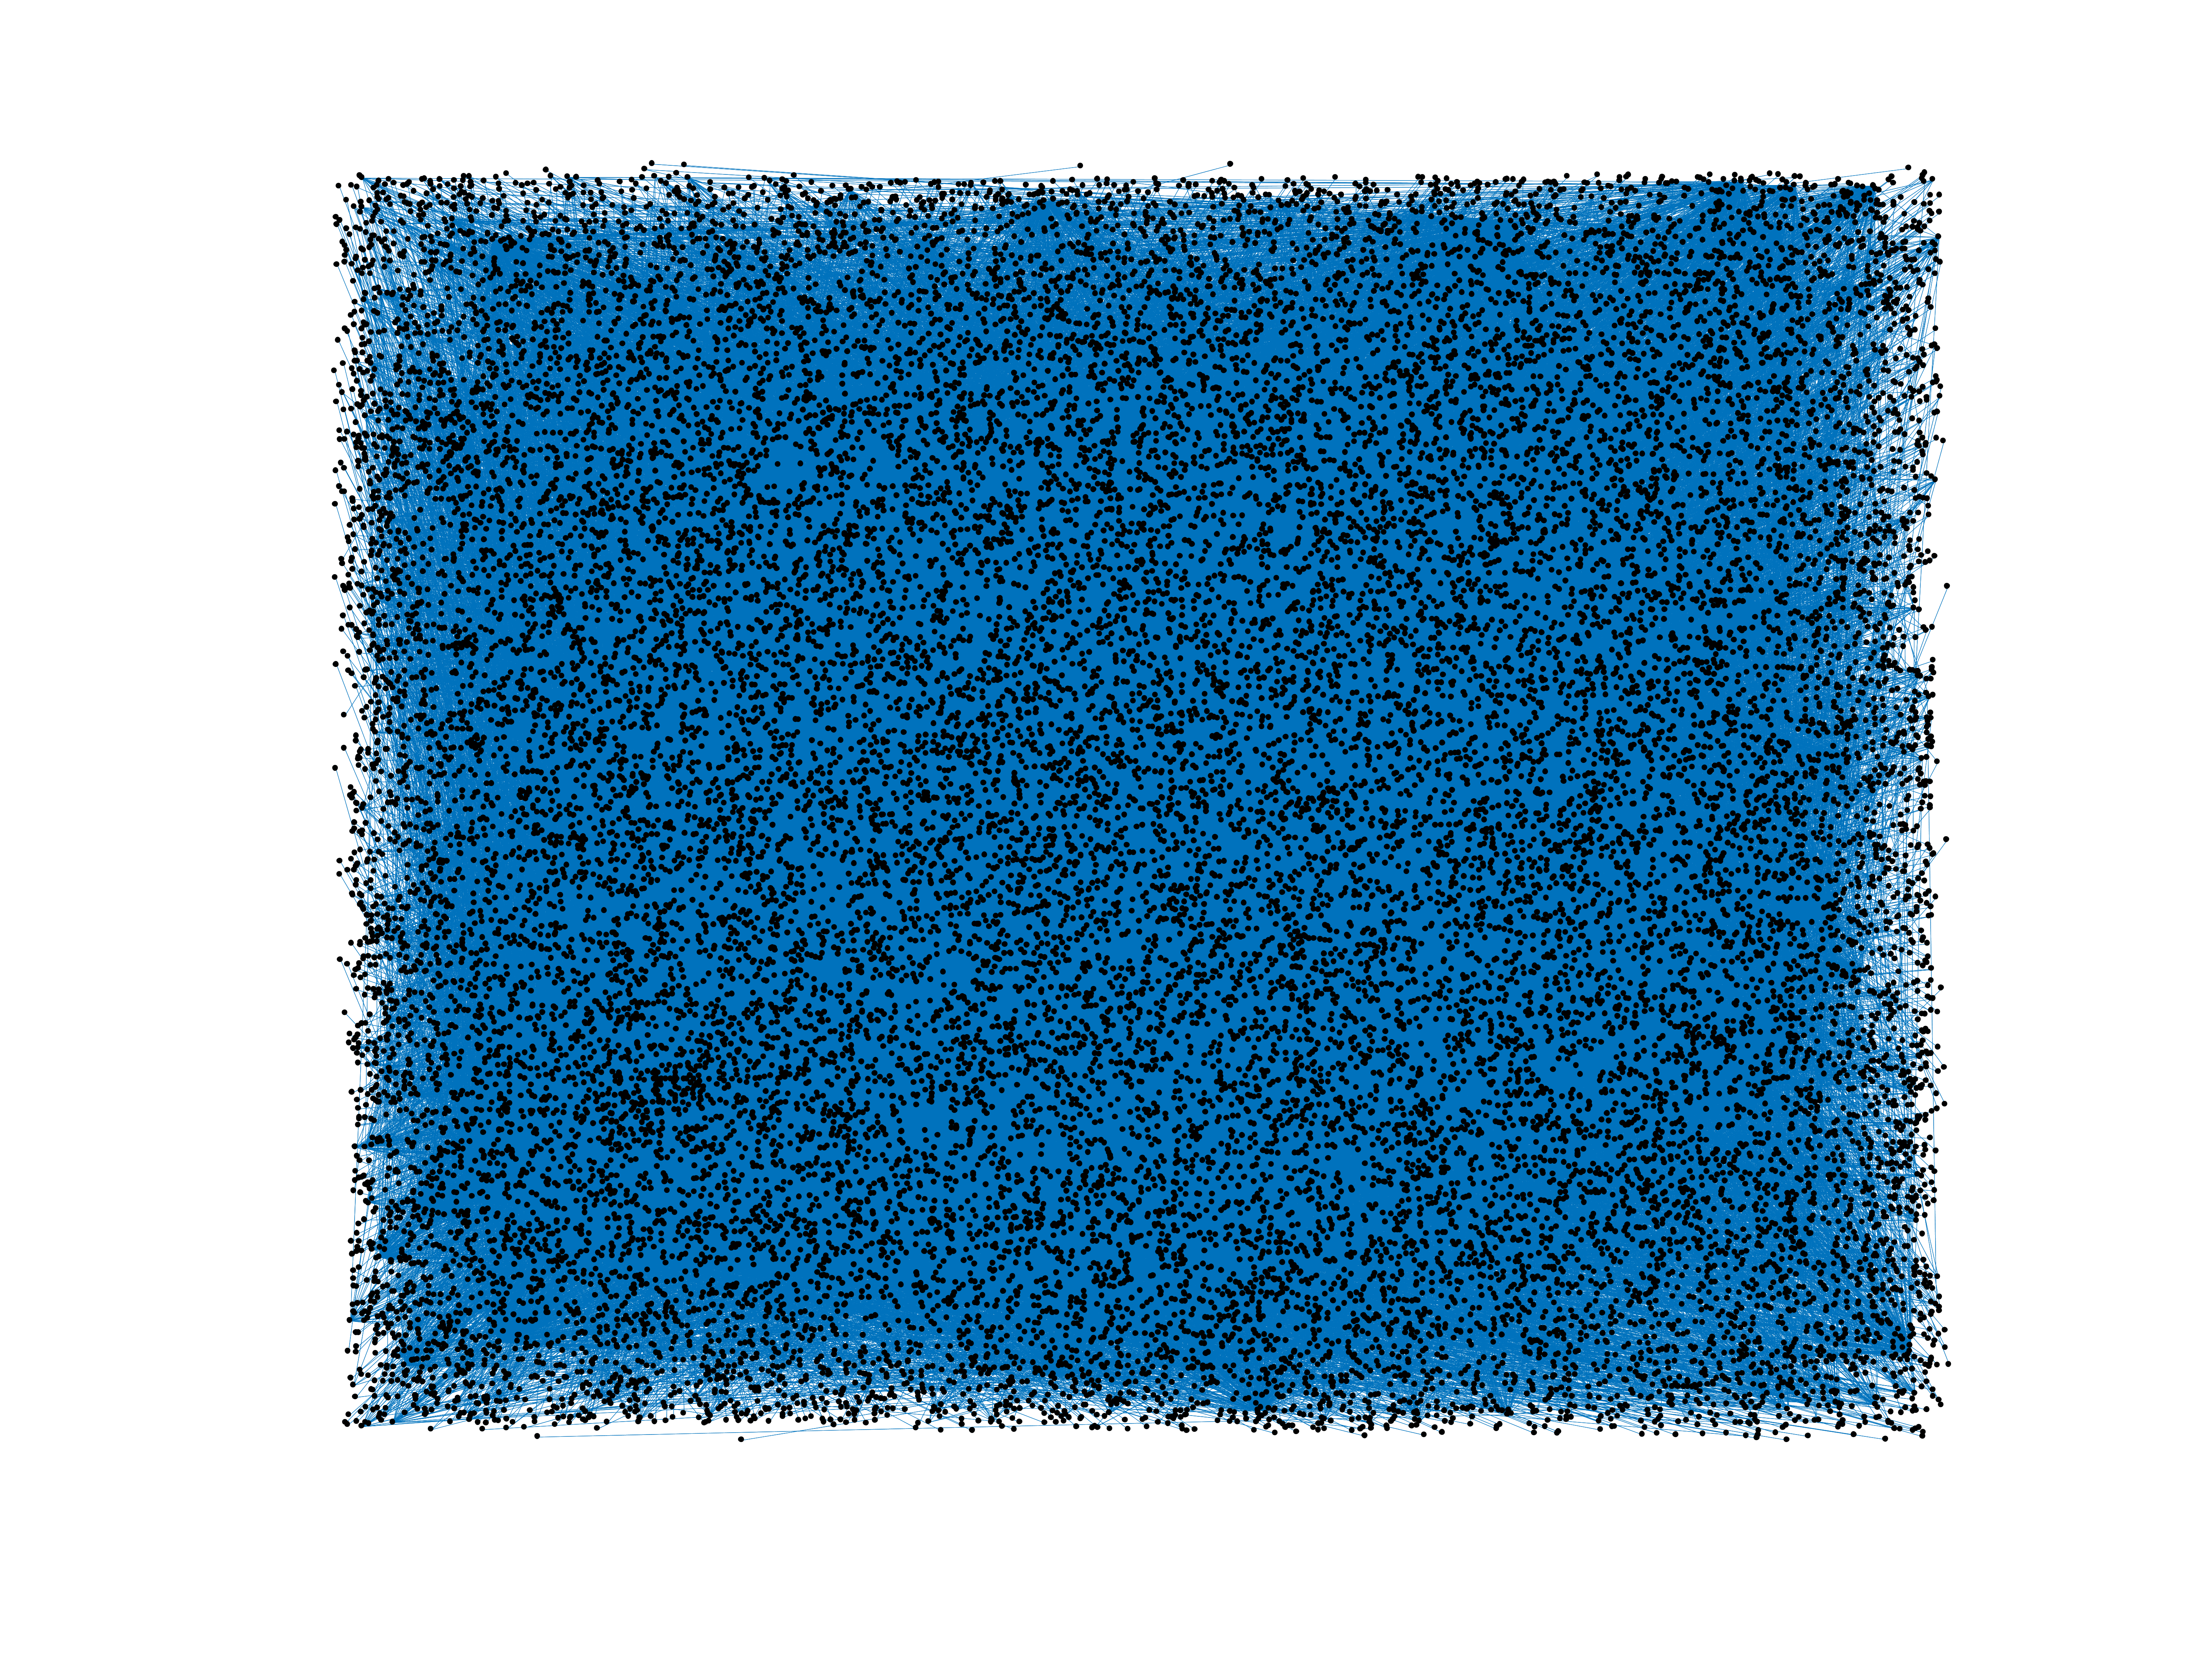
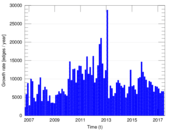
Wikipedia edits (eml)
This is the bipartite edit network of the Emiliano-Romagnolo Wikipedia. It
contains users and pages from the Emiliano-Romagnolo Wikipedia, connected by
edit events. Each edge represents an edit. The dataset includes the timestamp
of each edit.
Metadata
Statistics
| Size | n = | 28,563
|
| Left size | n1 = | 1,217
|
| Right size | n2 = | 27,346
|
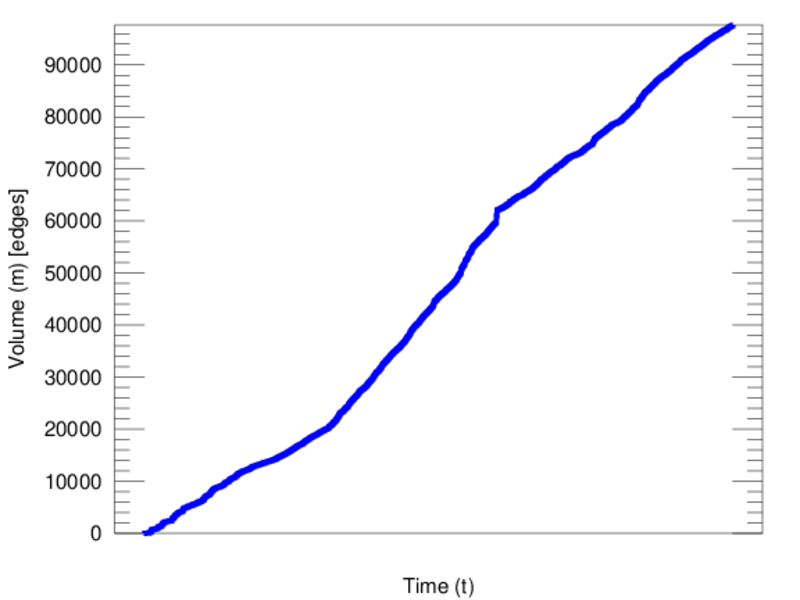
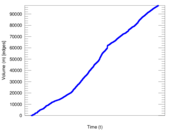
| Volume | m = | 97,631
|
| Unique edge count | m̿ = | 48,812
|
| Wedge count | s = | 94,610,321
|
| Claw count | z = | 280,497,860,895
|
| Cross count | x = | 732,785,460,641,912
|
| Square count | q = | 16,238,915
|
| 4-Tour count | T4 = | 508,478,296
|
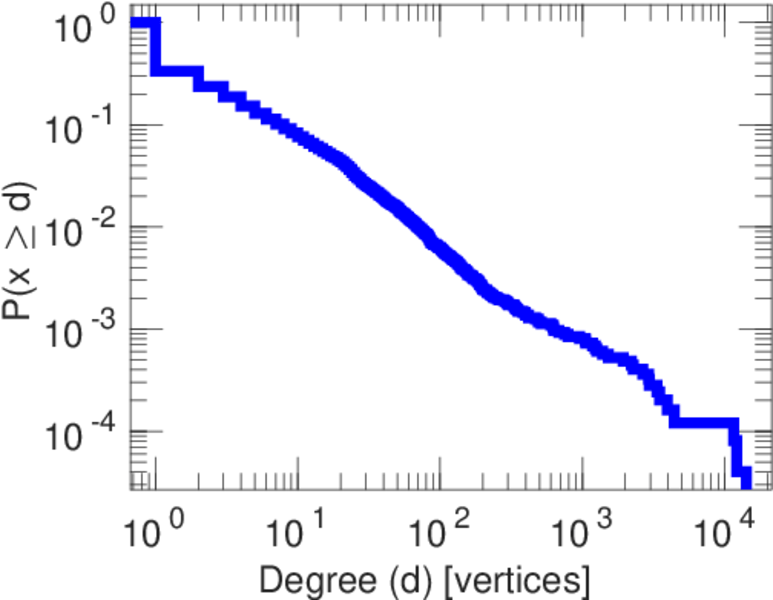
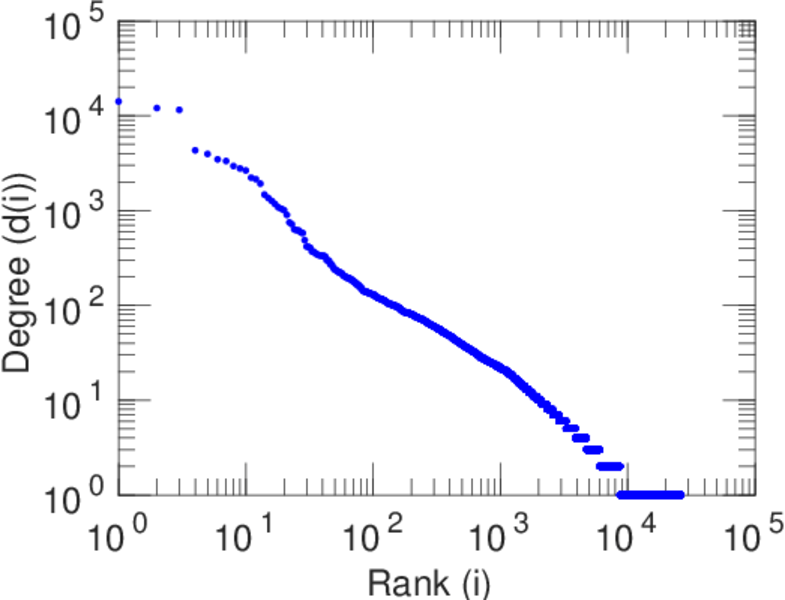
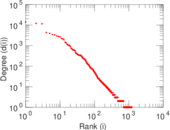
| Maximum degree | dmax = | 14,181
|
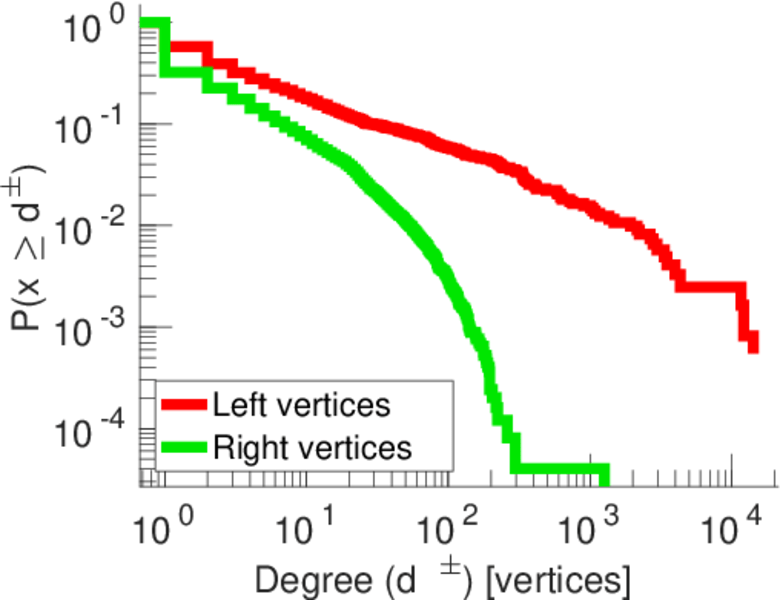
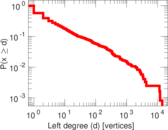
| Maximum left degree | d1max = | 14,181
|
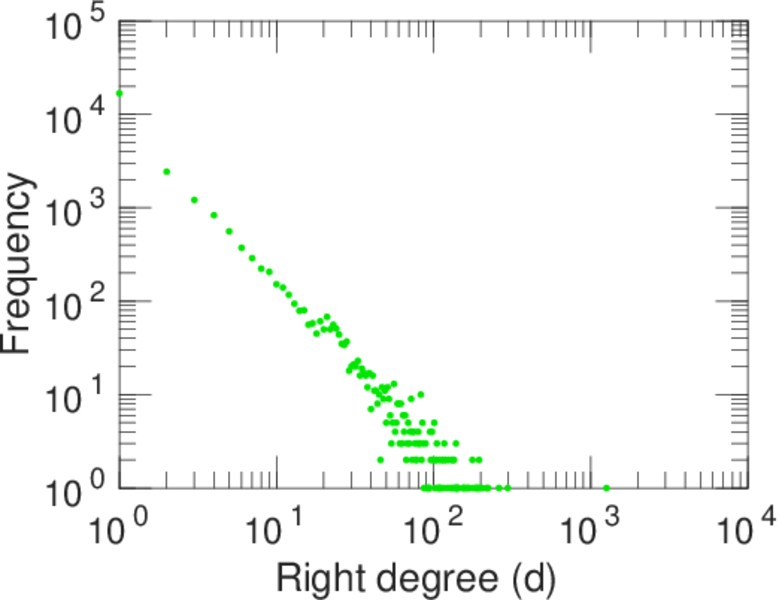
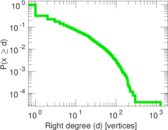
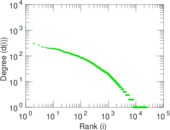
| Maximum right degree | d2max = | 1,263
|
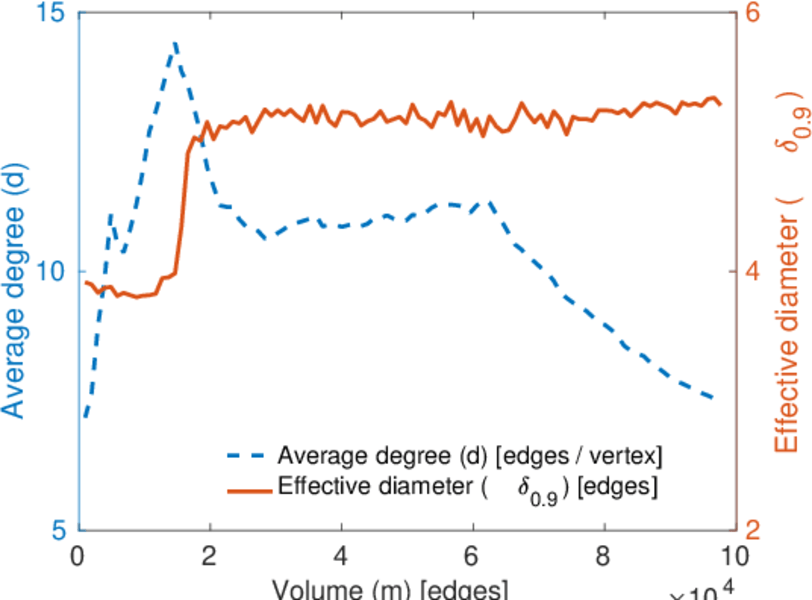
| Average degree | d = | 6.836 19
|
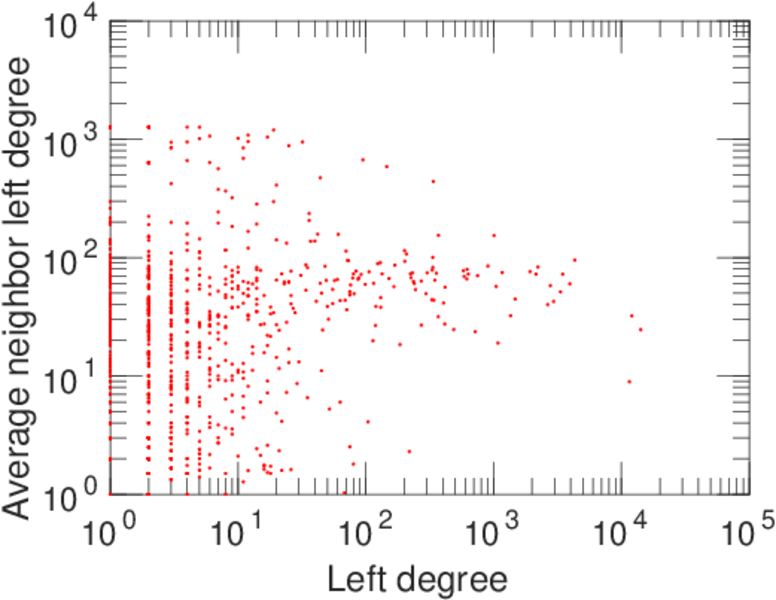
| Average left degree | d1 = | 80.222 7
|
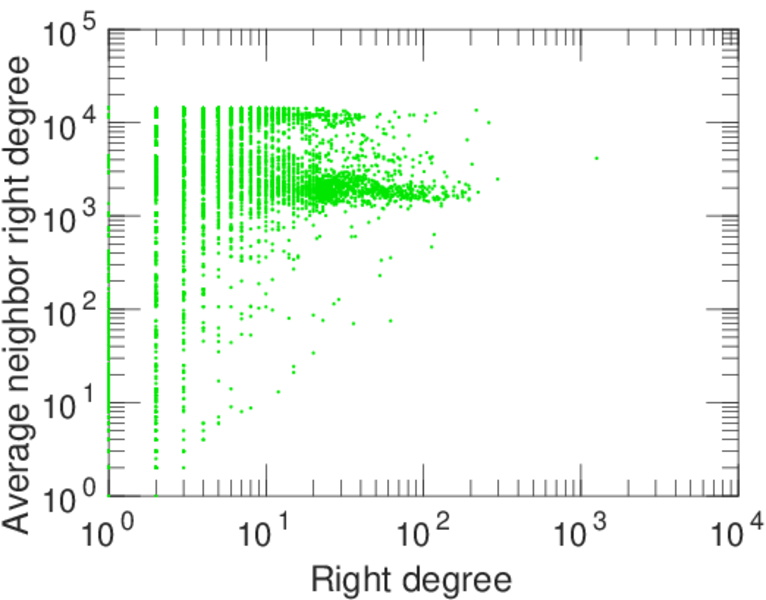
| Average right degree | d2 = | 3.570 21
|
| Fill | p = | 0.001 466 70
|
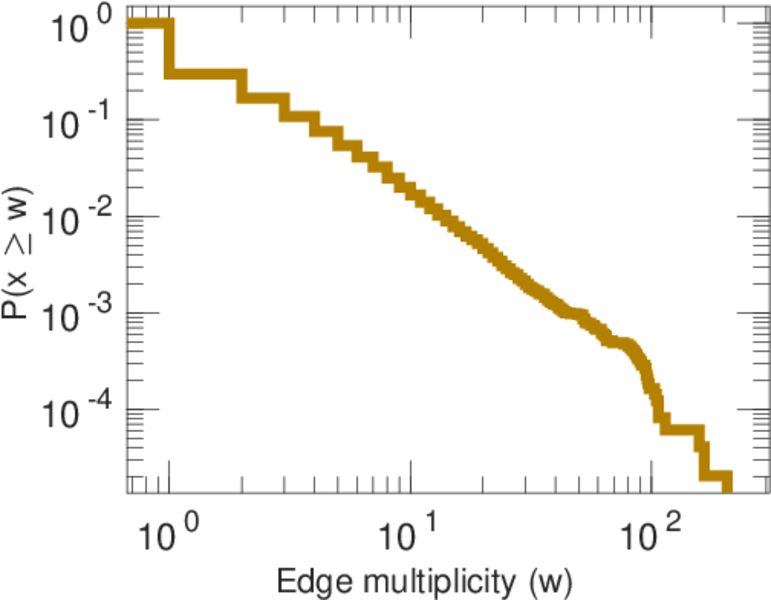
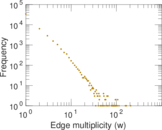
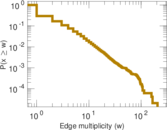
| Average edge multiplicity | m̃ = | 2.000 14
|
| Size of LCC | N = | 25,485
|
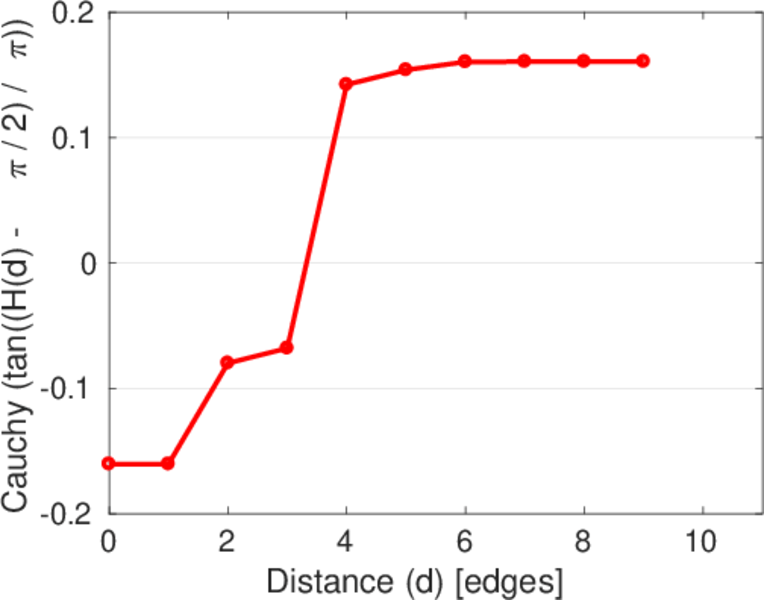
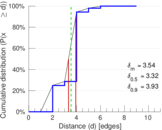
| Diameter | δ = | 11
|
| 50-Percentile effective diameter | δ0.5 = | 3.324 99
|
| 90-Percentile effective diameter | δ0.9 = | 3.933 70
|
| Median distance | δM = | 4
|
| Mean distance | δm = | 3.541 66
|
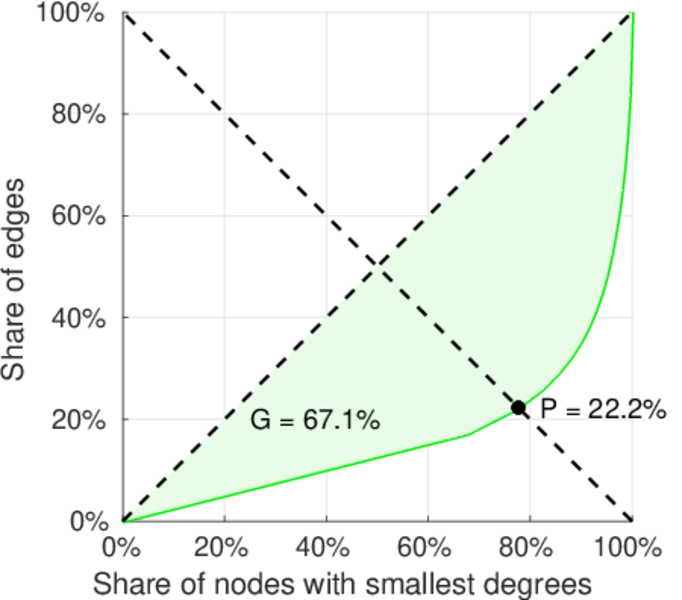
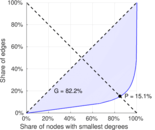
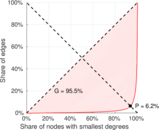
| Gini coefficient | G = | 0.829 162
|
| Balanced inequality ratio | P = | 0.147 433
|
| Left balanced inequality ratio | P1 = | 0.061 845 1
|
| Right balanced inequality ratio | P2 = | 0.221 641
|
| Relative edge distribution entropy | Her = | 0.717 675
|
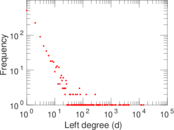
| Power law exponent | γ = | 4.524 92
|
| Tail power law exponent | γt = | 2.511 00
|
| Tail power law exponent with p | γ3 = | 2.511 00
|
| p-value | p = | 0.000 00
|
| Left tail power law exponent with p | γ3,1 = | 1.571 00
|
| Left p-value | p1 = | 0.020 000 0
|
| Right tail power law exponent with p | γ3,2 = | 3.951 00
|
| Right p-value | p2 = | 0.000 00
|
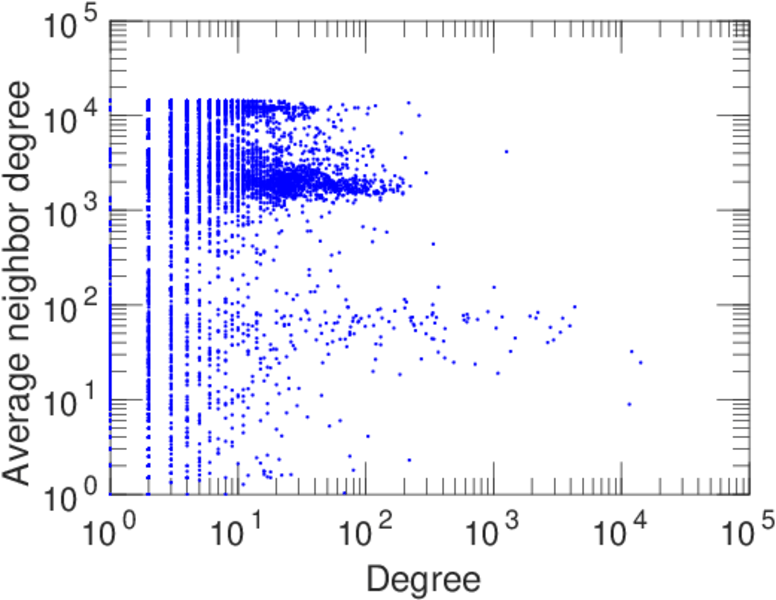
| Degree assortativity | ρ = | −0.521 811
|
| Degree assortativity p-value | pρ = | 0.000 00
|
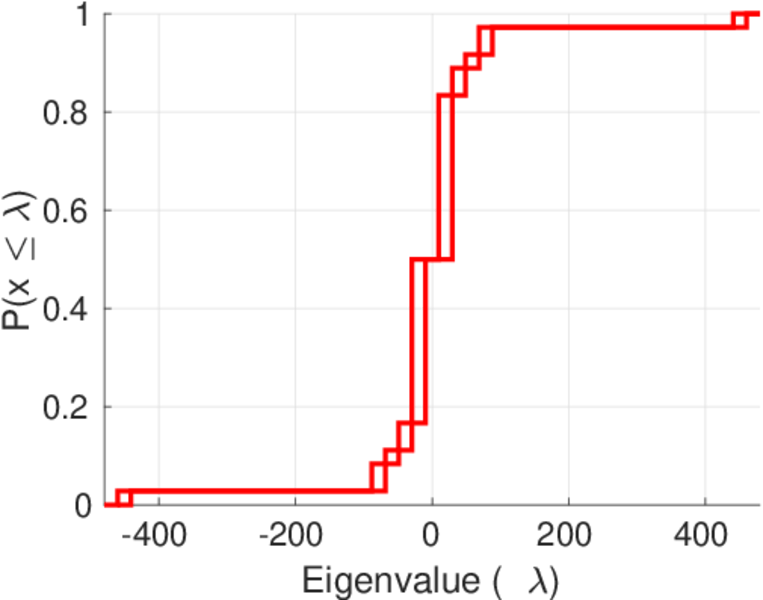
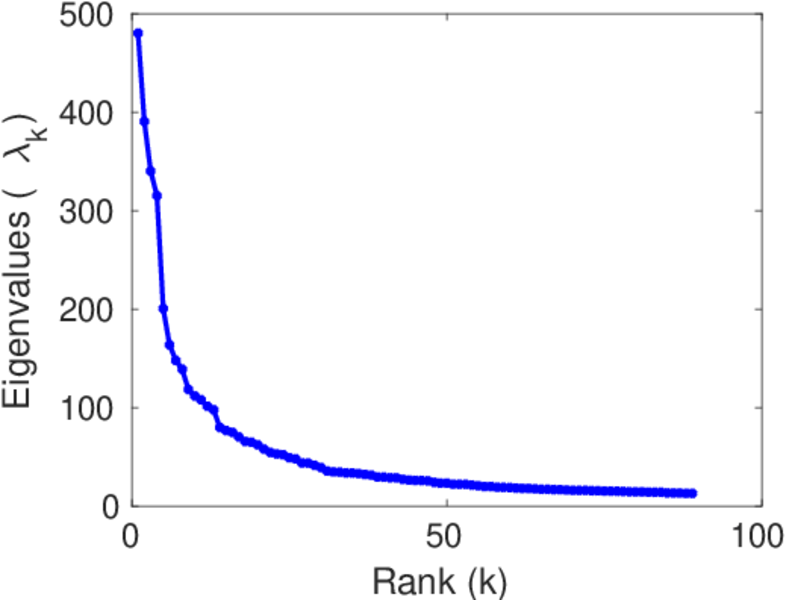
| Spectral norm | α = | 480.199
|
| Algebraic connectivity | a = | 0.014 619 1
|
| Spectral separation | |λ1[A] / λ2[A]| = | 1.229 67
|
| Controllability | C = | 23,732
|
| Relative controllability | Cr = | 0.912 769
|
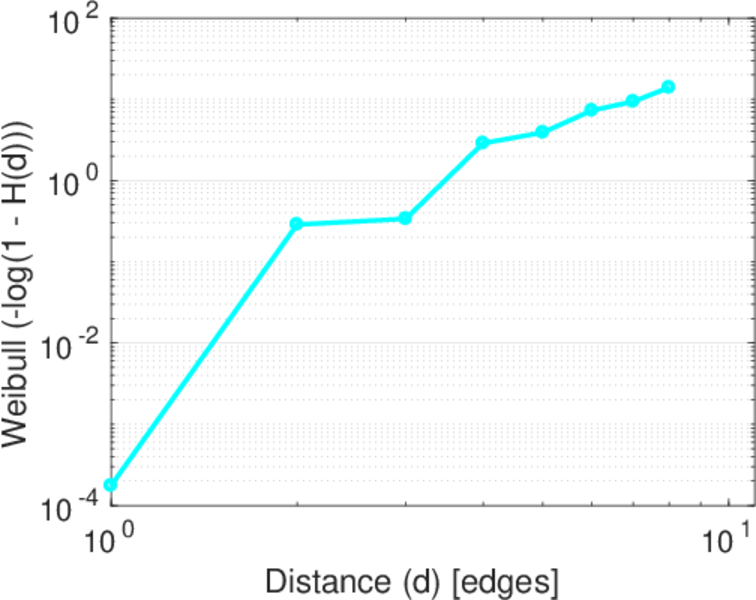
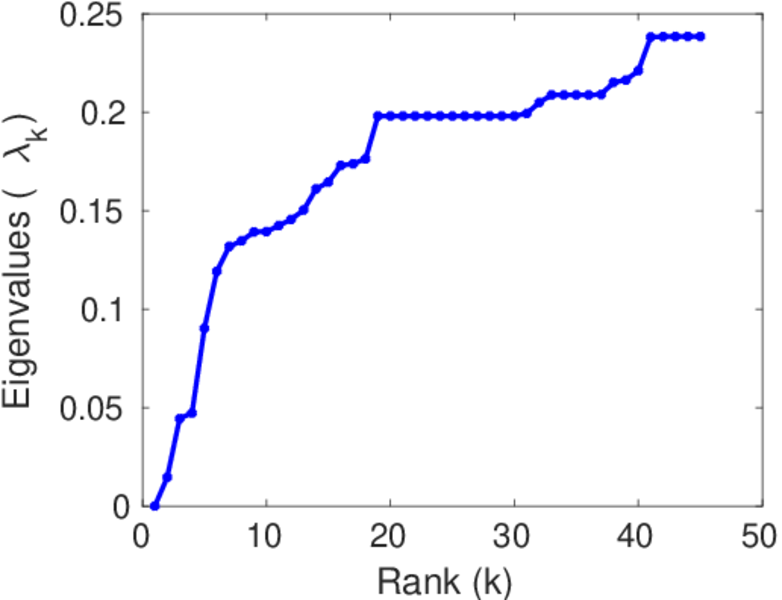
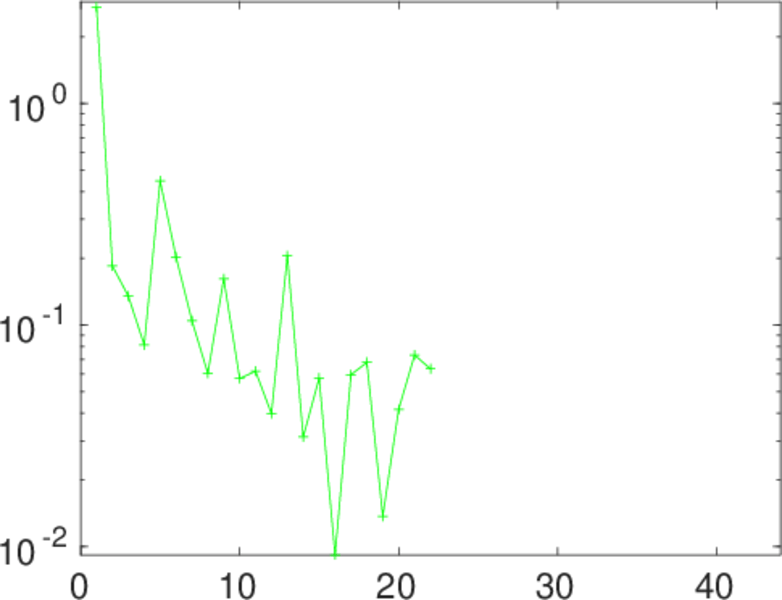
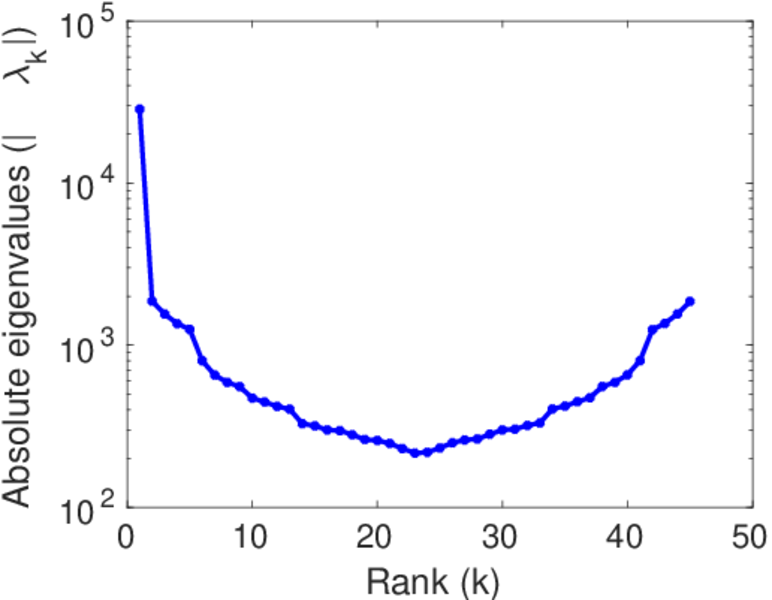
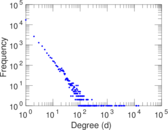
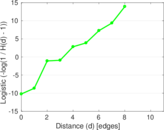
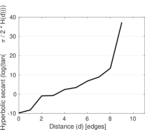
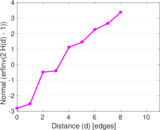
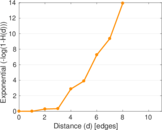
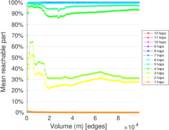
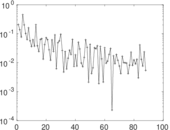
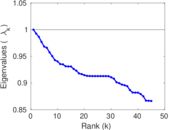
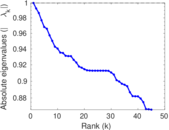
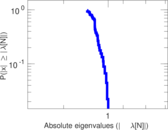
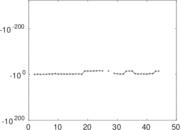
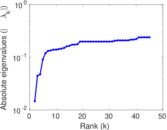
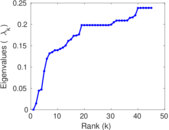
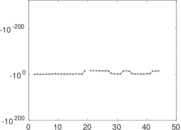
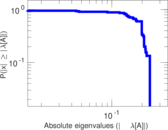
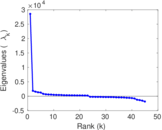
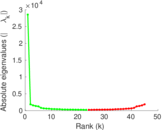
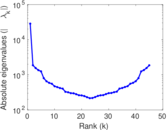
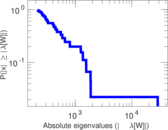
Plots


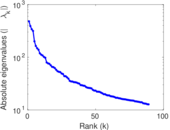
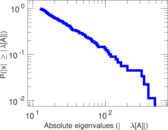
Matrix decompositions plots


Downloads
References
|
[1]
|
Jérôme Kunegis.
KONECT – The Koblenz Network Collection.
In Proc. Int. Conf. on World Wide Web Companion, pages
1343–1350, 2013.
[ http ]
|
|
[2]
|
Wikimedia Foundation.
Wikimedia downloads.
http://dumps.wikimedia.org/, January 2010.
|
 KONECT ‣ Networks ‣
Buy Me a Coffee
KONECT ‣ Networks ‣
Buy Me a Coffee