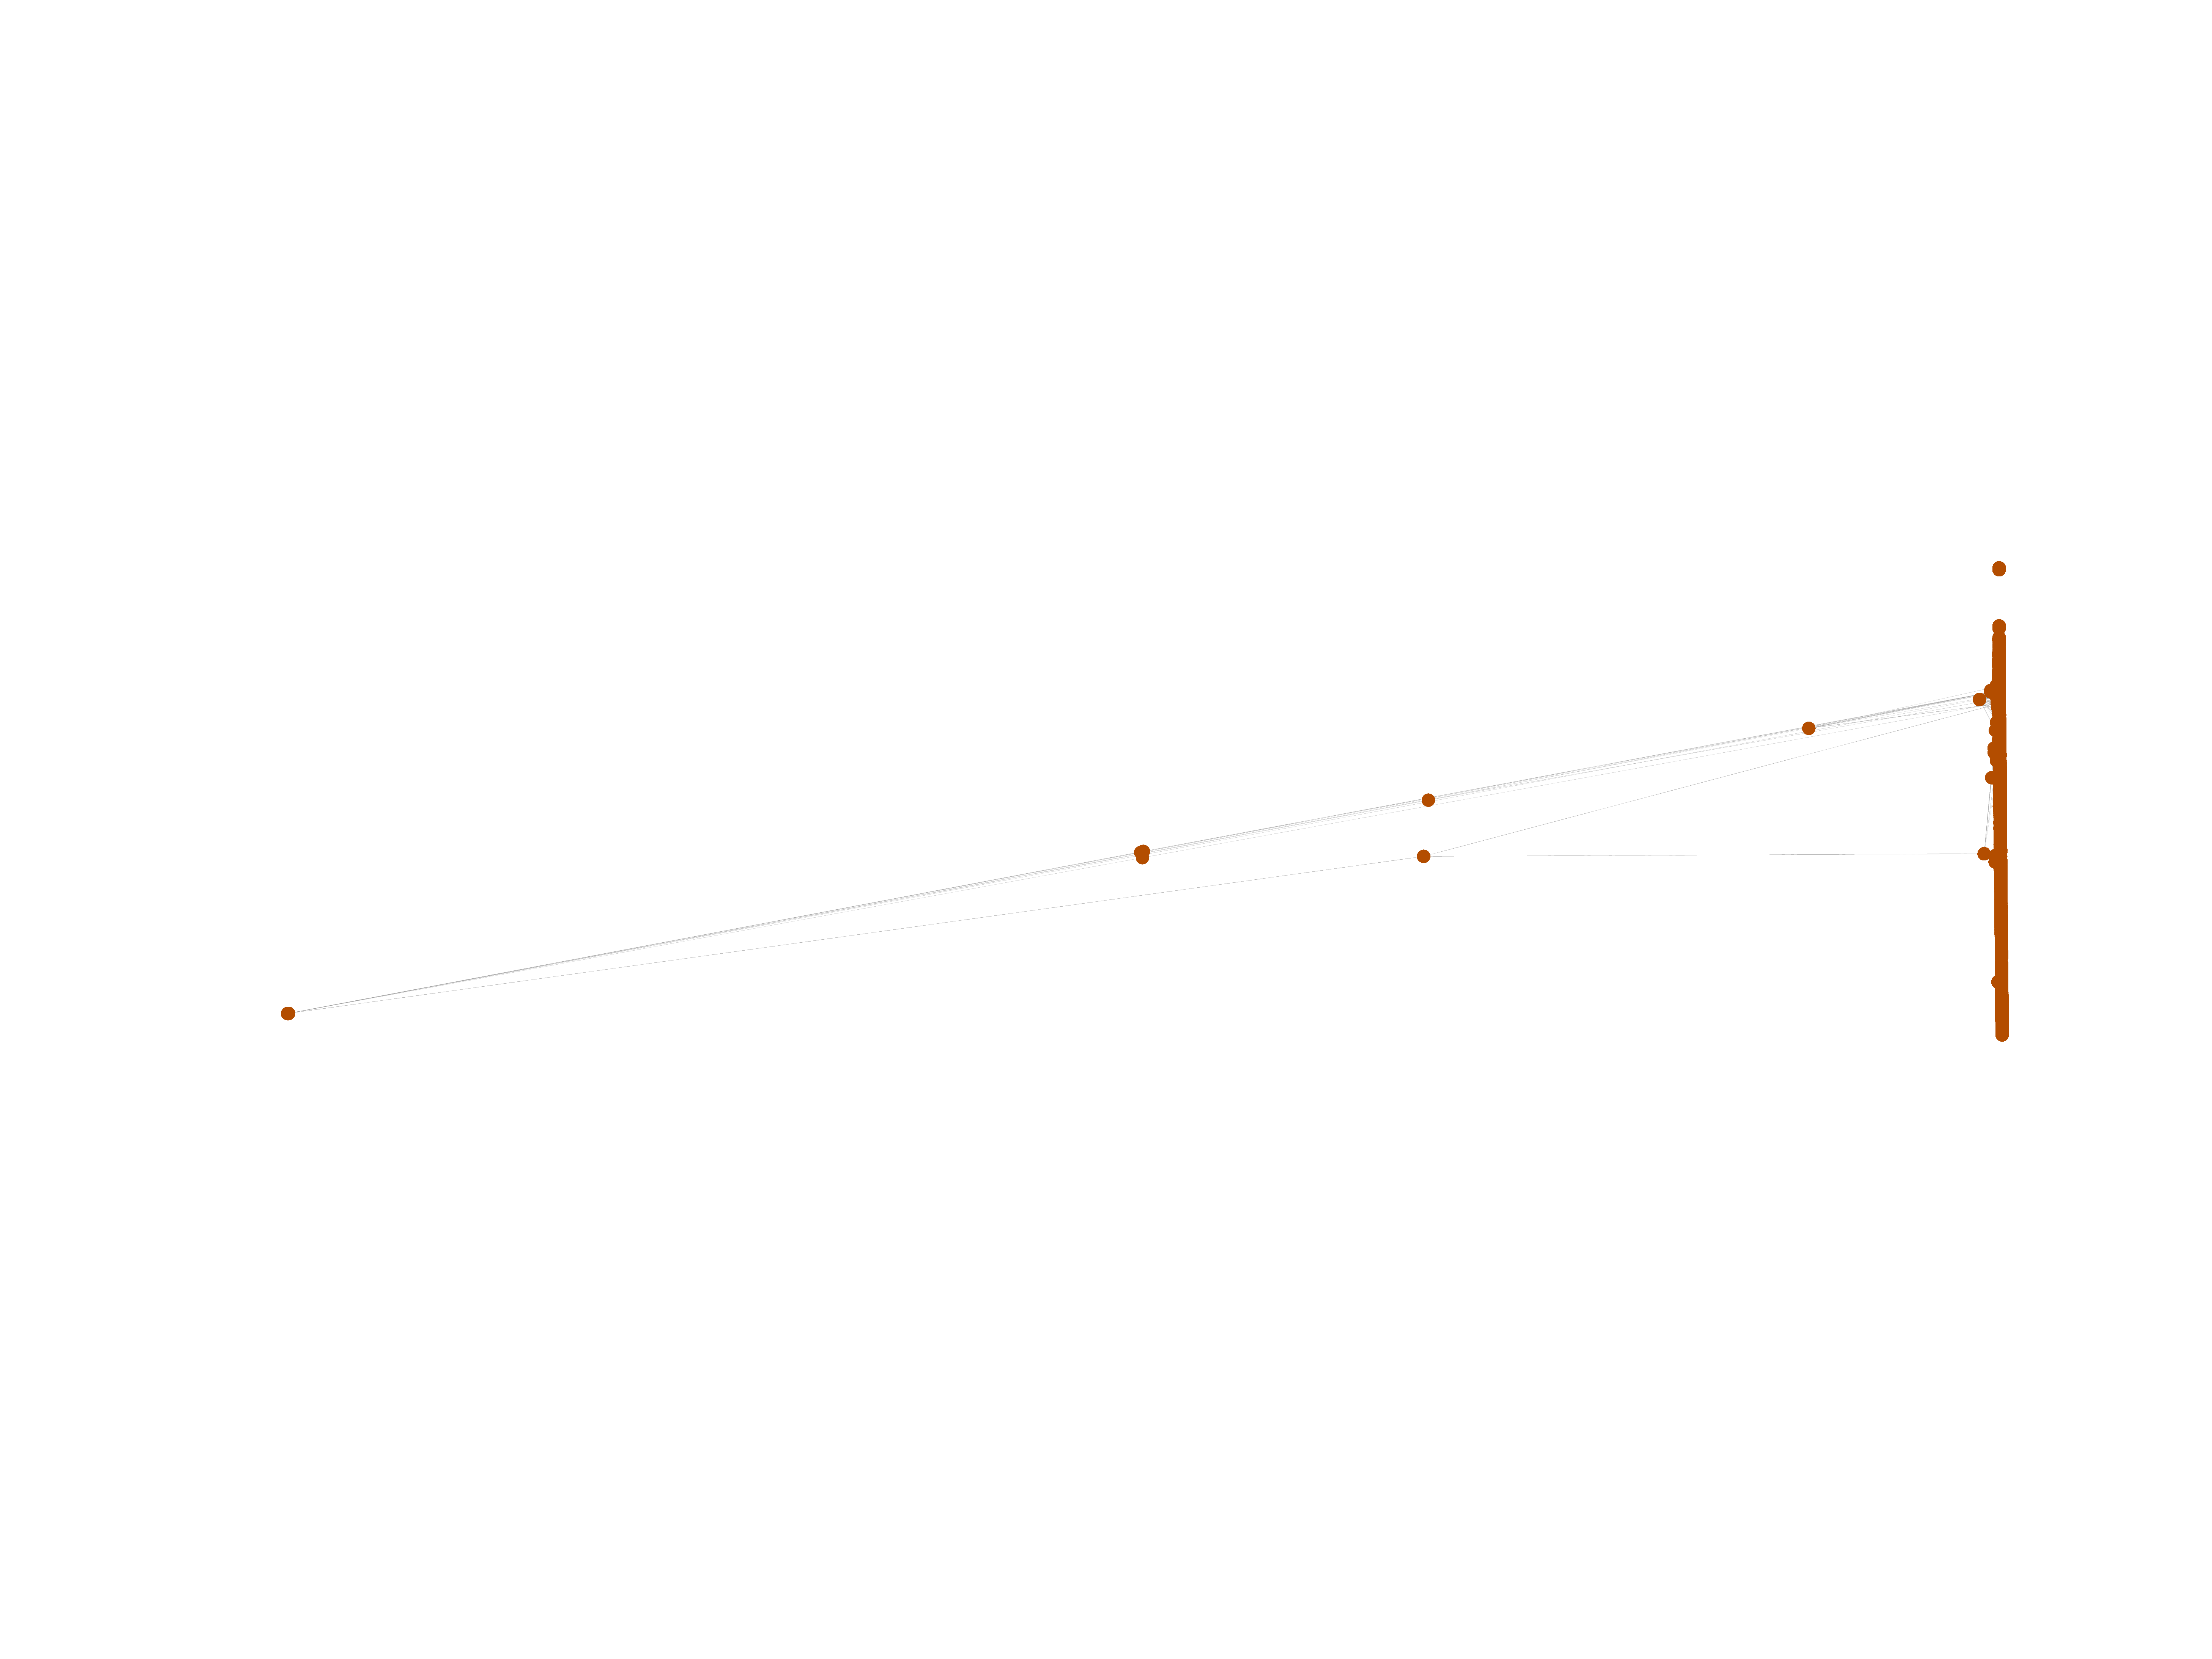
Wikinews edits (en)
This is the bipartite edit network of the English Wikinews. It contains users
and pages from the English Wikinews, connected by edit events. Each edge
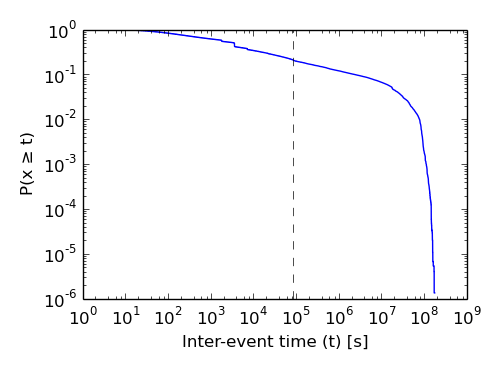
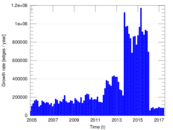
represents an edit. The dataset includes the timestamp of each edit.
Metadata
Statistics
| Size | n = | 2,766,389
|
| Left size | n1 = | 15,724
|
| Right size | n2 = | 2,750,665
|
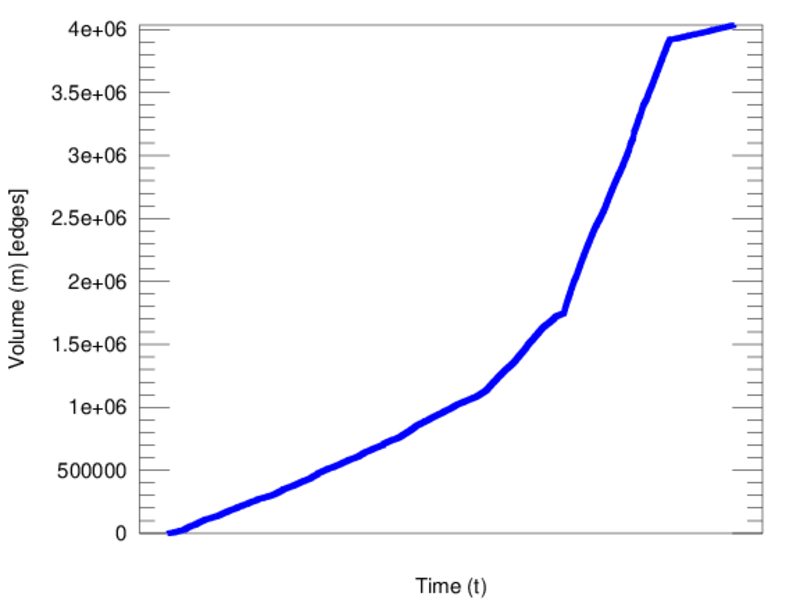
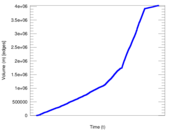
| Volume | m = | 4,035,910
|
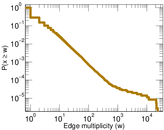
| Unique edge count | m̿ = | 3,037,738
|
| Wedge count | s = | 3,309,004,248,451
|
| Claw count | z = | 2,835,484,426,357,594,624
|
| Cross count | x = | 1.823 16 × 1024
|
| Square count | q = | 95,011,761
|
| 4-Tour count | T4 = | 13,238,347,969,716
|
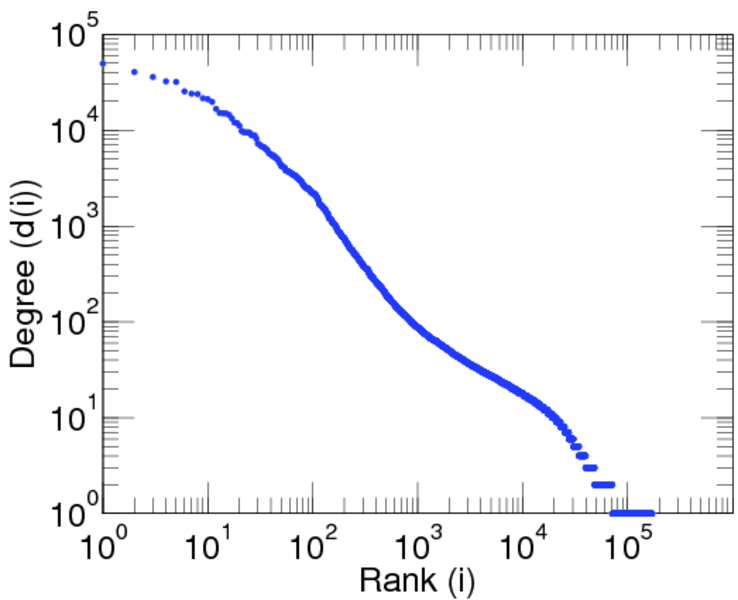
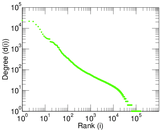
| Maximum degree | dmax = | 2,571,930
|
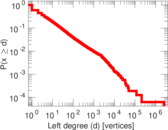
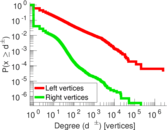
| Maximum left degree | d1max = | 2,571,930
|
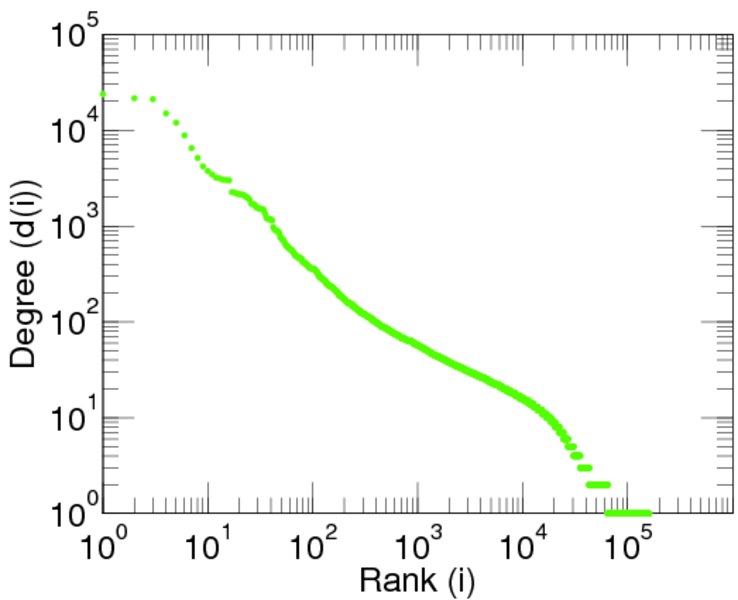
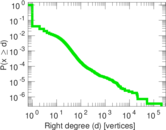
| Maximum right degree | d2max = | 205,667
|
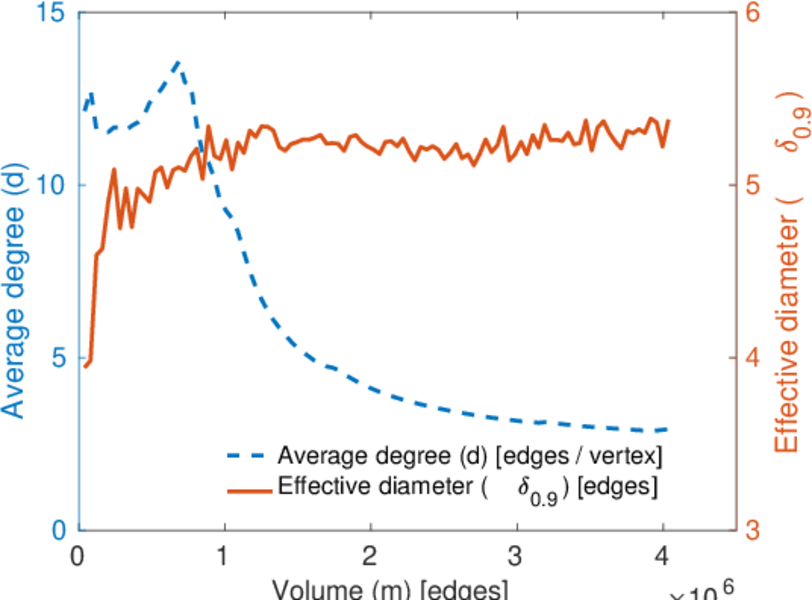
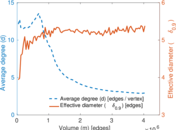
| Average degree | d = | 2.917 82
|
| Average left degree | d1 = | 256.672
|
| Average right degree | d2 = | 1.467 25
|
| Fill | p = | 0.000 201 843
|
| Average edge multiplicity | m̃ = | 1.328 59
|
| Size of LCC | N = | 2,753,395
|
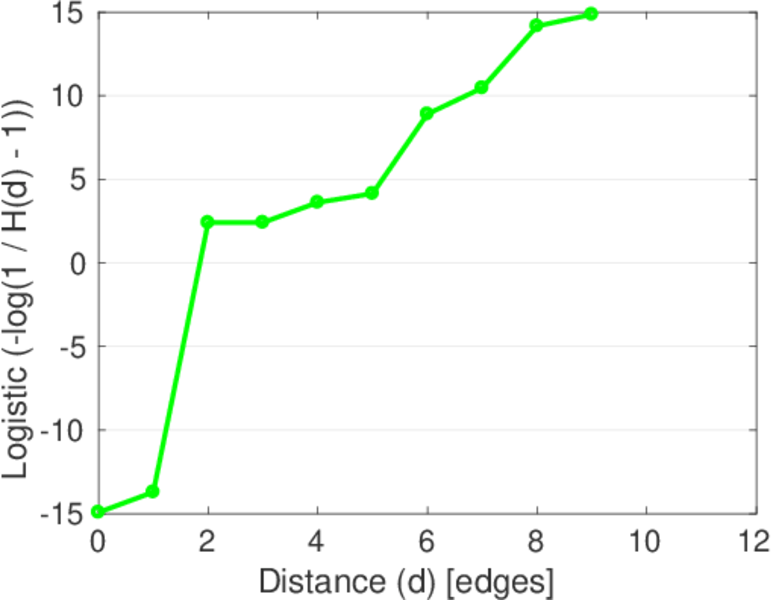
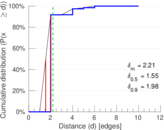
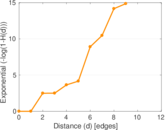
| Diameter | δ = | 13
|
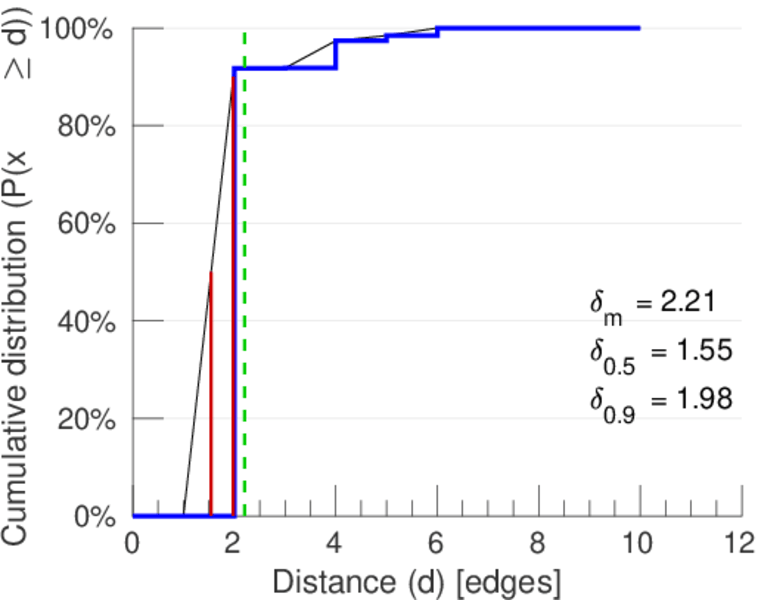
| 50-Percentile effective diameter | δ0.5 = | 1.545 22
|
| 90-Percentile effective diameter | δ0.9 = | 1.981 40
|
| Median distance | δM = | 2
|
| Mean distance | δm = | 2.207 14
|
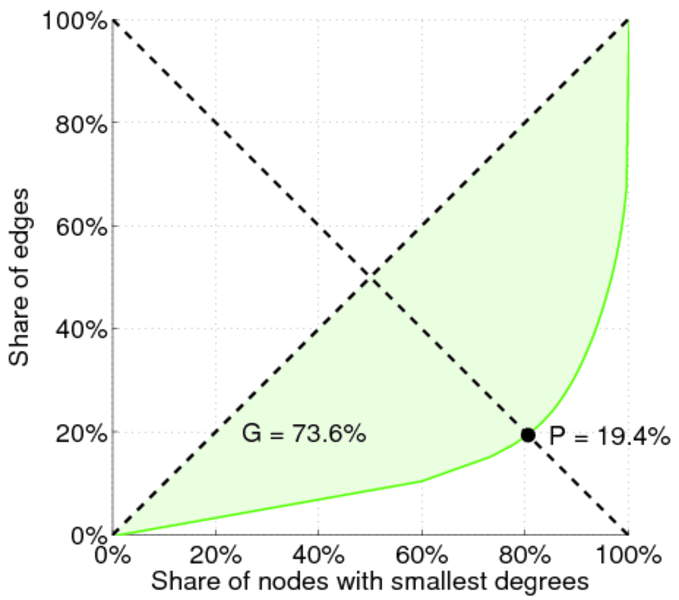
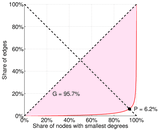
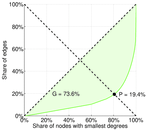
| Gini coefficient | G = | 0.658 430
|
| Balanced inequality ratio | P = | 0.253 231
|
| Left balanced inequality ratio | P1 = | 0.029 609 7
|
| Right balanced inequality ratio | P2 = | 0.404 478
|
| Relative edge distribution entropy | Her = | 0.586 520
|
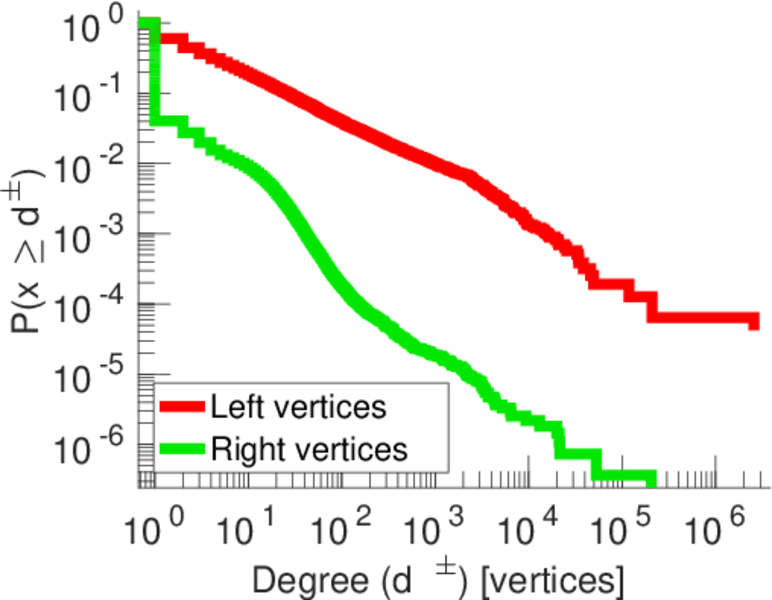
| Power law exponent | γ = | 22.813 5
|
| Tail power law exponent | γt = | 4.381 00
|
| Degree assortativity | ρ = | −0.225 894
|
| Degree assortativity p-value | pρ = | 0.000 00
|
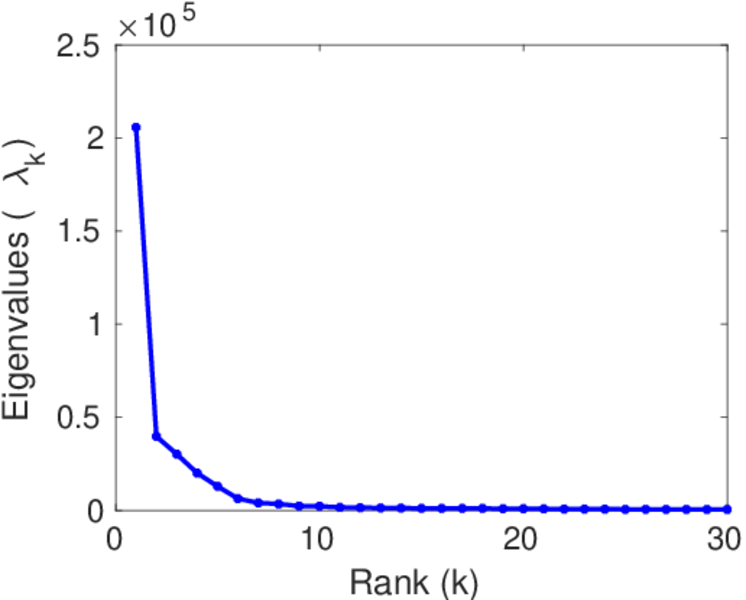
| Spectral norm | α = | 205,660
|
| Algebraic connectivity | a = | 0.001 139 29
|
| Spectral separation | |λ1[A] / λ2[A]| = | 5.184 35
|
| Controllability | C = | 2,731,312
|
| Relative controllability | Cr = | 0.989 851
|
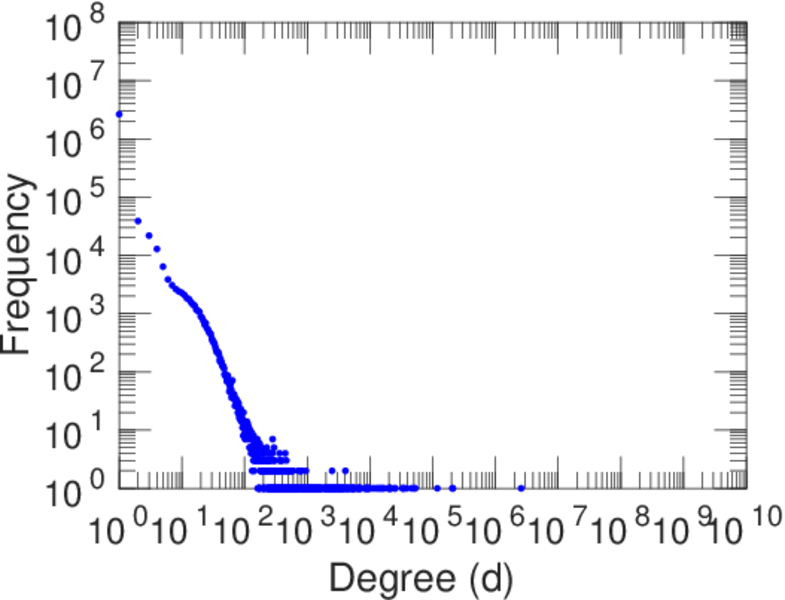
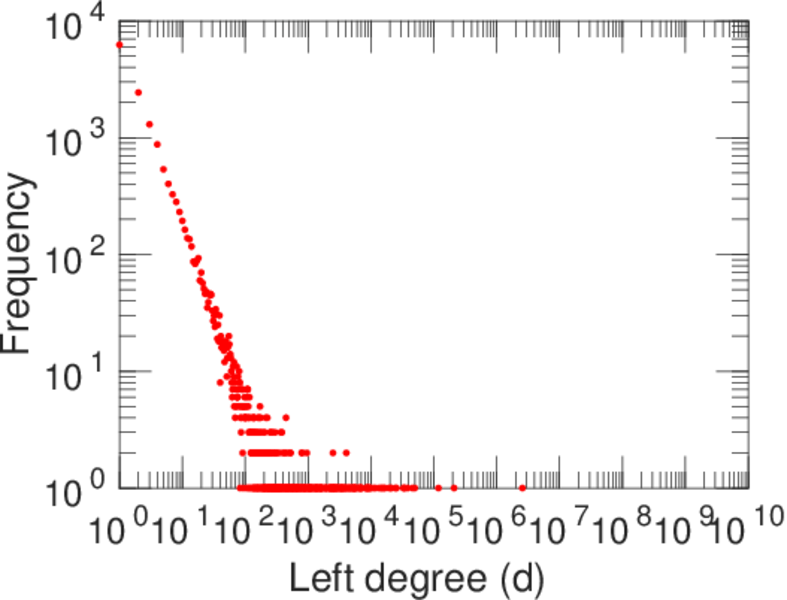
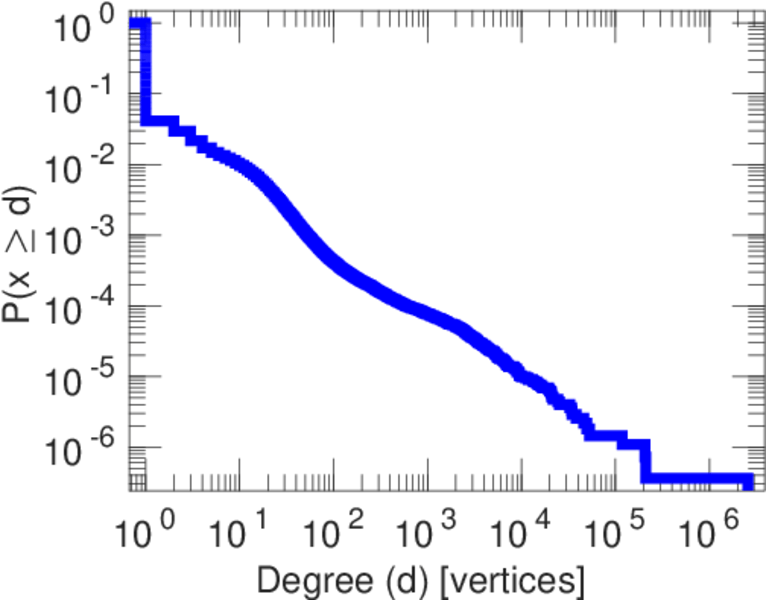
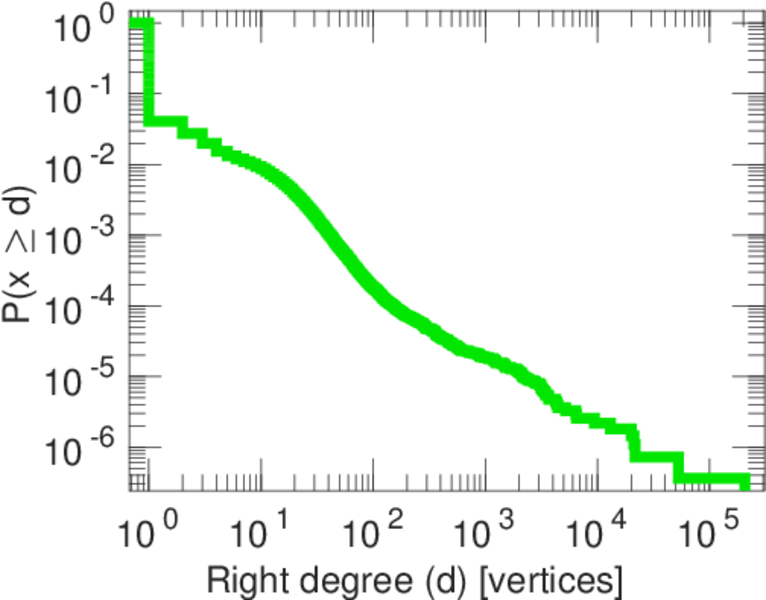
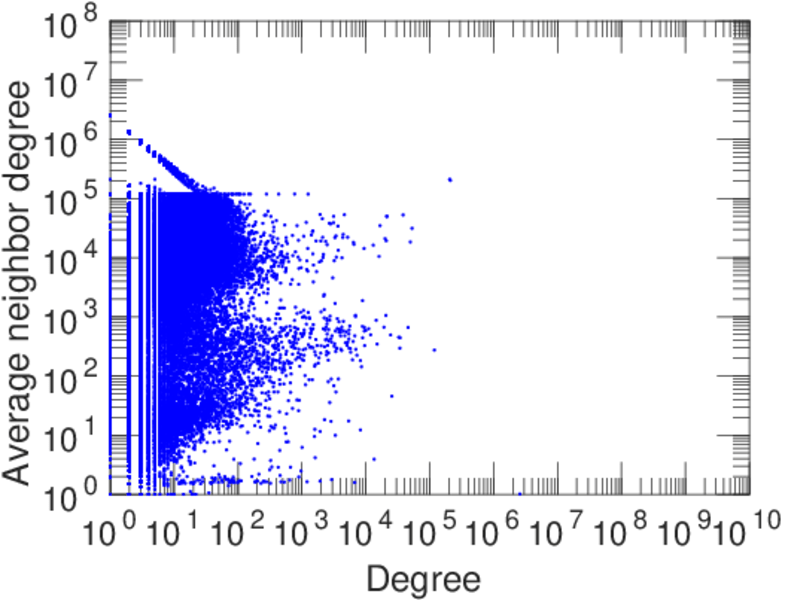
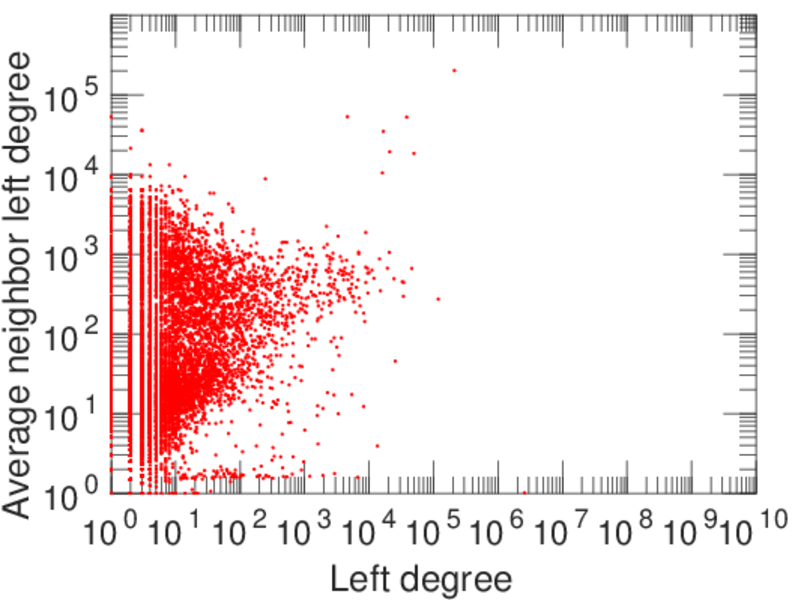
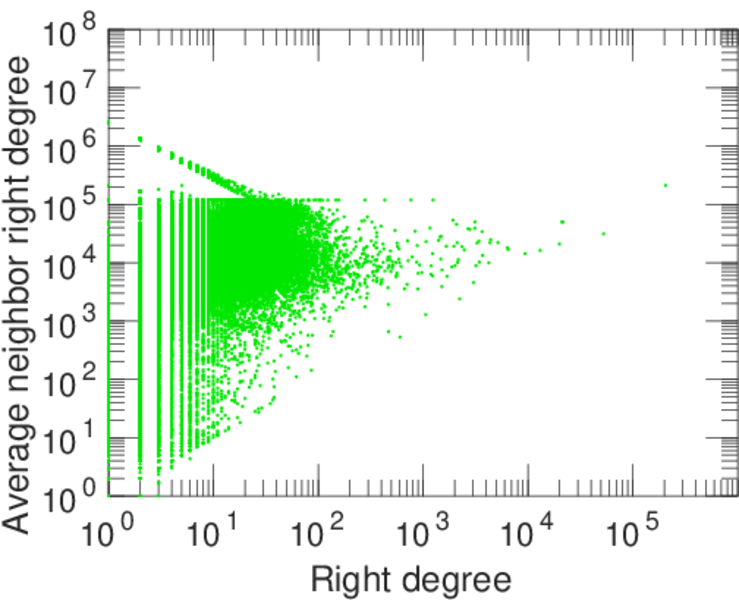
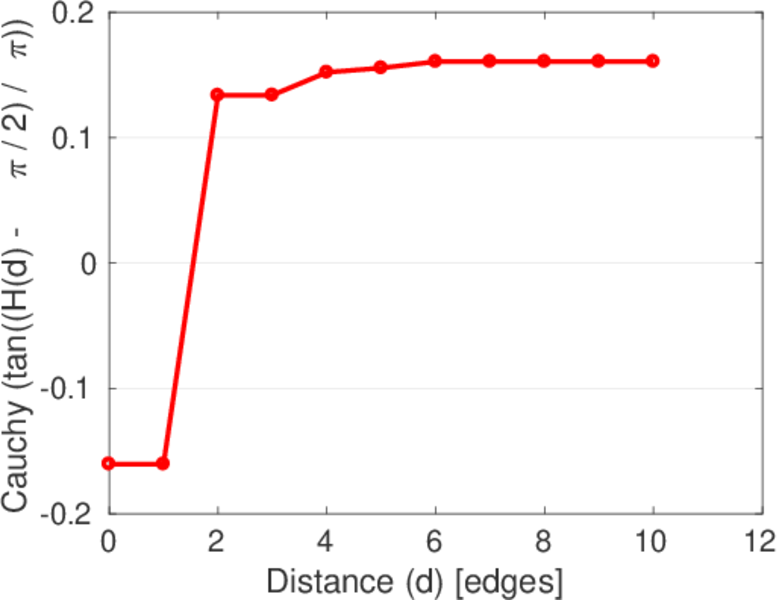
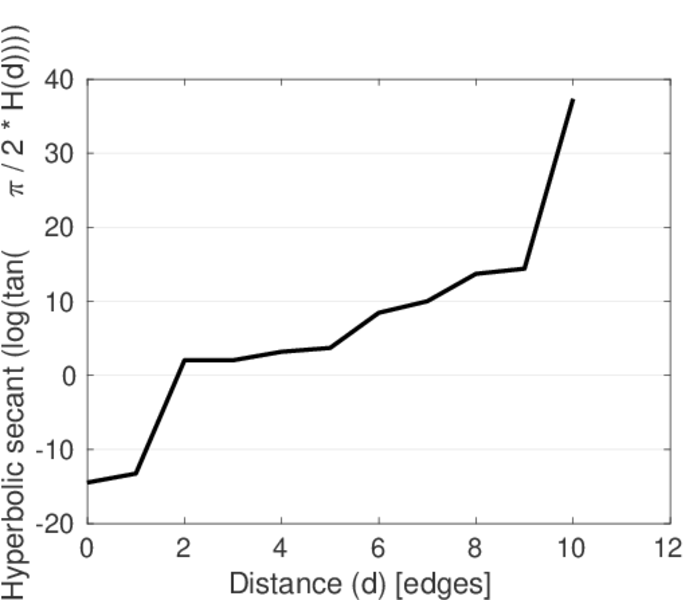
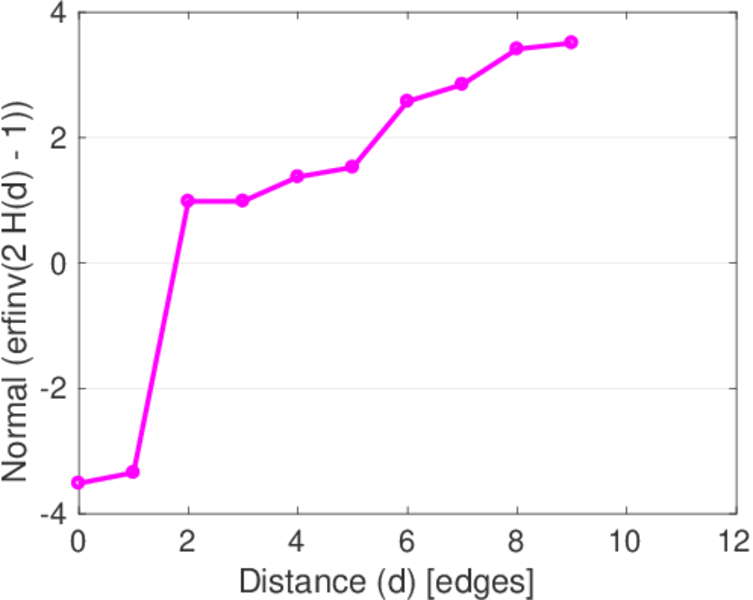
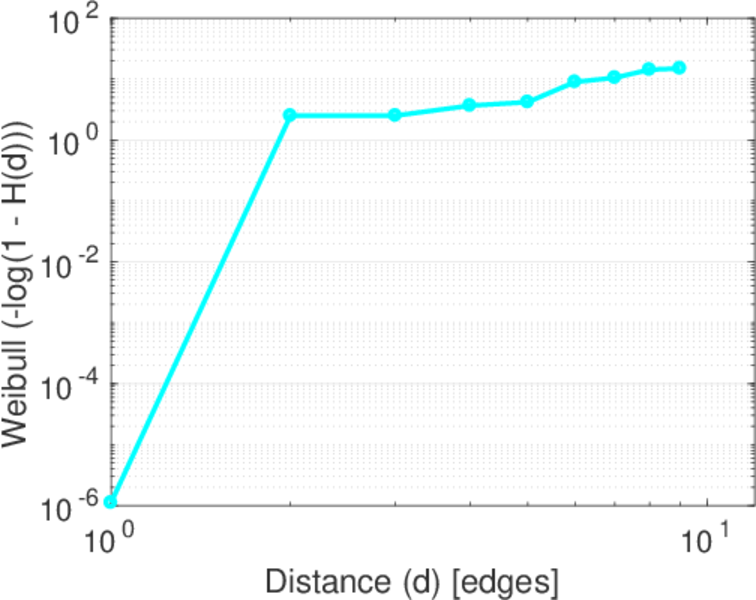
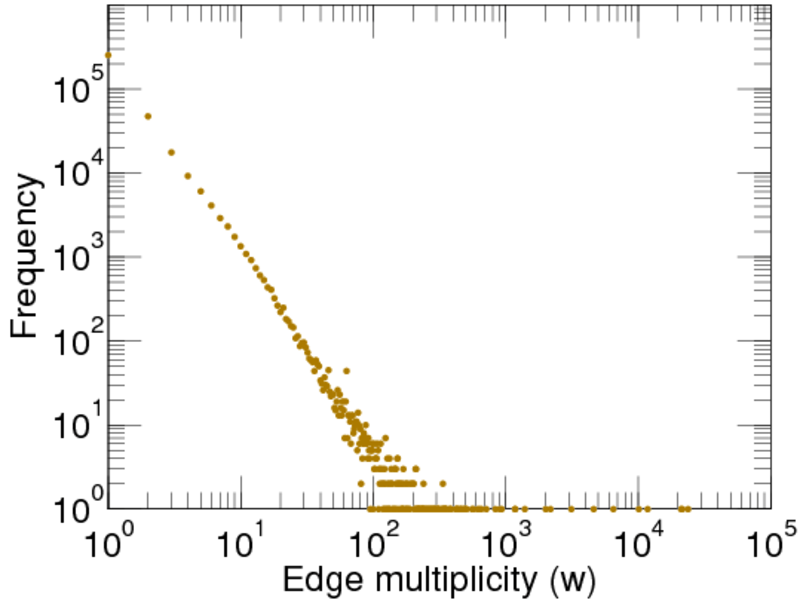
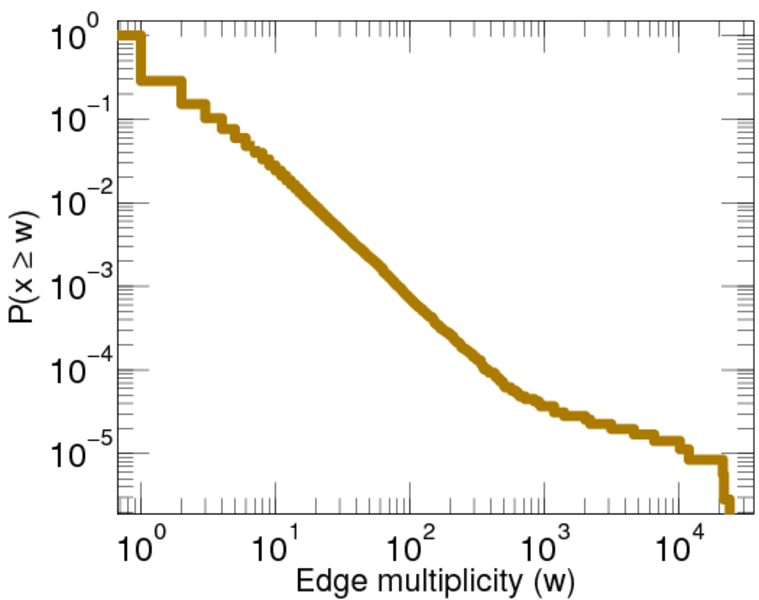
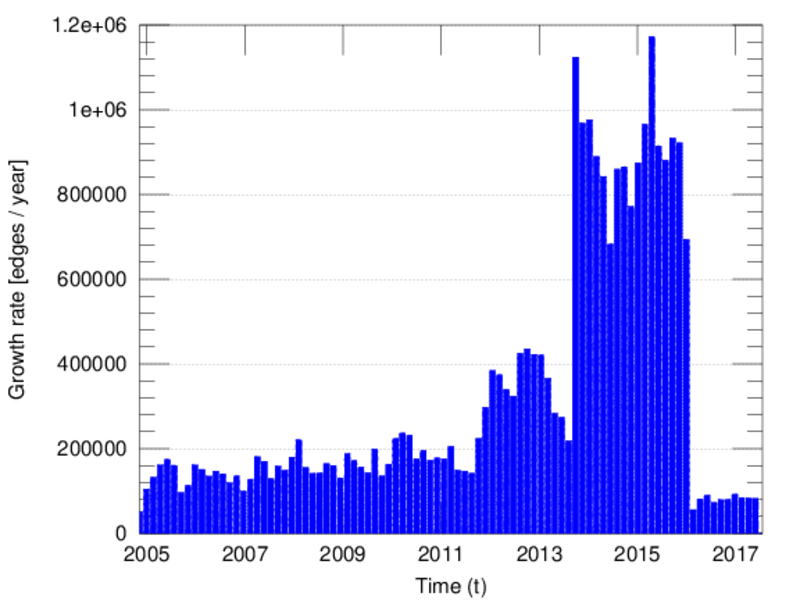
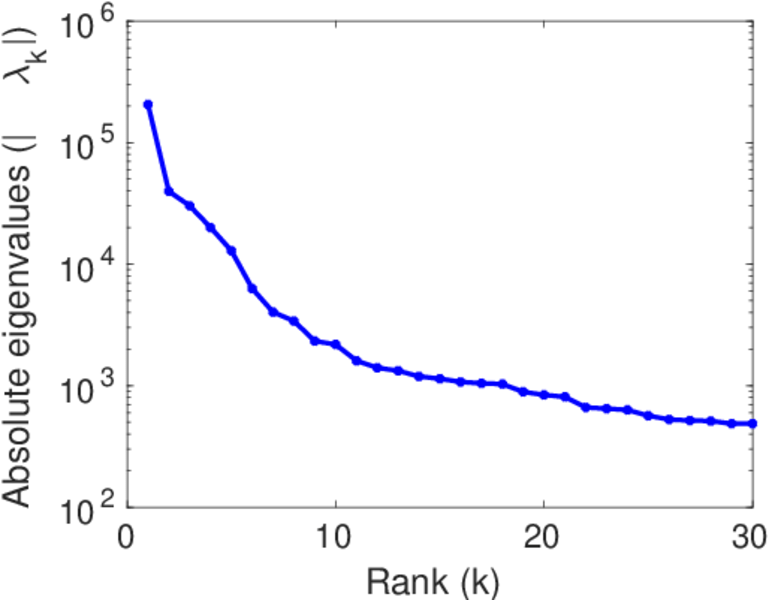
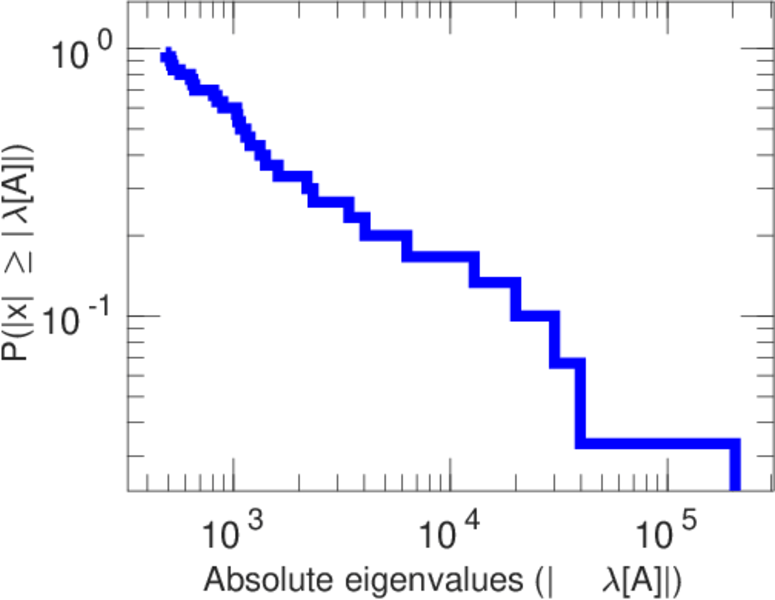
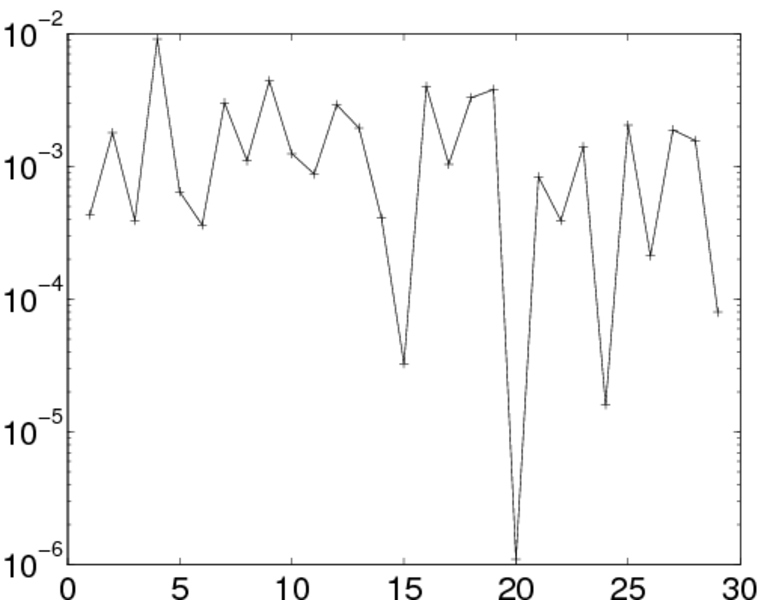
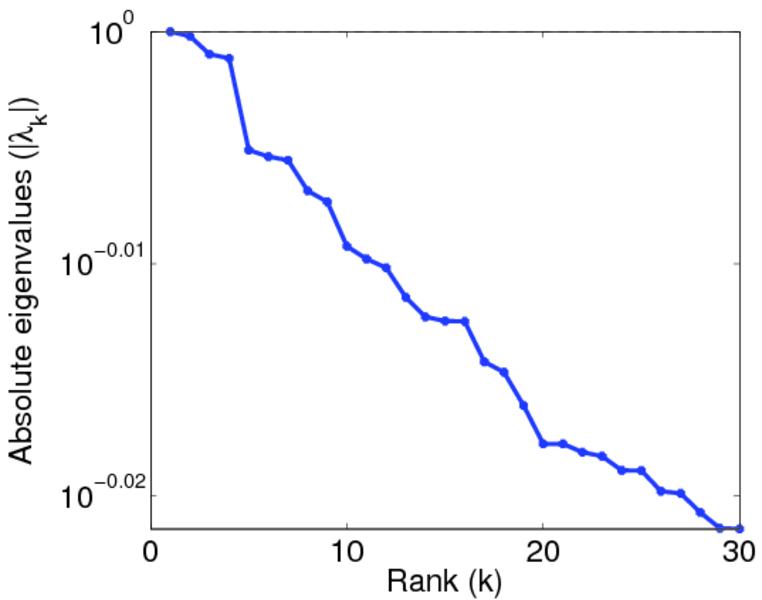
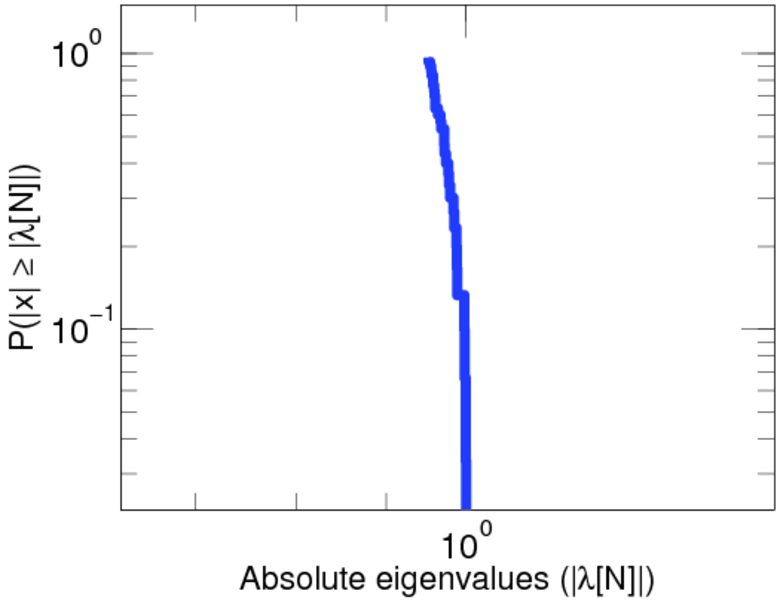
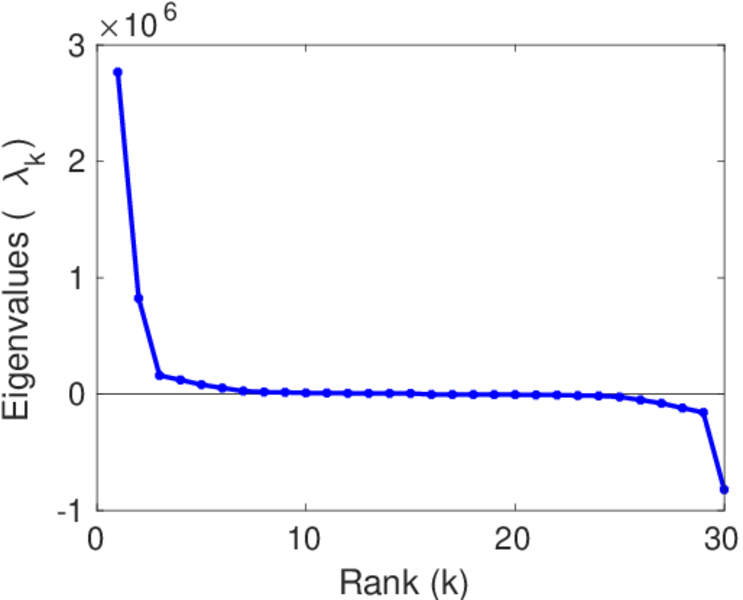
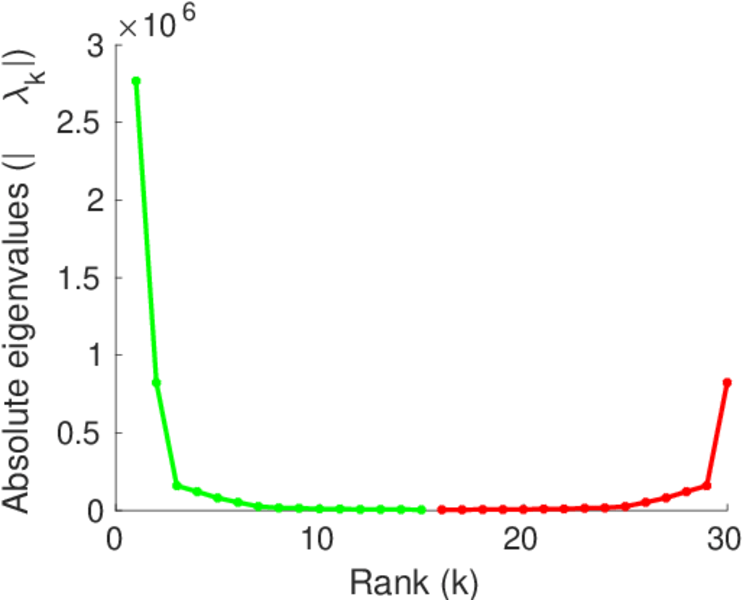
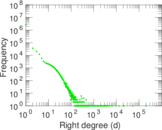
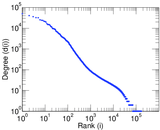
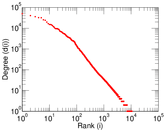
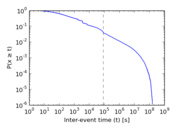
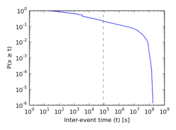
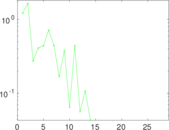
Plots


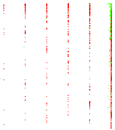

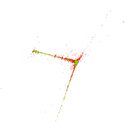


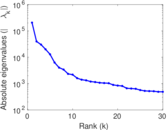
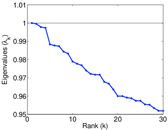
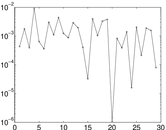
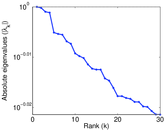
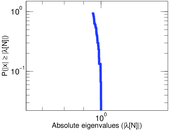
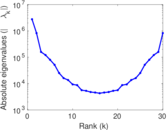
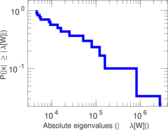
Matrix decompositions plots


Downloads
References
|
[1]
|
Jérôme Kunegis.
KONECT – The Koblenz Network Collection.
In Proc. Int. Conf. on World Wide Web Companion, pages
1343–1350, 2013.
[ http ]
|
|
[2]
|
Wikimedia Foundation.
Wikimedia downloads.
http://dumps.wikimedia.org/, January 2010.
|
 KONECT ‣ Networks ‣
Buy Me a Coffee
KONECT ‣ Networks ‣
Buy Me a Coffee