Wiktionary edits (en)
This is the bipartite edit network of the English Wiktionary. It contains users
and pages from the English Wiktionary, connected by edit events. Each edge
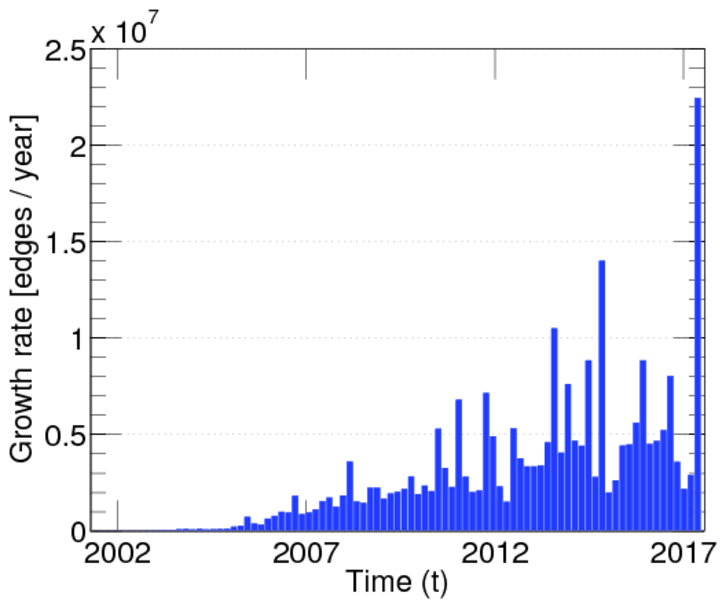
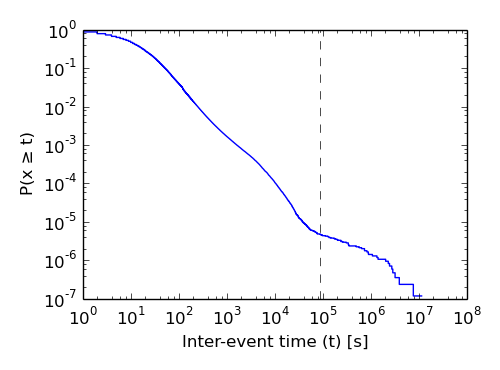
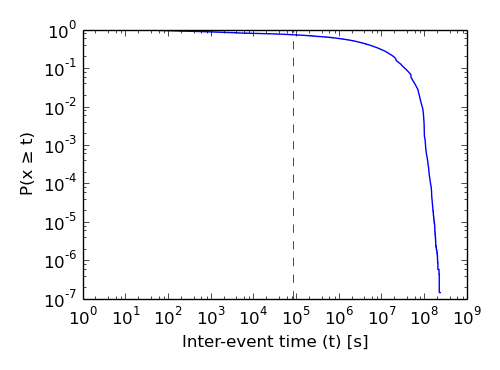
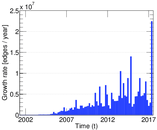
represents an edit. The dataset includes the timestamp of each edit.
Metadata
Statistics
| Size | n = | 5,892,253
|
| Left size | n1 = | 66,140
|
| Right size | n2 = | 5,826,113
|
| Volume | m = | 44,788,448
|
| Unique edge count | m̿ = | 27,120,425
|
| Wedge count | s = | 18,113,429,459,006
|
| Claw count | z = | 1.541 61 × 1019
|
| Cross count | x = | 1.292 98 × 1022
|
| Square count | q = | 113,806,587,655
|
| 4-Tour count | T4 = | 3,110,171,287,160
|
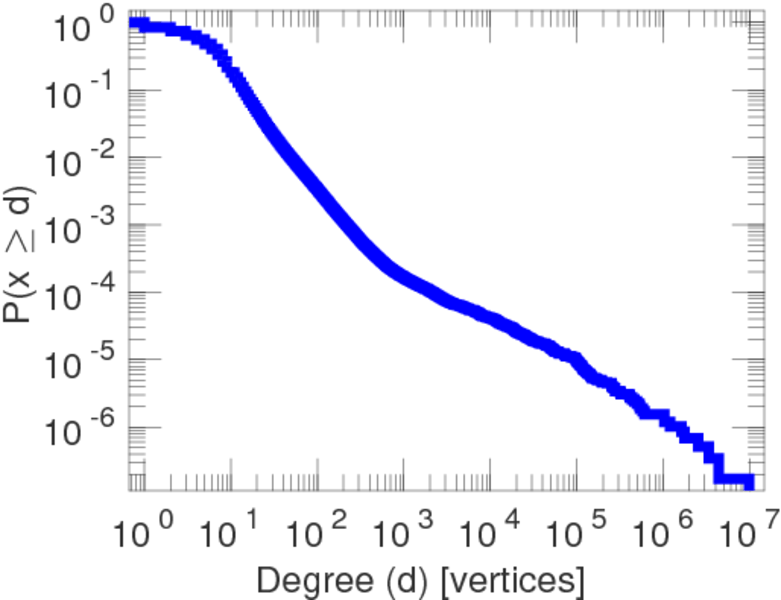
| Maximum degree | dmax = | 9,741,046
|
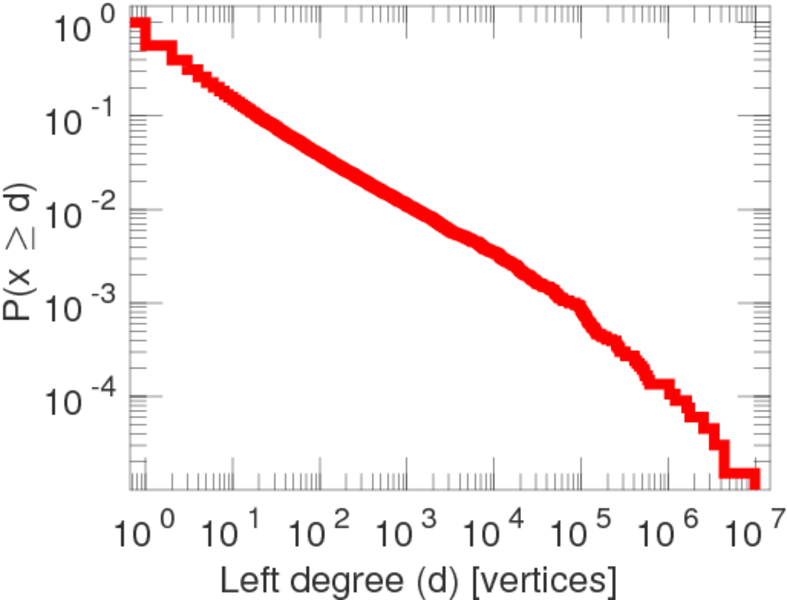
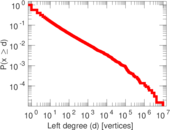
| Maximum left degree | d1max = | 9,741,046
|
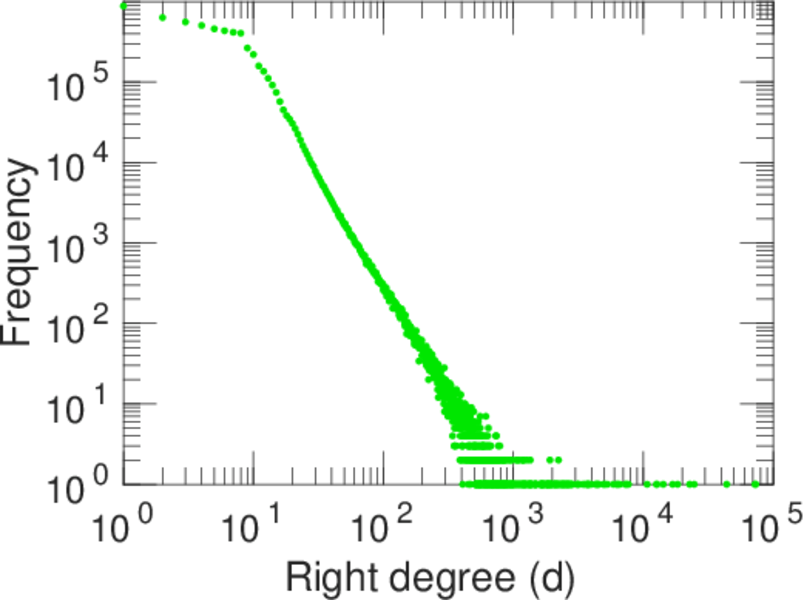
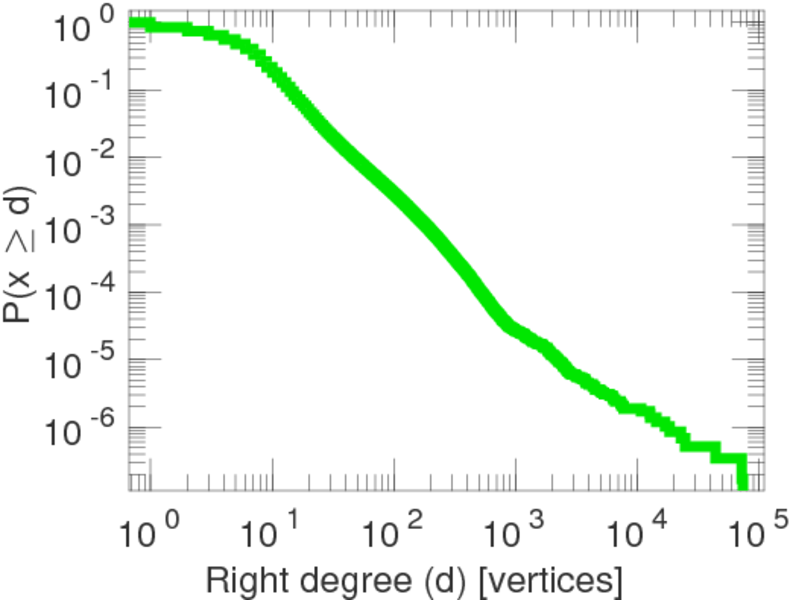
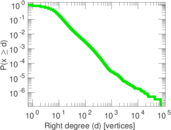
| Maximum right degree | d2max = | 73,512
|
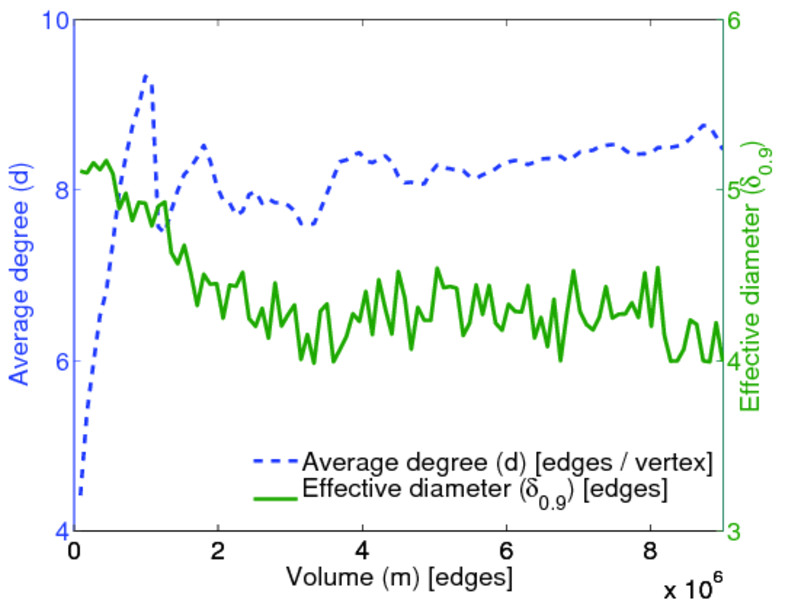
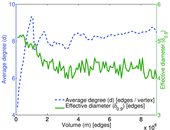
| Average degree | d = | 15.202 5
|
| Average left degree | d1 = | 677.176
|
| Average right degree | d2 = | 7.687 54
|
| Fill | p = | 9.023 09 × 10−5
|
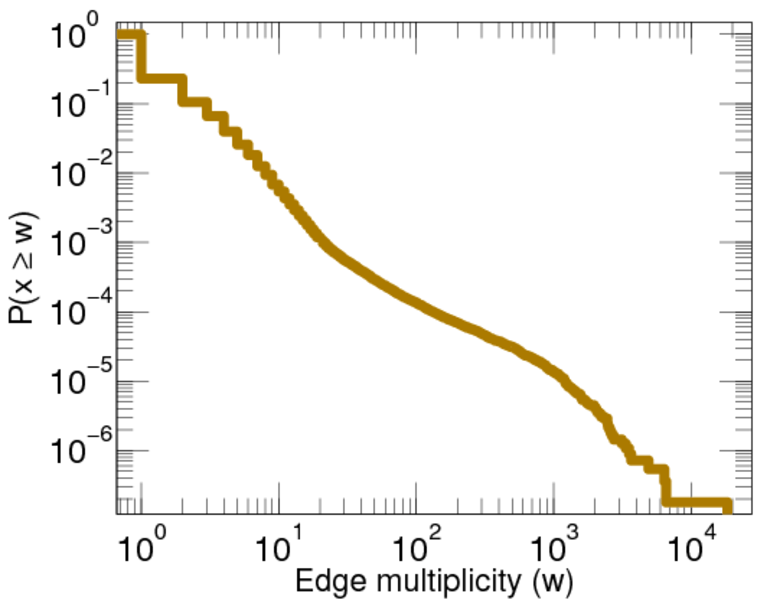
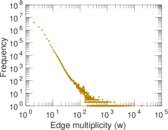
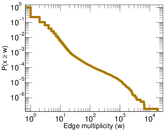
| Average edge multiplicity | m̃ = | 1.651 47
|
| Size of LCC | N = | 5,872,097
|
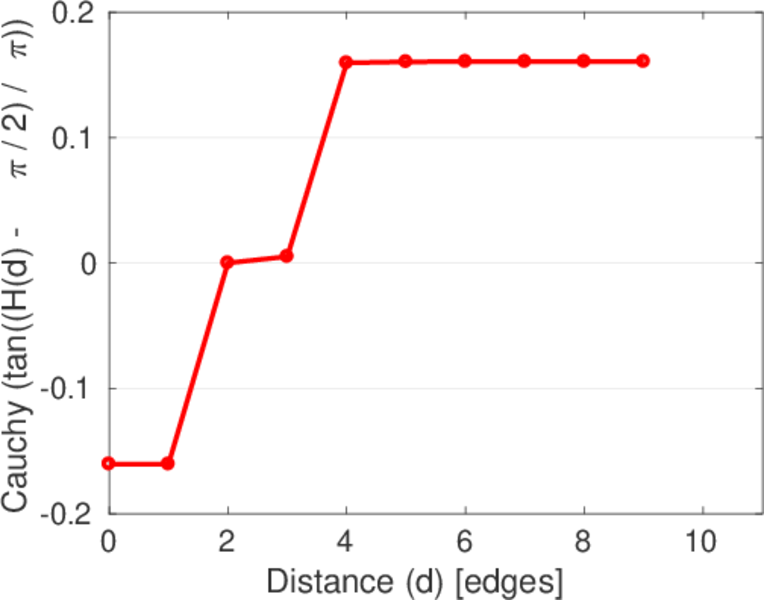
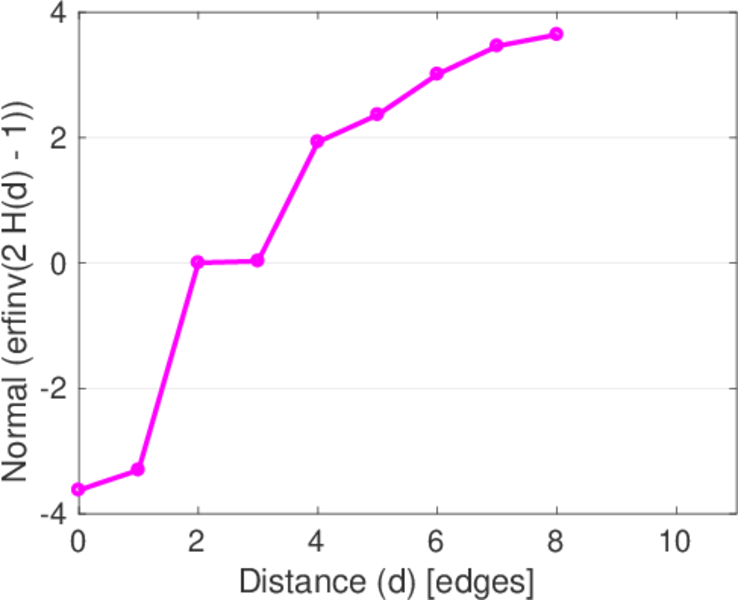
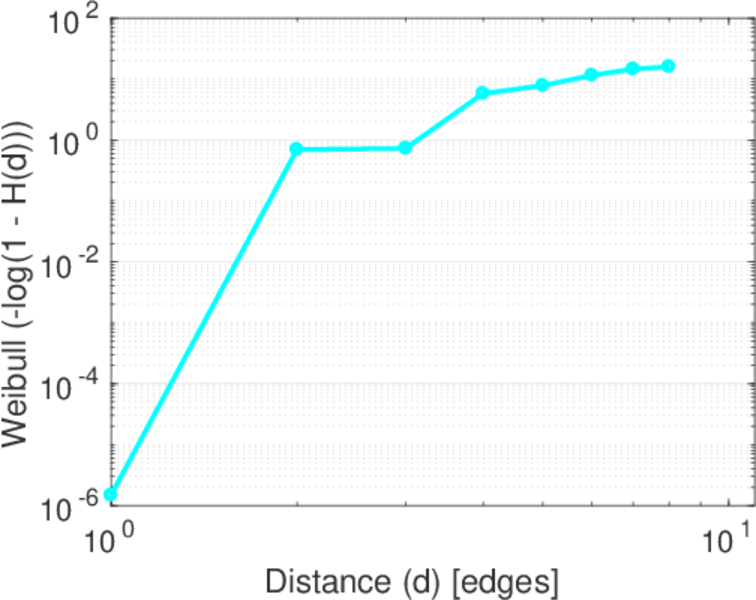
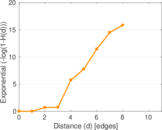
| Diameter | δ = | 13
|
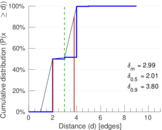
| 50-Percentile effective diameter | δ0.5 = | 2.013 82
|
| 90-Percentile effective diameter | δ0.9 = | 3.798 79
|
| Median distance | δM = | 3
|
| Mean distance | δm = | 2.988 18
|
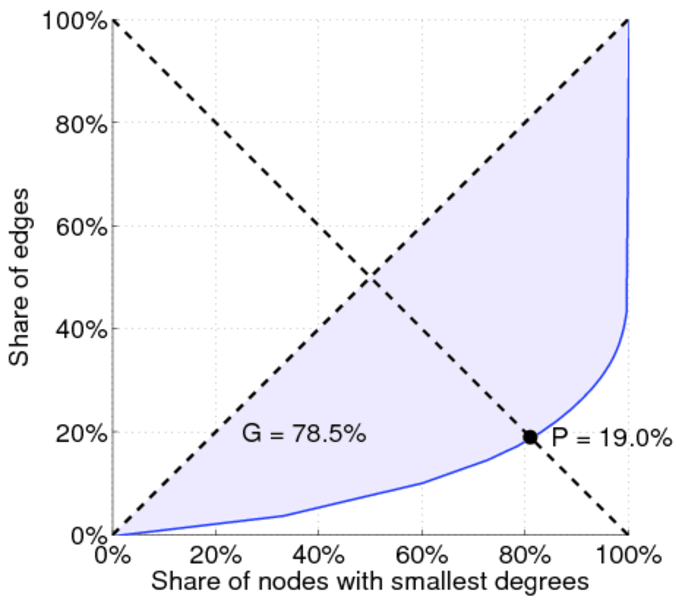
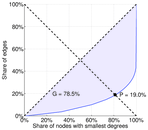
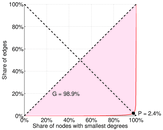
| Gini coefficient | G = | 0.787 243
|
| Balanced inequality ratio | P = | 0.213 660
|
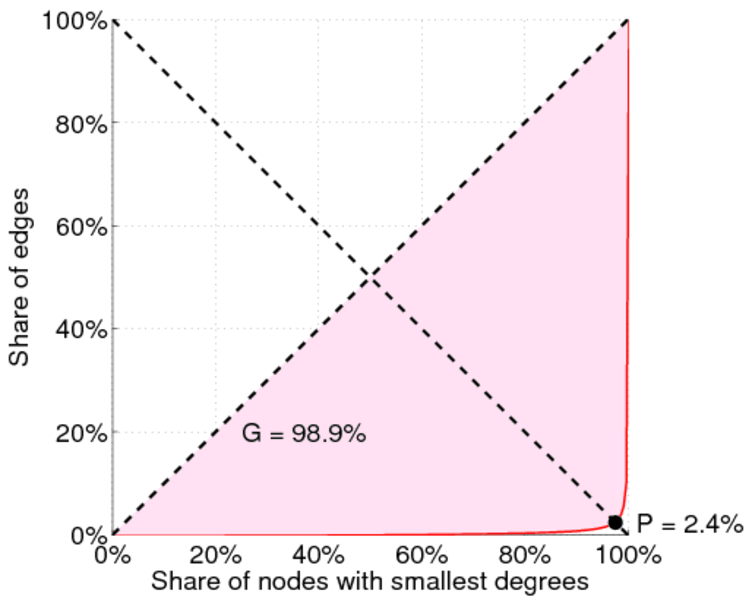
| Left balanced inequality ratio | P1 = | 0.012 801 4
|
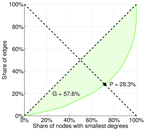
| Right balanced inequality ratio | P2 = | 0.317 634
|
| Relative edge distribution entropy | Her = | 0.668 305
|
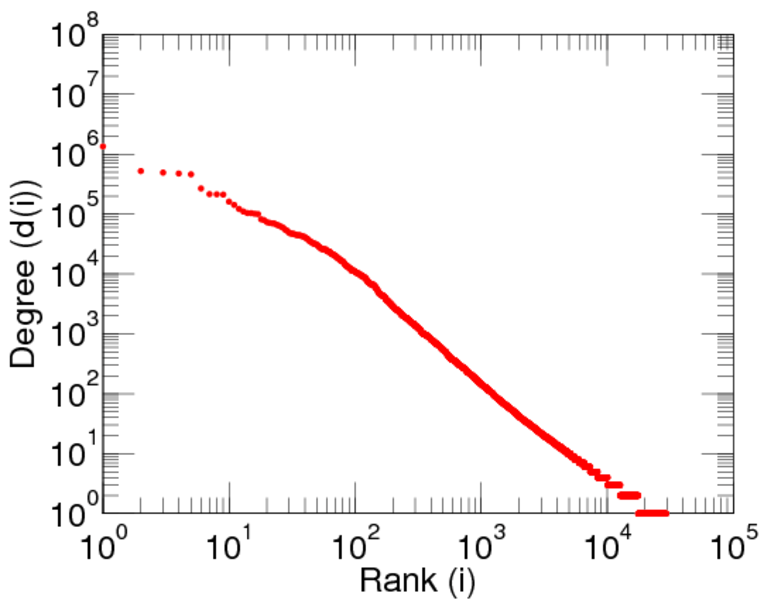
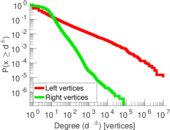
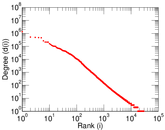
| Power law exponent | γ = | 1.826 85
|
| Tail power law exponent | γt = | 2.711 00
|
| Degree assortativity | ρ = | −0.170 471
|
| Degree assortativity p-value | pρ = | 0.000 00
|
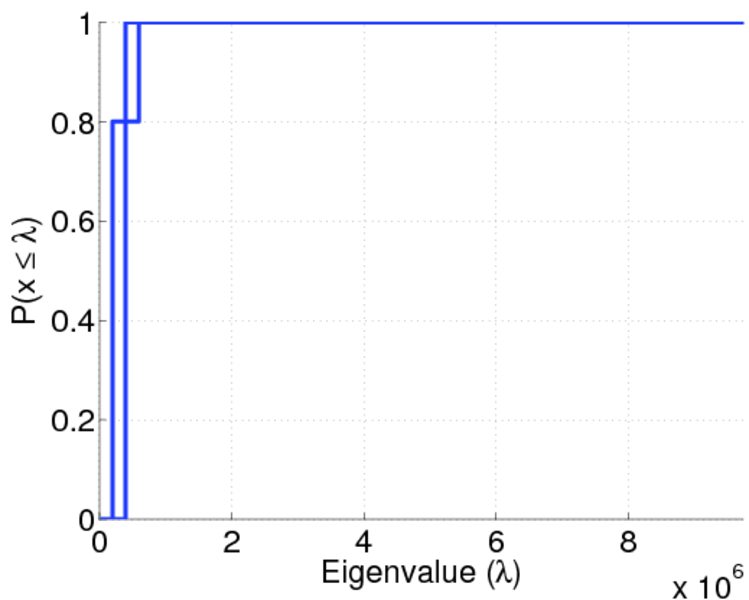
| Spectral norm | α = | 21,394.4
|
| Algebraic connectivity | a = | 0.035 512 4
|
| Spectral separation | |λ1[A] / λ2[A]| = | 1.198 71
|
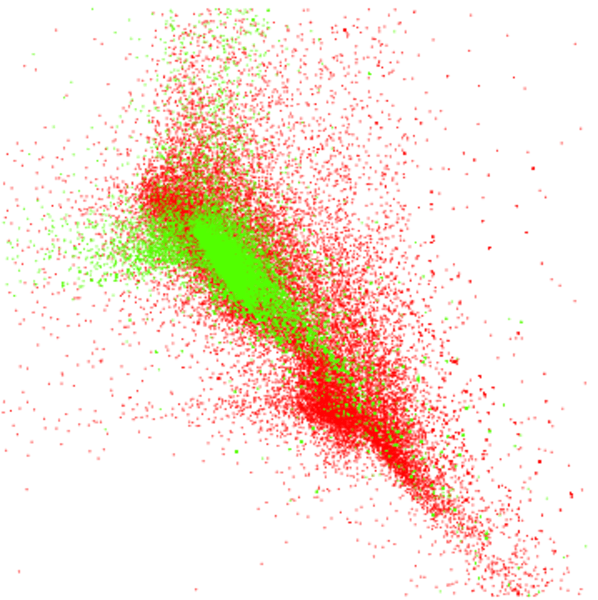
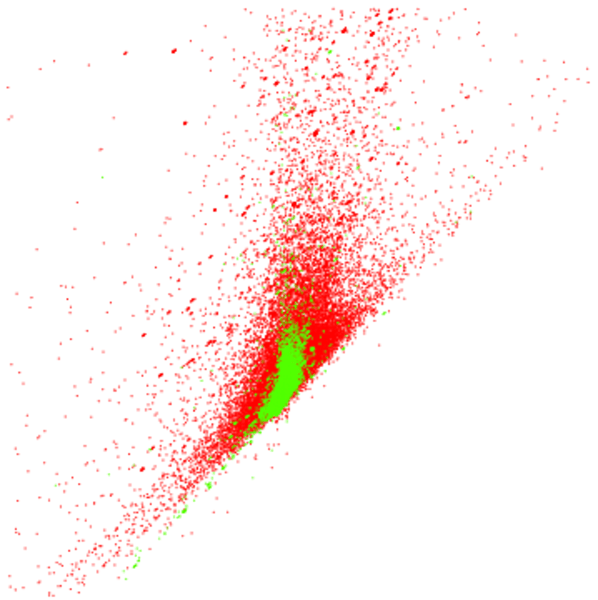
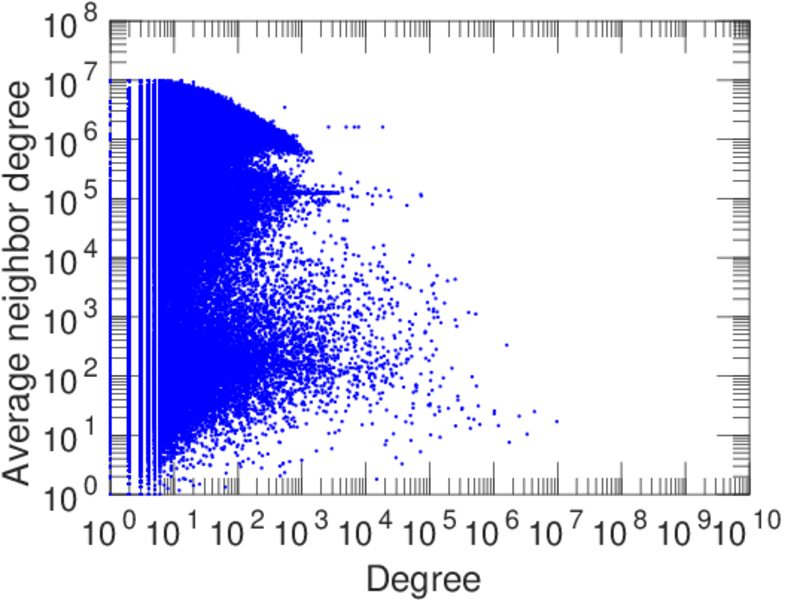
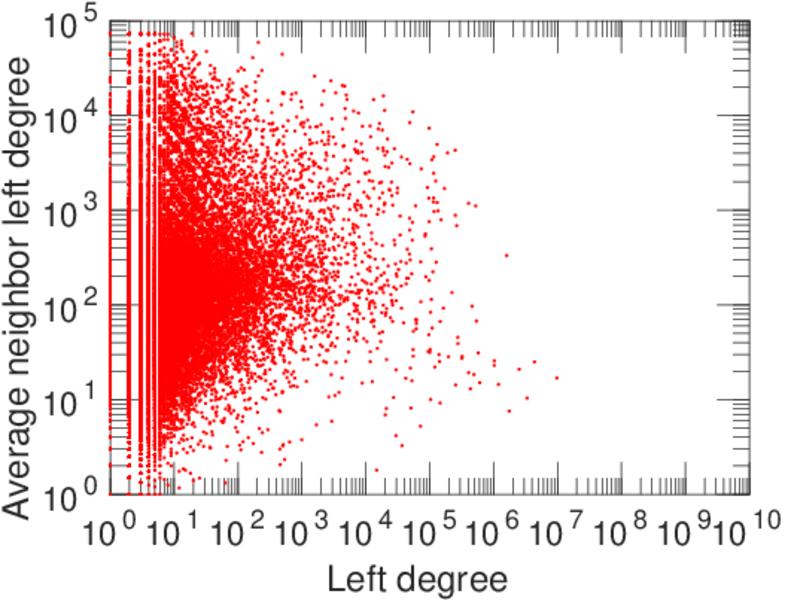
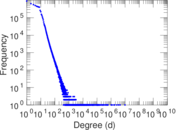
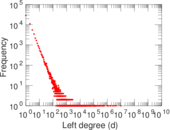
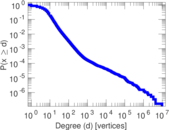
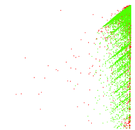
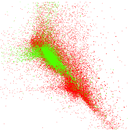
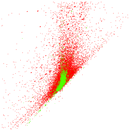
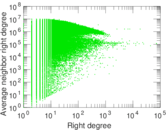
Plots


Downloads
References
|
[1]
|
Jérôme Kunegis.
KONECT – The Koblenz Network Collection.
In Proc. Int. Conf. on World Wide Web Companion, pages
1343–1350, 2013.
[ http ]
|
|
[2]
|
Wikimedia Foundation.
Wikimedia downloads.
http://dumps.wikimedia.org/, January 2010.
|
 KONECT ‣ Networks ‣
Buy Me a Coffee
KONECT ‣ Networks ‣
Buy Me a Coffee