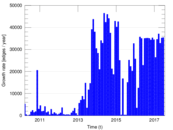
Wikinews edits (eo)
This is the bipartite edit network of the Esperanto Wikinews. It contains users
and pages from the Esperanto Wikinews, connected by edit events. Each edge
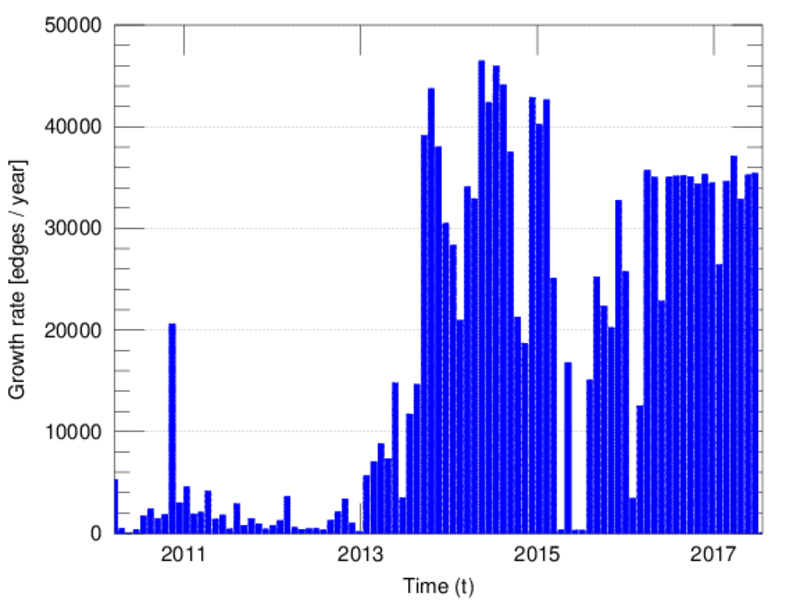
represents an edit. The dataset includes the timestamp of each edit.
Metadata
Statistics
| Size | n = | 6,031
|
| Left size | n1 = | 277
|
| Right size | n2 = | 5,754
|
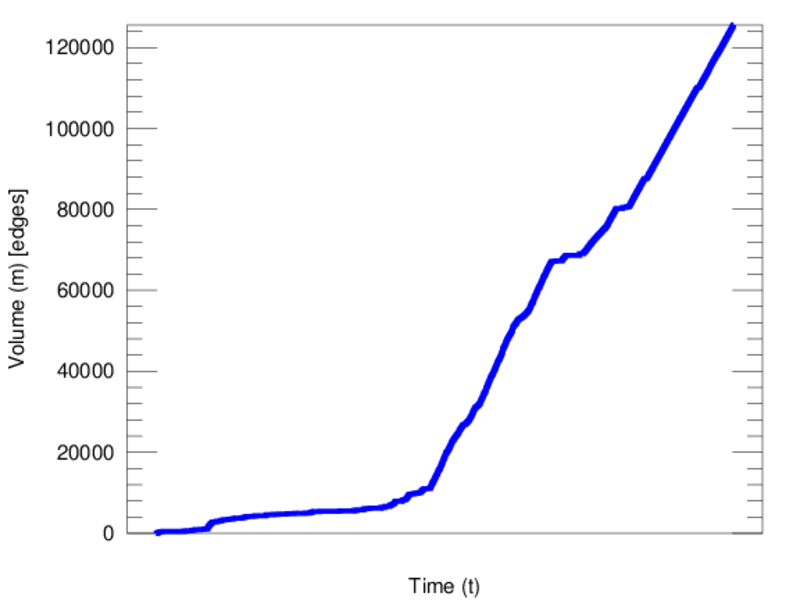
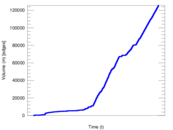
| Volume | m = | 125,544
|
| Unique edge count | m̿ = | 11,040
|
| Wedge count | s = | 11,107,472
|
| Claw count | z = | 14,780,026,303
|
| Cross count | x = | 16,141,051,672,281
|
| Square count | q = | 798,424
|
| 4-Tour count | T4 = | 50,861,124
|
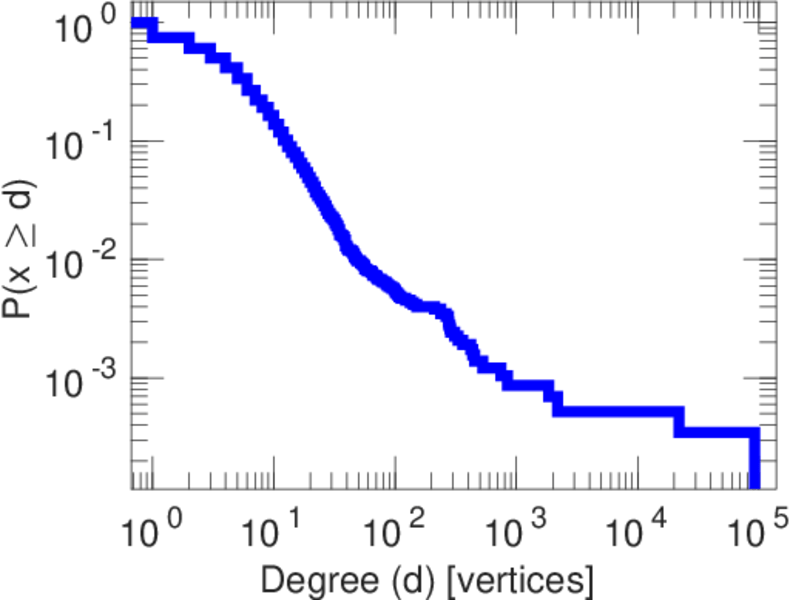
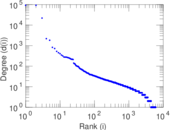
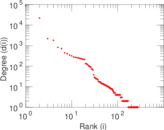
| Maximum degree | dmax = | 92,287
|
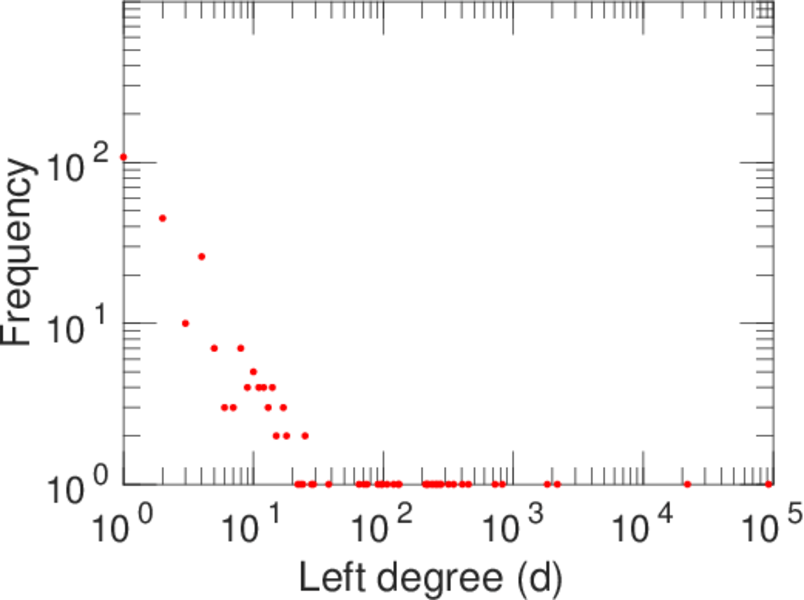
| Maximum left degree | d1max = | 92,275
|
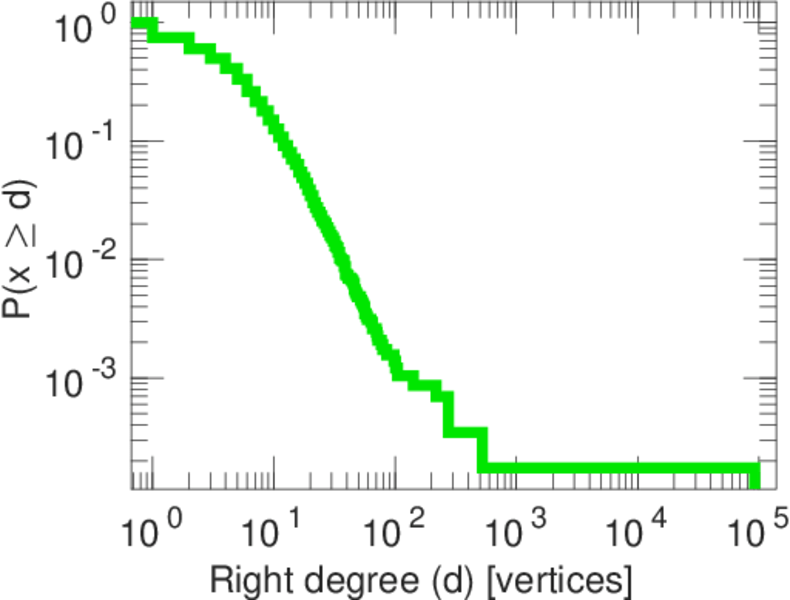
| Maximum right degree | d2max = | 92,287
|
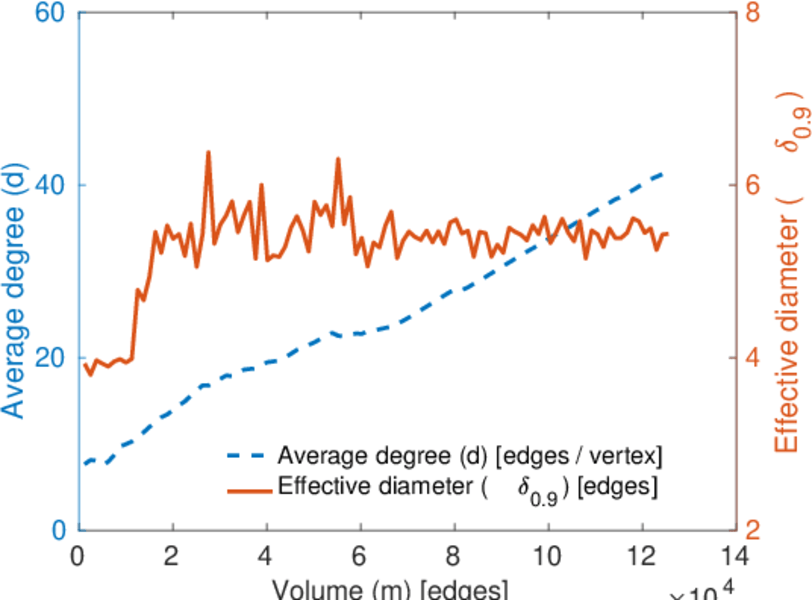
| Average degree | d = | 41.632 9
|
| Average left degree | d1 = | 453.227
|
| Average right degree | d2 = | 21.818 6
|
| Fill | p = | 0.006 926 59
|
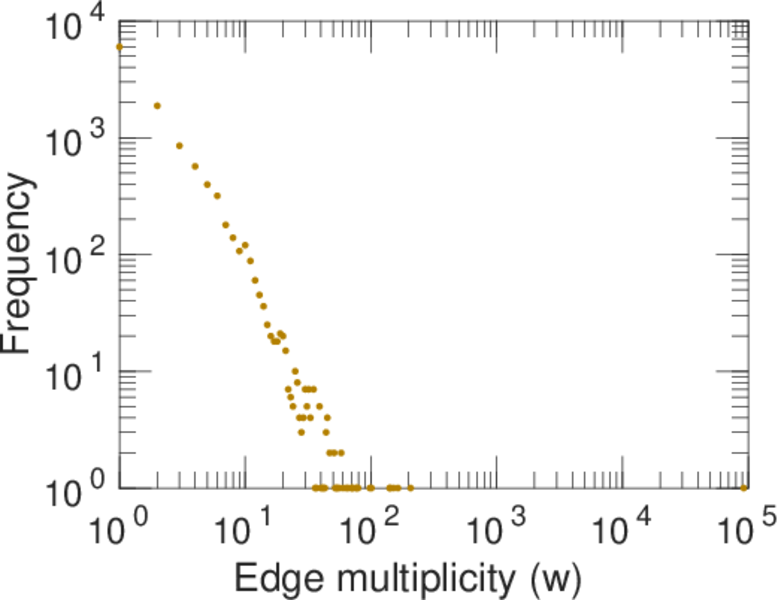
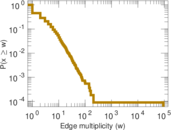
| Average edge multiplicity | m̃ = | 11.371 7
|
| Size of LCC | N = | 5,857
|
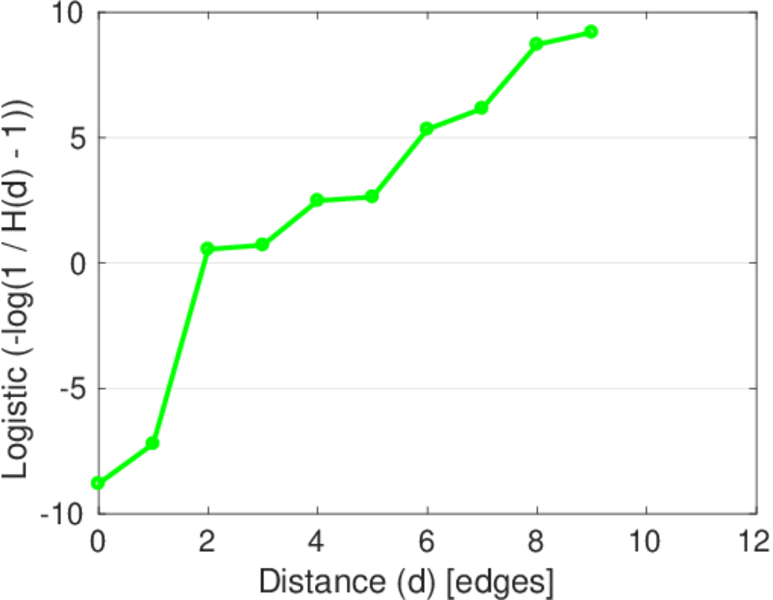
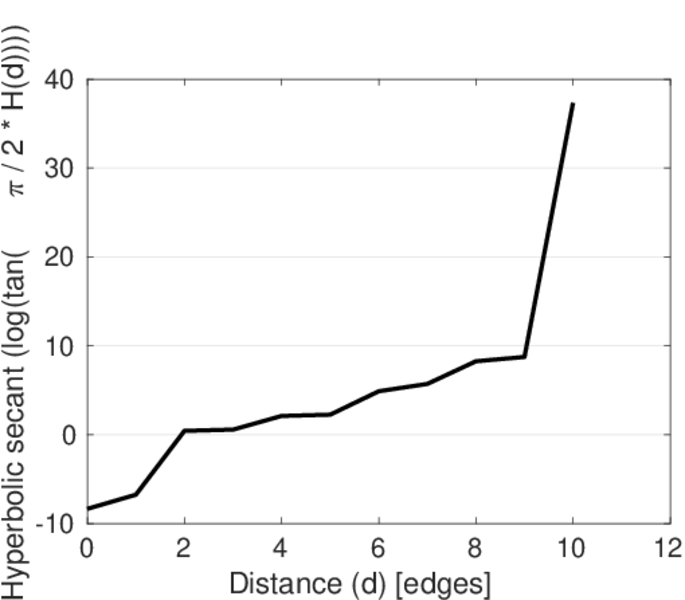
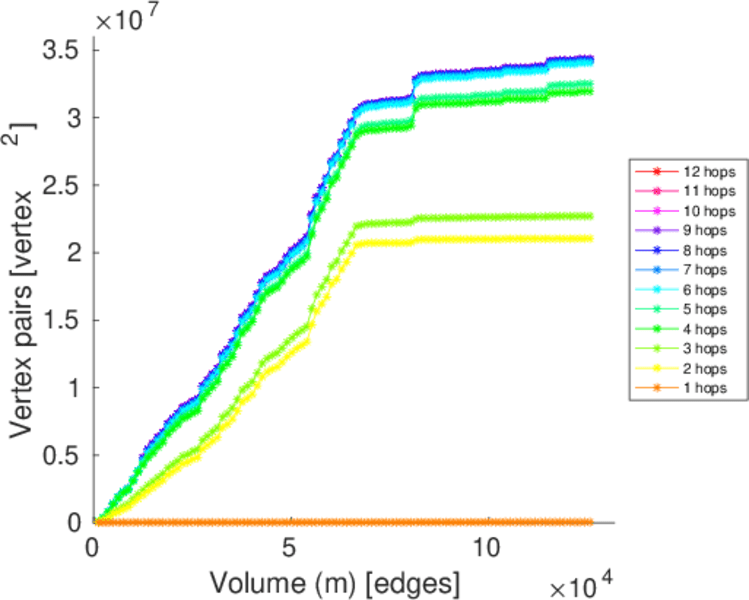
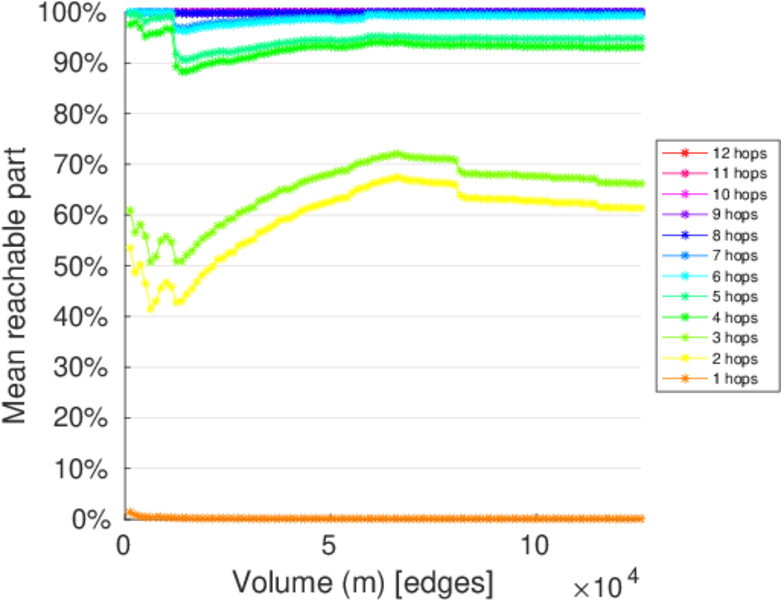
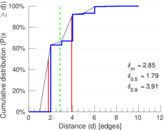
| Diameter | δ = | 12
|
| 50-Percentile effective diameter | δ0.5 = | 1.790 90
|
| 90-Percentile effective diameter | δ0.9 = | 3.910 44
|
| Median distance | δM = | 2
|
| Mean distance | δm = | 2.849 37
|
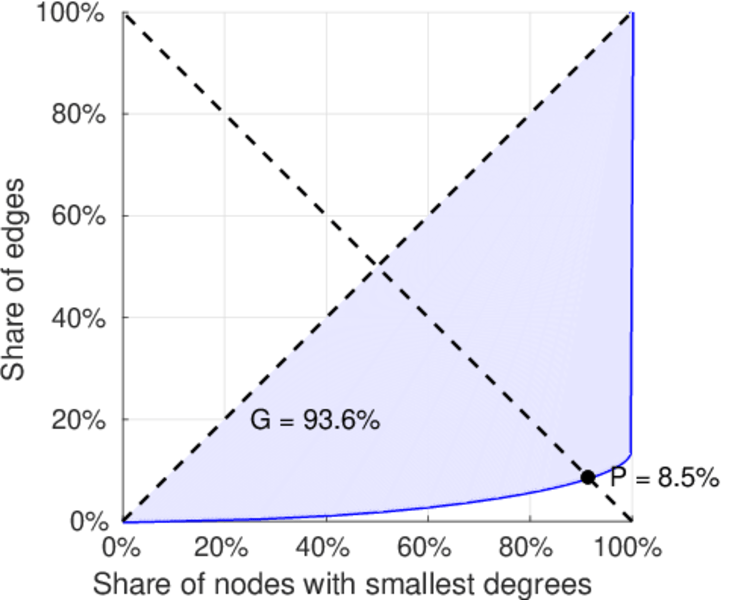
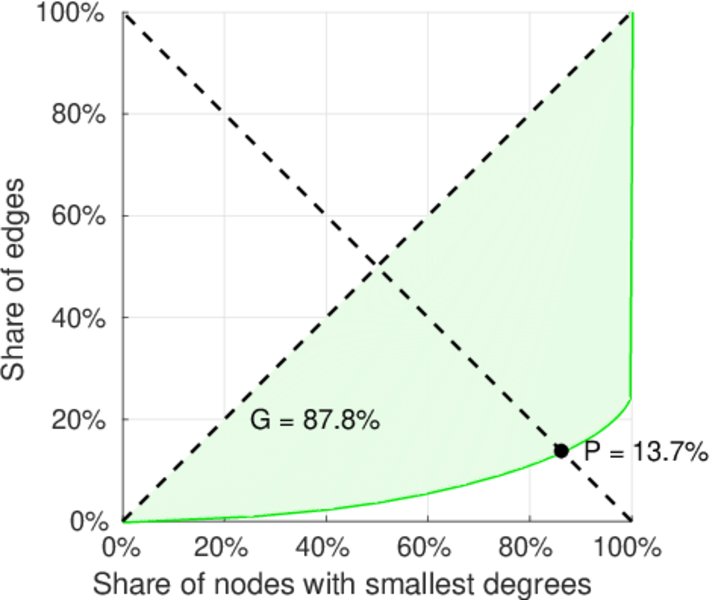
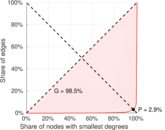
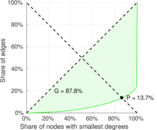
| Gini coefficient | G = | 0.937 024
|
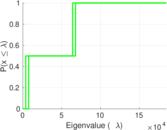
| Balanced inequality ratio | P = | 0.084 731 2
|
| Left balanced inequality ratio | P1 = | 0.029 400 1
|
| Right balanced inequality ratio | P2 = | 0.136 534
|
| Relative edge distribution entropy | Her = | 0.719 604
|
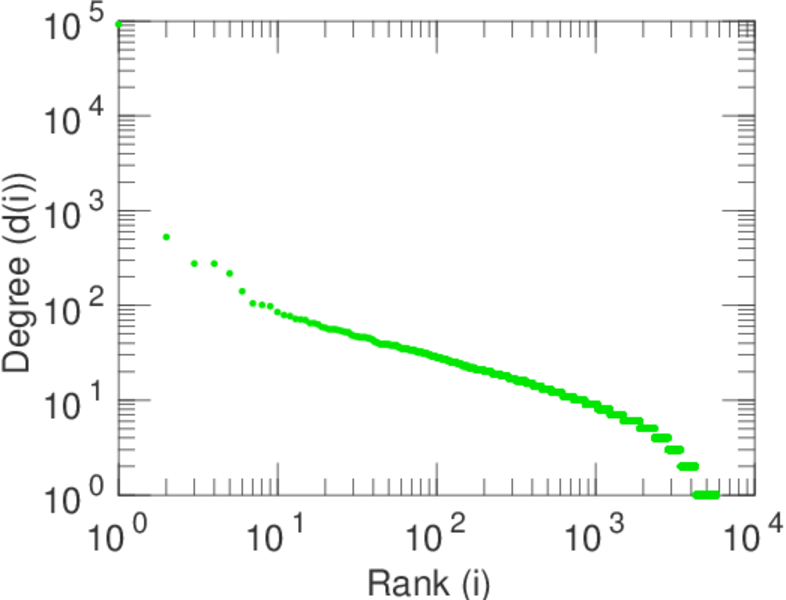
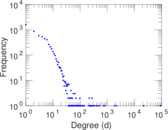
| Power law exponent | γ = | 3.195 70
|
| Tail power law exponent | γt = | 2.151 00
|
| Tail power law exponent with p | γ3 = | 2.151 00
|
| p-value | p = | 0.000 00
|
| Left tail power law exponent with p | γ3,1 = | 1.641 00
|
| Left p-value | p1 = | 0.313 000
|
| Right tail power law exponent with p | γ3,2 = | 6.121 00
|
| Right p-value | p2 = | 0.283 000
|
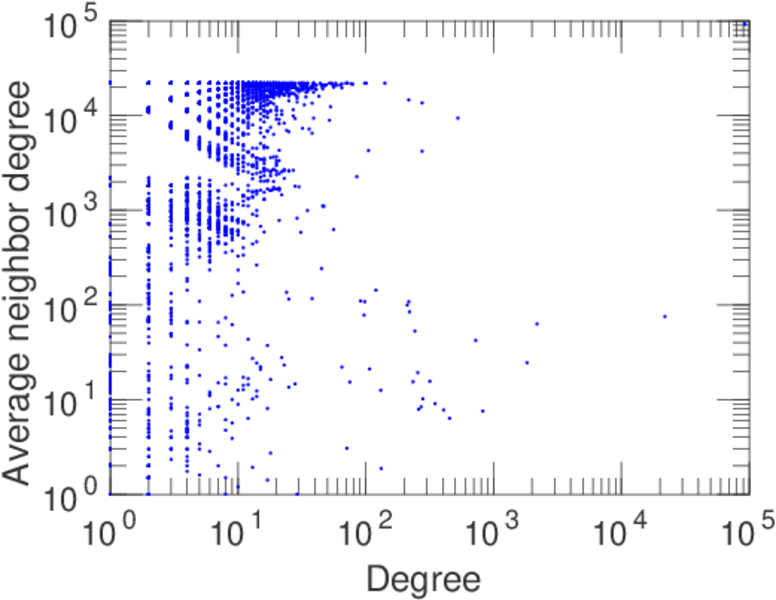
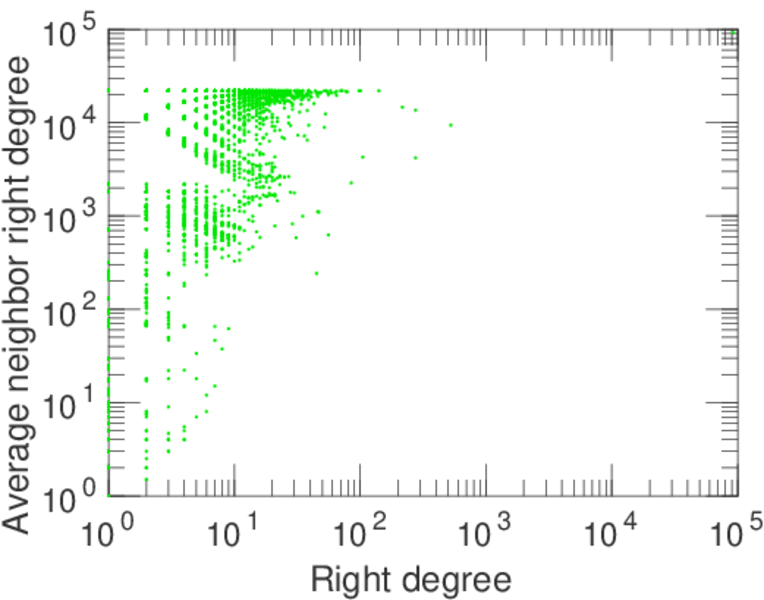
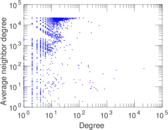
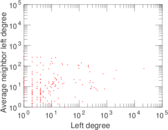
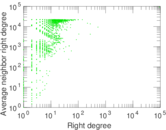
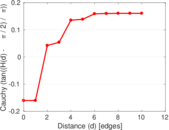
| Degree assortativity | ρ = | −0.455 045
|
| Degree assortativity p-value | pρ = | 0.000 00
|
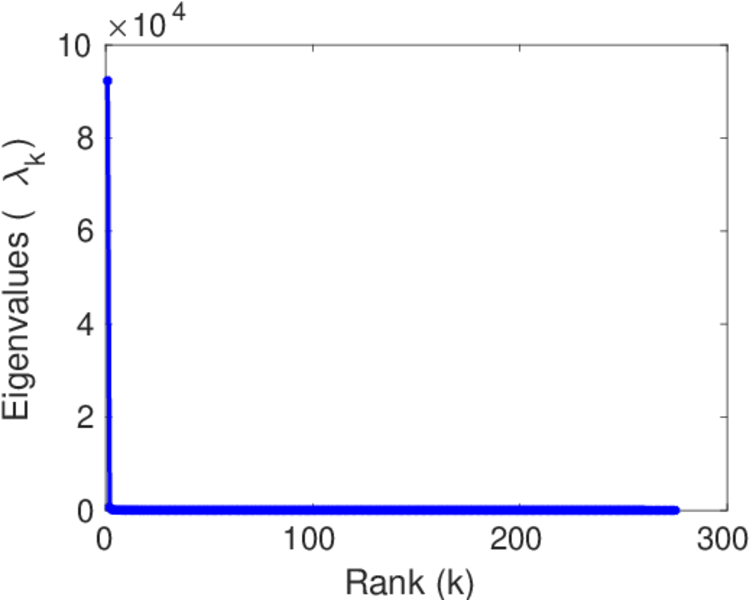
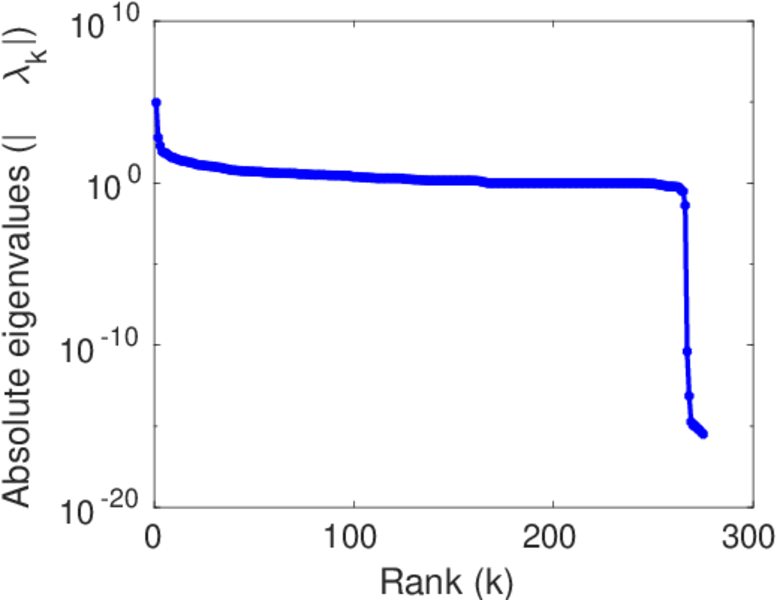
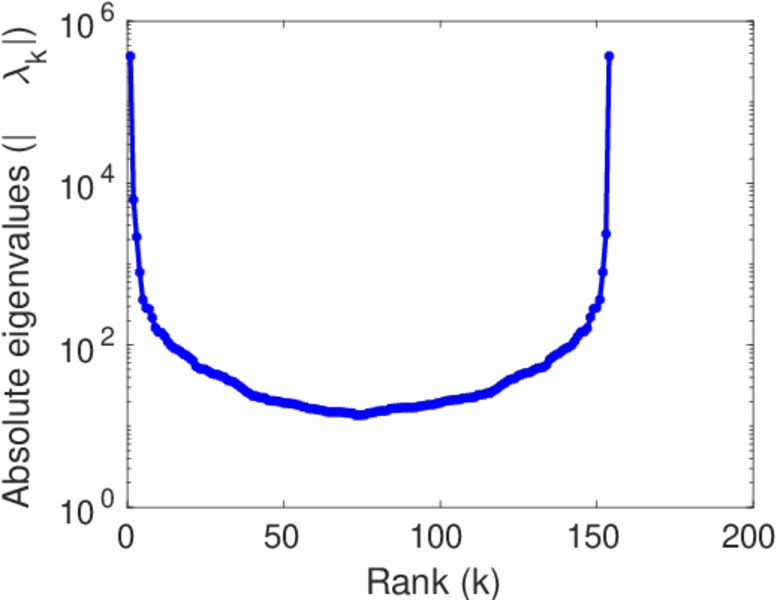
| Spectral norm | α = | 92,275.0
|
| Algebraic connectivity | a = | 0.021 372 2
|
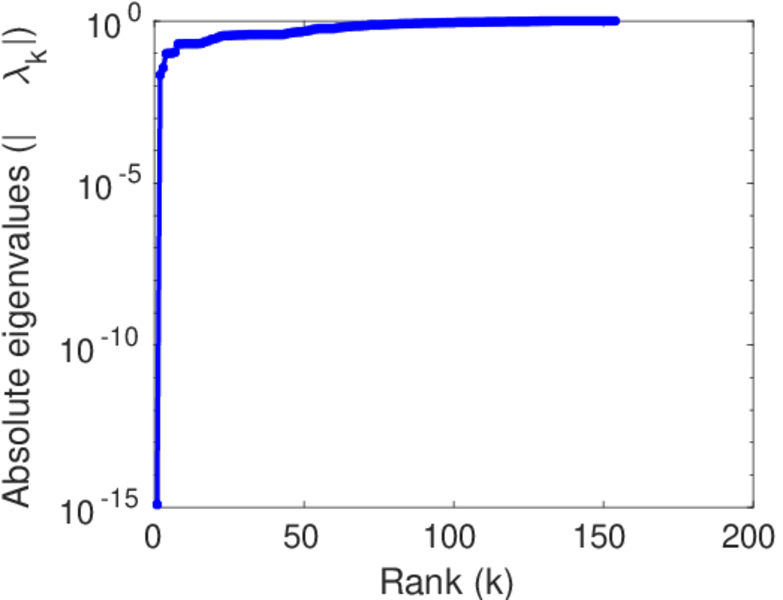
| Spectral separation | |λ1[A] / λ2[A]| = | 143.934
|
| Controllability | C = | 5,498
|
| Relative controllability | Cr = | 0.911 774
|
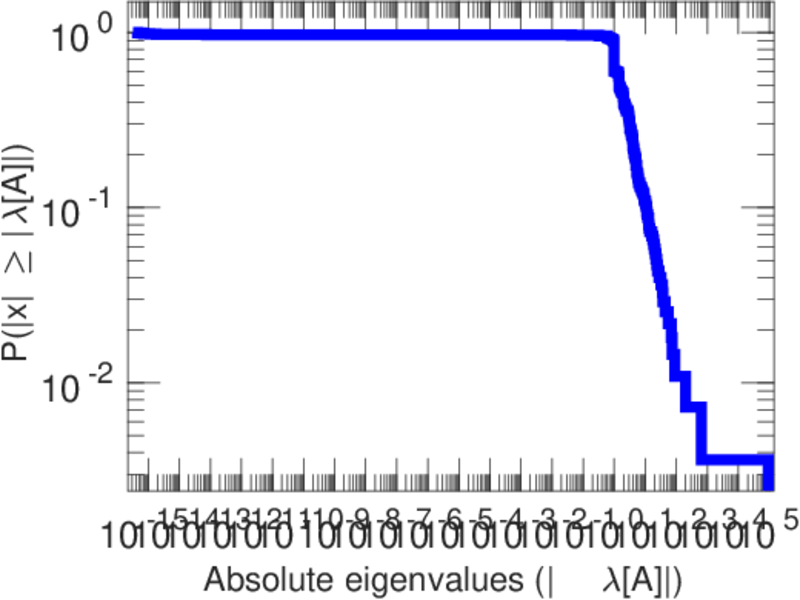
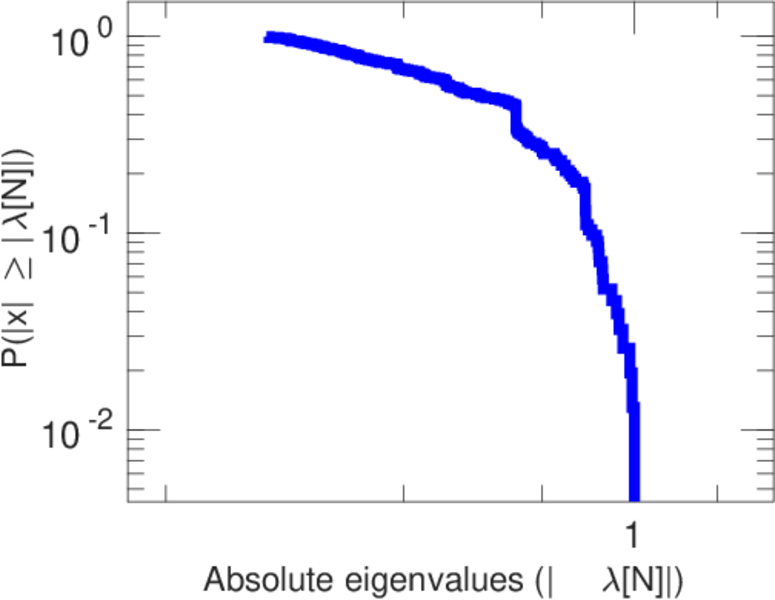
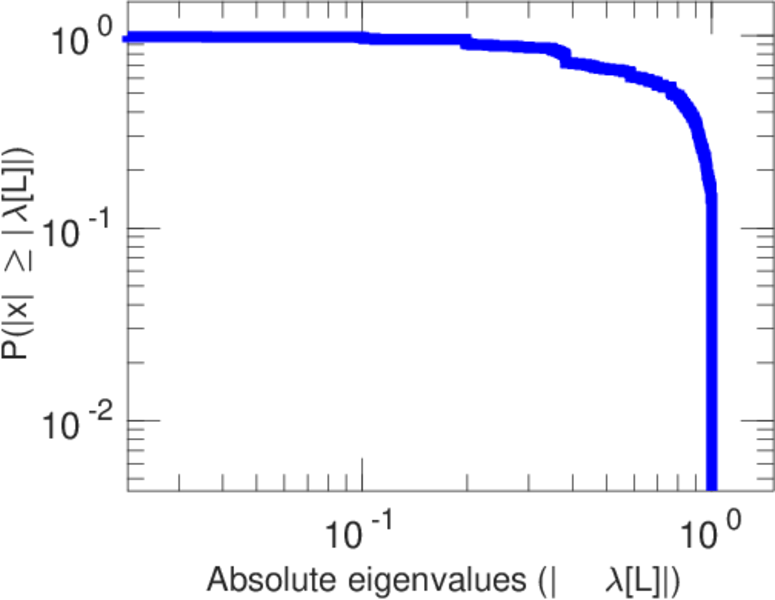
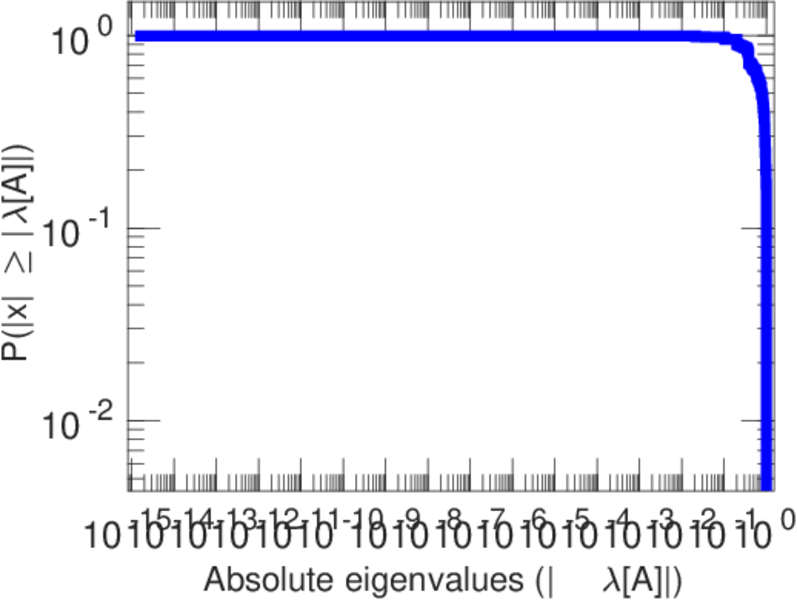
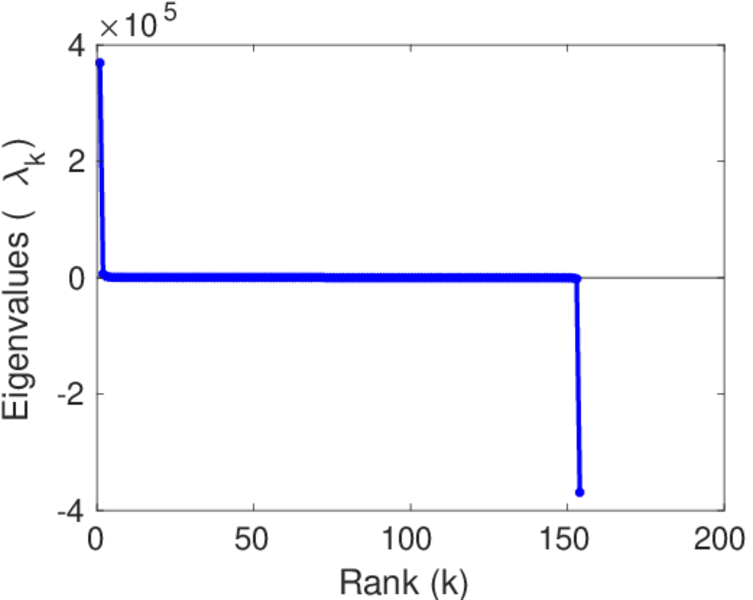
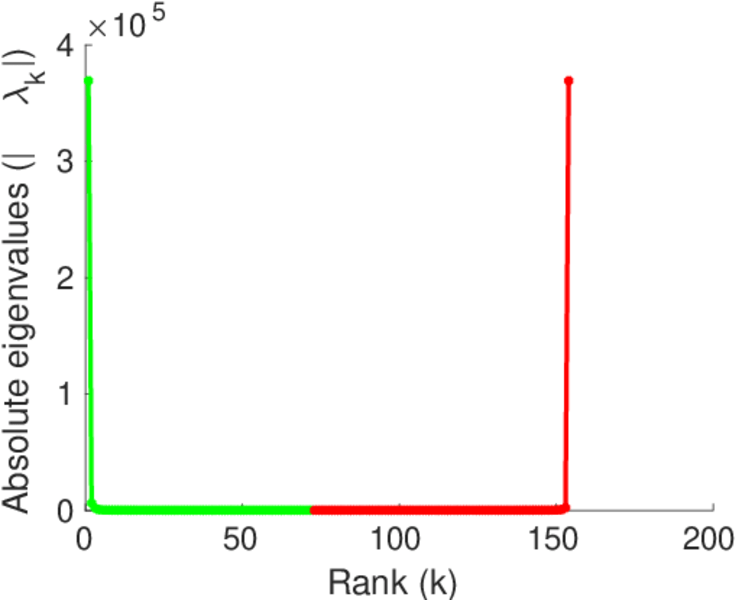
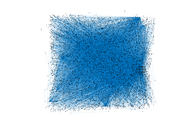
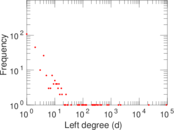
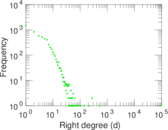
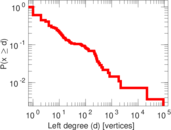
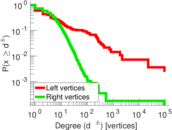
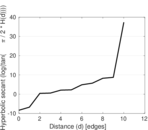
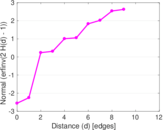
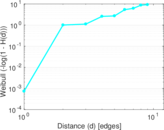
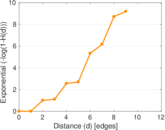
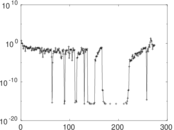
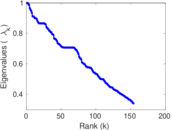
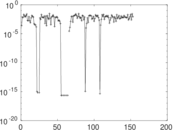
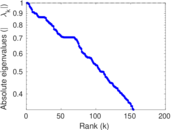
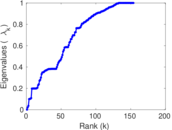
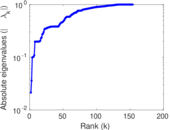
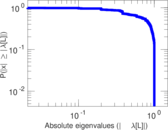
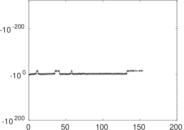
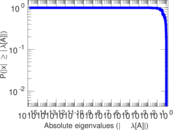
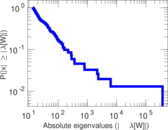
Plots


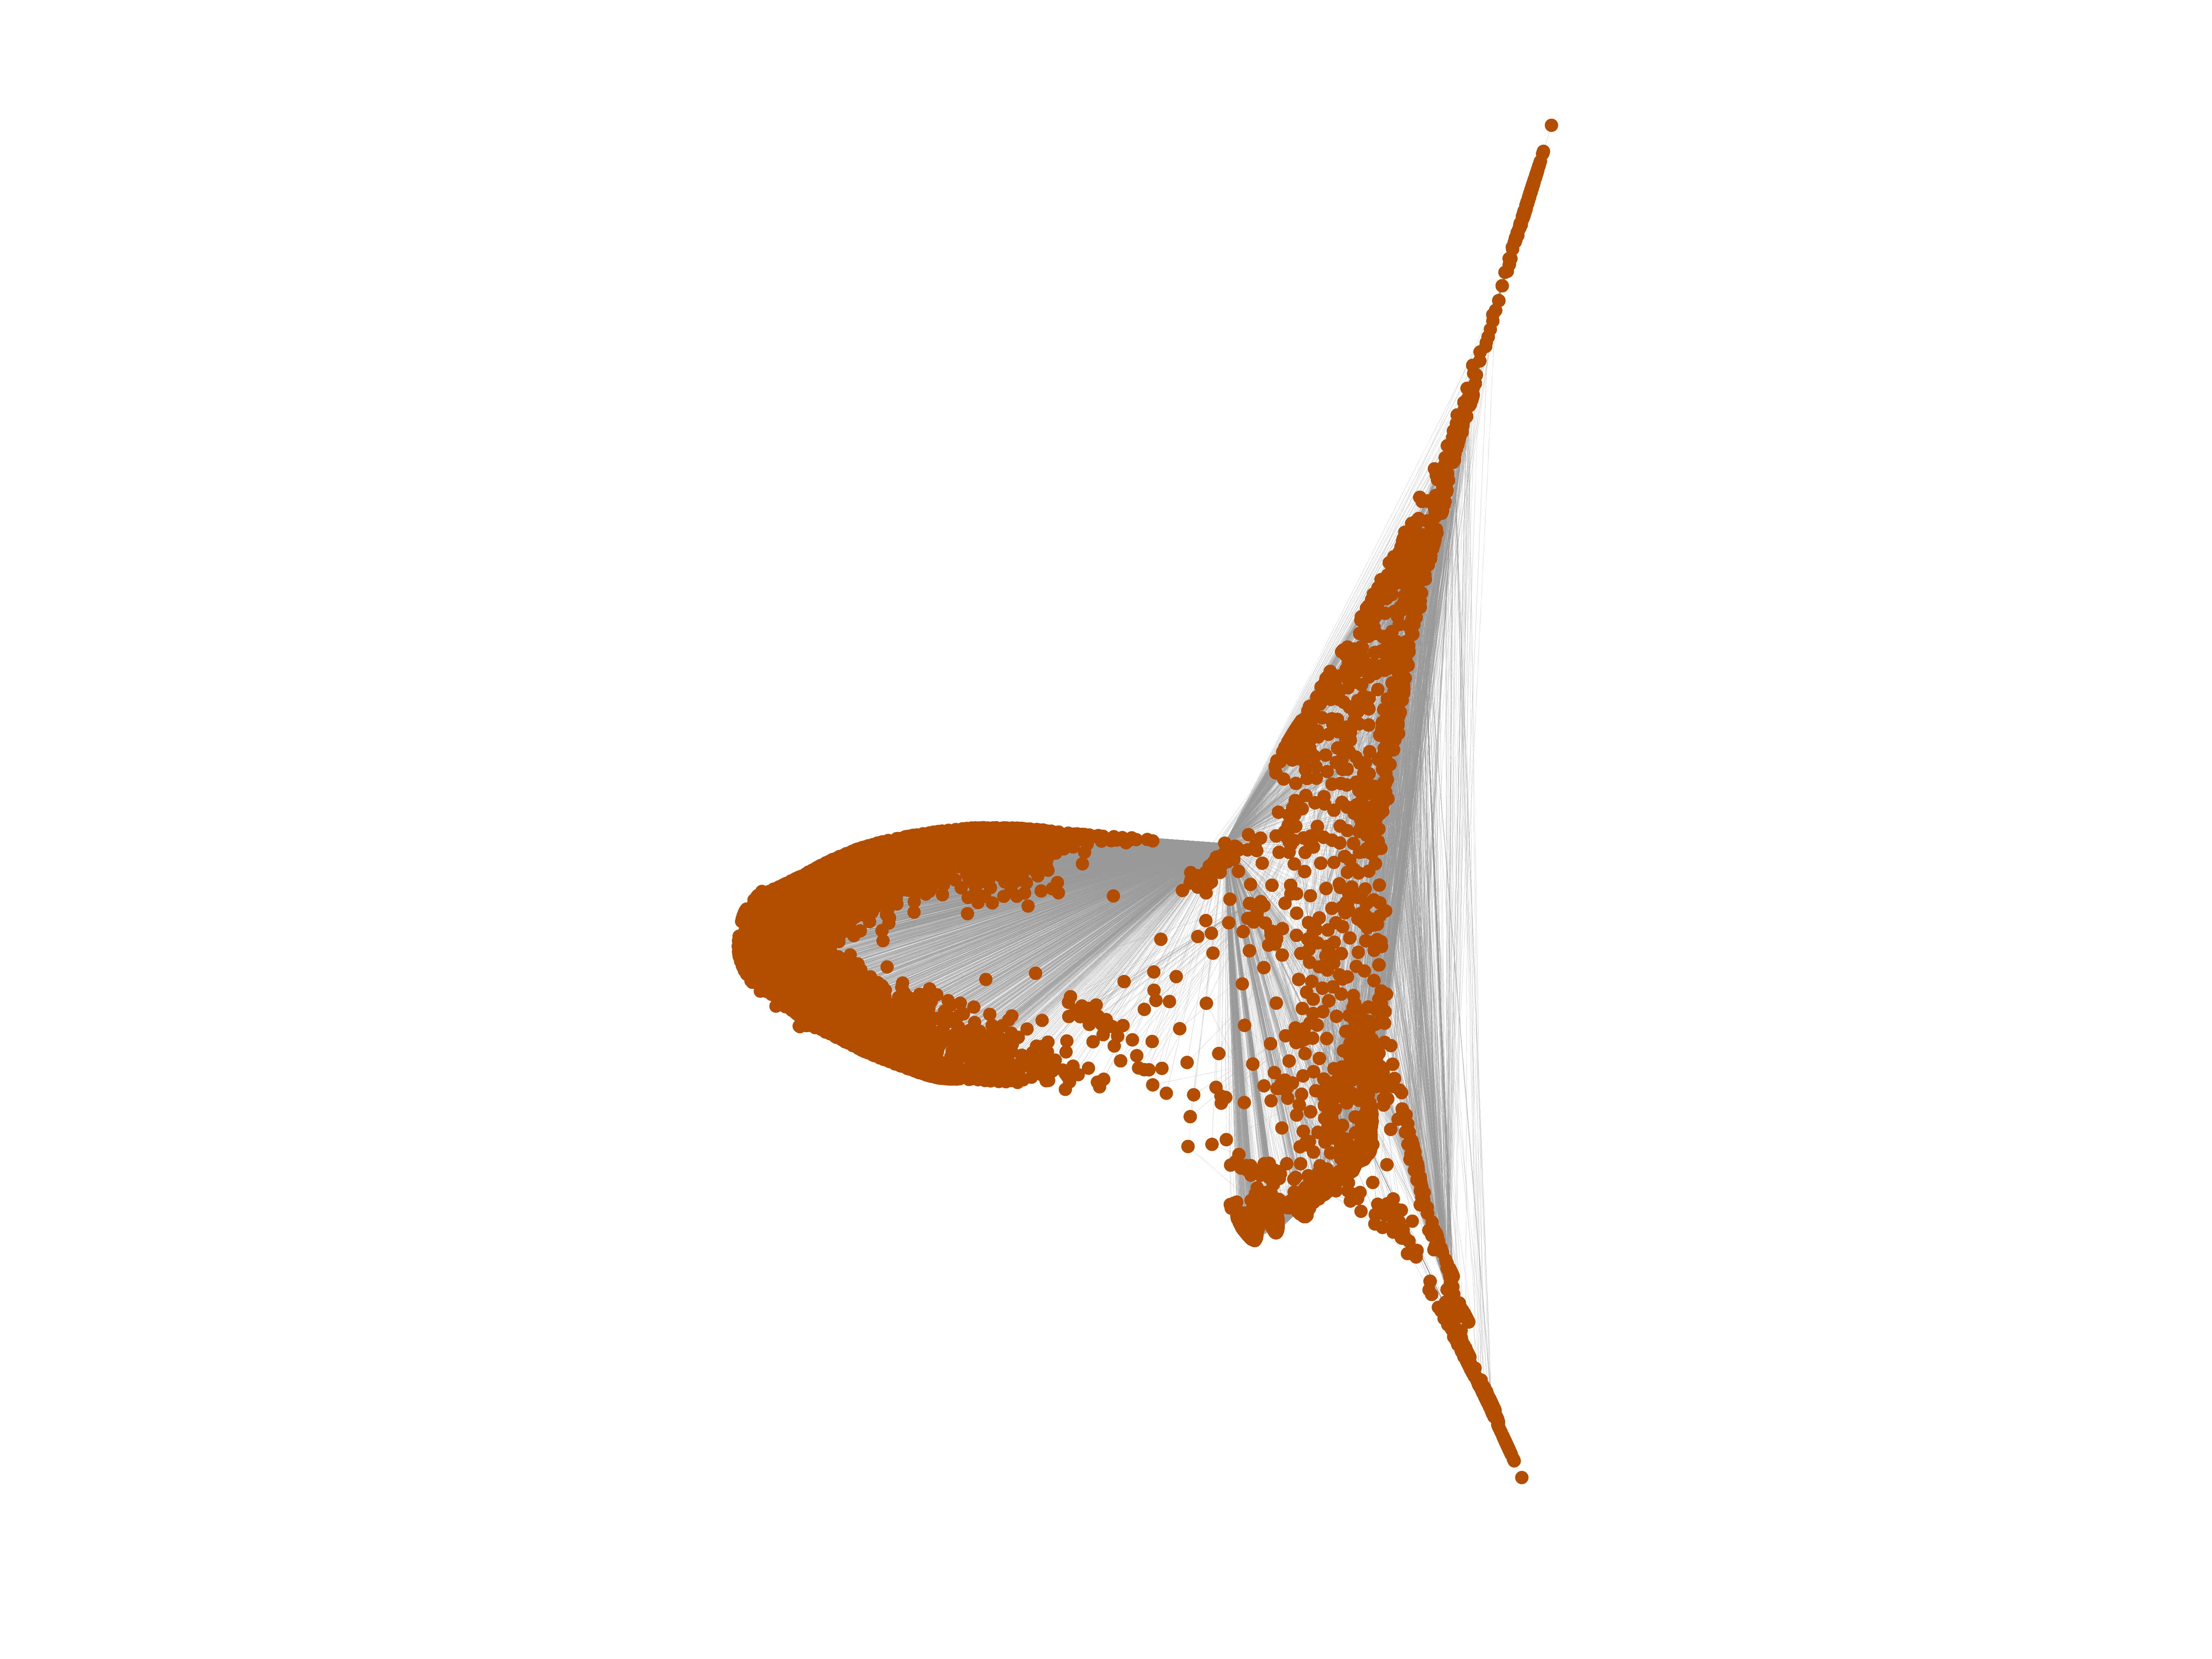
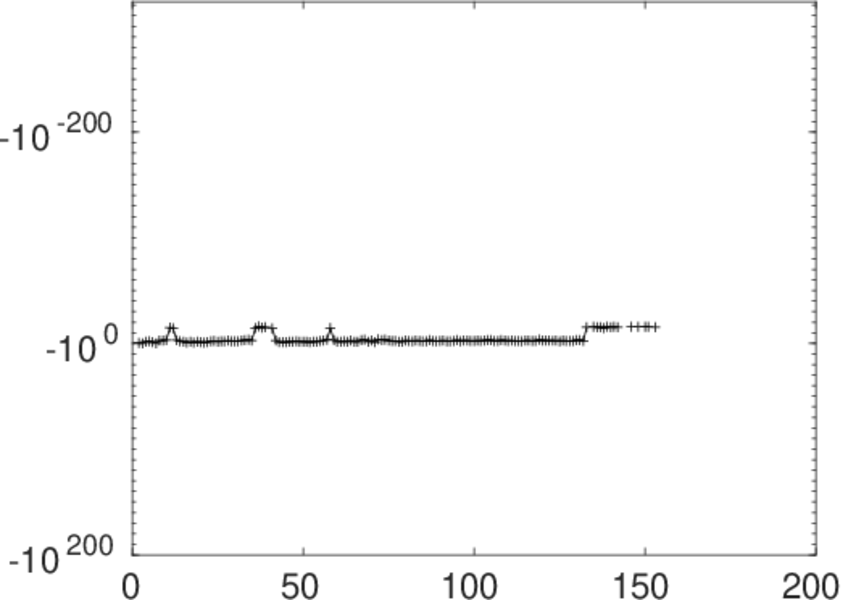
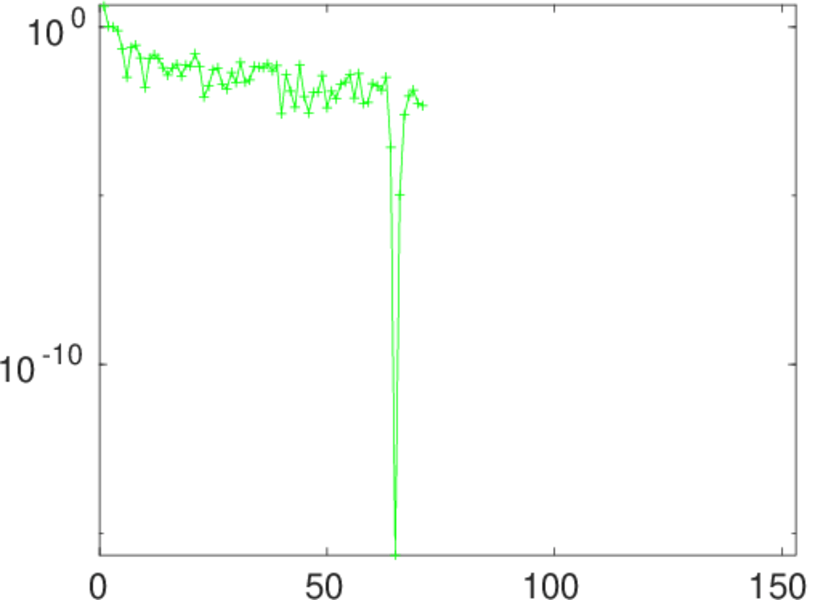
Matrix decompositions plots


Downloads
References
|
[1]
|
Jérôme Kunegis.
KONECT – The Koblenz Network Collection.
In Proc. Int. Conf. on World Wide Web Companion, pages
1343–1350, 2013.
[ http ]
|
|
[2]
|
Wikimedia Foundation.
Wikimedia downloads.
http://dumps.wikimedia.org/, January 2010.
|
 KONECT ‣ Networks ‣
Buy Me a Coffee
KONECT ‣ Networks ‣
Buy Me a Coffee