Wikiquote edits (es)
This is the bipartite edit network of the Spanish Wikisource. It contains users
and pages from the Spanish Wikisource, connected by edit events. Each edge
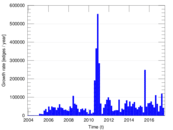
represents an edit. The dataset includes the timestamp of each edit.
Metadata
Statistics
| Size | n = | 213,453
|
| Left size | n1 = | 3,235
|
| Right size | n2 = | 210,218
|
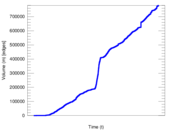
| Volume | m = | 779,562
|
| Unique edge count | m̿ = | 418,562
|
| Wedge count | s = | 3,360,230,243
|
| Claw count | z = | 34,154,143,543,989
|
| Square count | q = | 624,962,942
|
| 4-Tour count | T4 = | 18,441,668,628
|
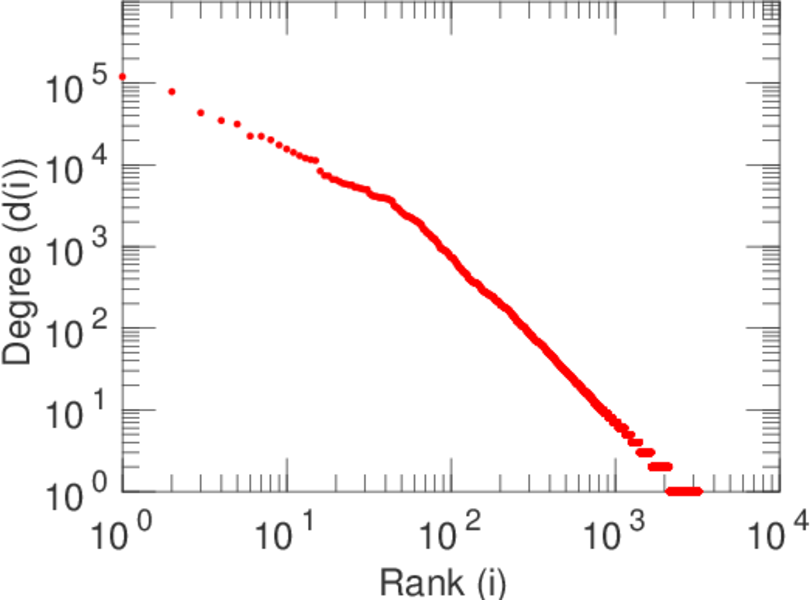
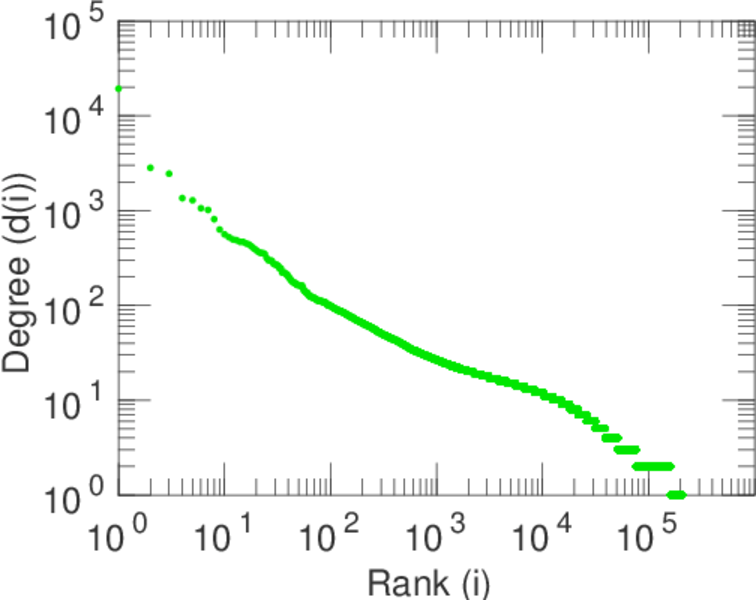
| Maximum degree | dmax = | 120,157
|
| Maximum left degree | d1max = | 120,157
|
| Maximum right degree | d2max = | 19,307
|
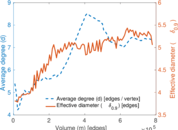
| Average degree | d = | 7.304 30
|
| Average left degree | d1 = | 240.977
|
| Average right degree | d2 = | 3.708 35
|
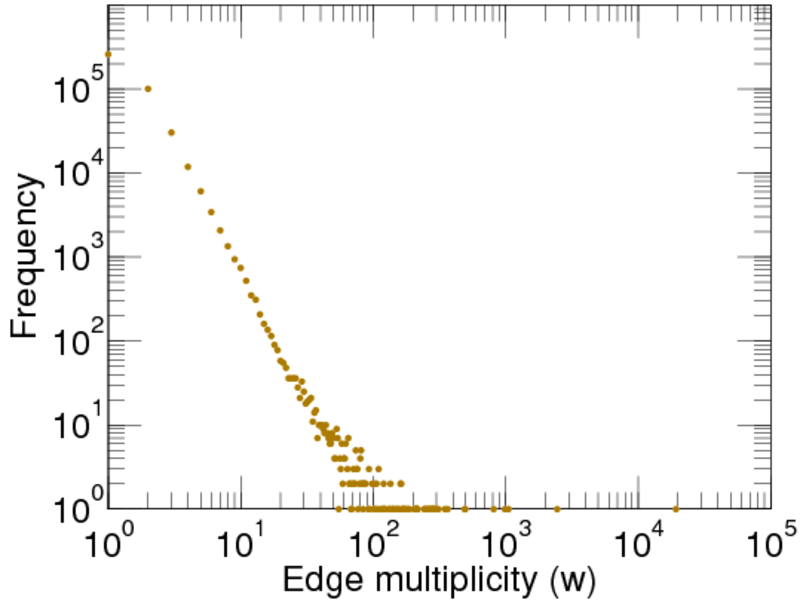
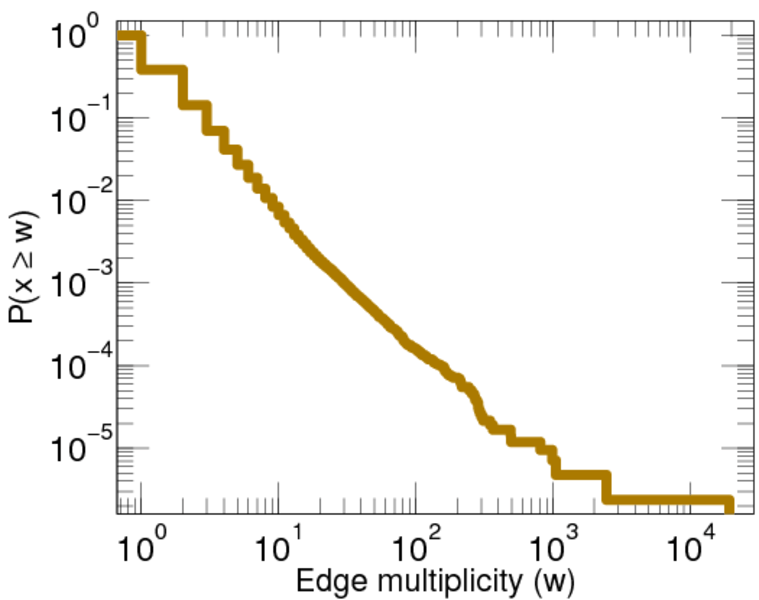
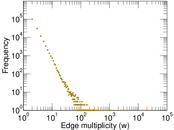
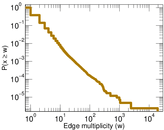
| Average edge multiplicity | m̃ = | 1.862 48
|
| Size of LCC | N = | 211,549
|
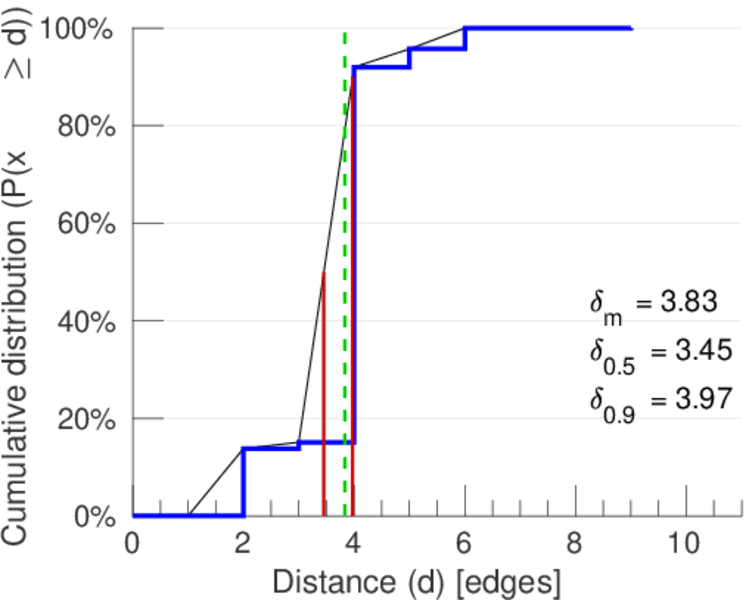
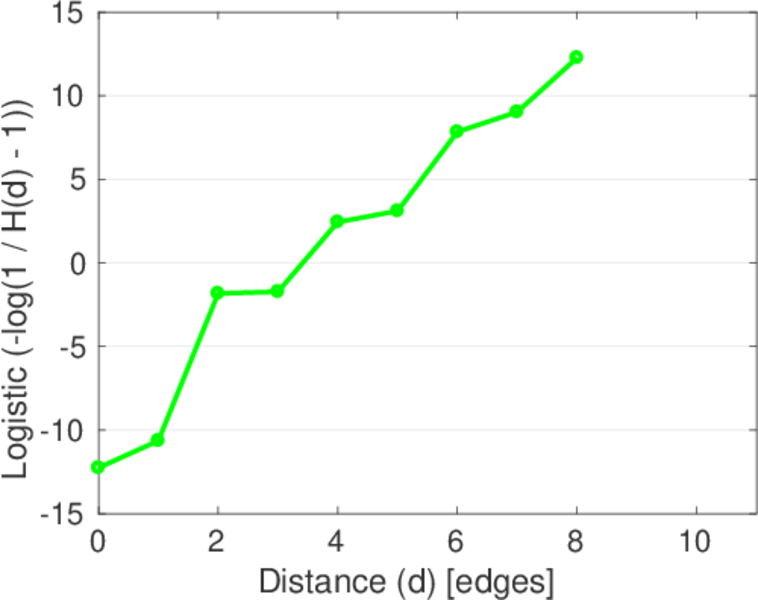
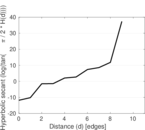
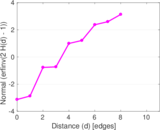
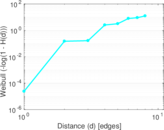
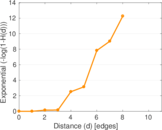
| Diameter | δ = | 12
|
| 50-Percentile effective diameter | δ0.5 = | 3.453 92
|
| 90-Percentile effective diameter | δ0.9 = | 3.974 20
|
| Median distance | δM = | 4
|
| Mean distance | δm = | 3.834 73
|
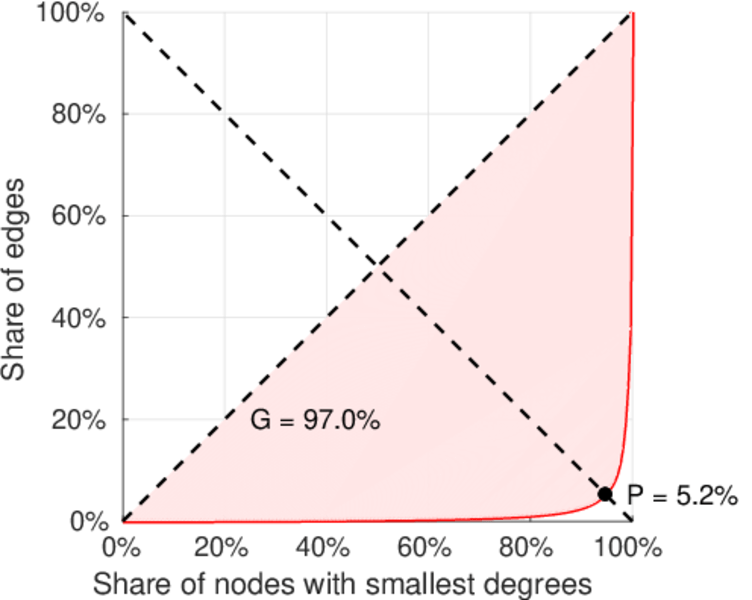
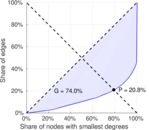
| Gini coefficient | G = | 0.743 124
|
| Balanced inequality ratio | P = | 0.207 868
|
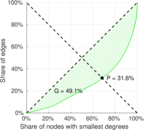
| Left balanced inequality ratio | P1 = | 0.051 729 0
|
| Right balanced inequality ratio | P2 = | 0.315 730
|
| Relative edge distribution entropy | Her = | 0.718 096
|
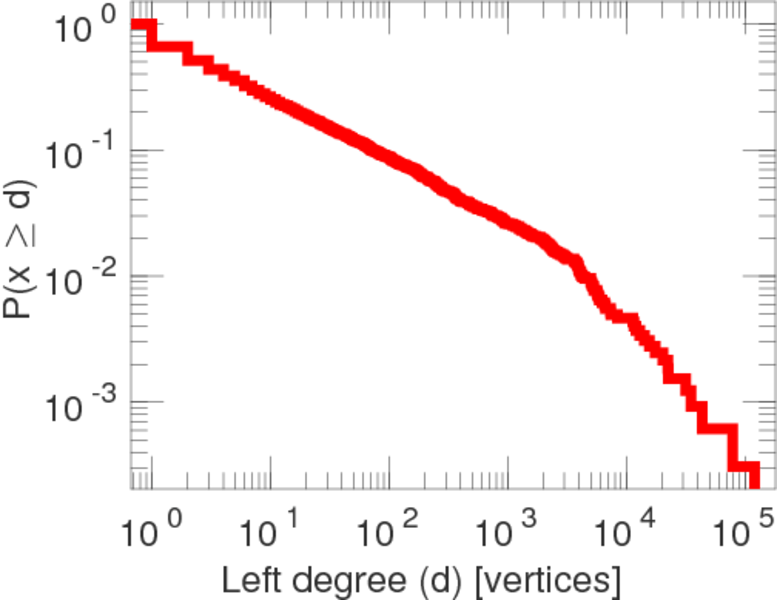
| Power law exponent | γ = | 2.991 51
|
| Tail power law exponent | γt = | 1.581 00
|
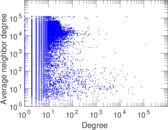
| Degree assortativity | ρ = | −0.106 553
|
| Degree assortativity p-value | pρ = | 0.000 00
|
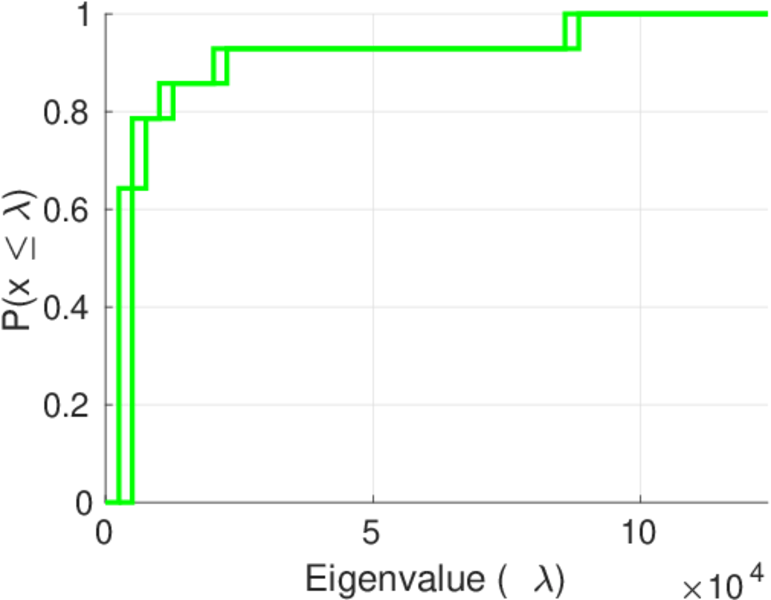
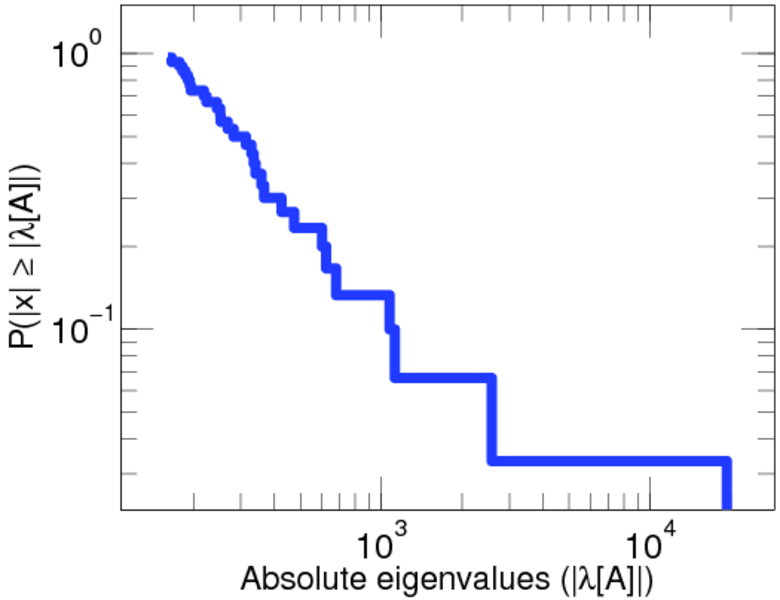
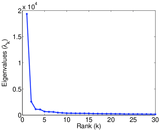
| Spectral norm | α = | 19,347.4
|
| Algebraic connectivity | a = | 0.027 399 2
|
| Spectral separation | |λ1[A] / λ2[A]| = | 7.500 43
|
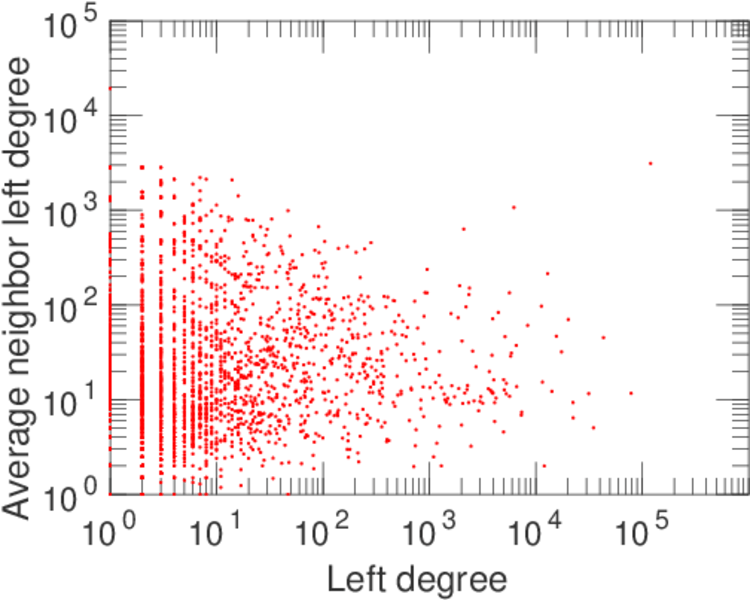
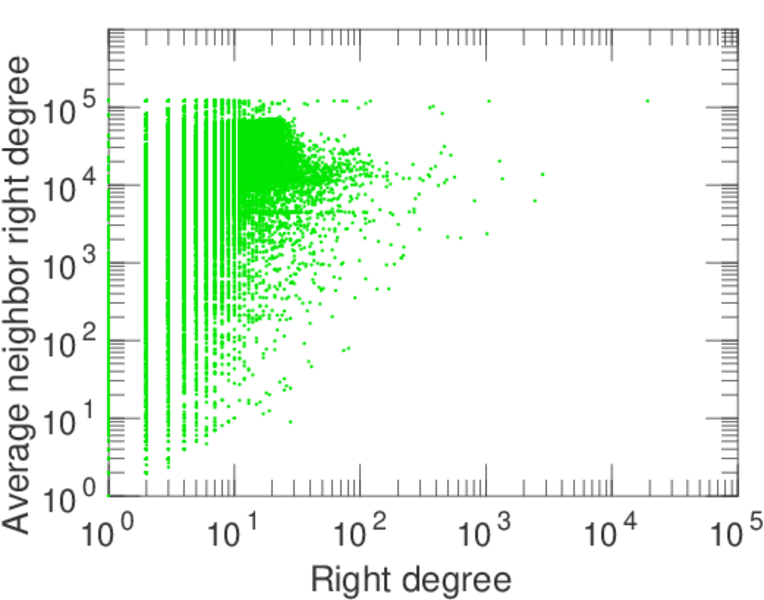
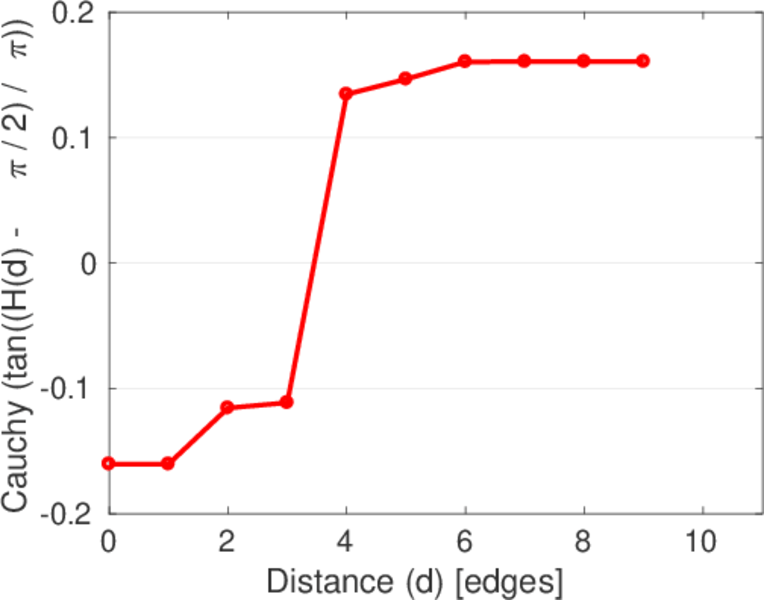
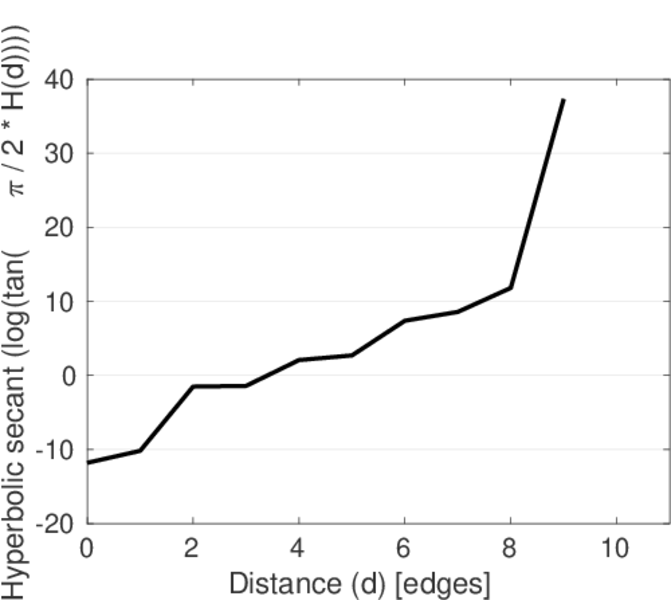
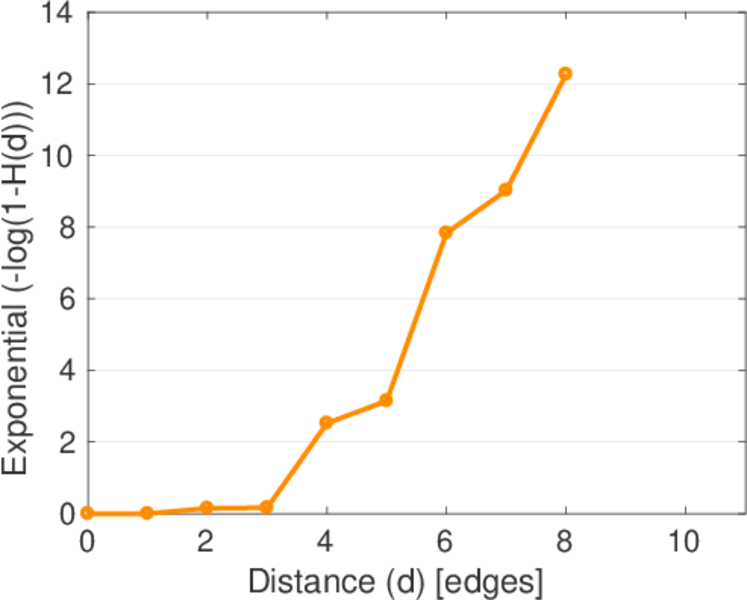
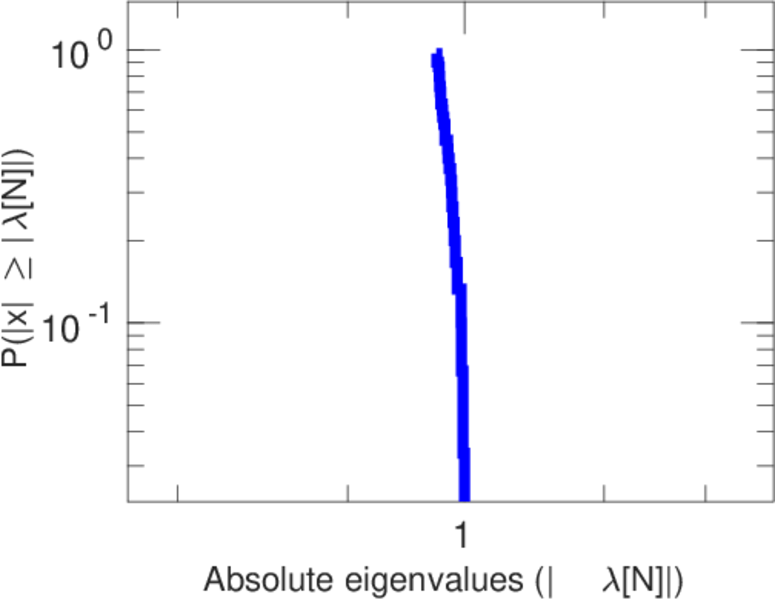
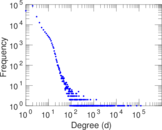
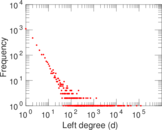
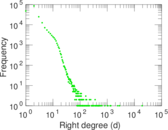
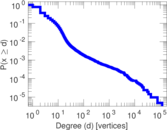
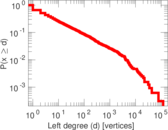
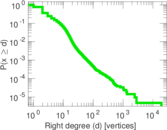
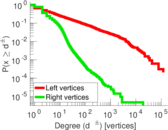
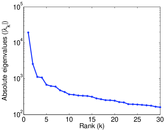
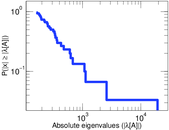
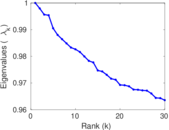
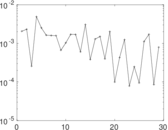
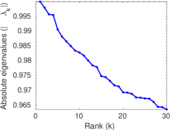
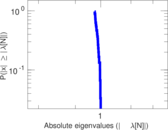
Plots


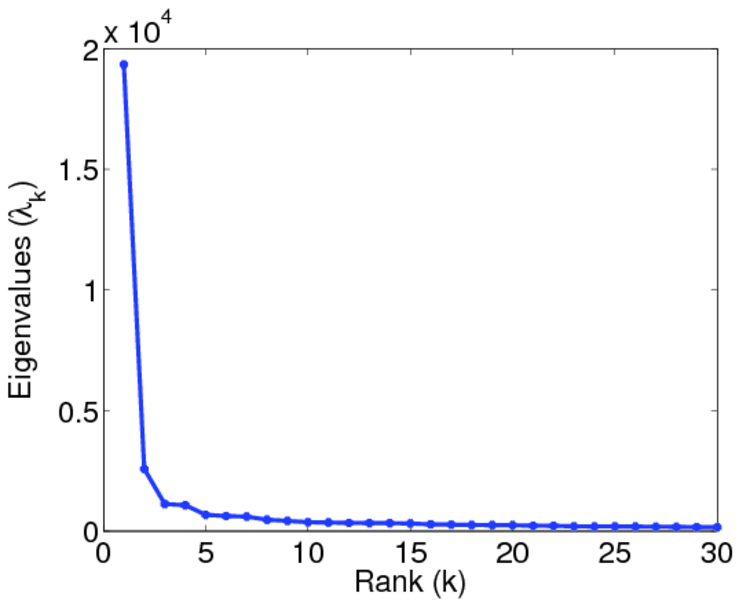
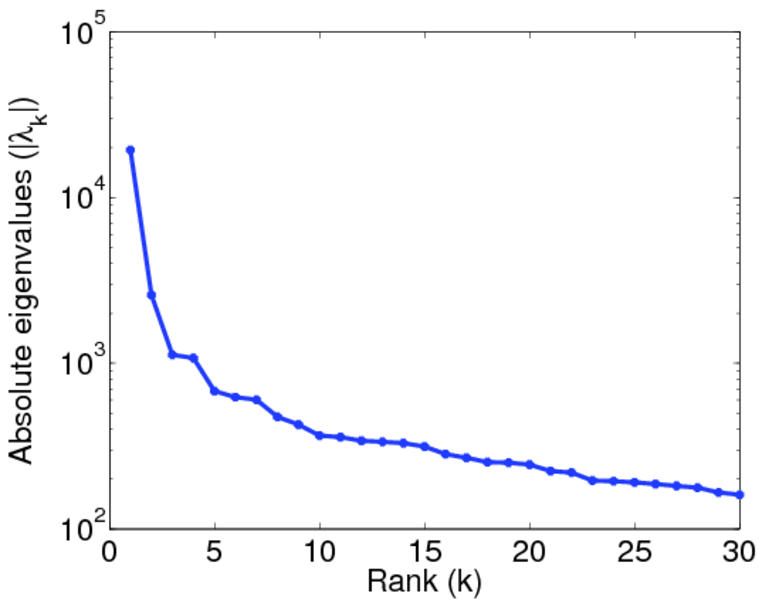
Matrix decompositions plots
Downloads
References
|
[1]
|
Jérôme Kunegis.
KONECT – The Koblenz Network Collection.
In Proc. Int. Conf. on World Wide Web Companion, pages
1343–1350, 2013.
[ http ]
|
|
[2]
|
Wikimedia Foundation.
Wikimedia downloads.
http://dumps.wikimedia.org/, January 2010.
|
 KONECT ‣ Networks ‣
Buy Me a Coffee
KONECT ‣ Networks ‣
Buy Me a Coffee