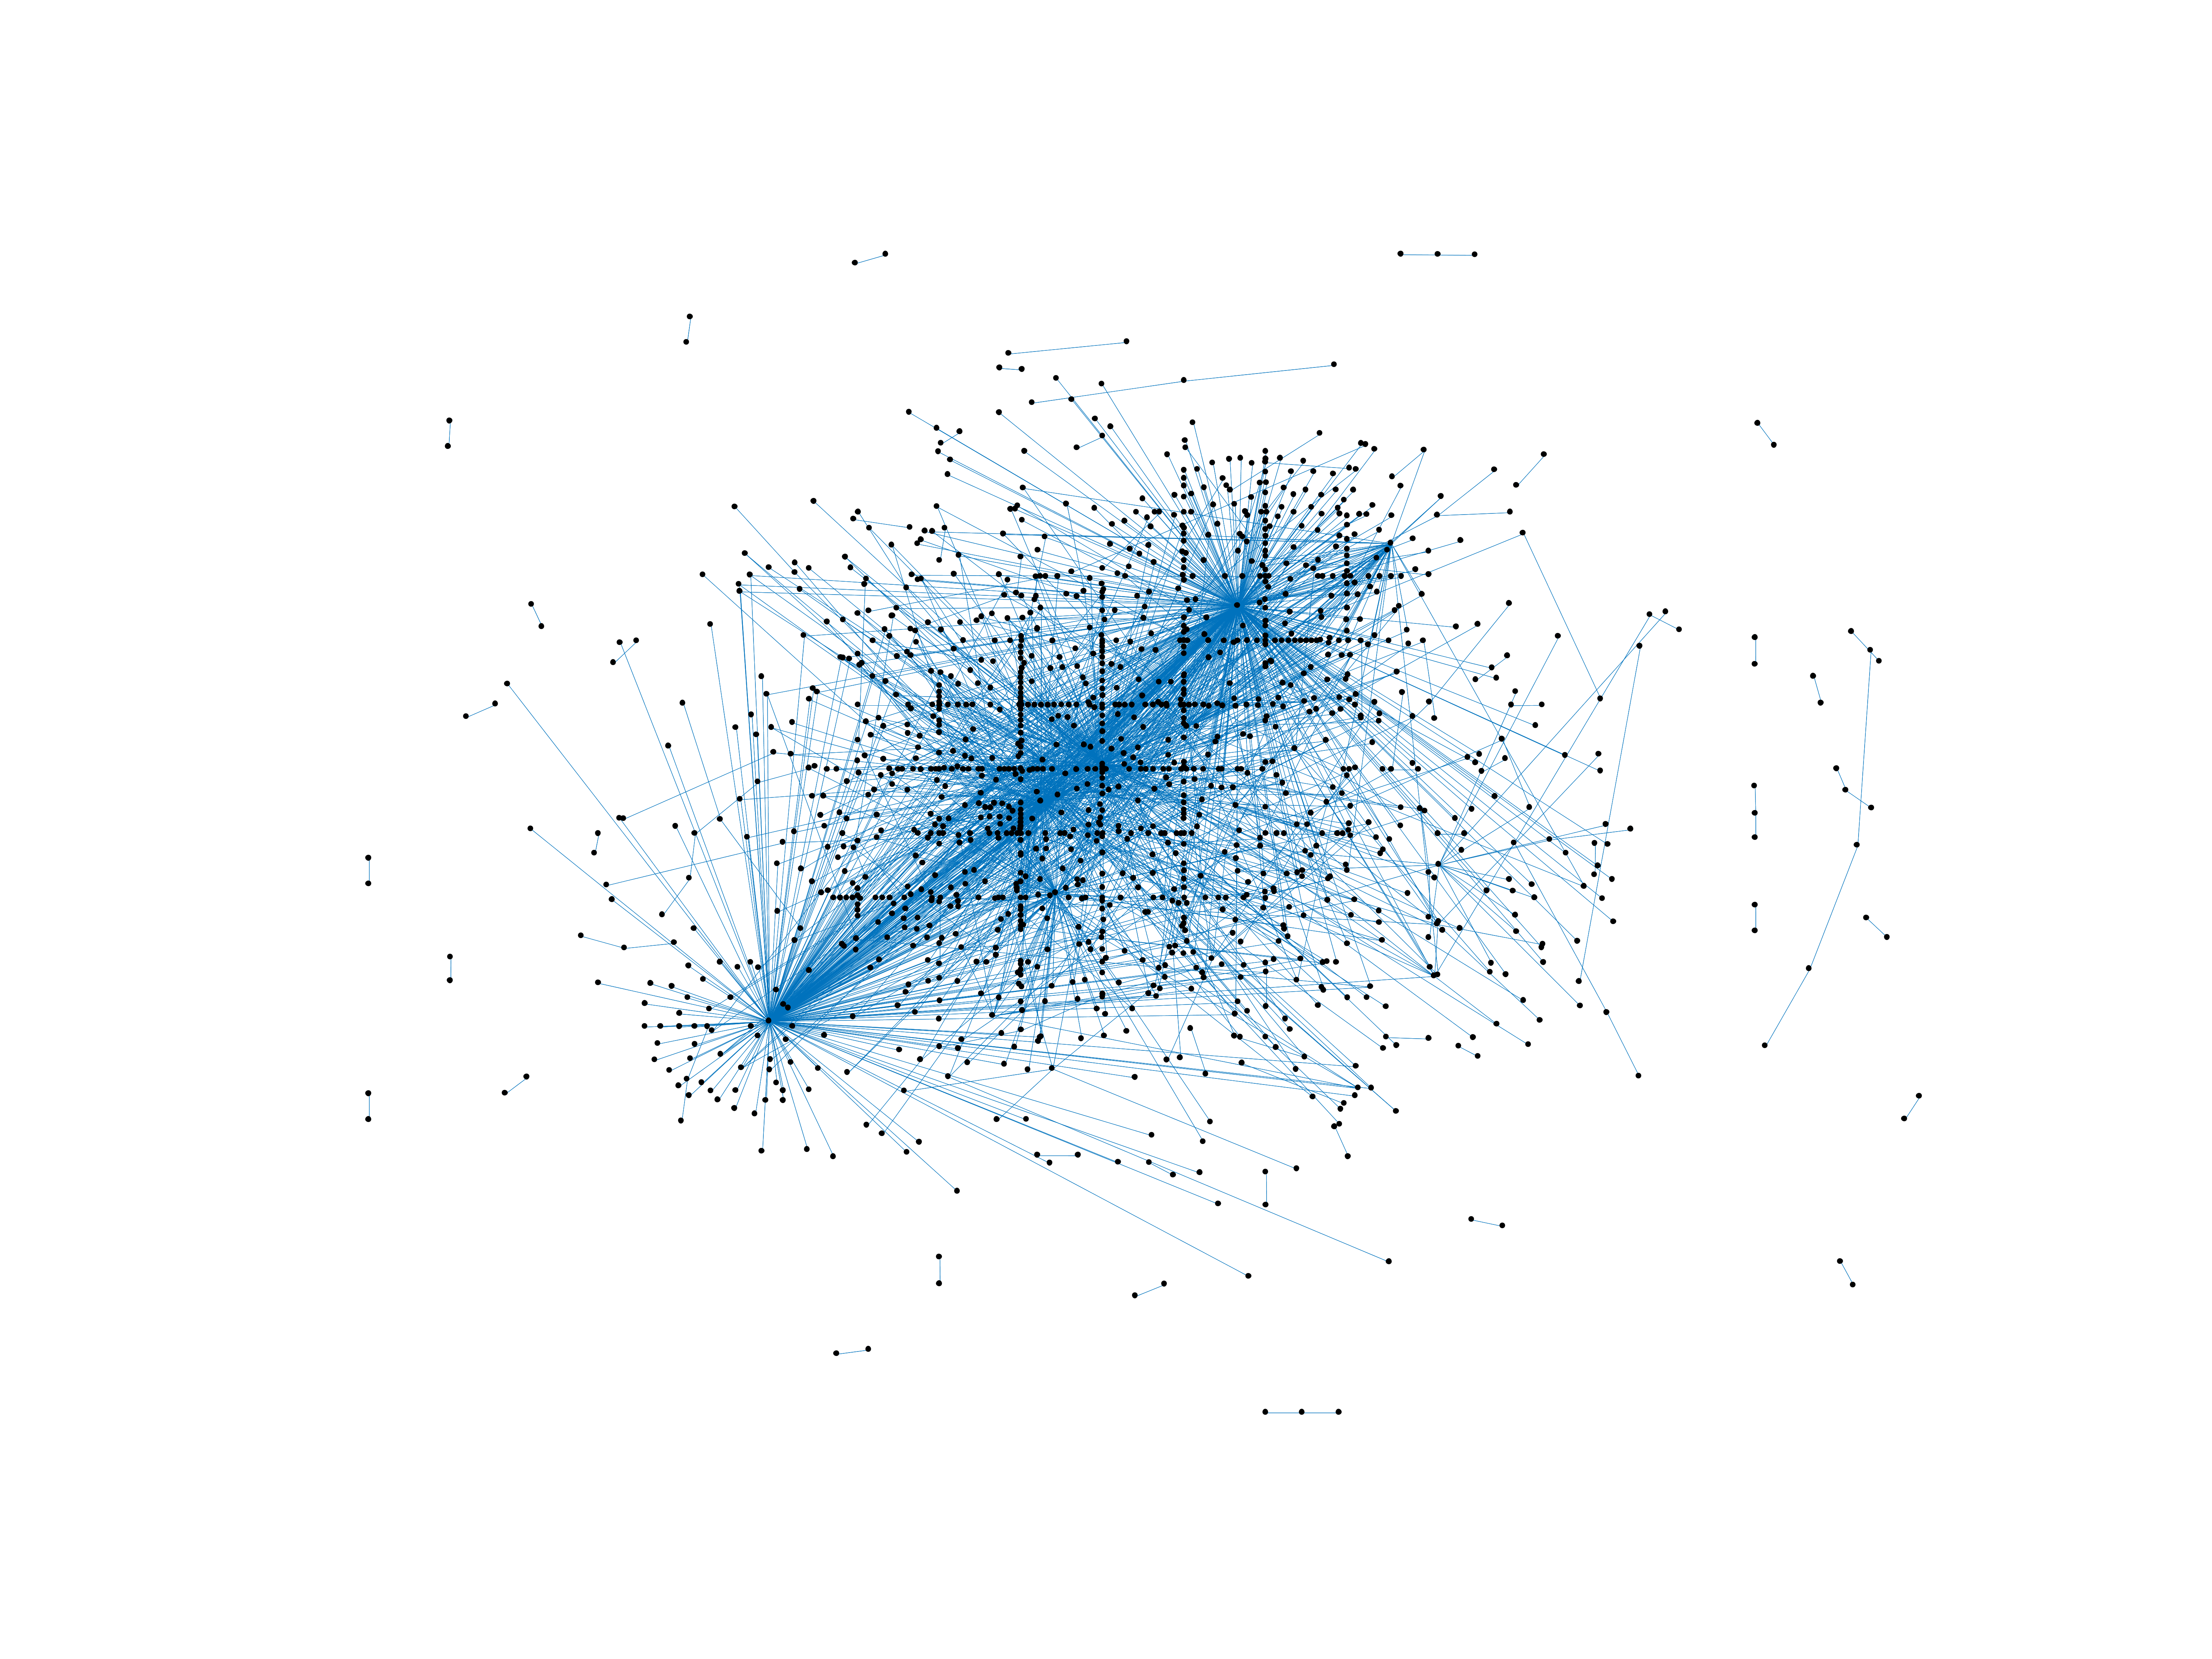
Wikibooks edits (et)
This is the bipartite edit network of the Estonian Wikibooks. It contains users
and pages from the Estonian Wikibooks, connected by edit events. Each edge
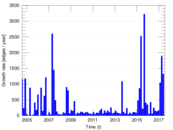
represents an edit. The dataset includes the timestamp of each edit.
Metadata
Statistics
| Size | n = | 1,447
|
| Left size | n1 = | 201
|
| Right size | n2 = | 1,246
|
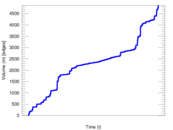
| Volume | m = | 4,863
|
| Unique edge count | m̿ = | 1,881
|
| Wedge count | s = | 148,160
|
| Claw count | z = | 13,646,886
|
| Cross count | x = | 1,088,212,032
|
| Square count | q = | 15,443
|
| 4-Tour count | T4 = | 721,098
|
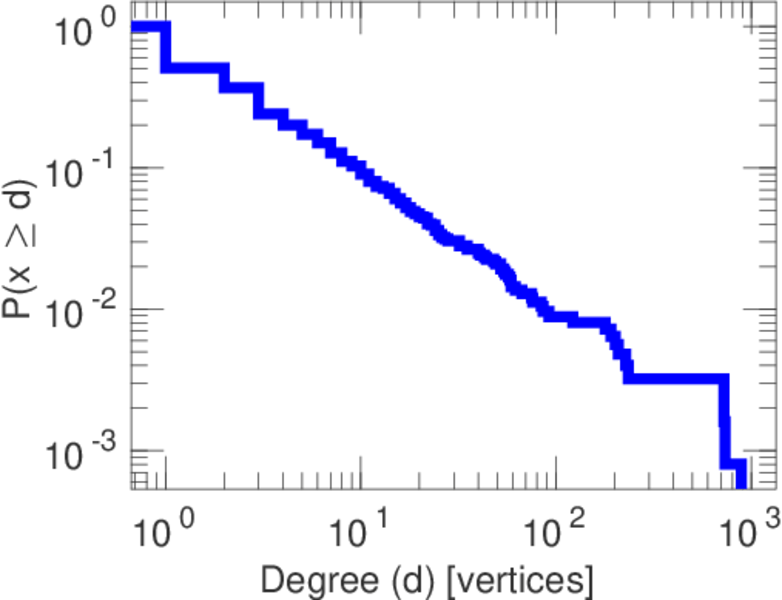
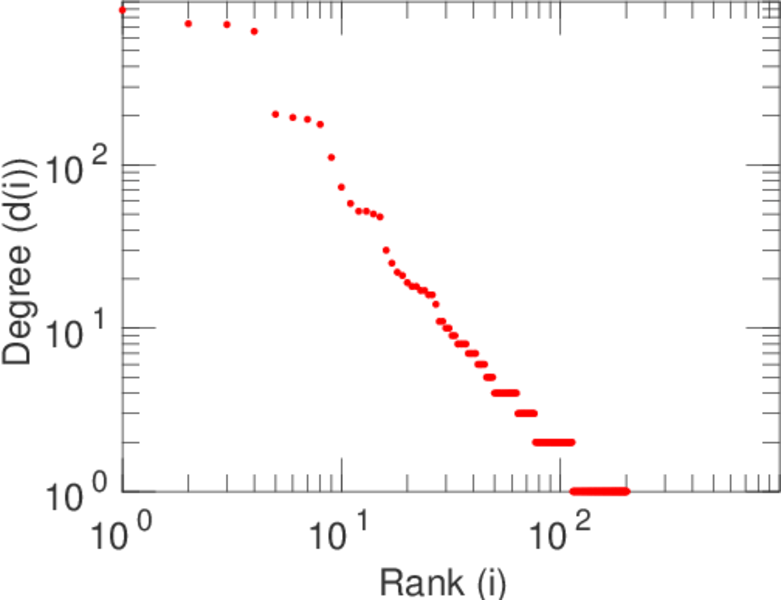
| Maximum degree | dmax = | 887
|
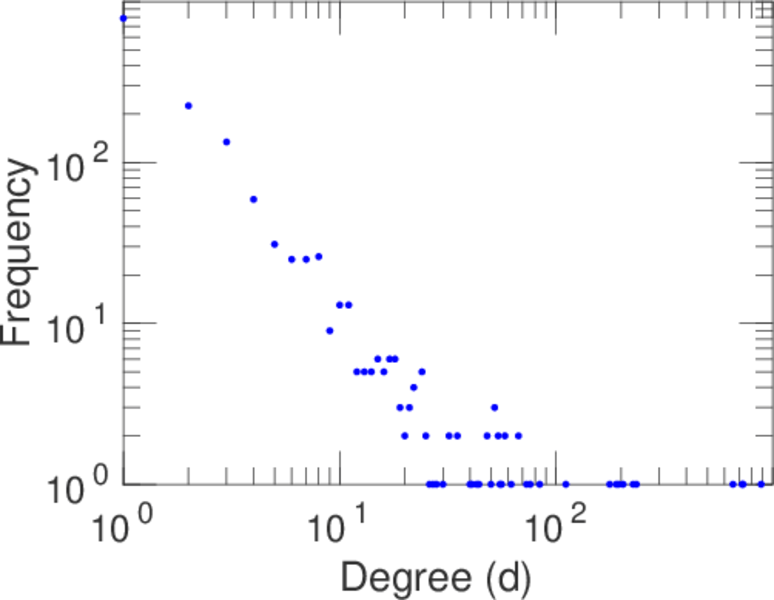
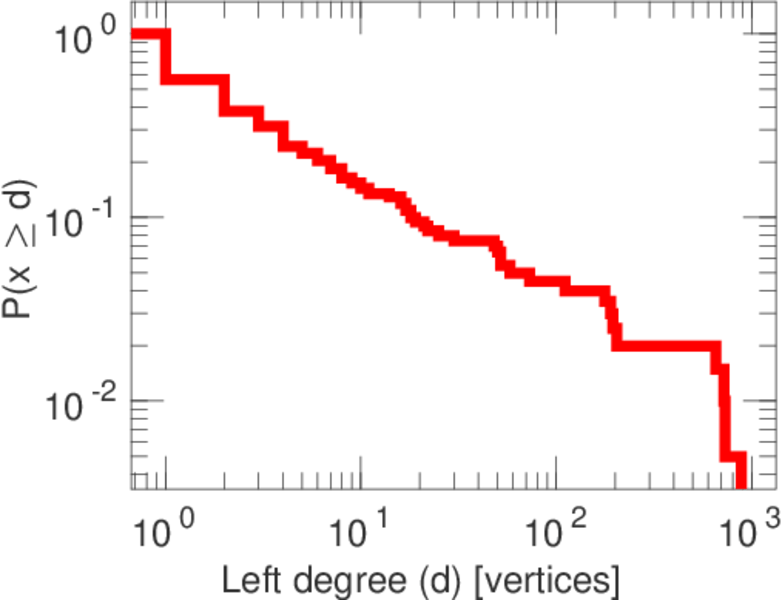
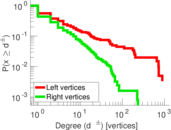
| Maximum left degree | d1max = | 887
|
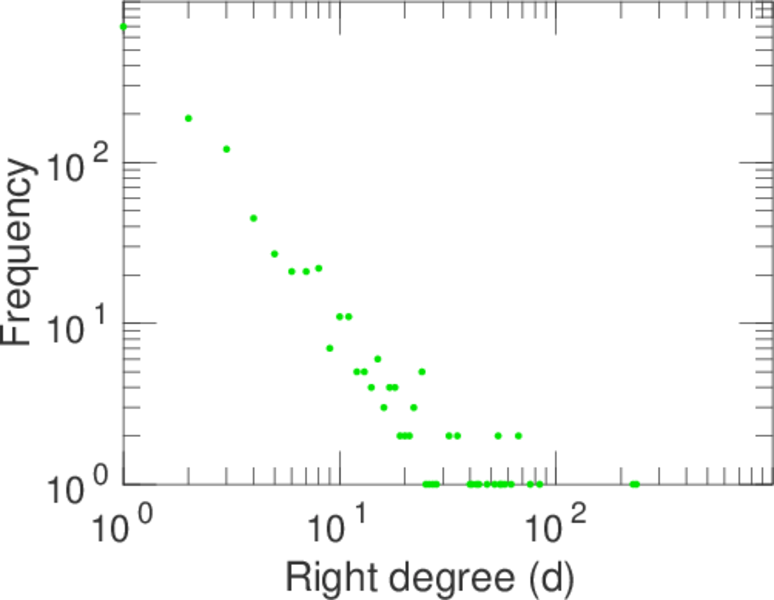
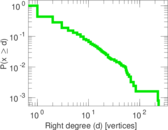
| Maximum right degree | d2max = | 235
|
| Average degree | d = | 6.721 49
|
| Average left degree | d1 = | 24.194 0
|
| Average right degree | d2 = | 3.902 89
|
| Fill | p = | 0.007 510 60
|
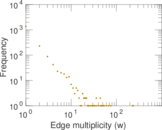
| Average edge multiplicity | m̃ = | 2.585 33
|
| Size of LCC | N = | 1,177
|
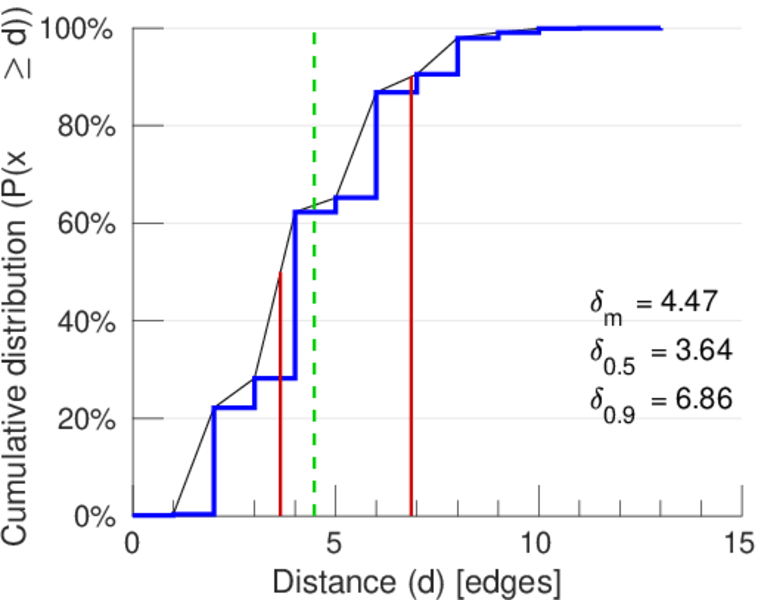
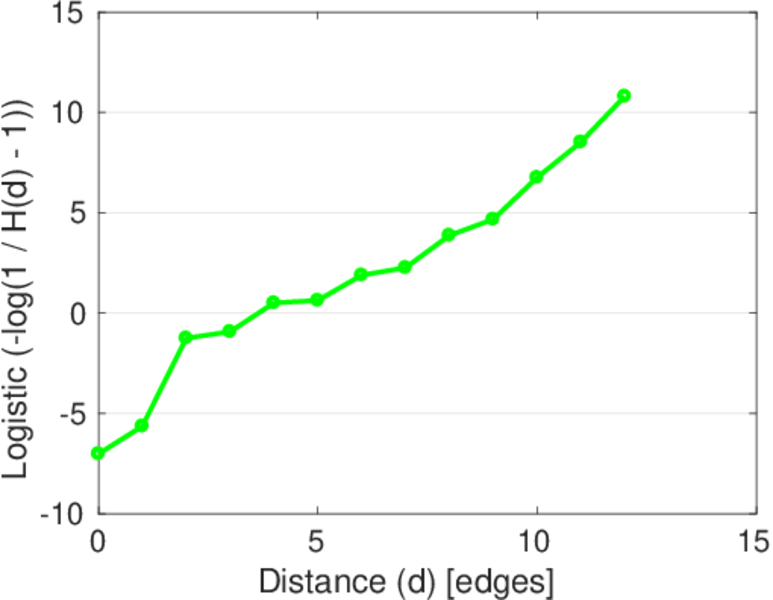
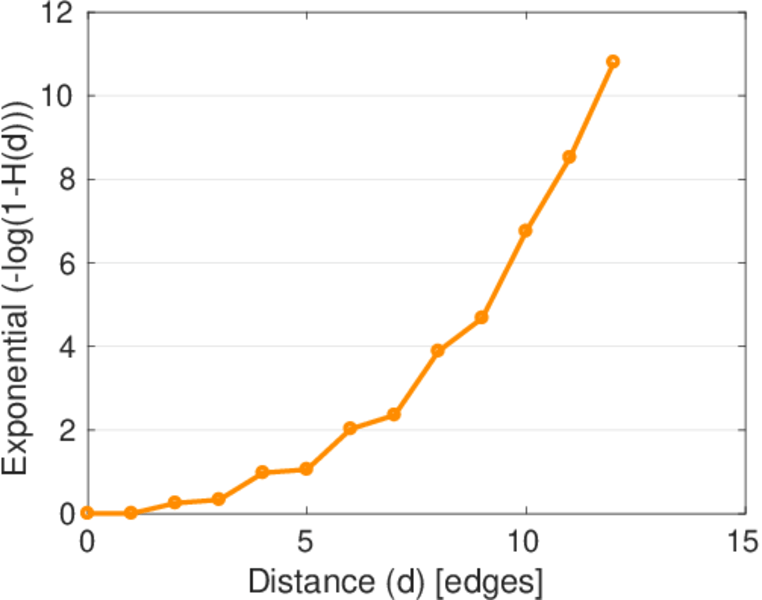
| Diameter | δ = | 14
|
| 50-Percentile effective diameter | δ0.5 = | 3.638 96
|
| 90-Percentile effective diameter | δ0.9 = | 6.859 06
|
| Median distance | δM = | 4
|
| Mean distance | δm = | 4.474 61
|
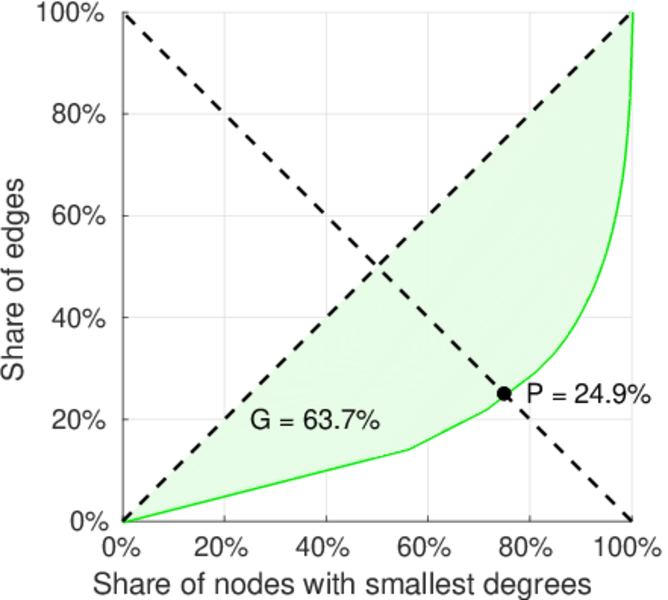
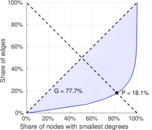
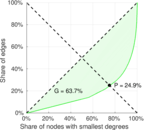
| Gini coefficient | G = | 0.785 647
|
| Balanced inequality ratio | P = | 0.177 874
|
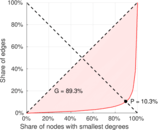
| Left balanced inequality ratio | P1 = | 0.103 023
|
| Right balanced inequality ratio | P2 = | 0.249 229
|
| Relative edge distribution entropy | Her = | 0.806 662
|
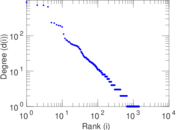
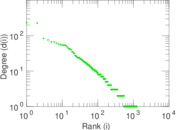
| Power law exponent | γ = | 3.836 71
|
| Tail power law exponent | γt = | 2.341 00
|
| Tail power law exponent with p | γ3 = | 2.341 00
|
| p-value | p = | 0.000 00
|
| Left tail power law exponent with p | γ3,1 = | 1.811 00
|
| Left p-value | p1 = | 0.085 000 0
|
| Right tail power law exponent with p | γ3,2 = | 5.361 00
|
| Right p-value | p2 = | 0.755 000
|
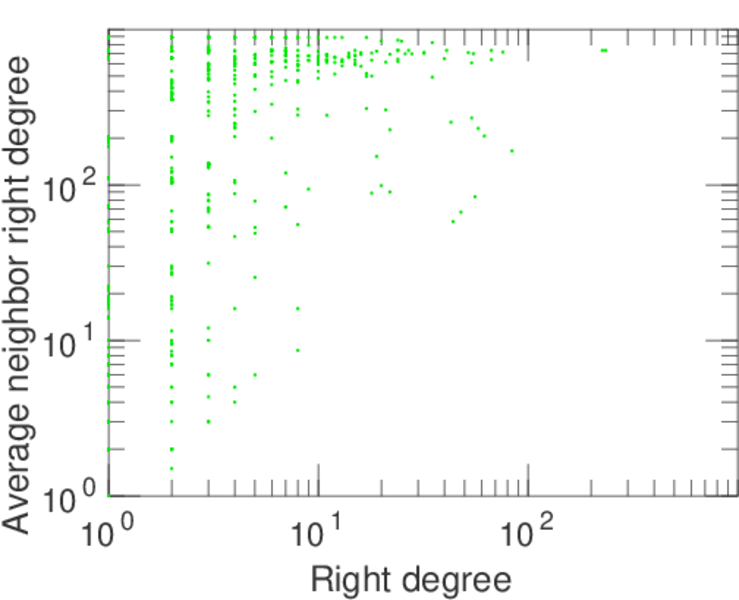
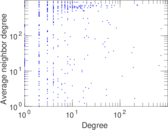
| Degree assortativity | ρ = | −0.069 082 3
|
| Degree assortativity p-value | pρ = | 0.002 720 05
|
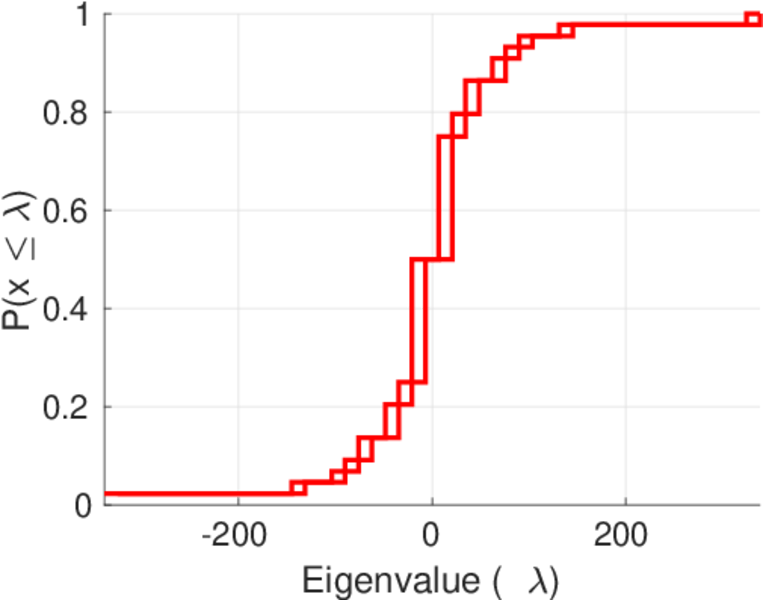
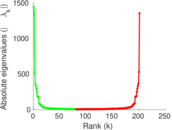
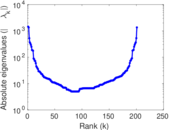
| Spectral norm | α = | 338.982
|
| Algebraic connectivity | a = | 0.012 710 4
|
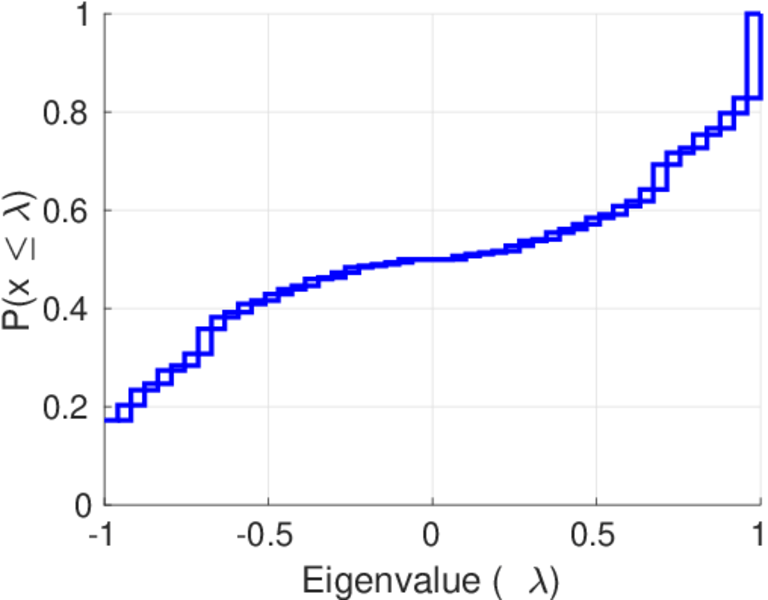
| Spectral separation | |λ1[A] / λ2[A]| = | 2.533 16
|
| Controllability | C = | 1,058
|
| Relative controllability | Cr = | 0.732 687
|
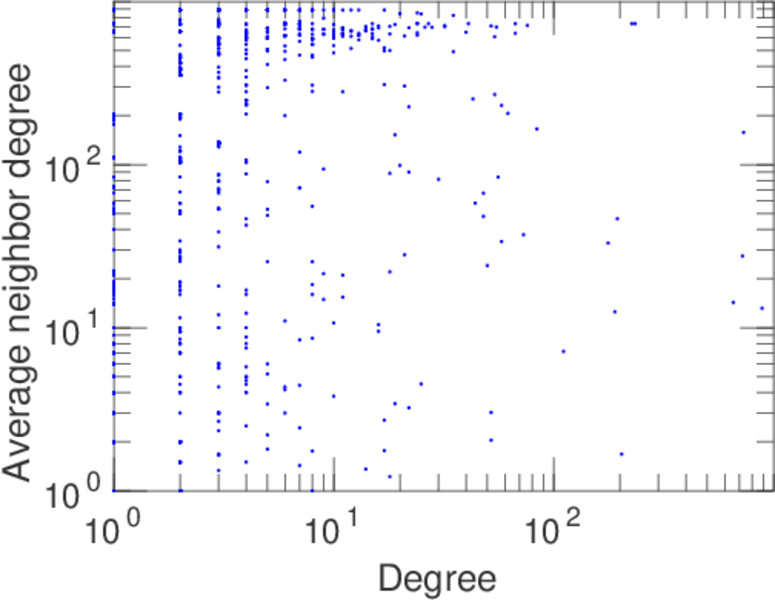
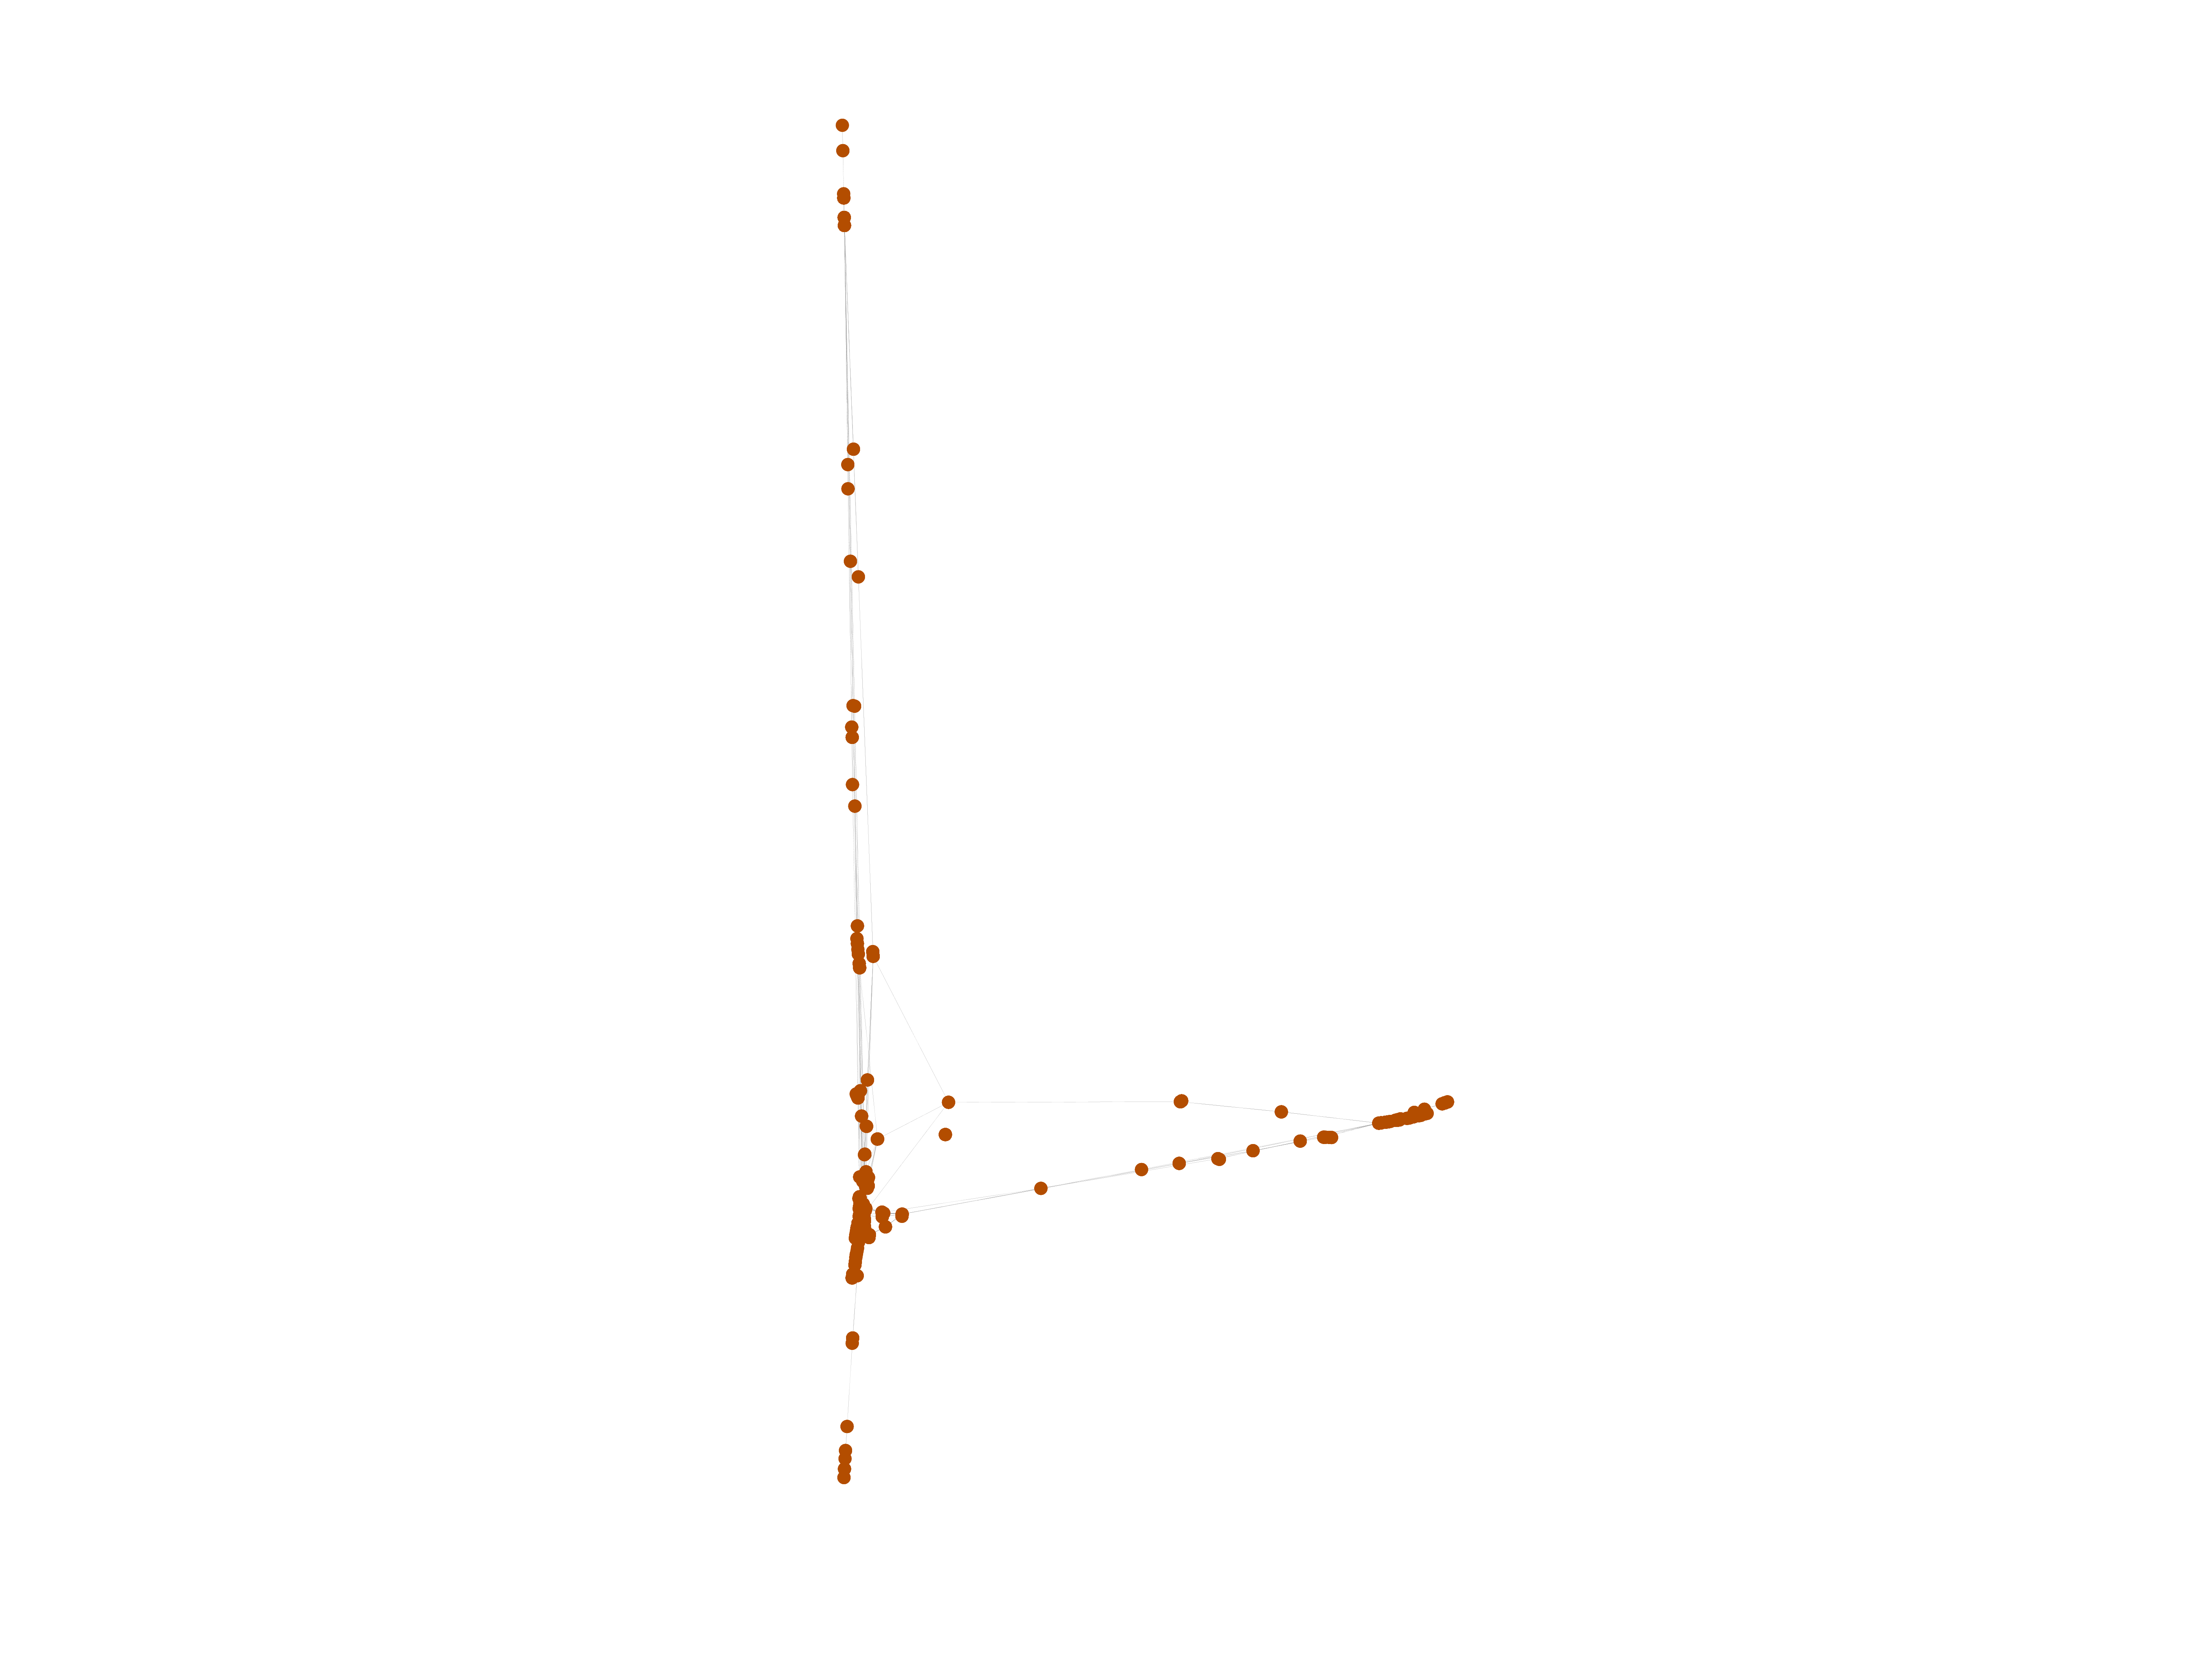
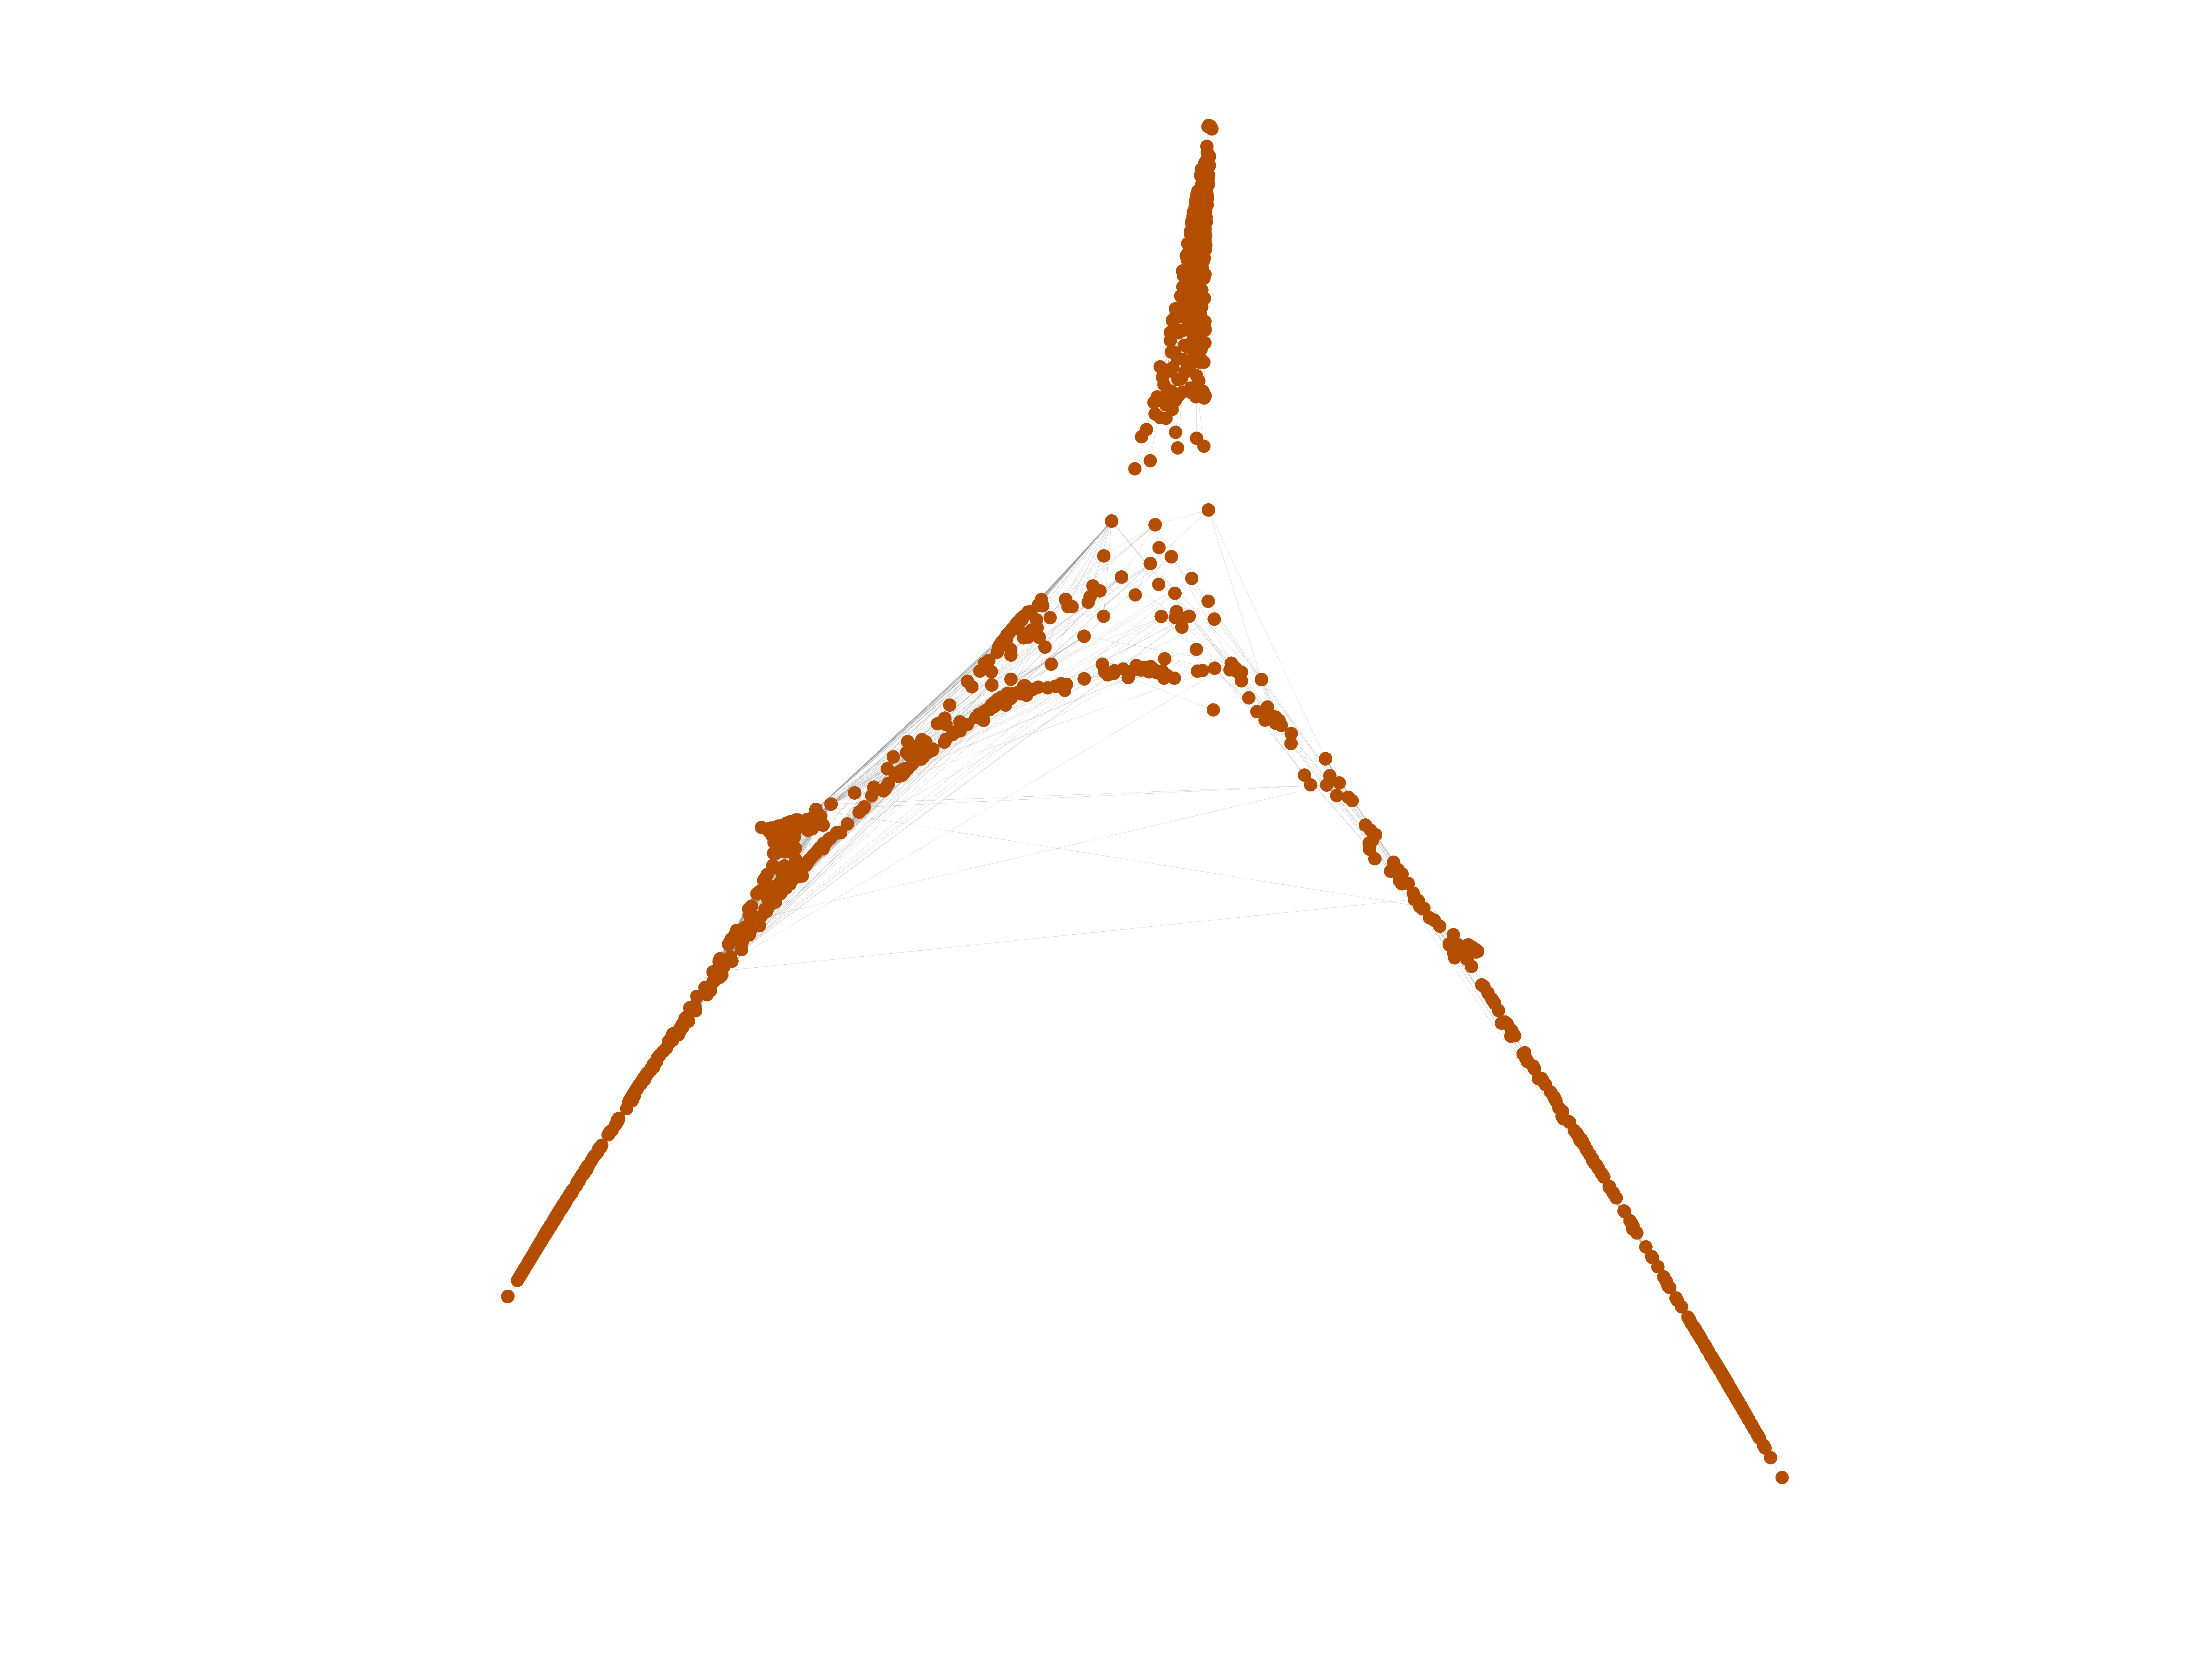
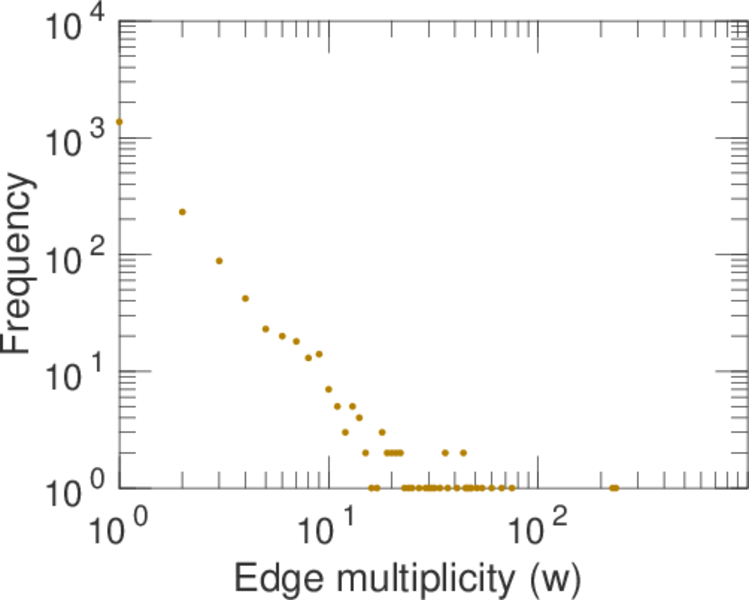
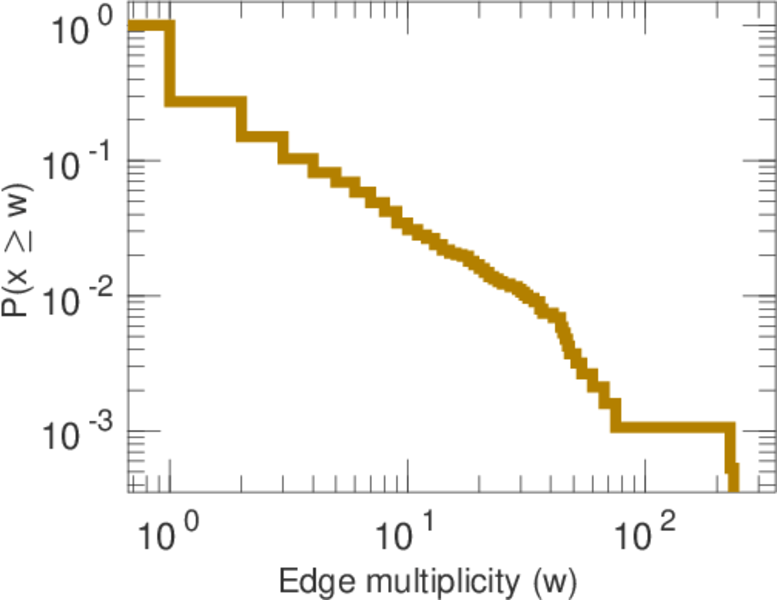
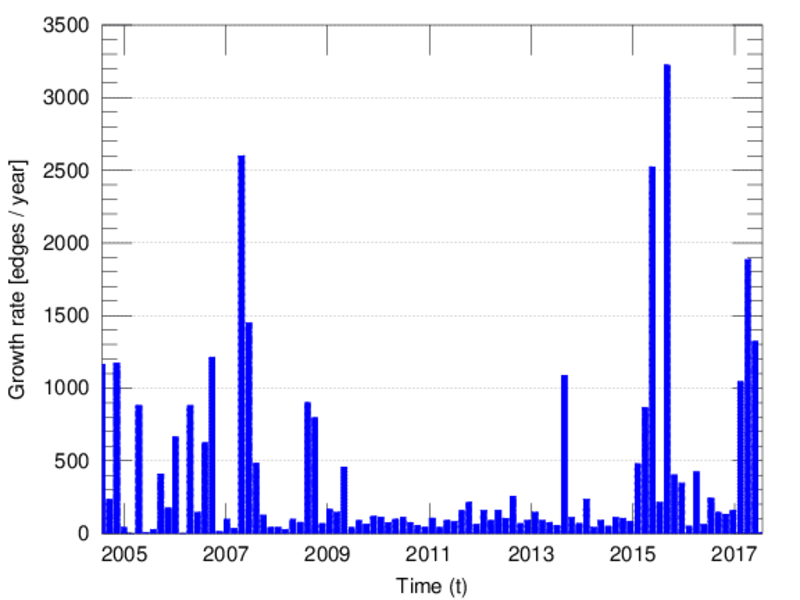
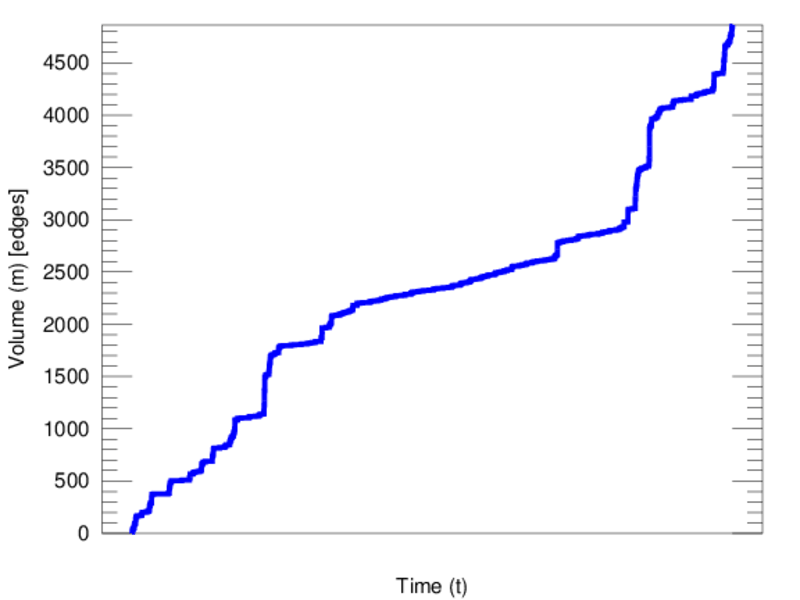
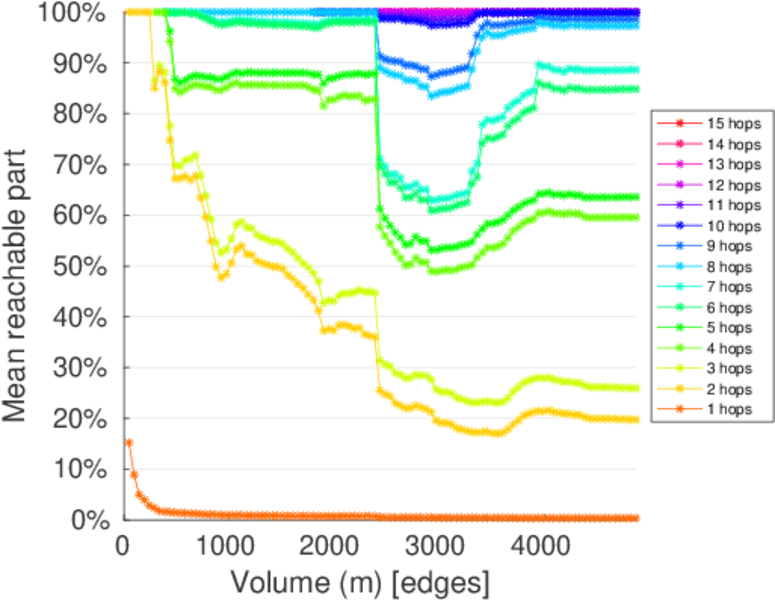
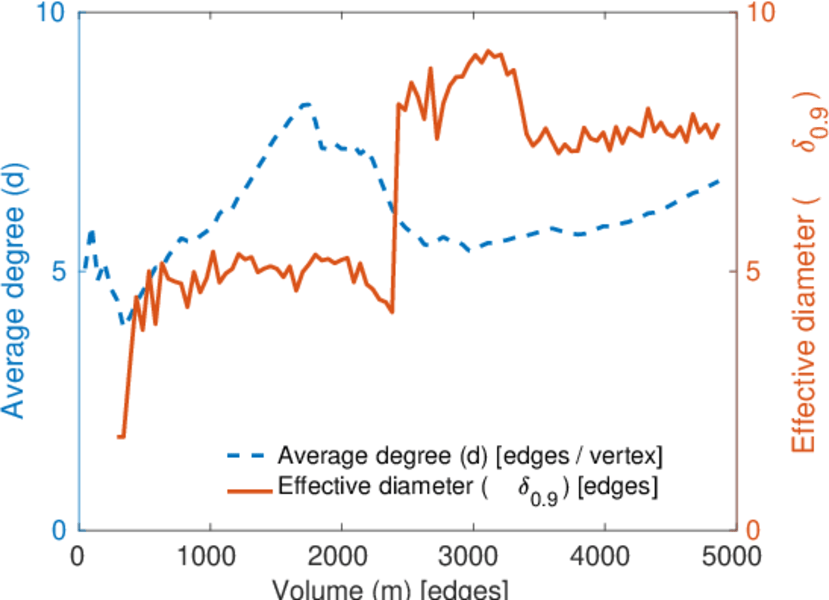
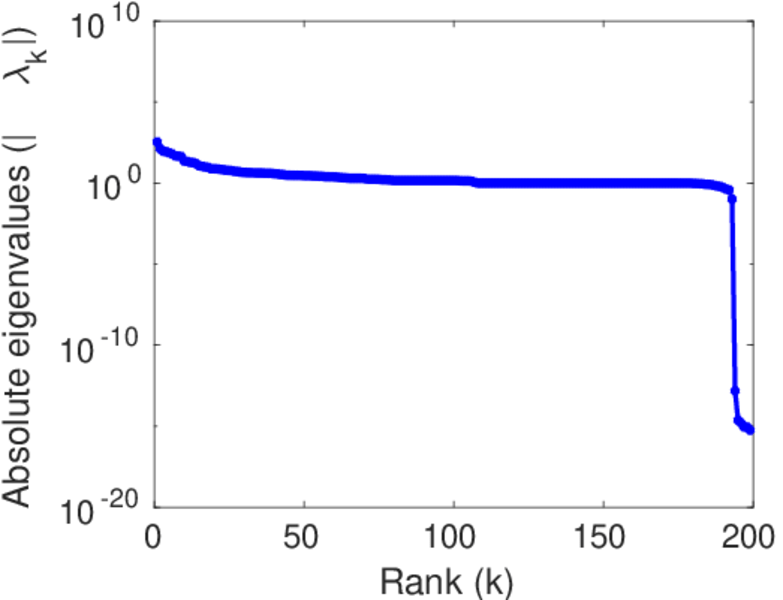
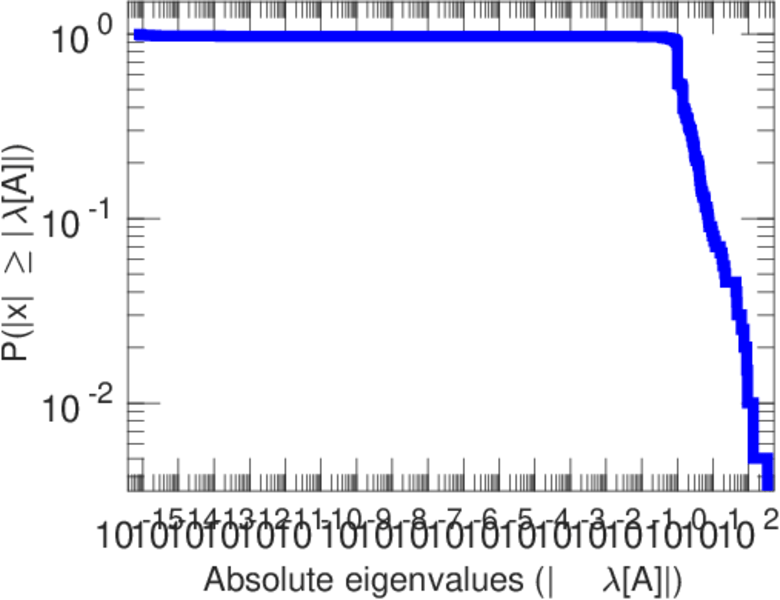
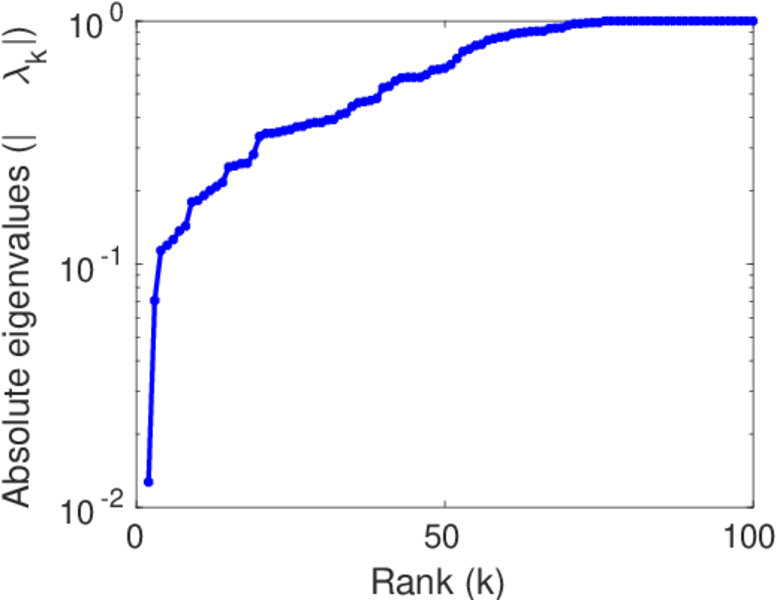
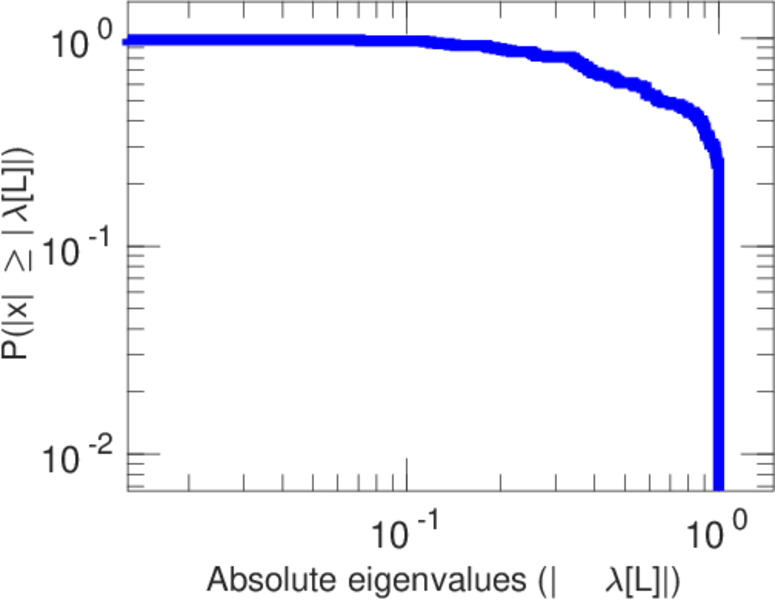
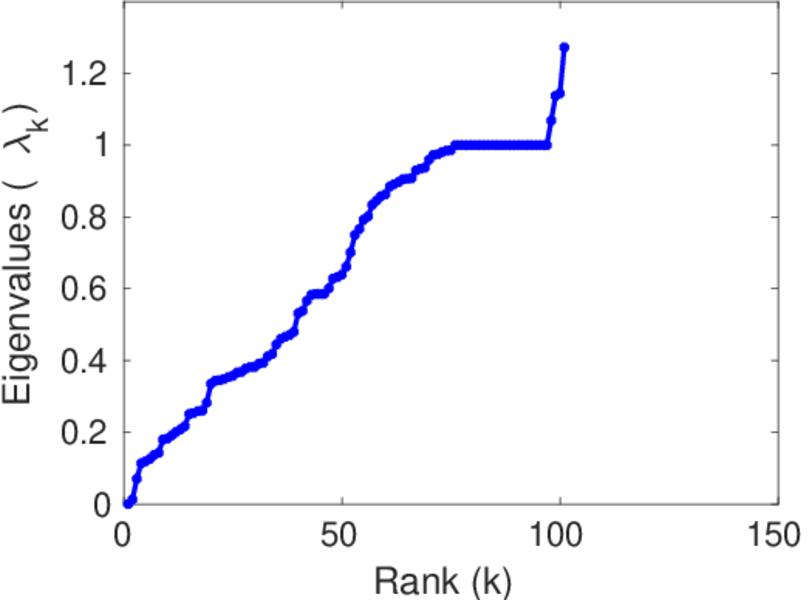
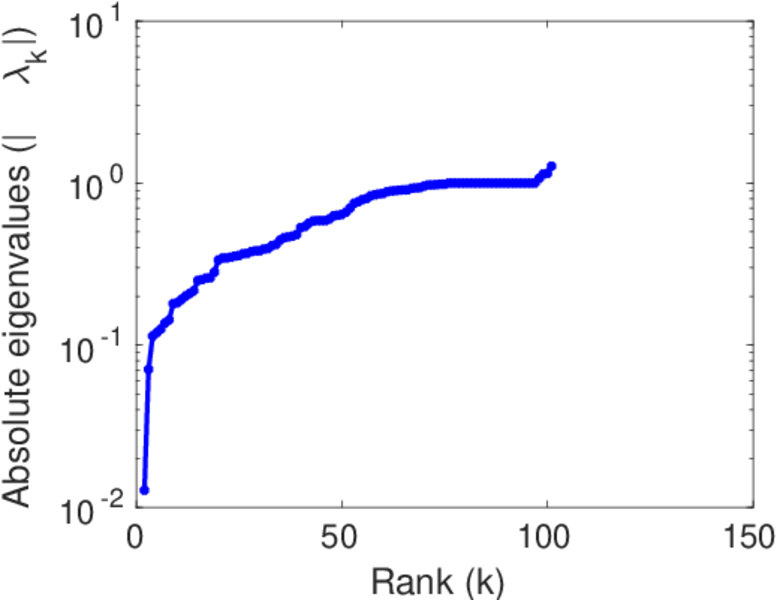
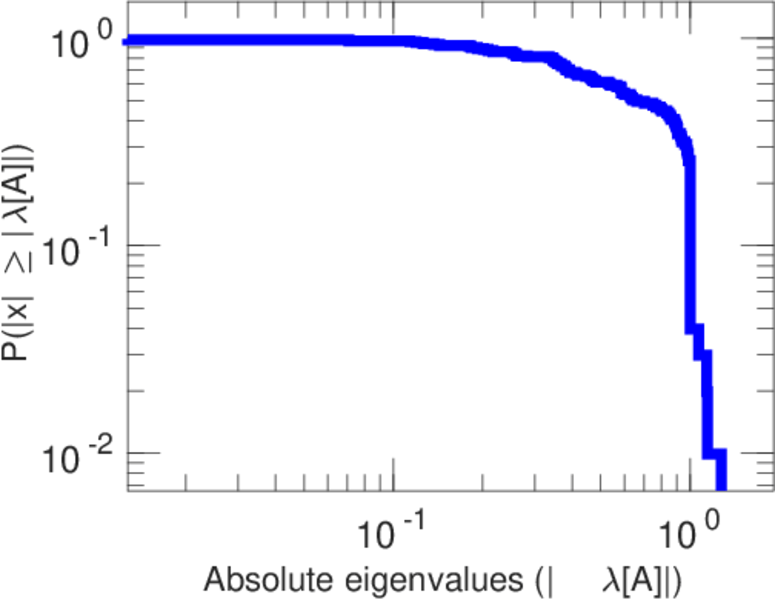
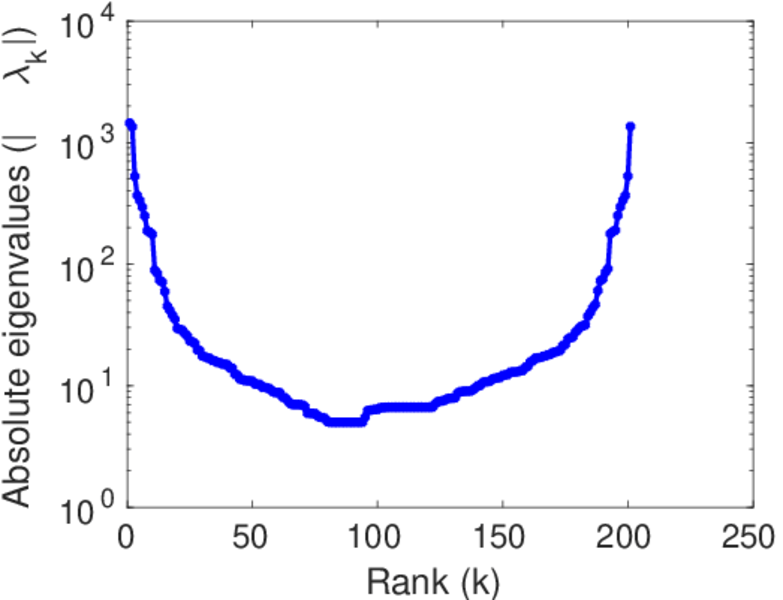
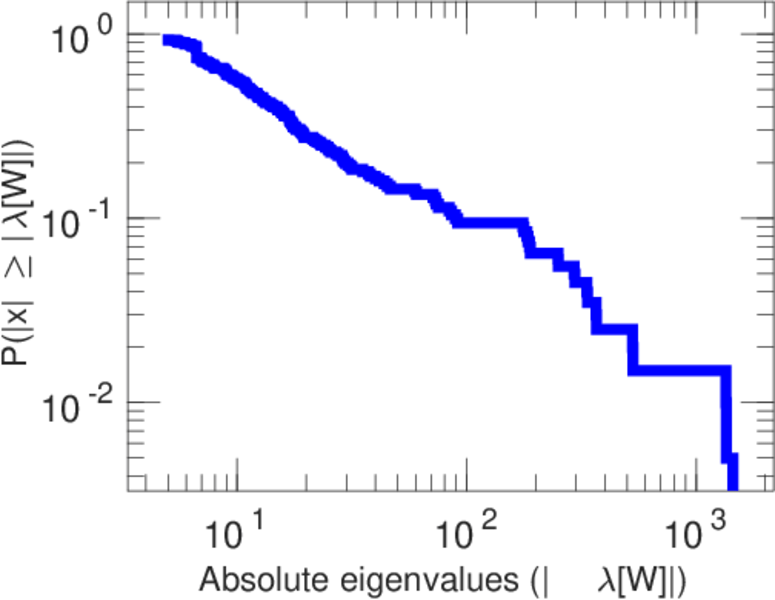
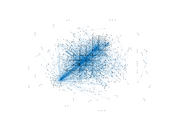
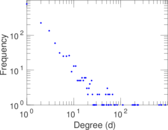
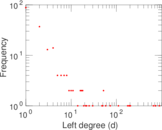
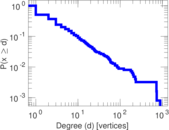
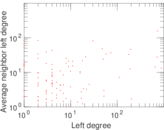
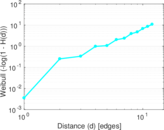
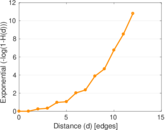
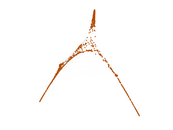
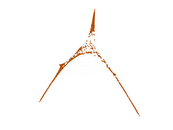
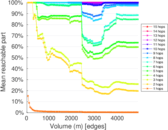
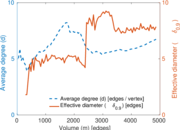
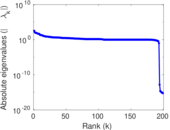
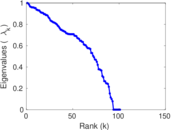
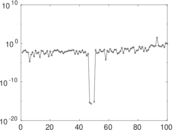
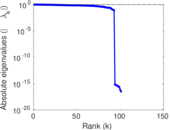
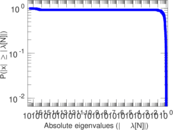
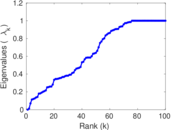
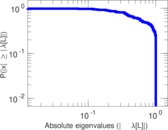
Plots


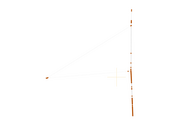
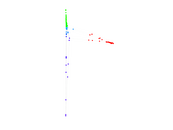
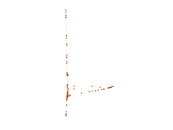

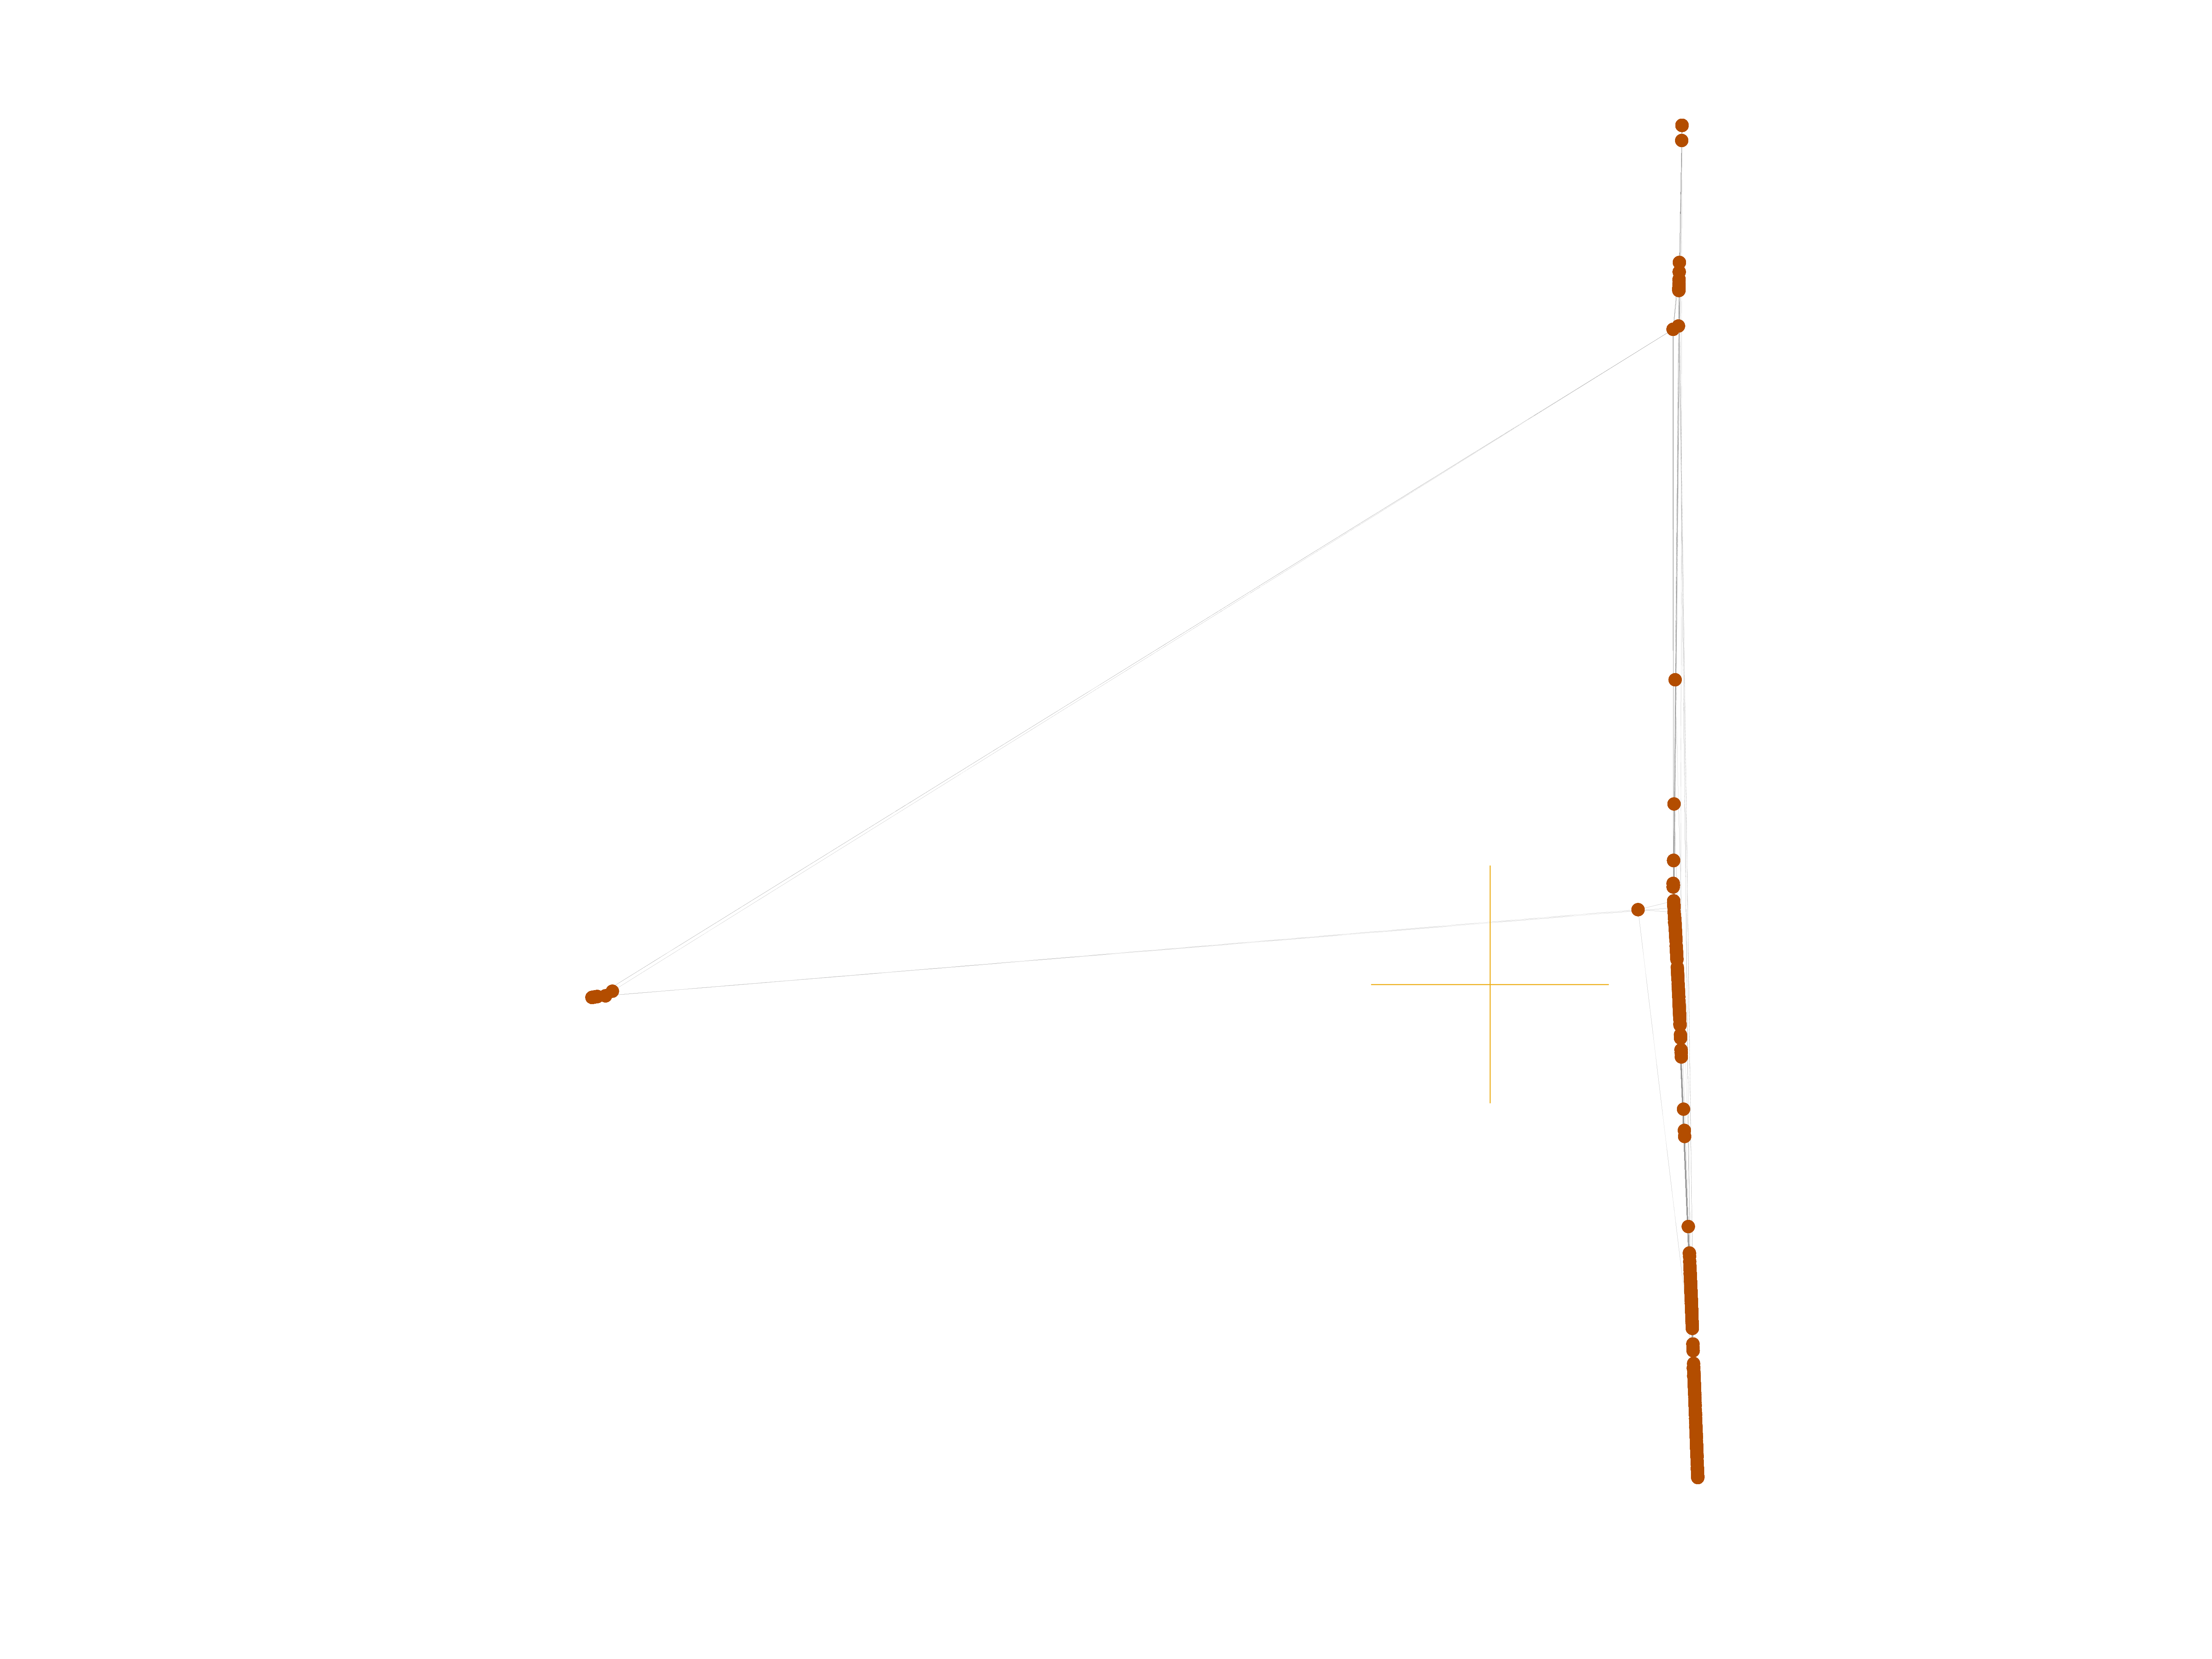
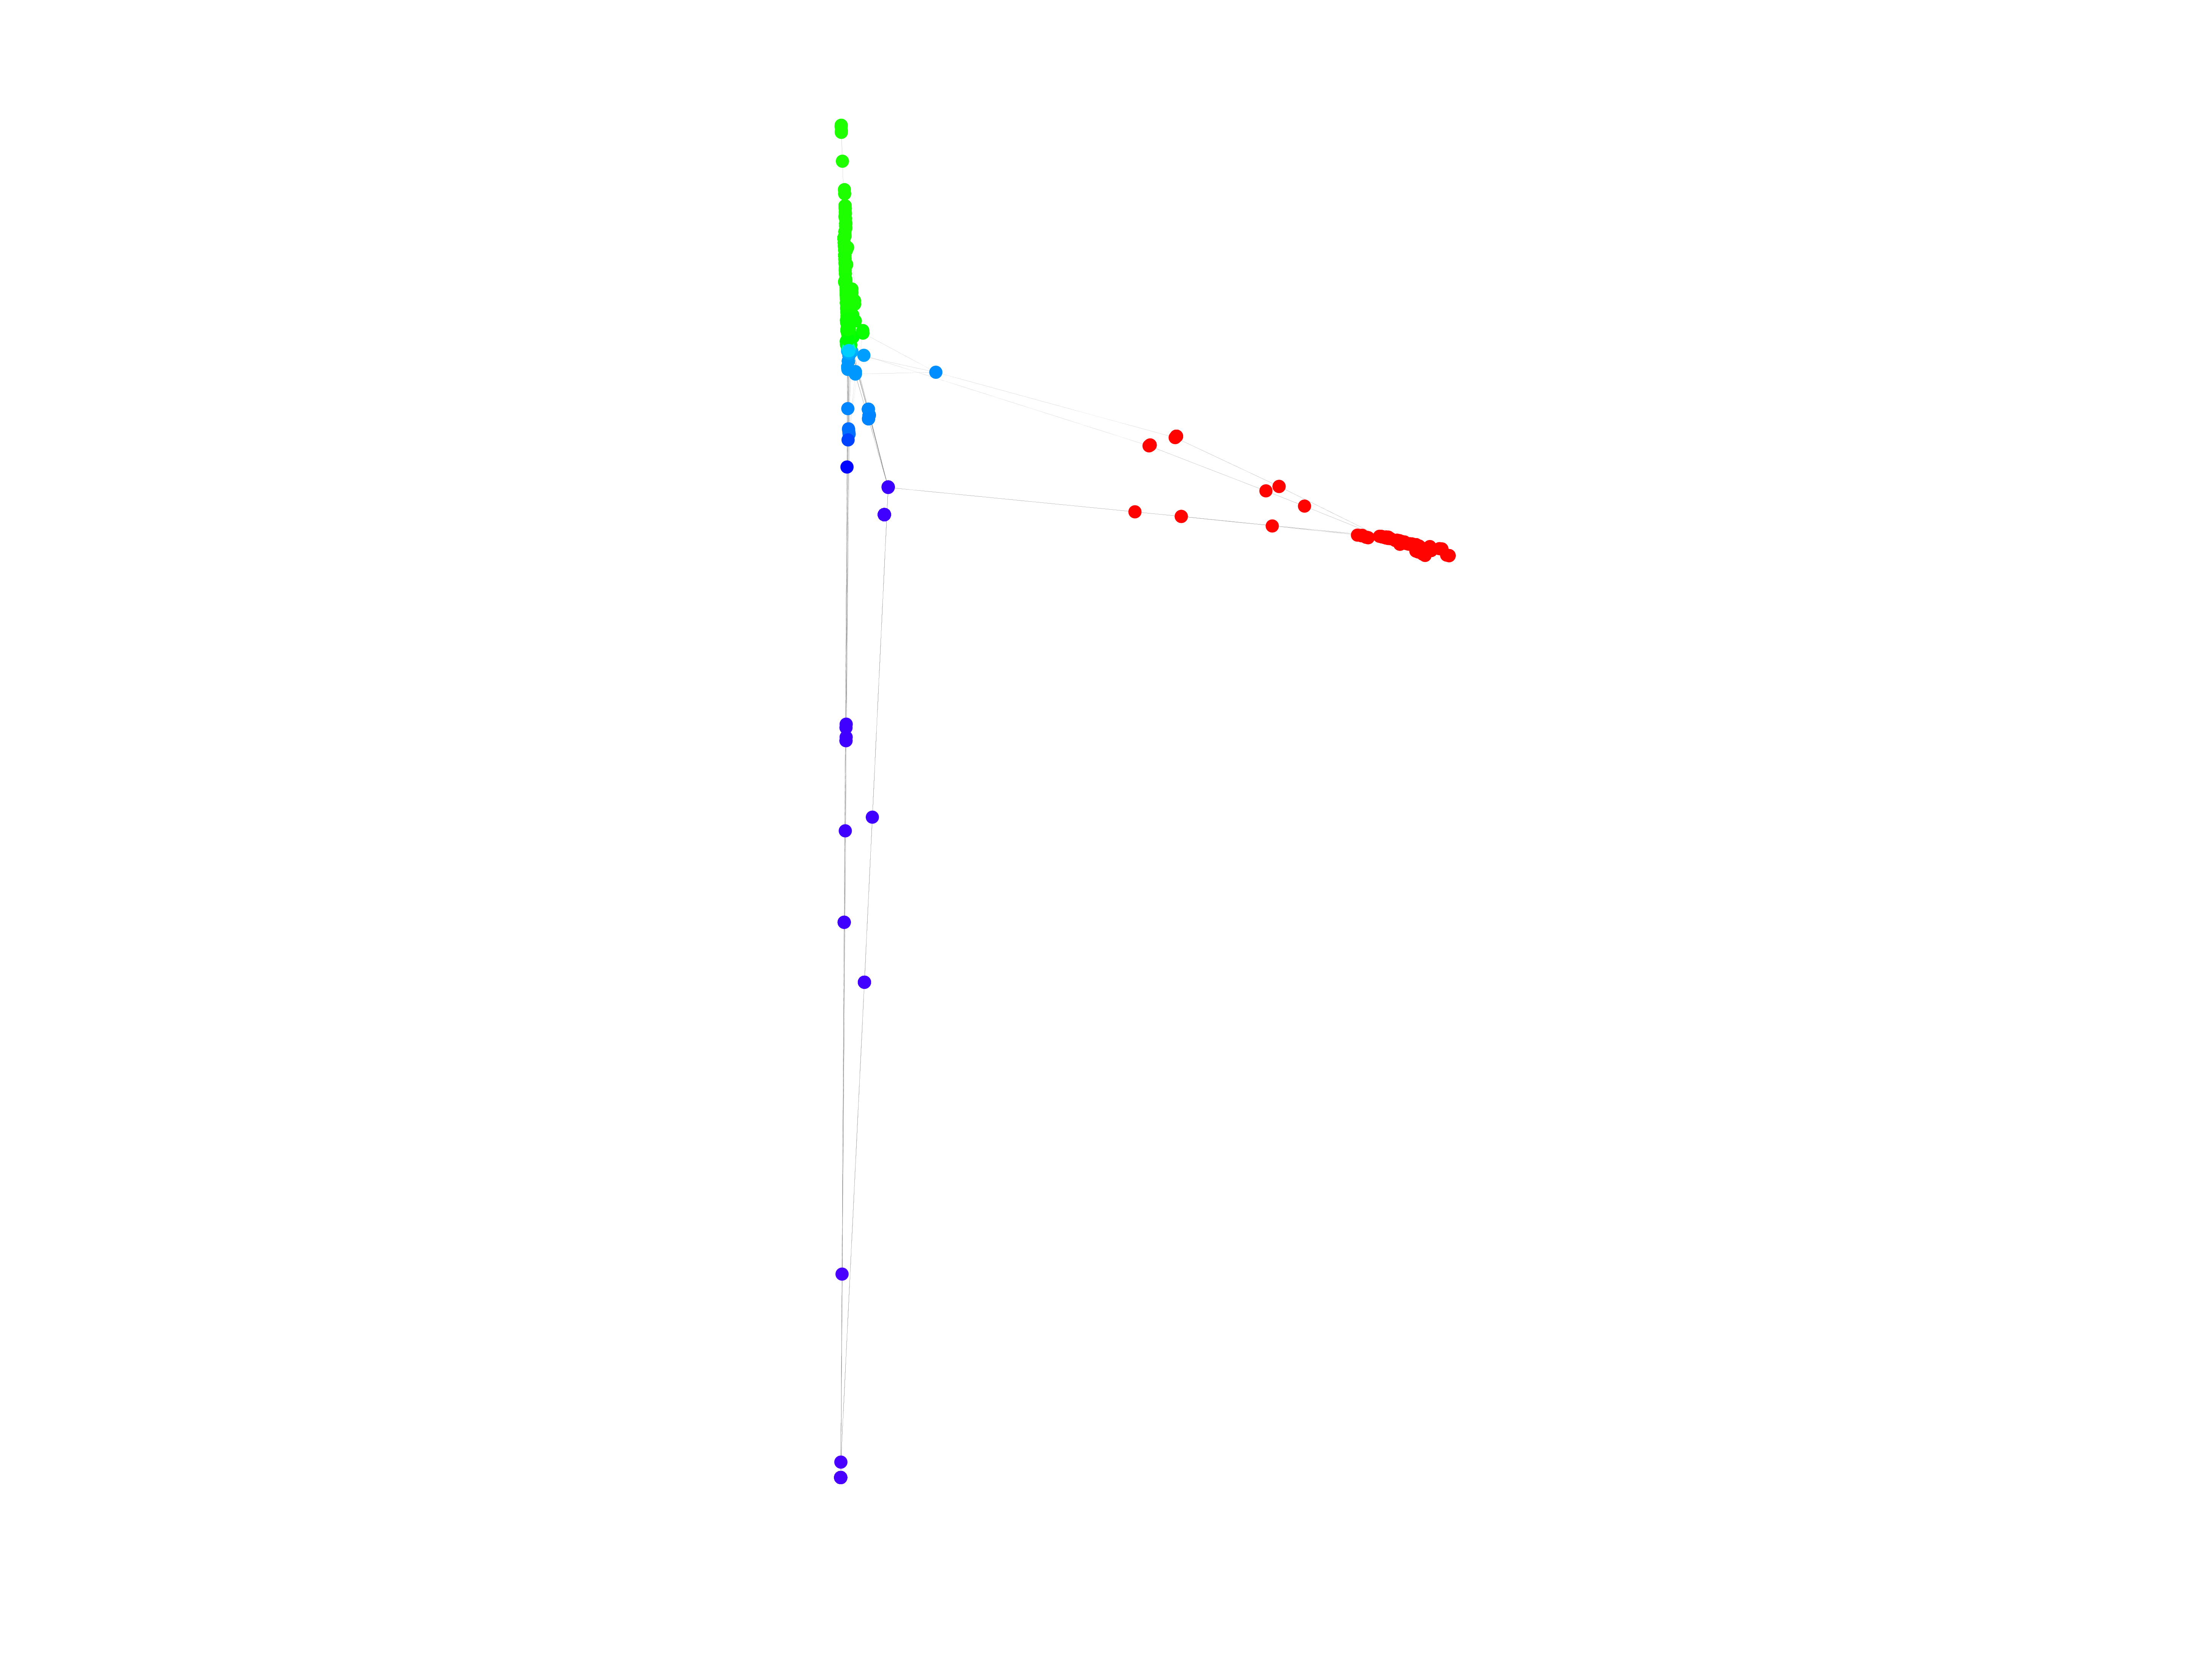
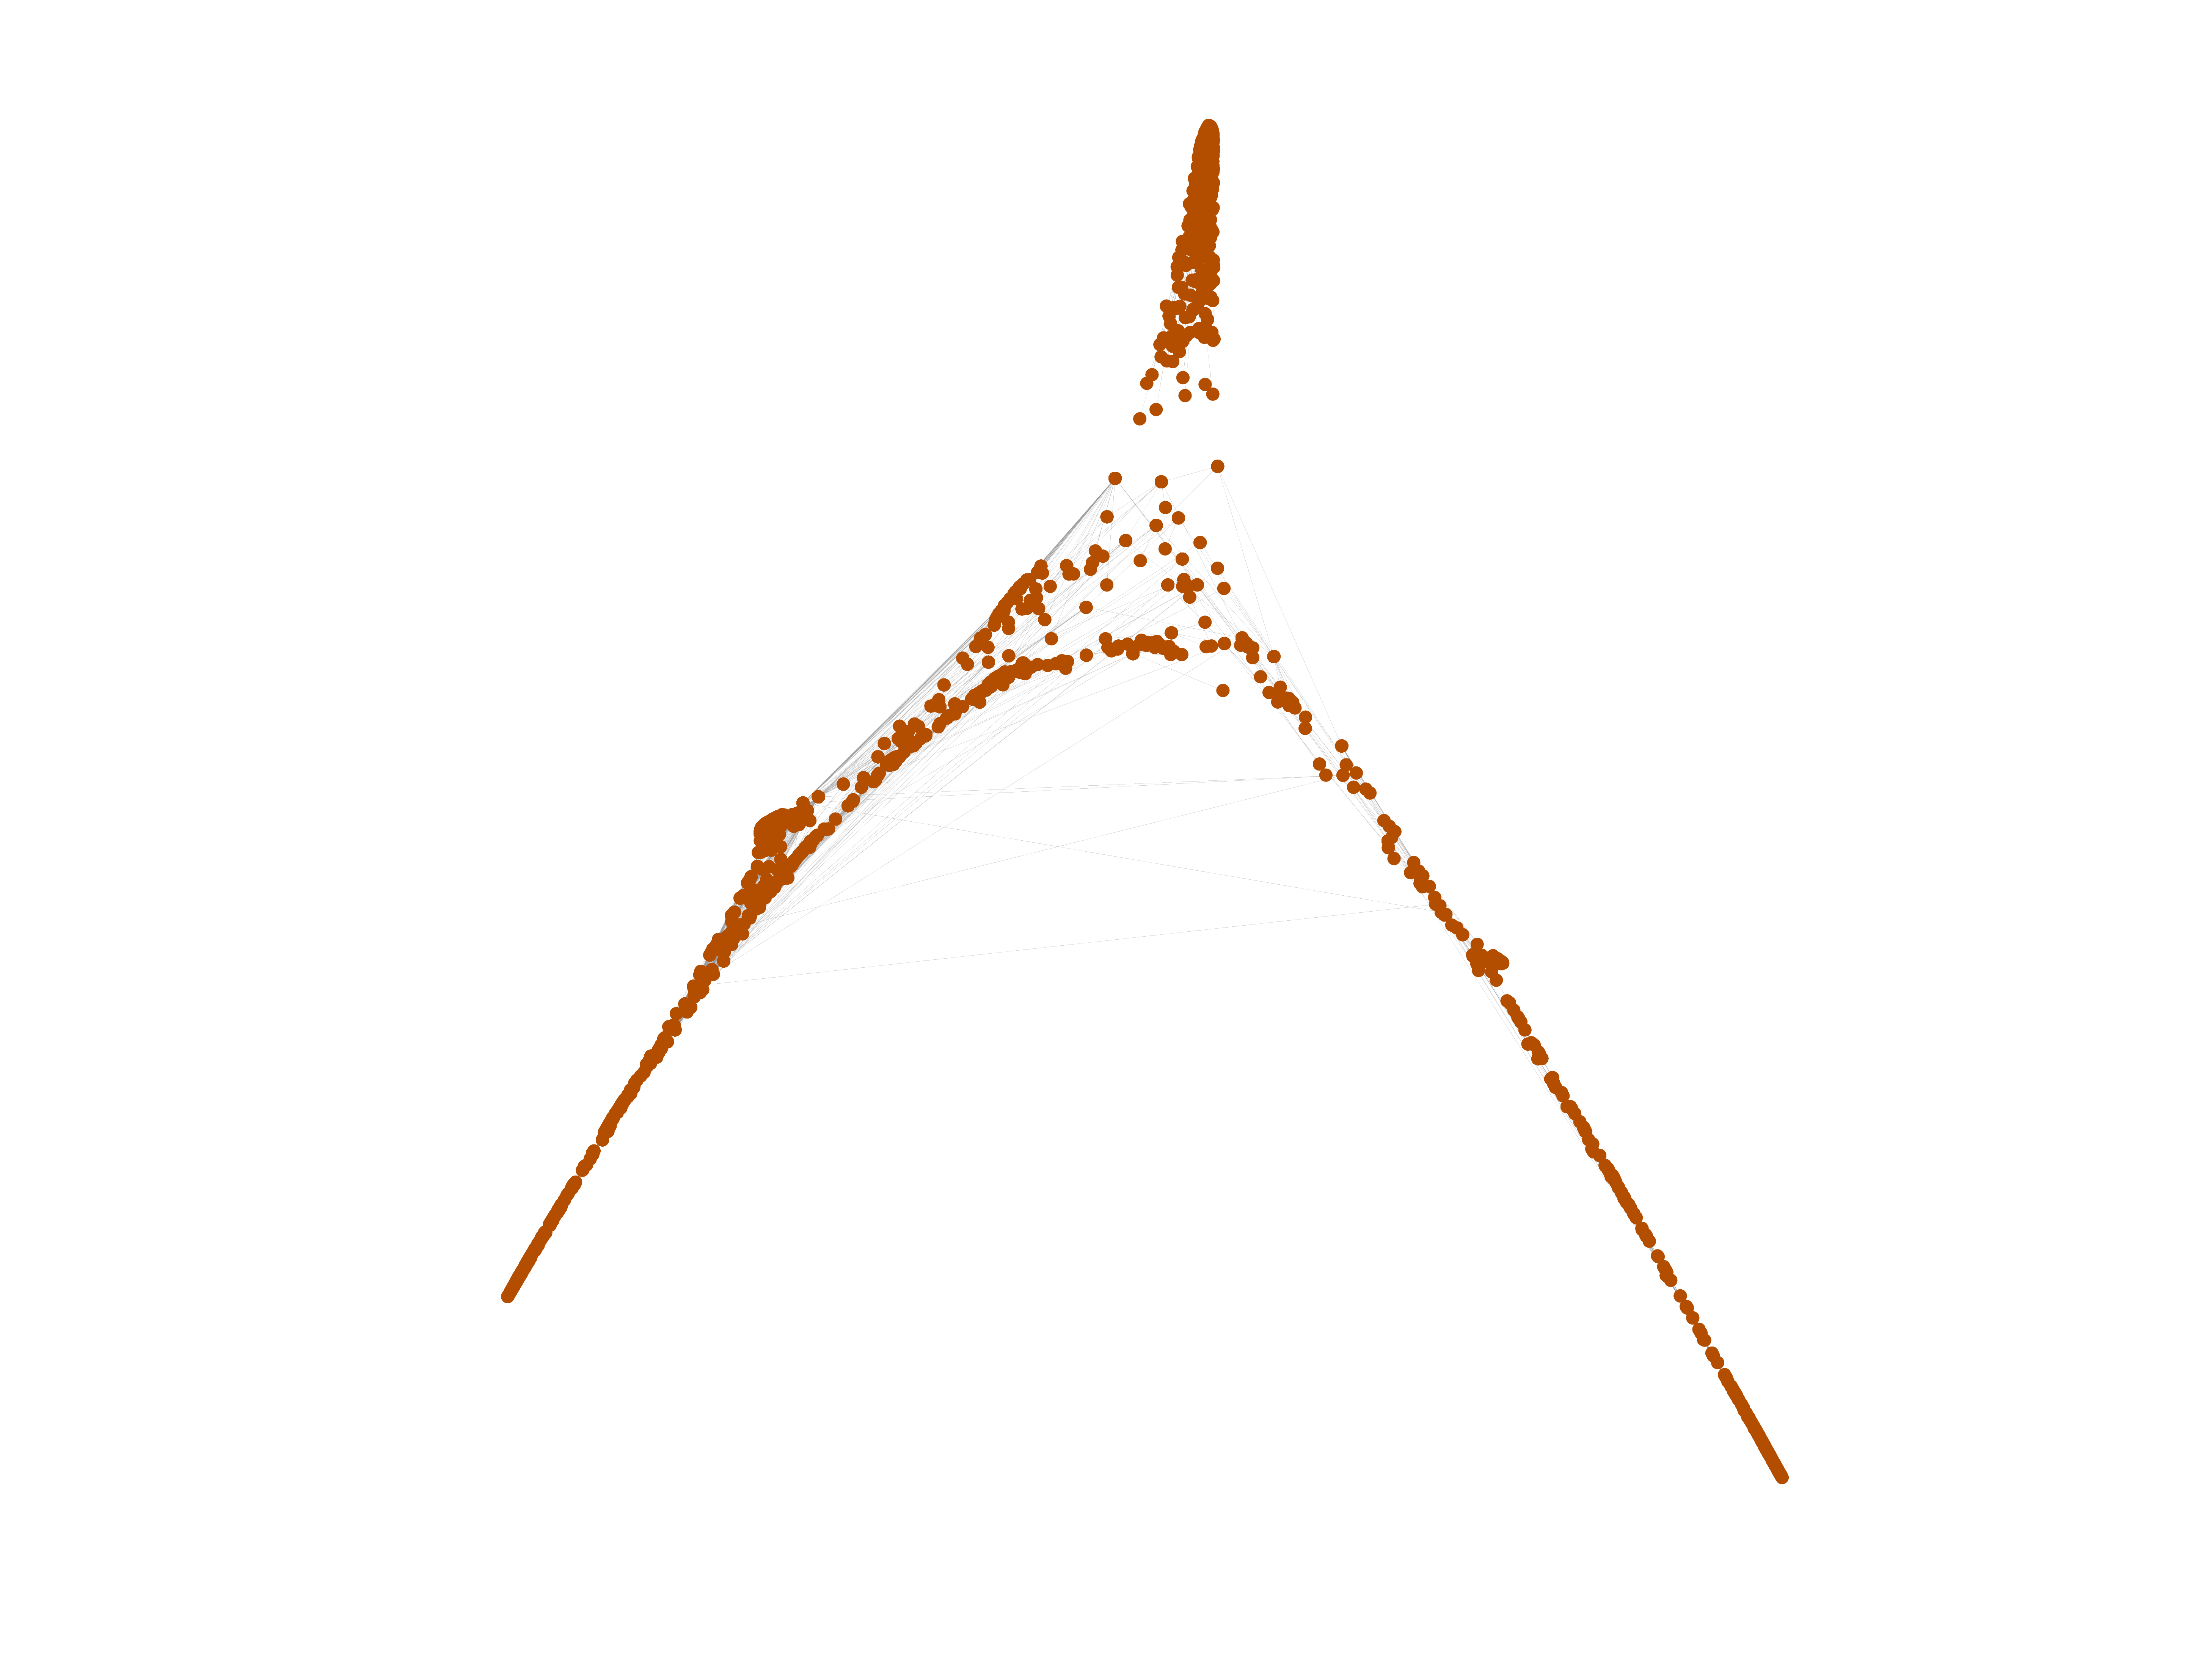
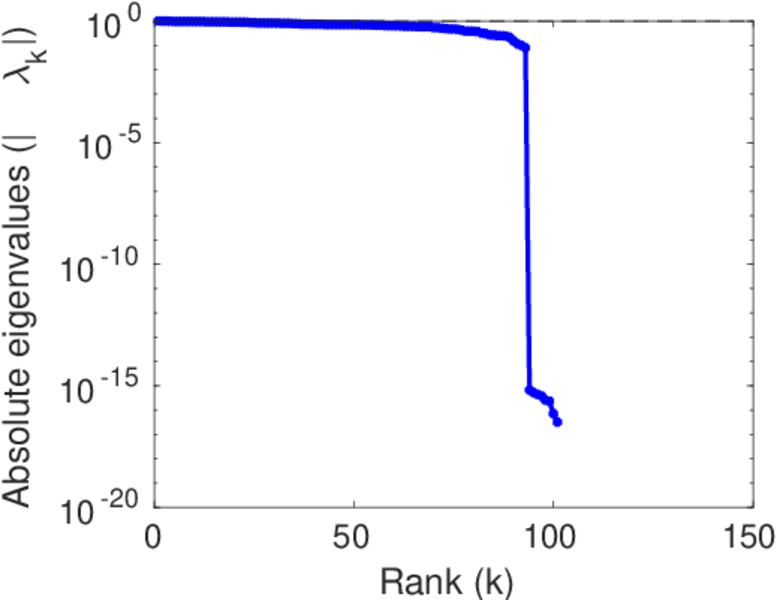
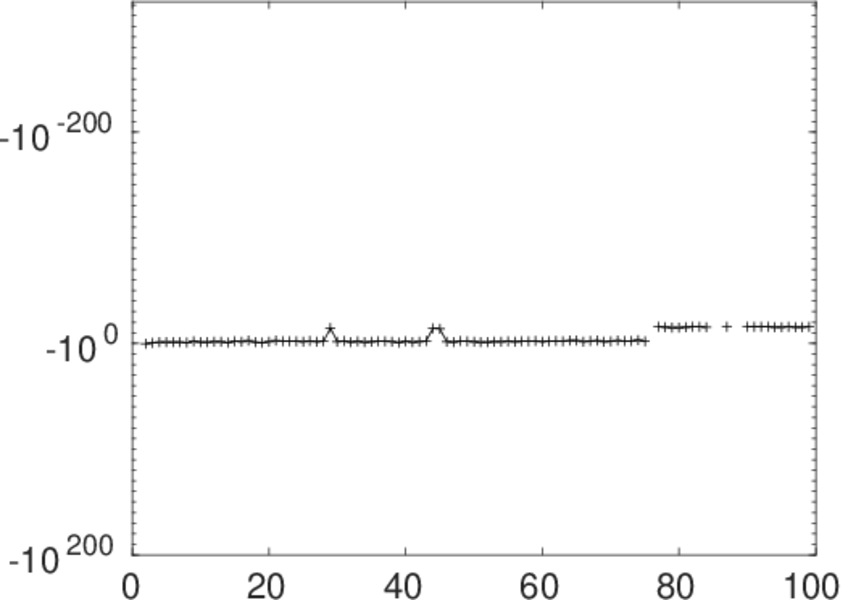
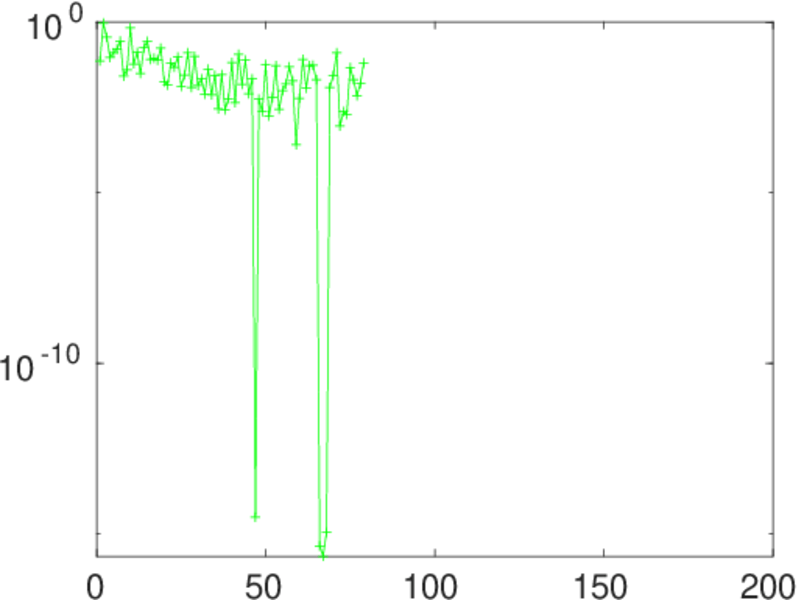
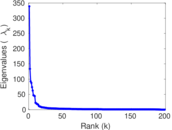
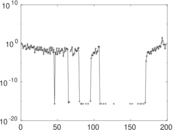
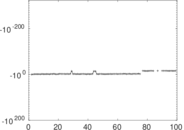
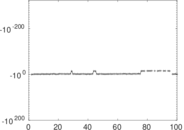
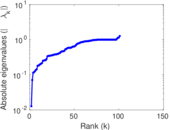
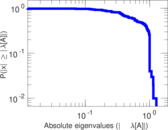
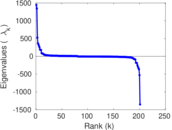
Matrix decompositions plots


Downloads
References
|
[1]
|
Jérôme Kunegis.
KONECT – The Koblenz Network Collection.
In Proc. Int. Conf. on World Wide Web Companion, pages
1343–1350, 2013.
[ http ]
|
|
[2]
|
Wikimedia Foundation.
Wikimedia downloads.
http://dumps.wikimedia.org/, January 2010.
|
 KONECT ‣ Networks ‣
Buy Me a Coffee
KONECT ‣ Networks ‣
Buy Me a Coffee