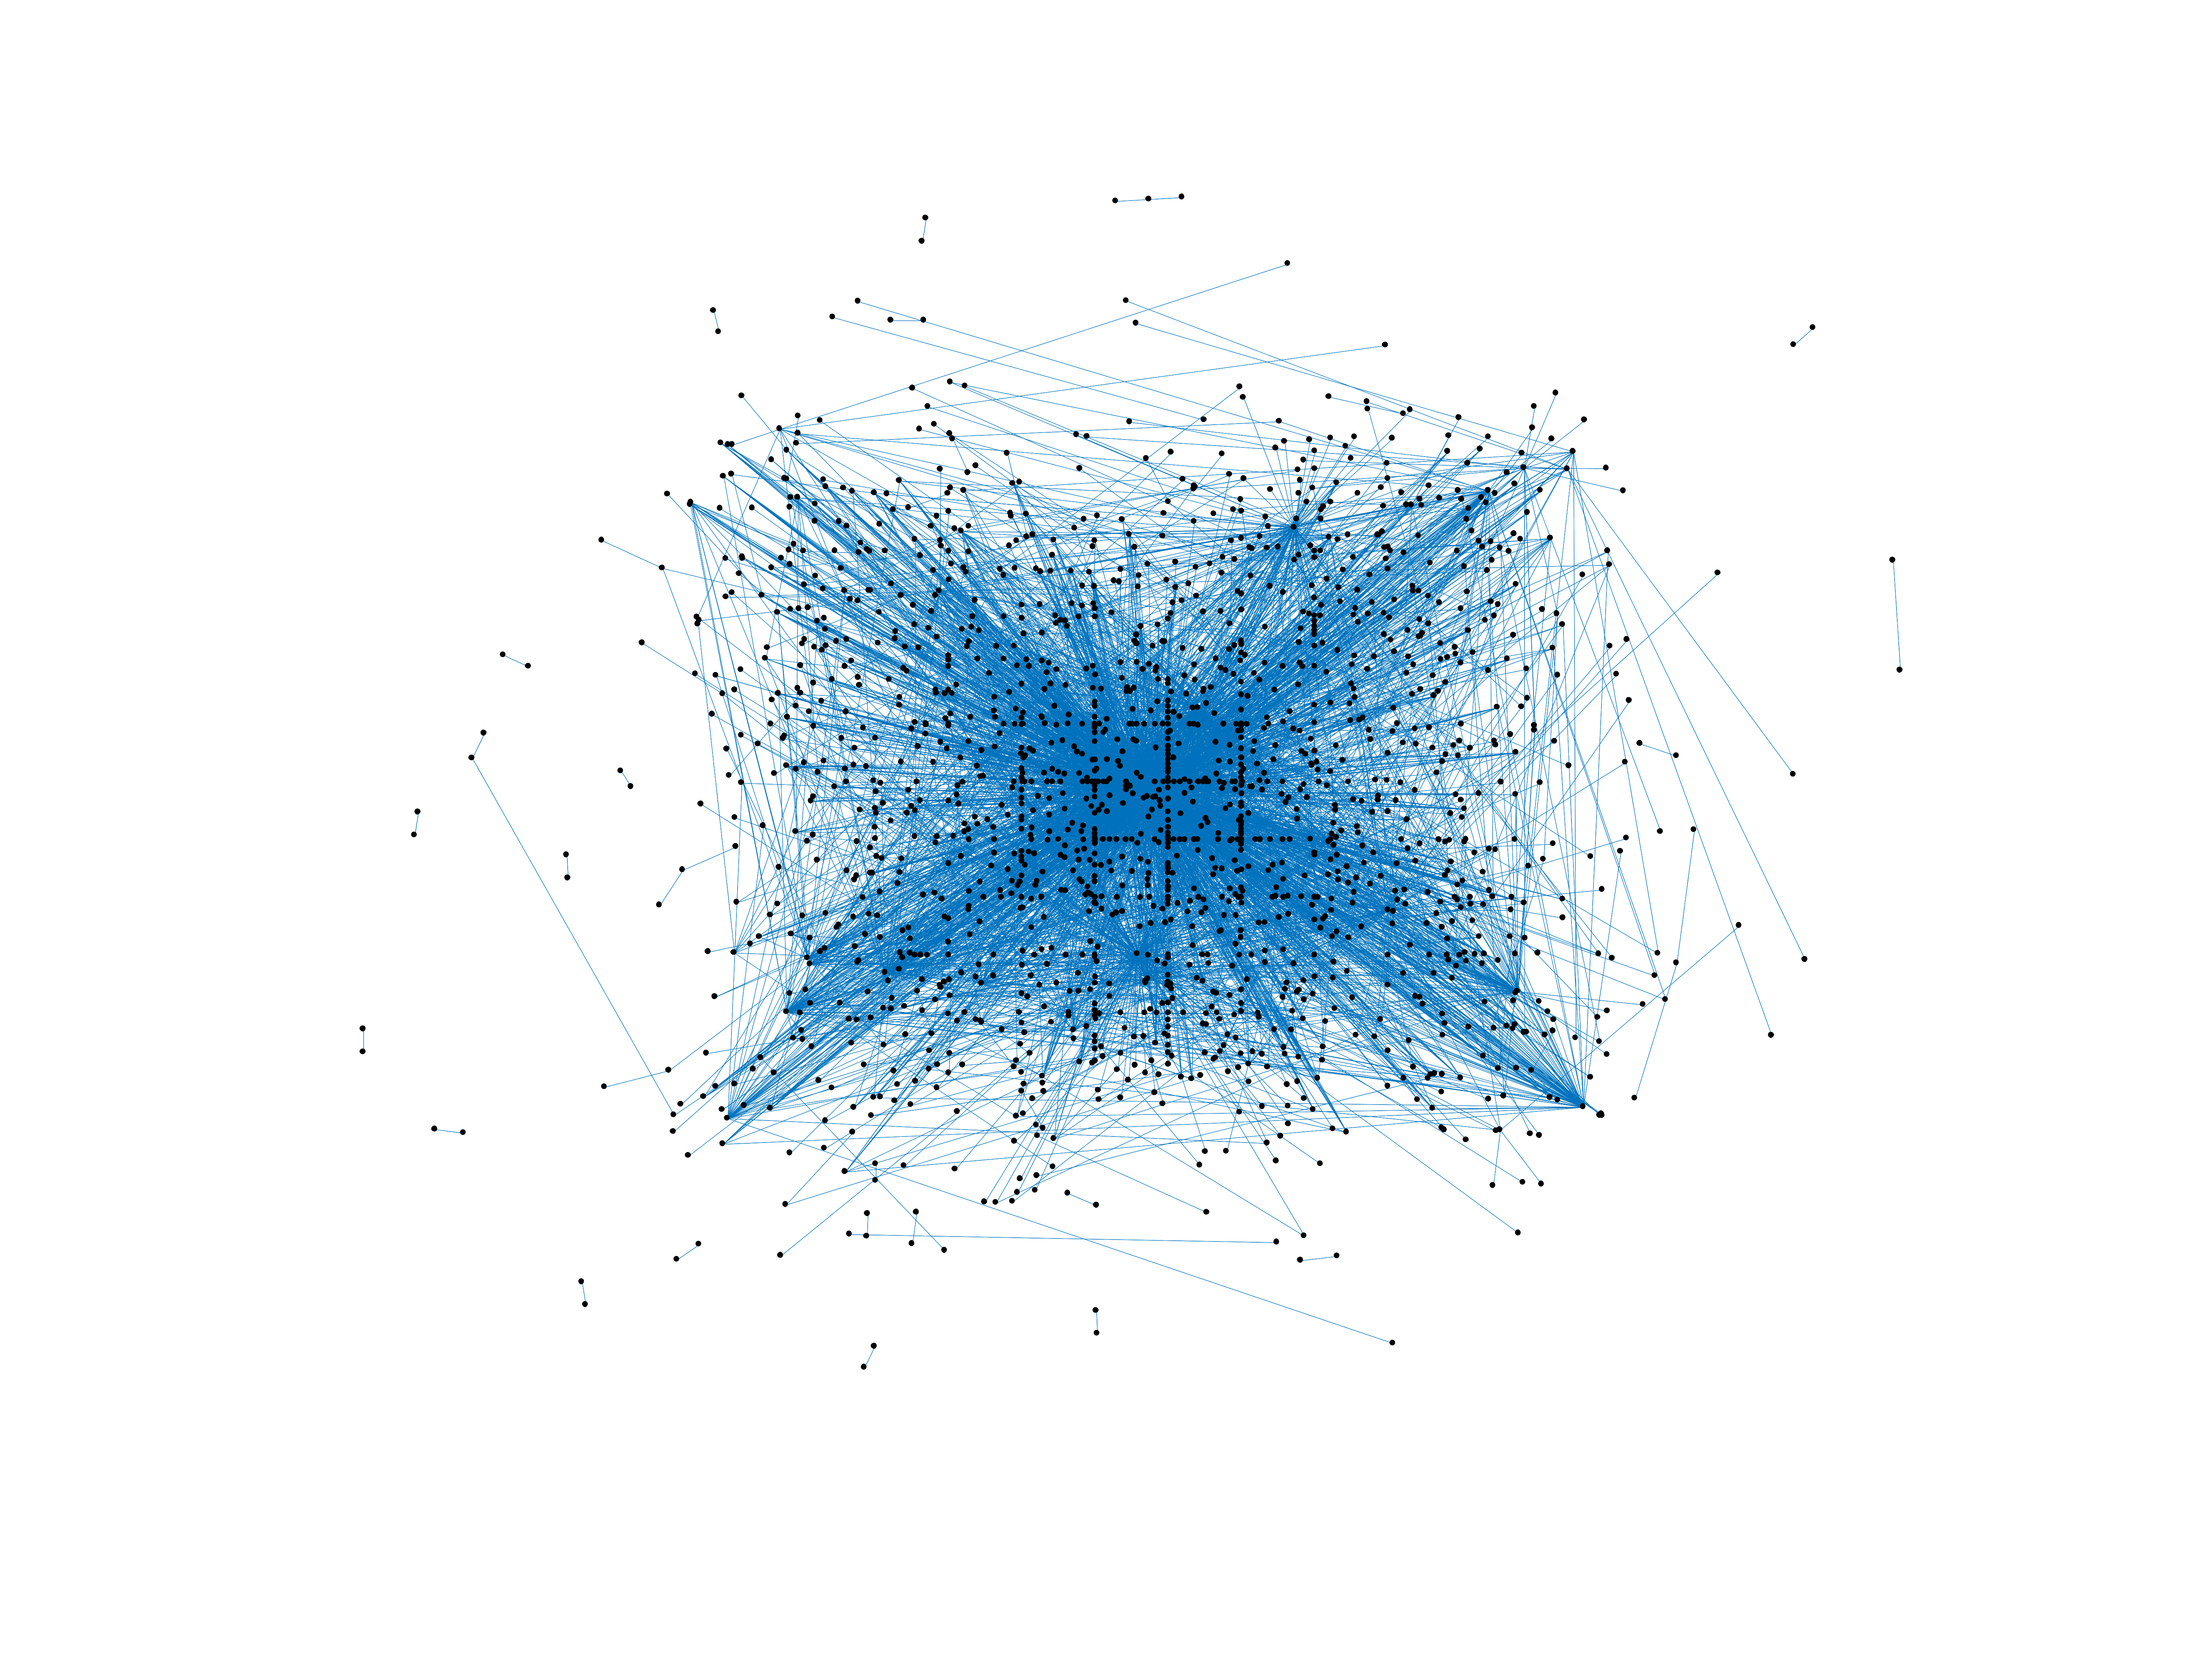
Wikiquote edits (et)
This is the bipartite edit network of the Estonian Wikiquote. It contains users
and pages from the Estonian Wikiquote, connected by edit events. Each edge
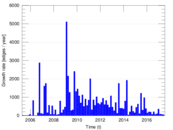
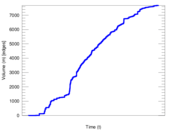
represents an edit. The dataset includes the timestamp of each edit.
Metadata
Statistics
| Size | n = | 1,822
|
| Left size | n1 = | 310
|
| Right size | n2 = | 1,512
|
| Volume | m = | 7,681
|
| Unique edge count | m̿ = | 4,474
|
| Wedge count | s = | 387,593
|
| Claw count | z = | 35,614,684
|
| Cross count | x = | 2,937,104,996
|
| Square count | q = | 276,815
|
| 4-Tour count | T4 = | 3,779,604
|
| Maximum degree | dmax = | 995
|
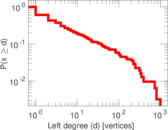
| Maximum left degree | d1max = | 995
|
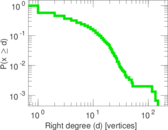
| Maximum right degree | d2max = | 150
|
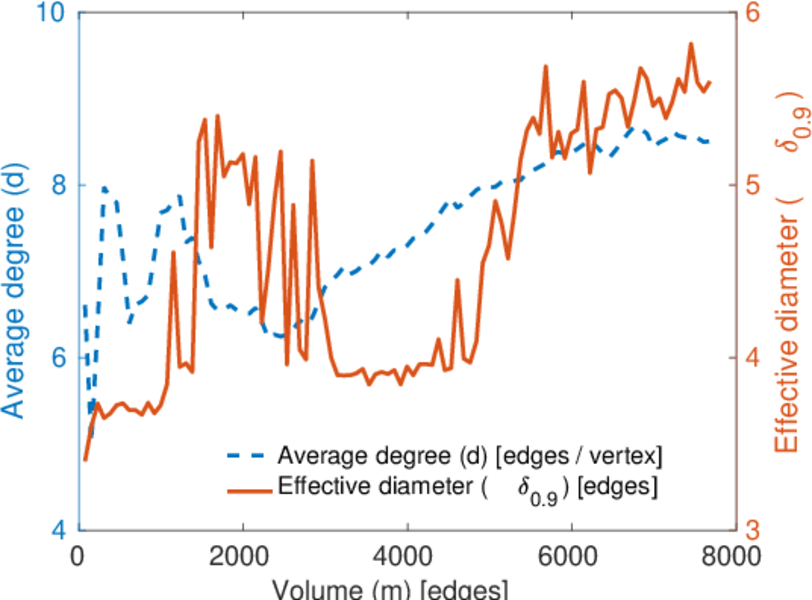
| Average degree | d = | 8.431 39
|
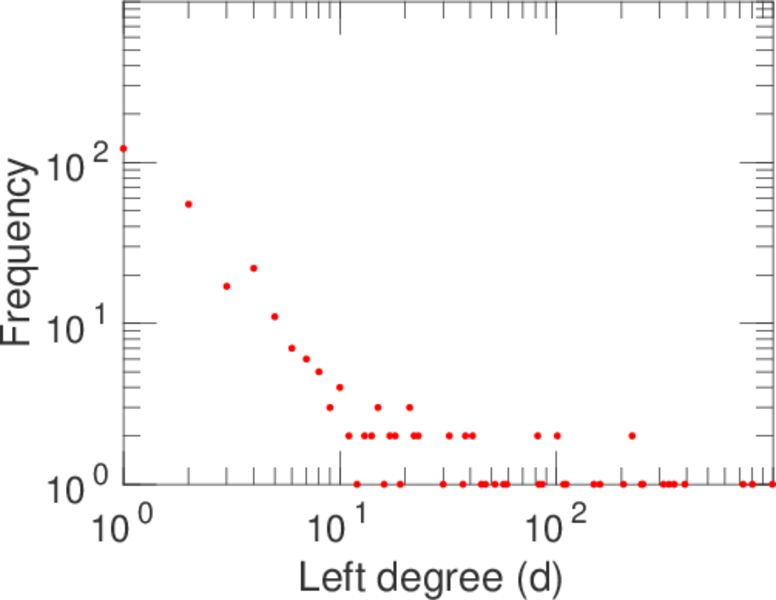
| Average left degree | d1 = | 24.777 4
|
| Average right degree | d2 = | 5.080 03
|
| Fill | p = | 0.009 545 14
|
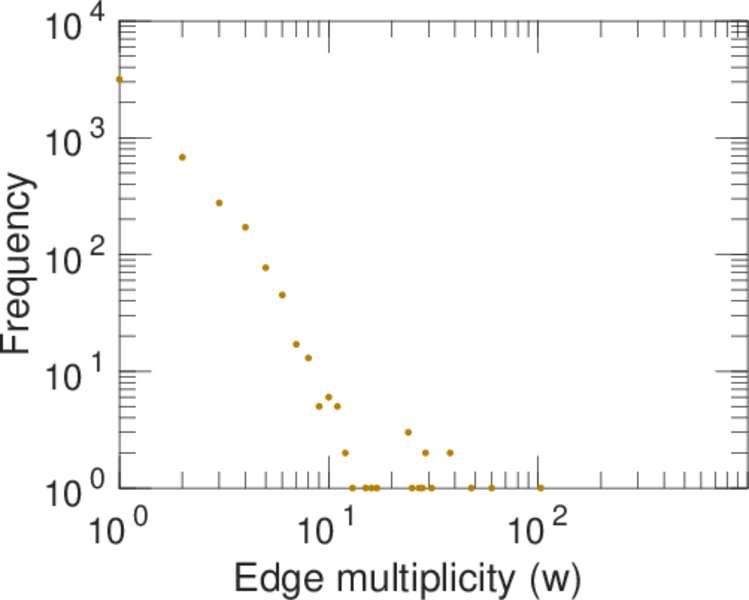
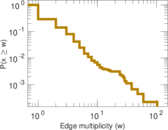
| Average edge multiplicity | m̃ = | 1.716 81
|
| Size of LCC | N = | 1,559
|
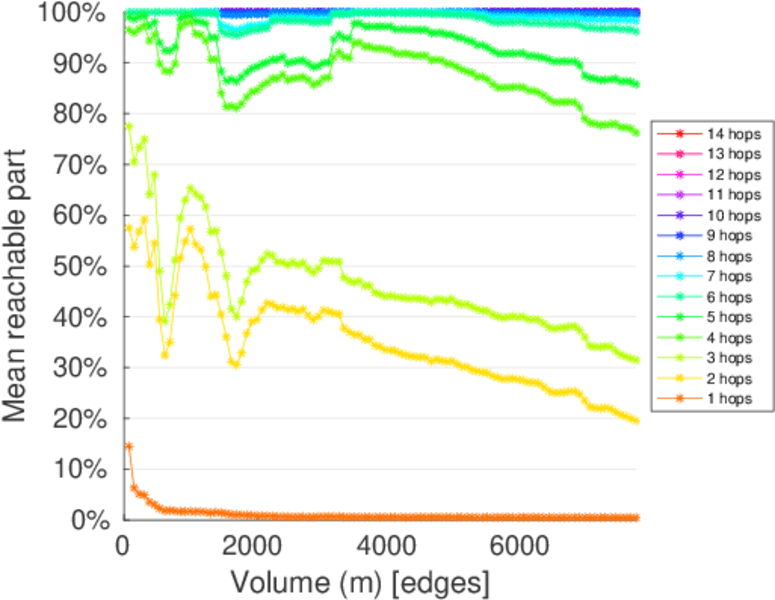
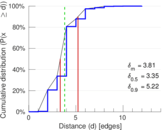
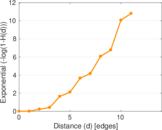
| Diameter | δ = | 14
|
| 50-Percentile effective diameter | δ0.5 = | 3.346 95
|
| 90-Percentile effective diameter | δ0.9 = | 5.221 43
|
| Median distance | δM = | 4
|
| Mean distance | δm = | 3.810 22
|
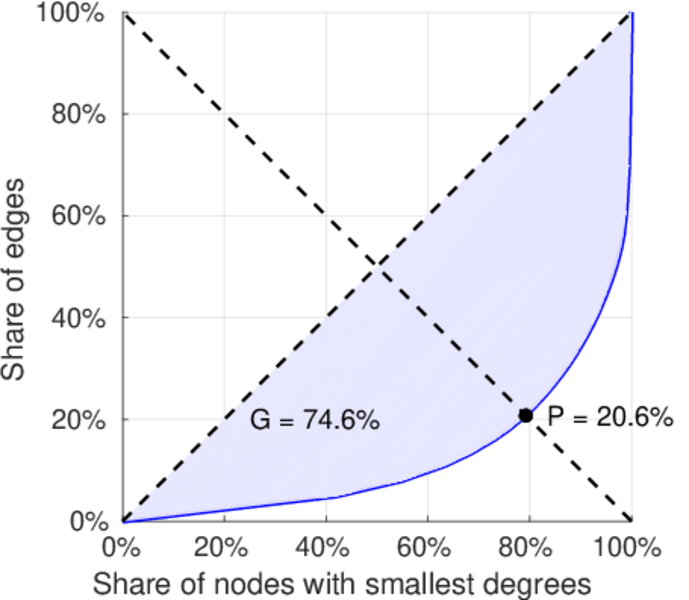
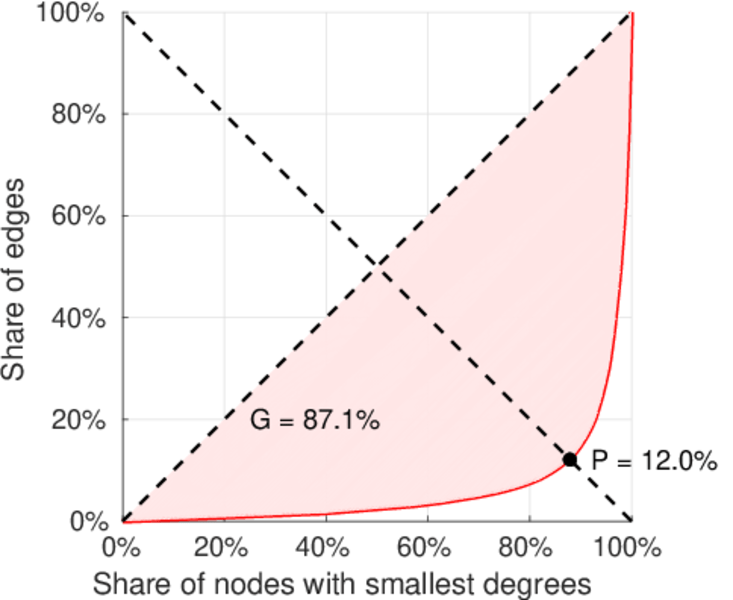
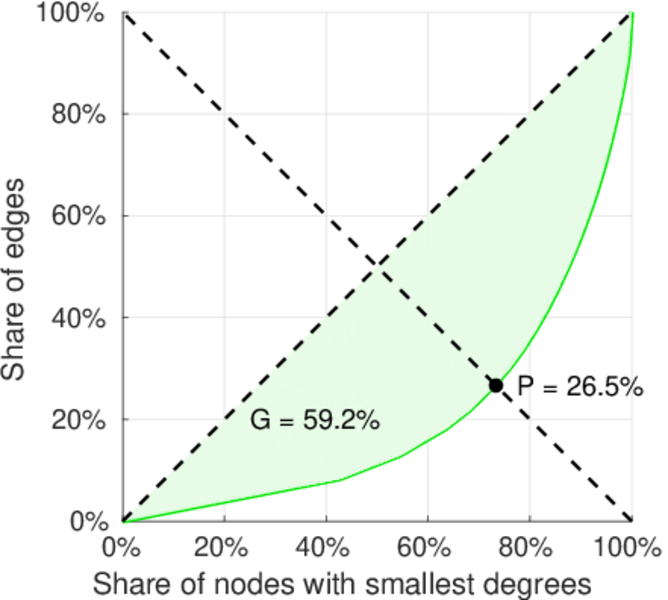
| Gini coefficient | G = | 0.758 852
|
| Balanced inequality ratio | P = | 0.203 945
|
| Left balanced inequality ratio | P1 = | 0.119 516
|
| Right balanced inequality ratio | P2 = | 0.265 070
|
| Relative edge distribution entropy | Her = | 0.817 008
|
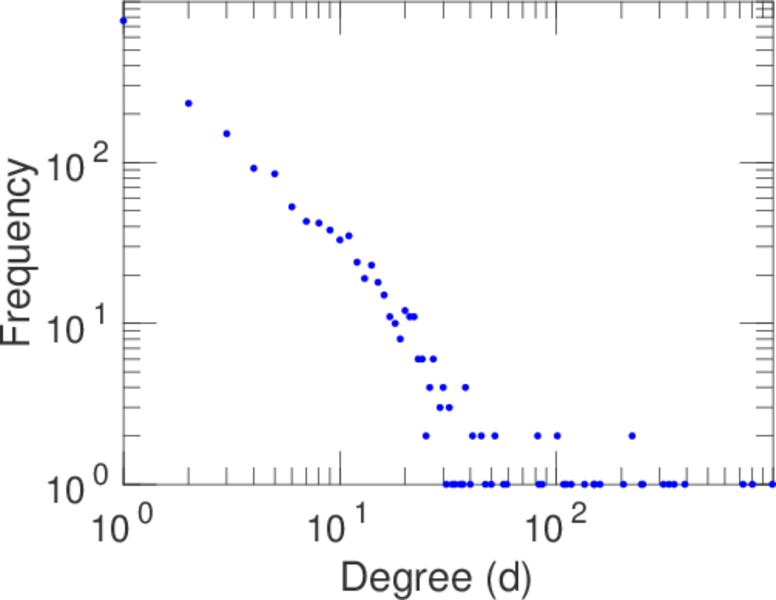
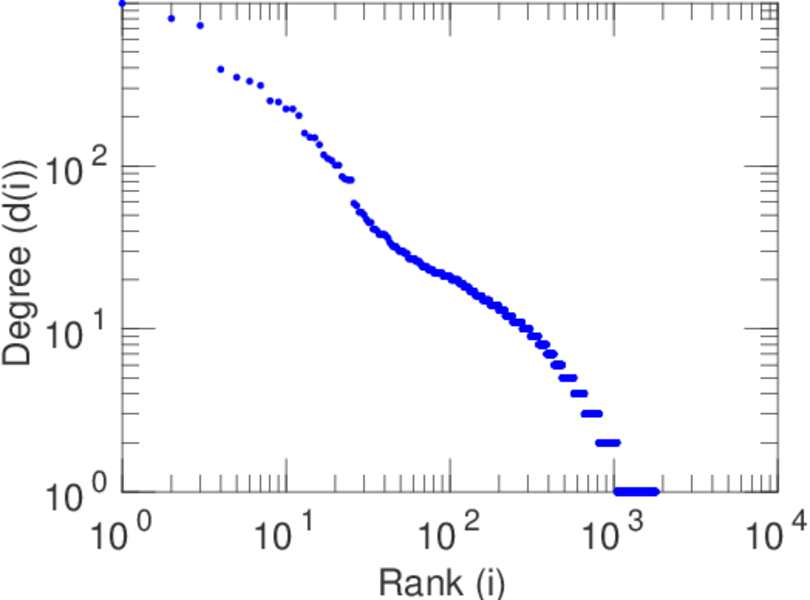
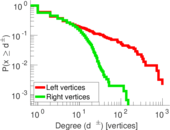
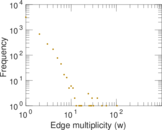
| Power law exponent | γ = | 2.332 43
|
| Tail power law exponent | γt = | 1.831 00
|
| Tail power law exponent with p | γ3 = | 1.831 00
|
| p-value | p = | 0.000 00
|
| Left tail power law exponent with p | γ3,1 = | 1.671 00
|
| Left p-value | p1 = | 0.165 000
|
| Right tail power law exponent with p | γ3,2 = | 7.211 00
|
| Right p-value | p2 = | 0.343 000
|
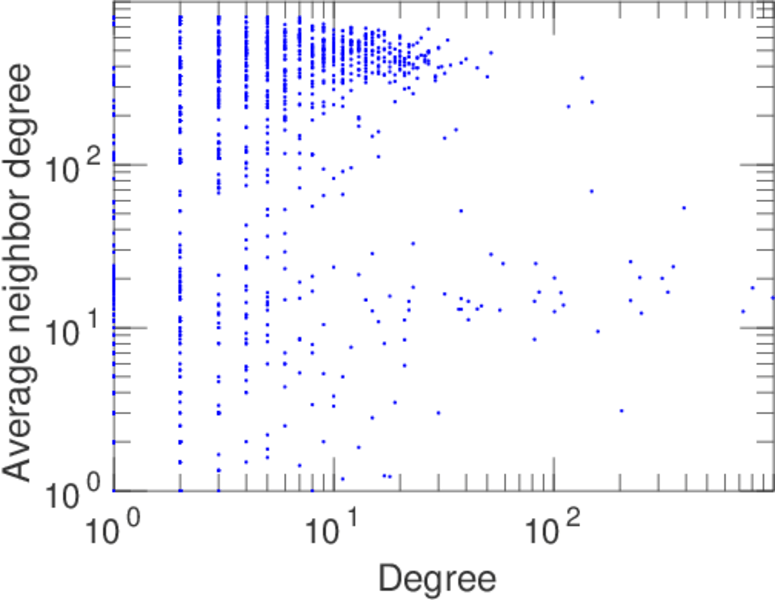
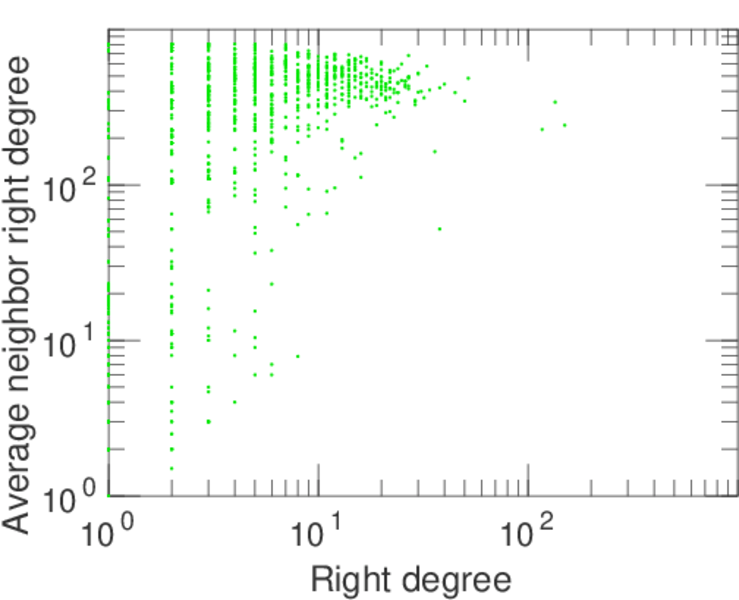
| Degree assortativity | ρ = | −0.046 074 7
|
| Degree assortativity p-value | pρ = | 0.002 051 88
|
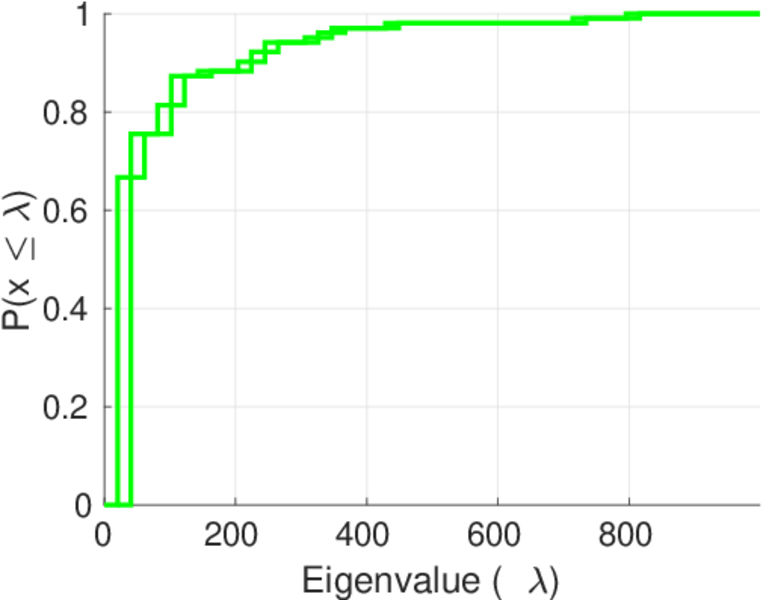
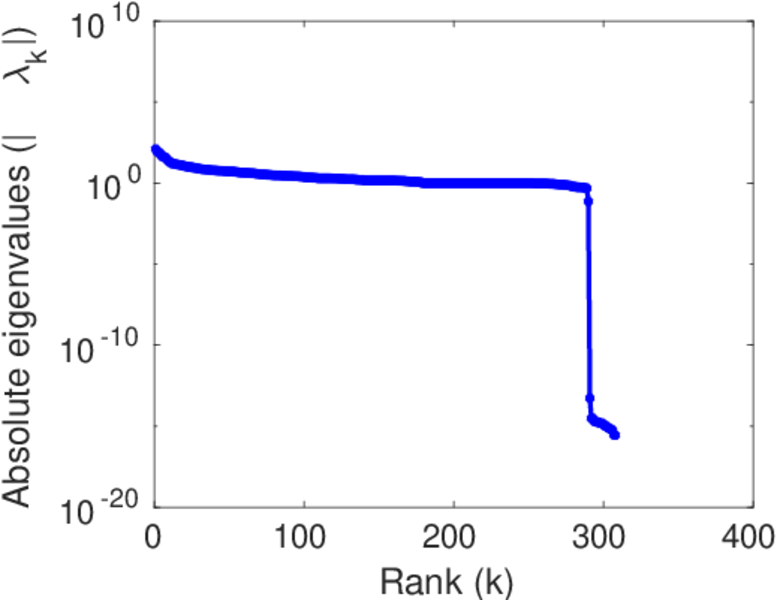
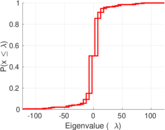
| Spectral norm | α = | 122.656
|
| Algebraic connectivity | a = | 0.010 700 7
|
| Spectral separation | |λ1[A] / λ2[A]| = | 1.434 07
|
| Controllability | C = | 1,226
|
| Relative controllability | Cr = | 0.678 848
|
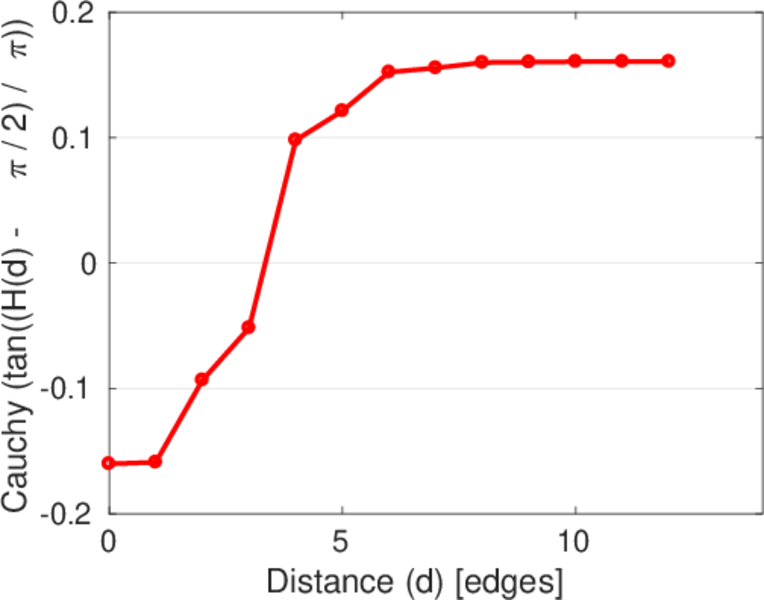
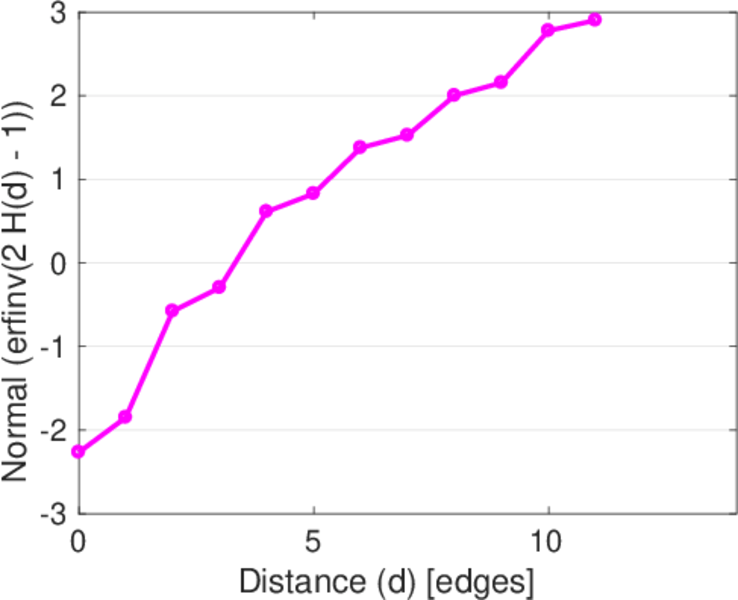
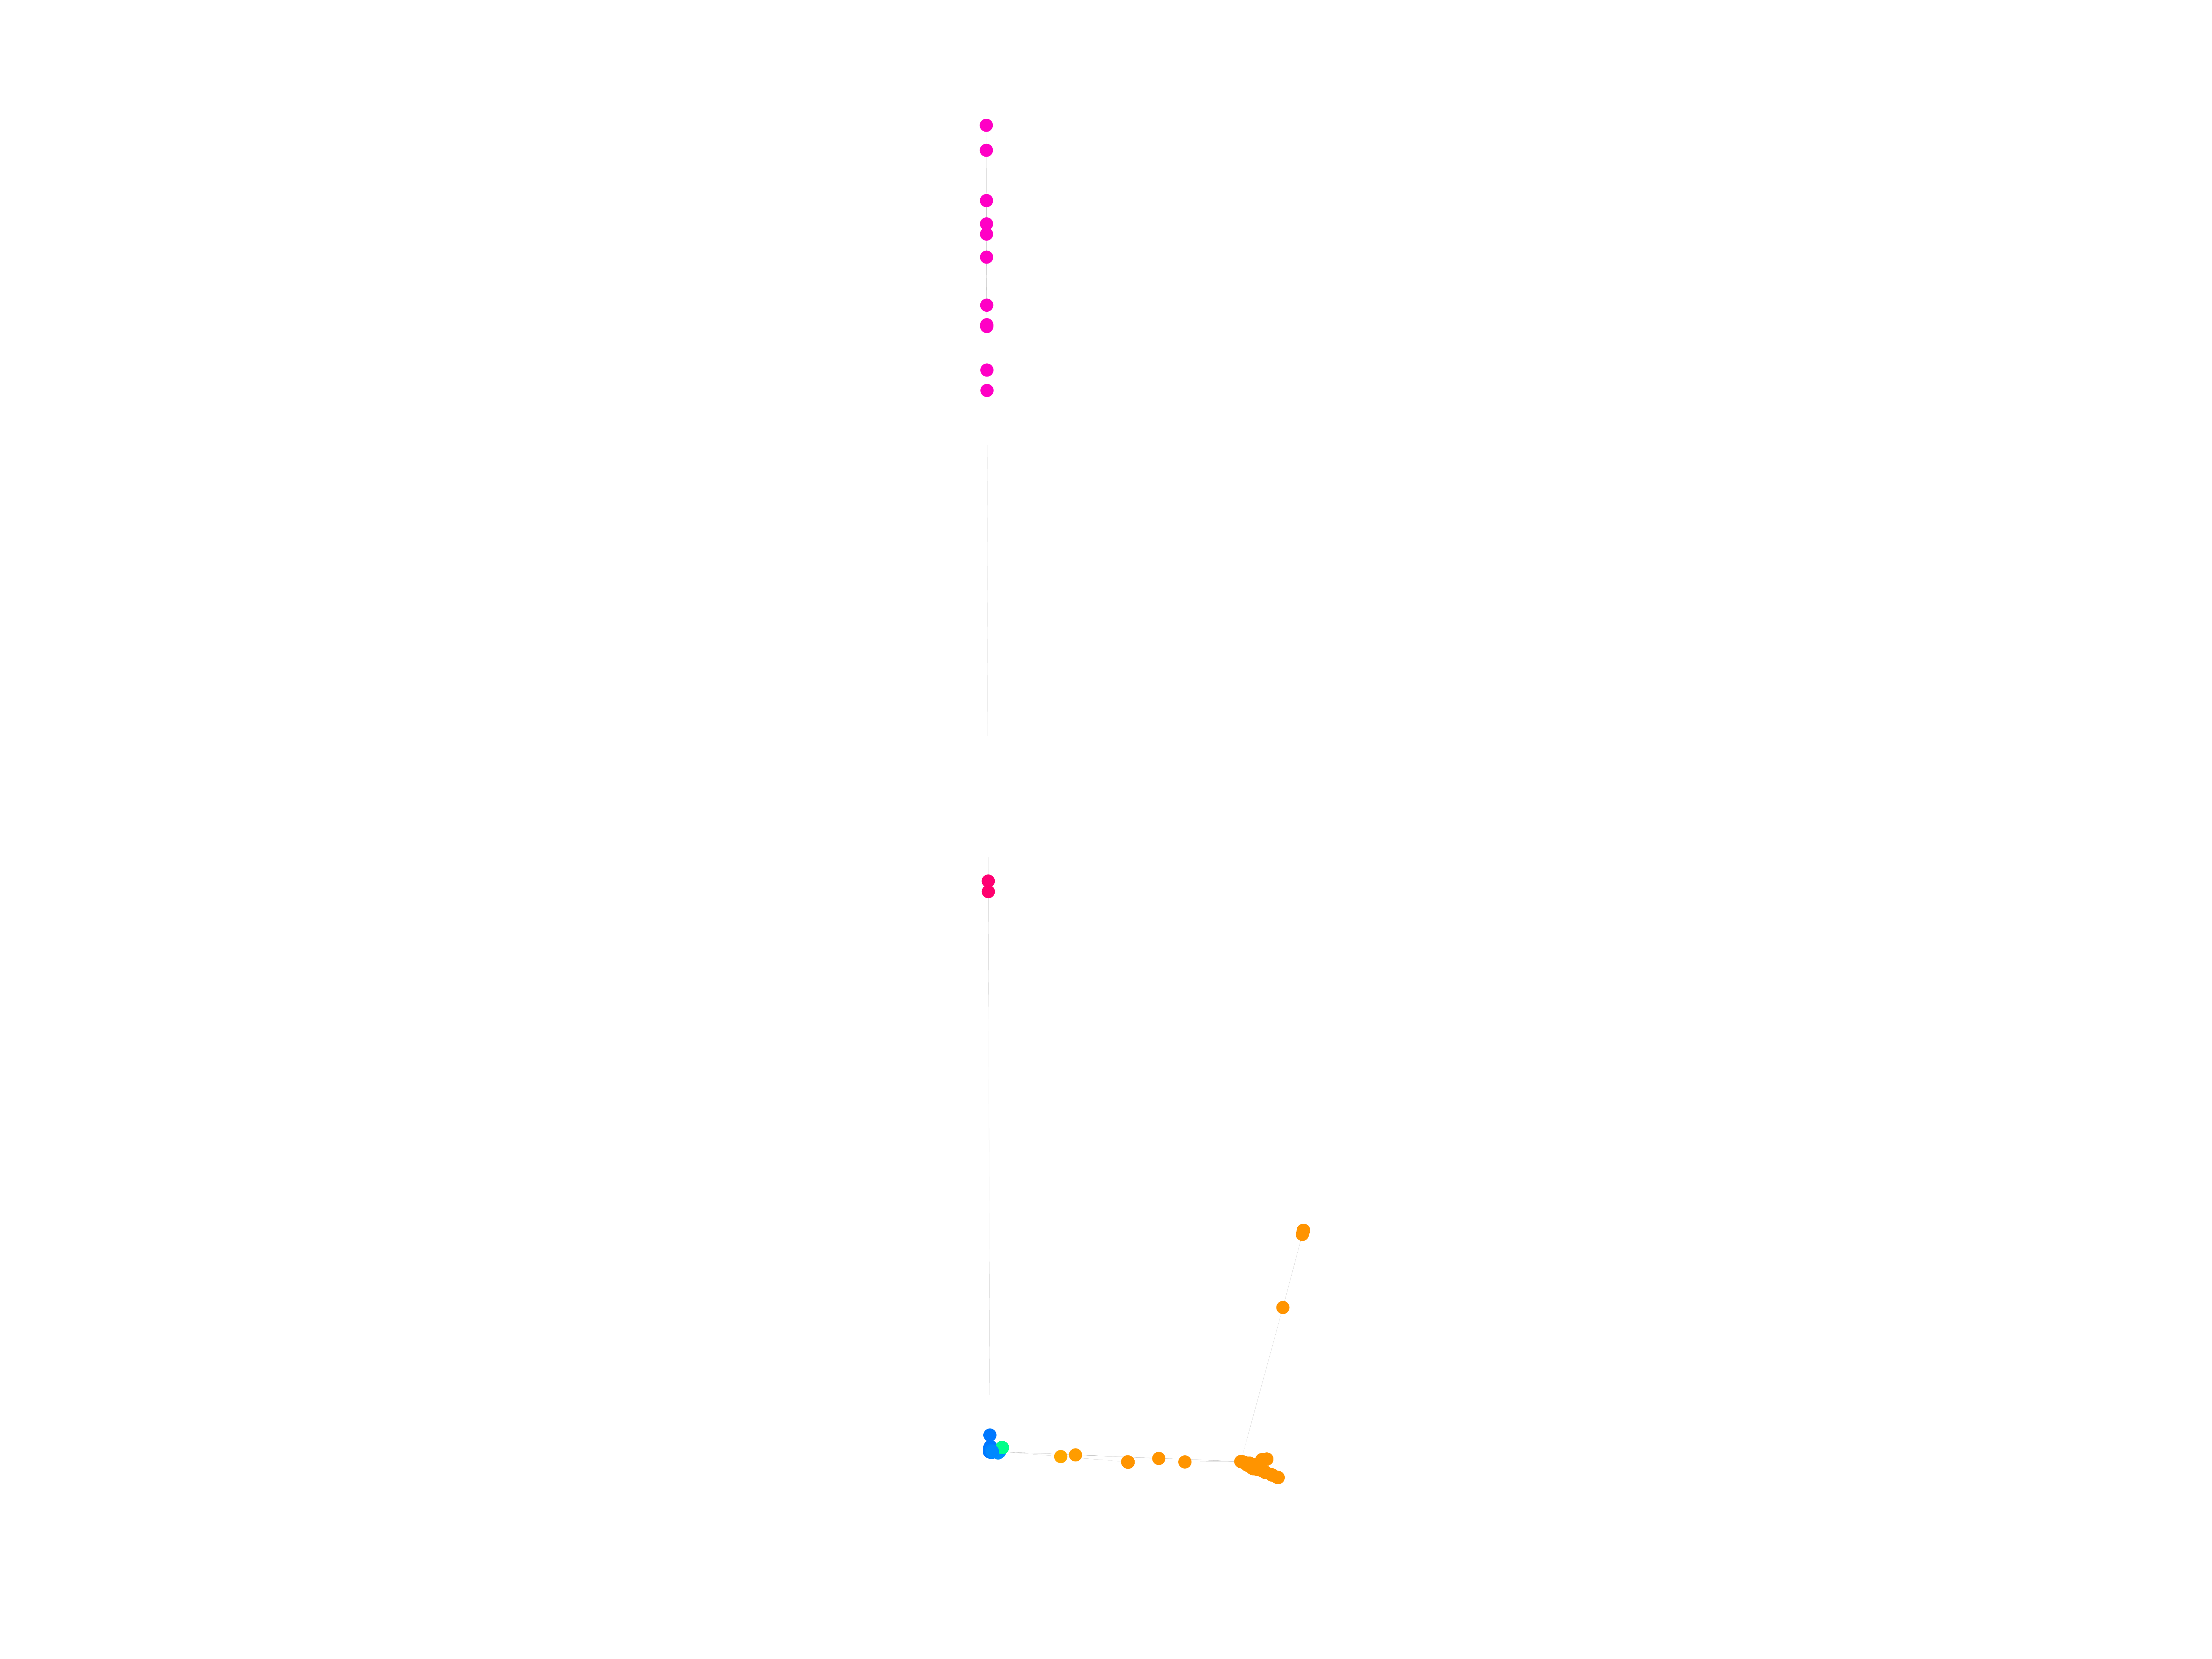
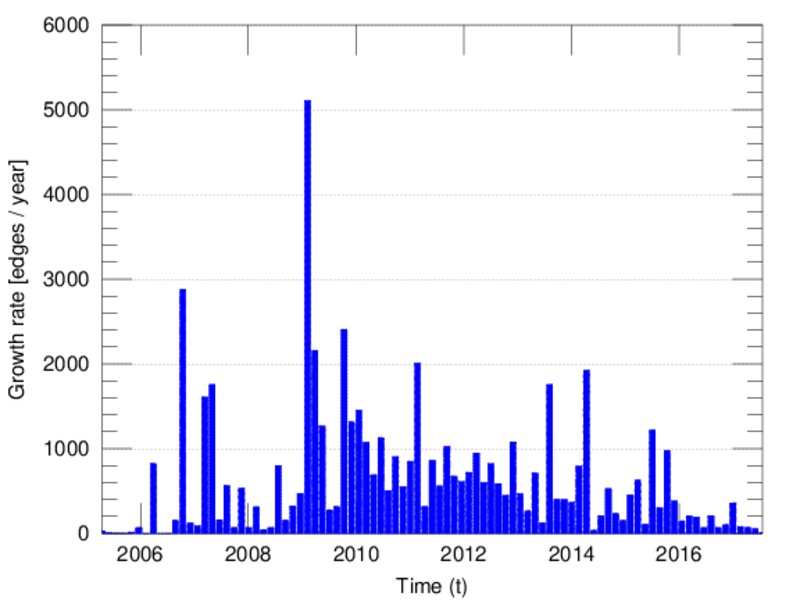
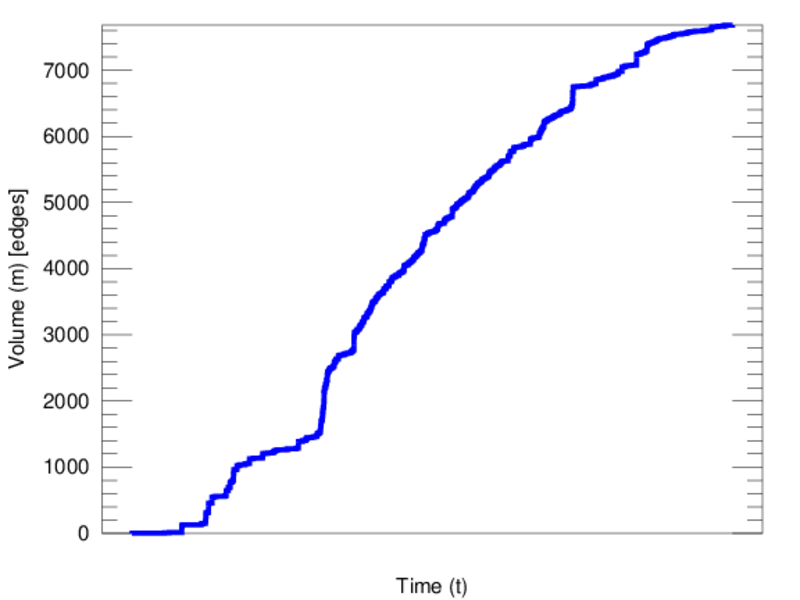
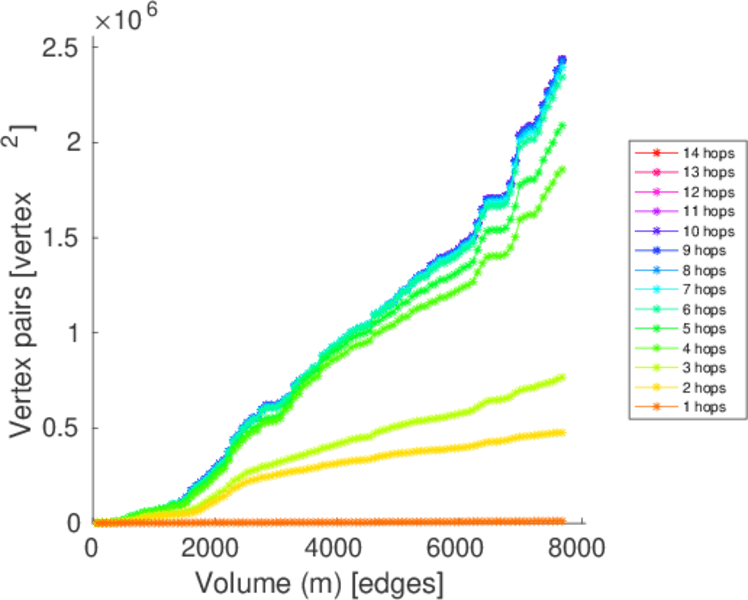
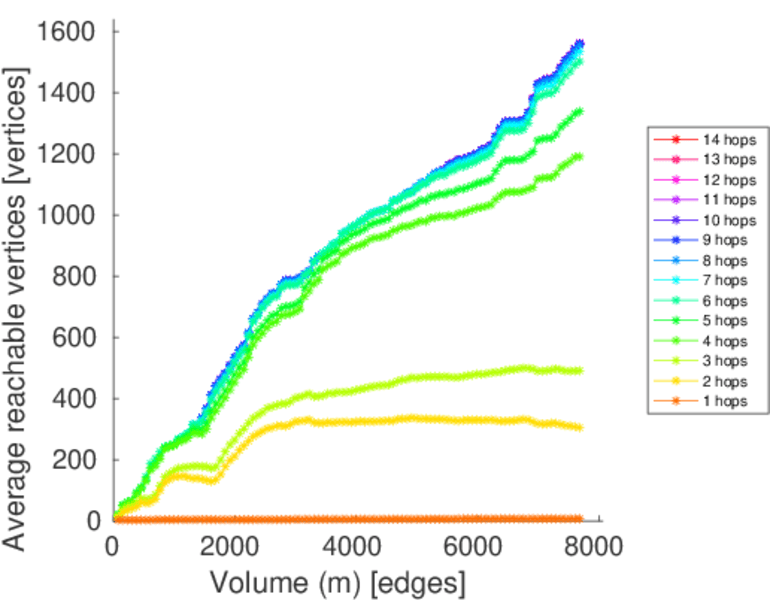
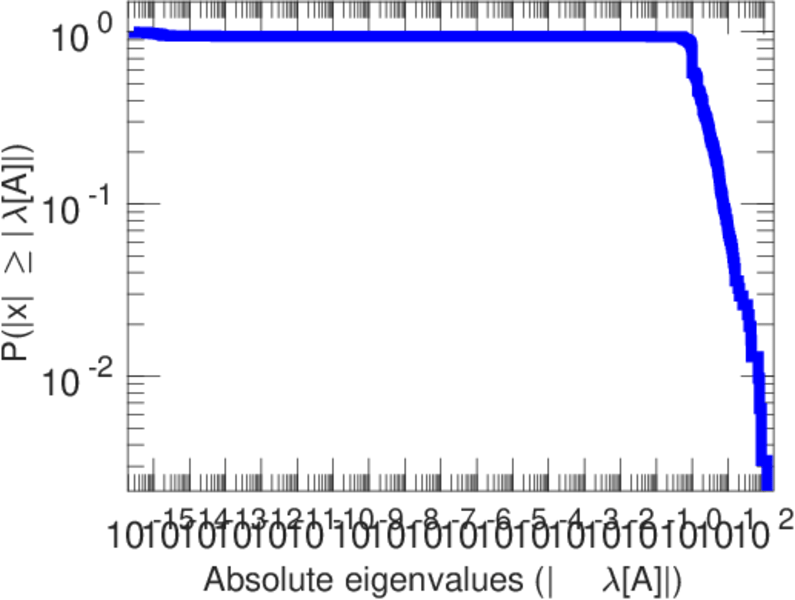
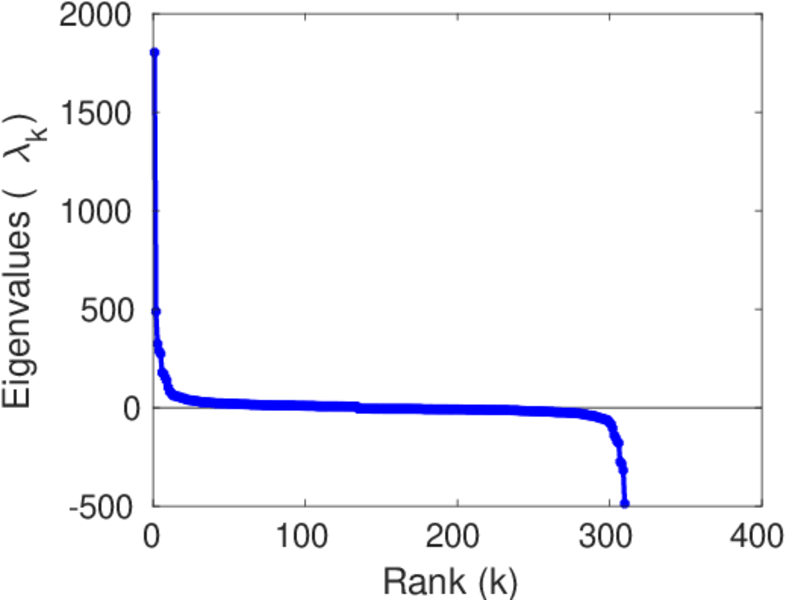
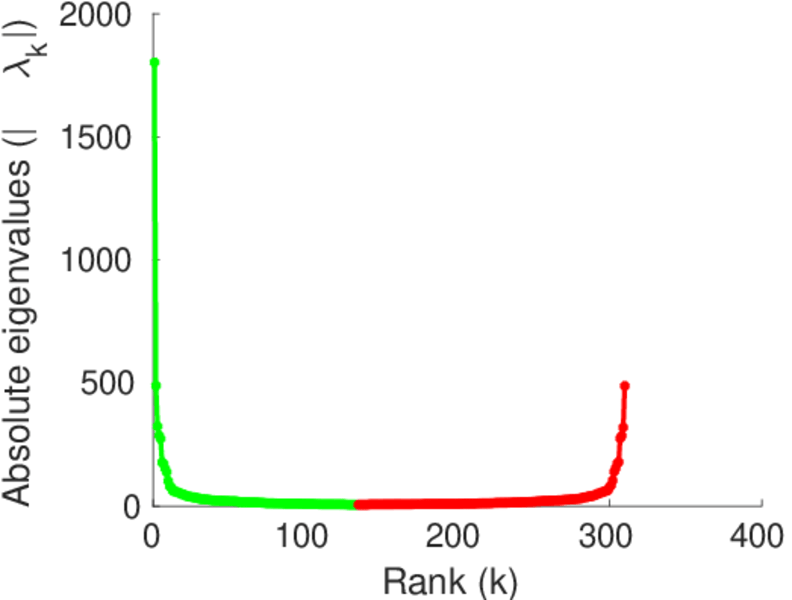
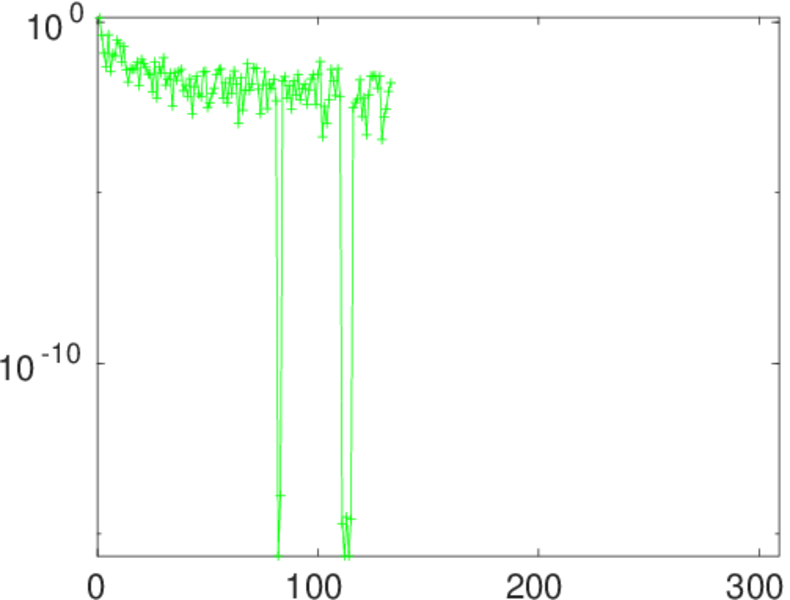
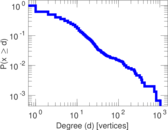
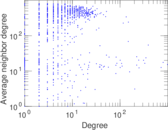
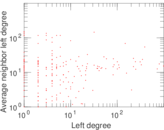
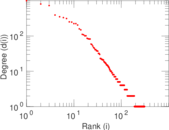
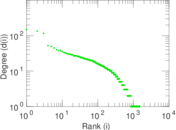
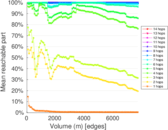
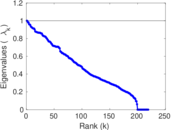
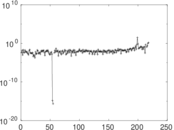
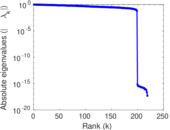
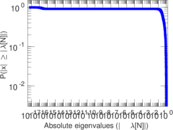
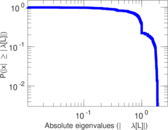
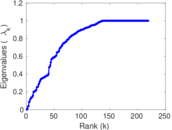
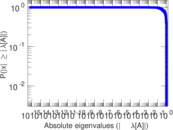
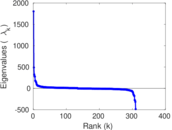
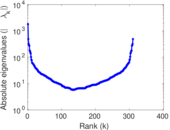
Plots


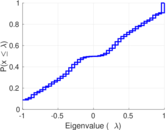


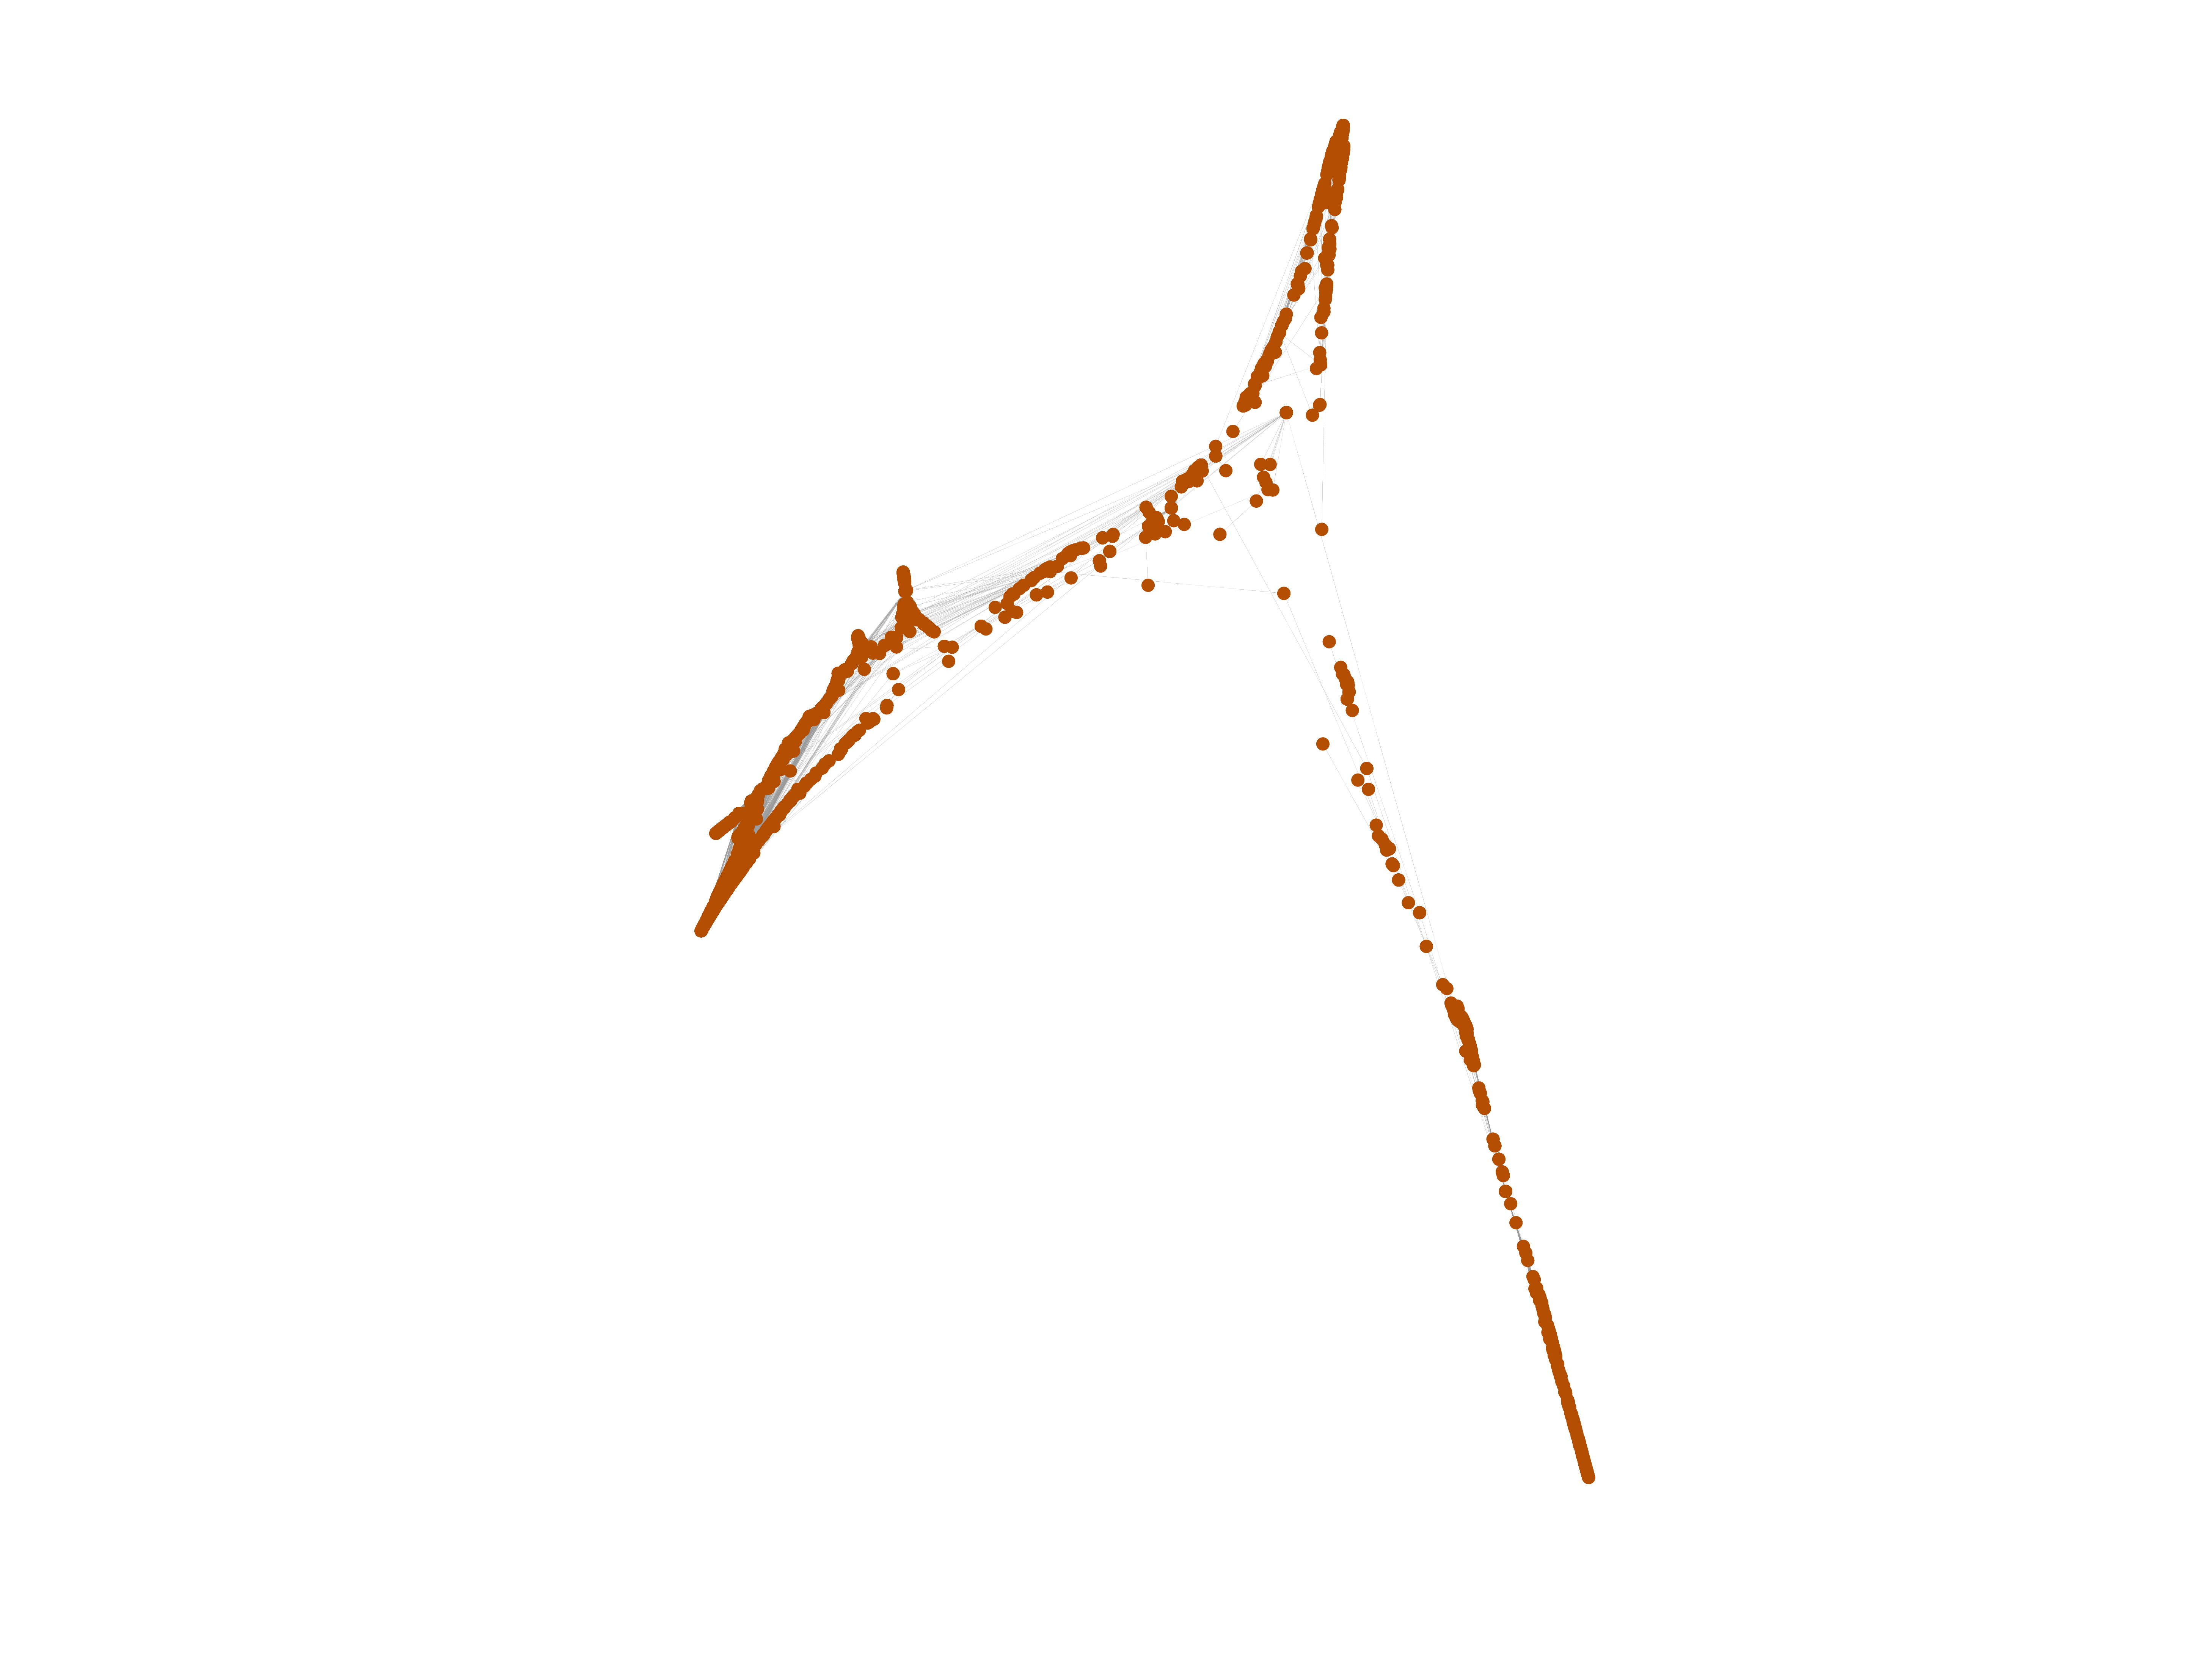
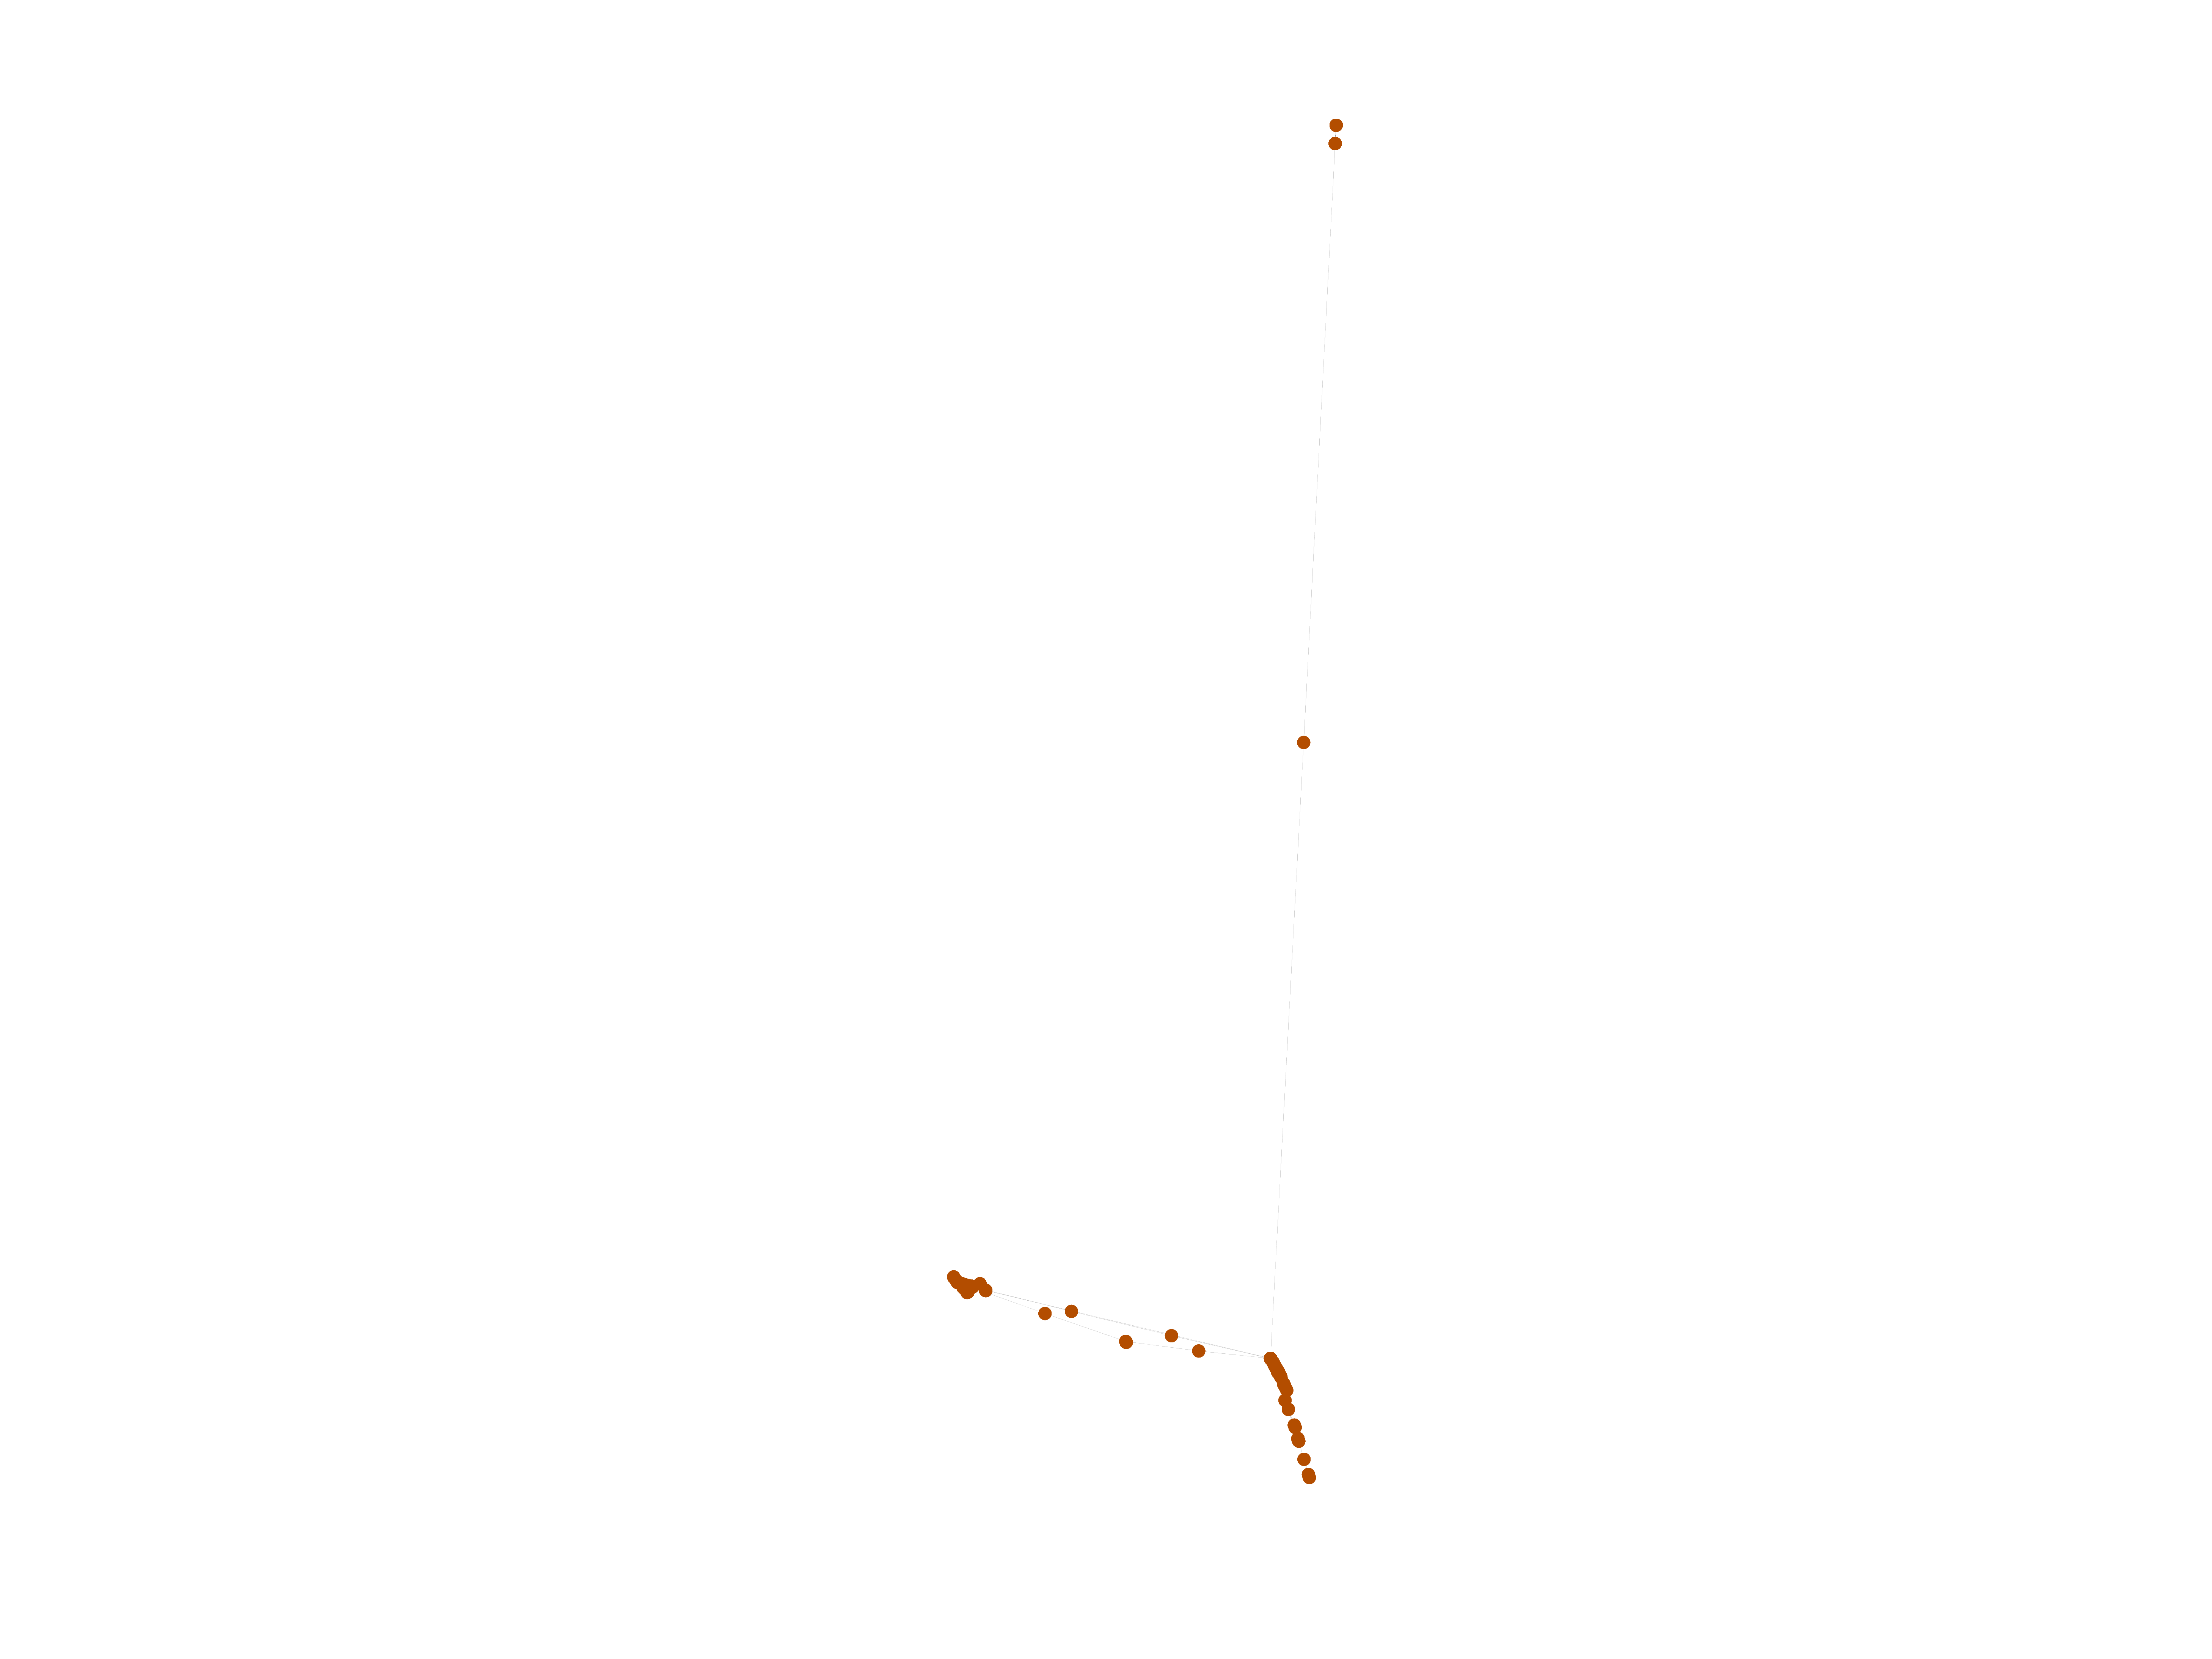
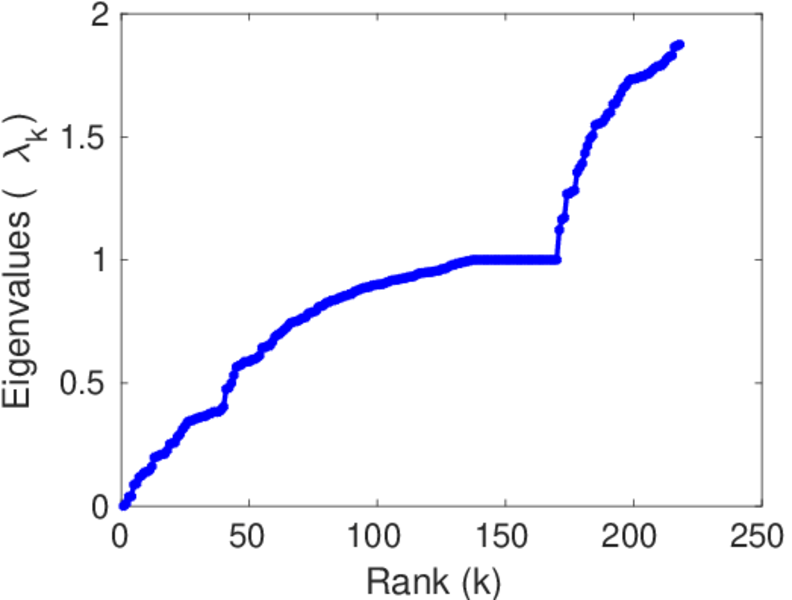
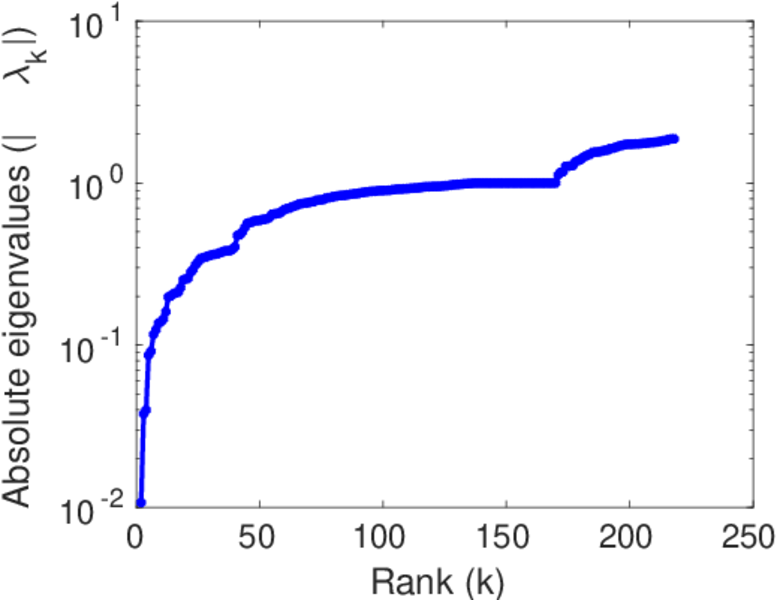
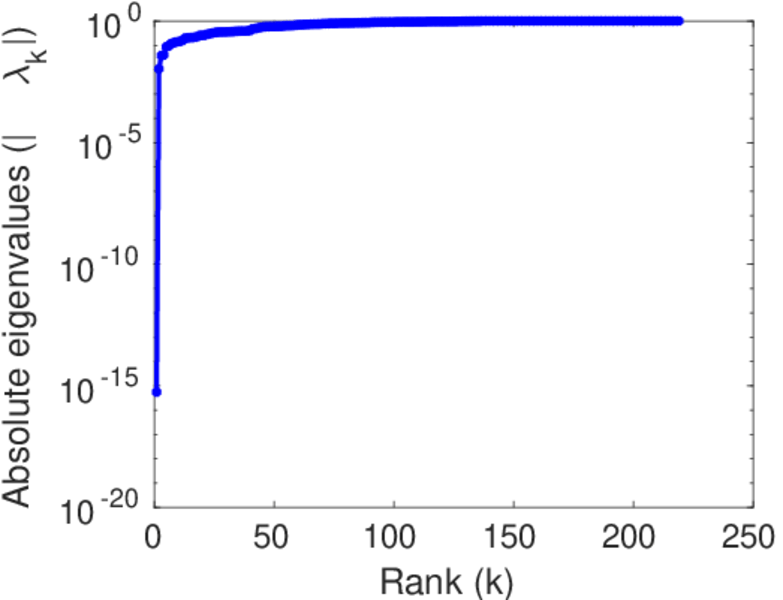
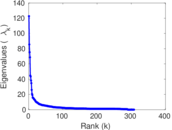
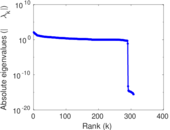
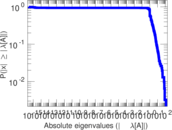
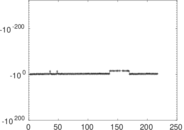
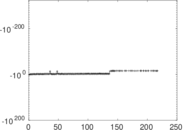
Matrix decompositions plots


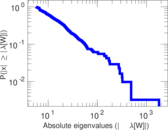
Downloads
References
|
[1]
|
Jérôme Kunegis.
KONECT – The Koblenz Network Collection.
In Proc. Int. Conf. on World Wide Web Companion, pages
1343–1350, 2013.
[ http ]
|
|
[2]
|
Wikimedia Foundation.
Wikimedia downloads.
http://dumps.wikimedia.org/, January 2010.
|
 KONECT ‣ Networks ‣
Buy Me a Coffee
KONECT ‣ Networks ‣
Buy Me a Coffee