Wiktionary edits (et)
This is the bipartite edit network of the Estonian Wiktionary. It contains
users and pages from the Estonian Wiktionary, connected by edit events. Each
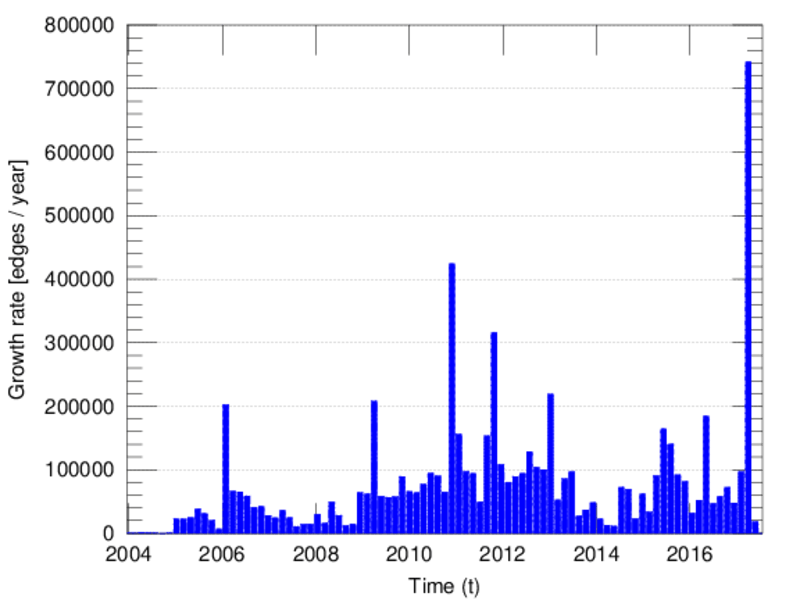
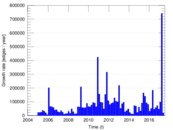
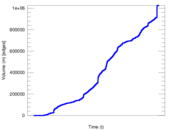
edge represents an edit. The dataset includes the timestamp of each edit.
Metadata
Statistics
| Size | n = | 140,902
|
| Left size | n1 = | 549
|
| Right size | n2 = | 140,353
|
| Volume | m = | 1,026,100
|
| Unique edge count | m̿ = | 564,576
|
| Wedge count | s = | 13,265,484,662
|
| Claw count | z = | 320,981,486,973,617
|
| Cross count | x = | 7,145,534,905,181,017,088
|
| Square count | q = | 11,228,460,239
|
| 4-Tour count | T4 = | 142,890,850,904
|
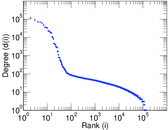
| Maximum degree | dmax = | 284,729
|
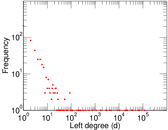
| Maximum left degree | d1max = | 284,729
|
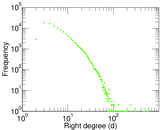
| Maximum right degree | d2max = | 584
|
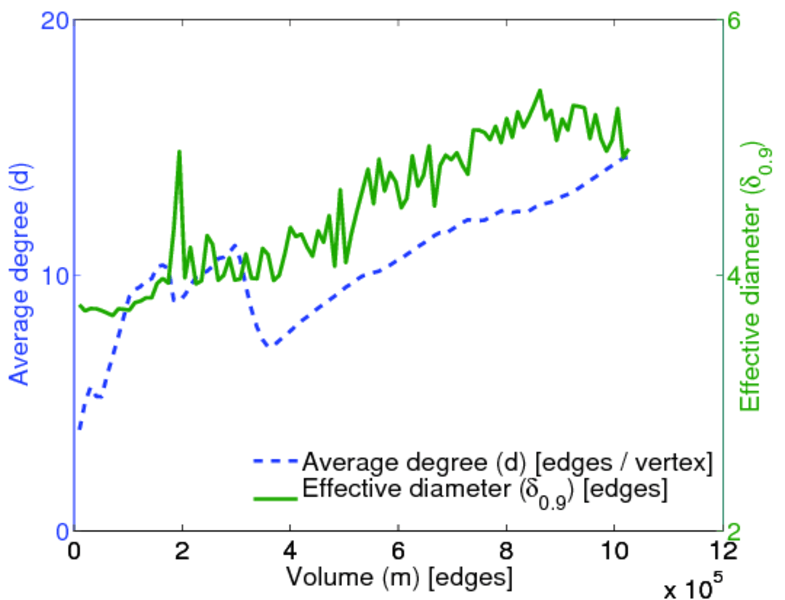
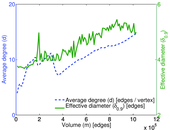
| Average degree | d = | 14.564 7
|
| Average left degree | d1 = | 1,869.03
|
| Average right degree | d2 = | 7.310 85
|
| Fill | p = | 0.007 327 04
|
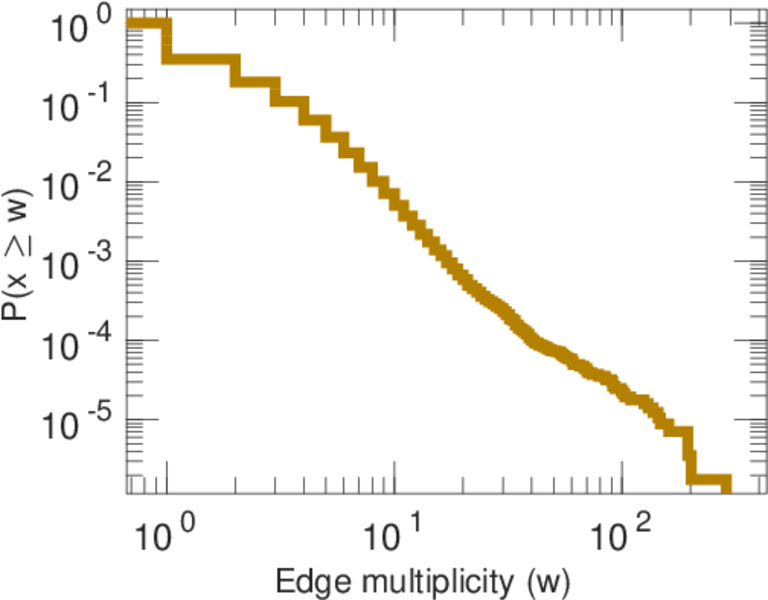
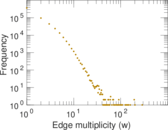
| Average edge multiplicity | m̃ = | 1.817 47
|
| Size of LCC | N = | 140,125
|
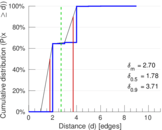
| Diameter | δ = | 12
|
| 50-Percentile effective diameter | δ0.5 = | 1.775 76
|
| 90-Percentile effective diameter | δ0.9 = | 3.714 92
|
| Median distance | δM = | 2
|
| Mean distance | δm = | 2.703 35
|
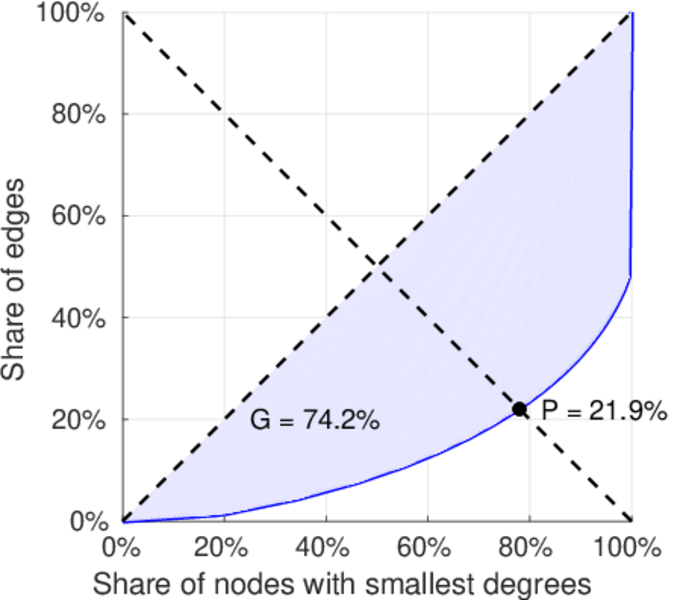
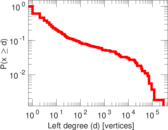
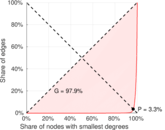
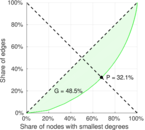
| Gini coefficient | G = | 0.742 153
|
| Balanced inequality ratio | P = | 0.218 633
|
| Left balanced inequality ratio | P1 = | 0.033 454 8
|
| Right balanced inequality ratio | P2 = | 0.321 137
|
| Relative edge distribution entropy | Her = | 0.671 057
|
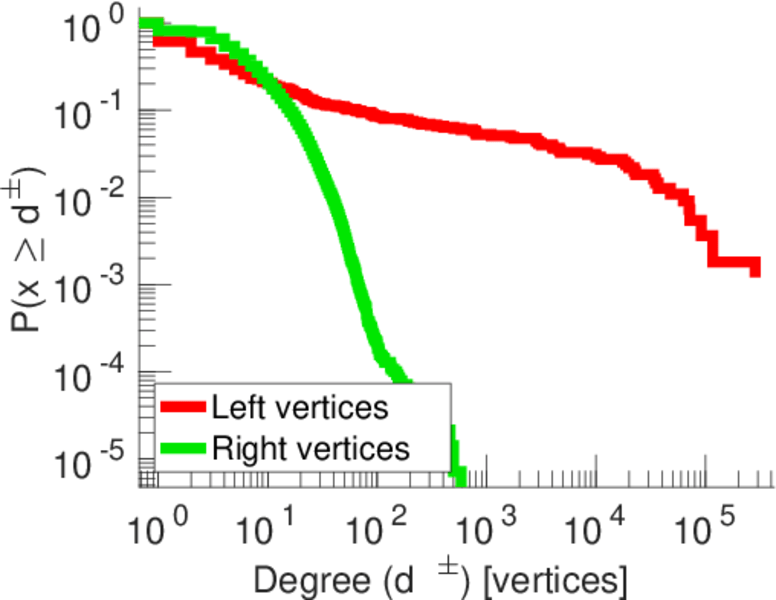
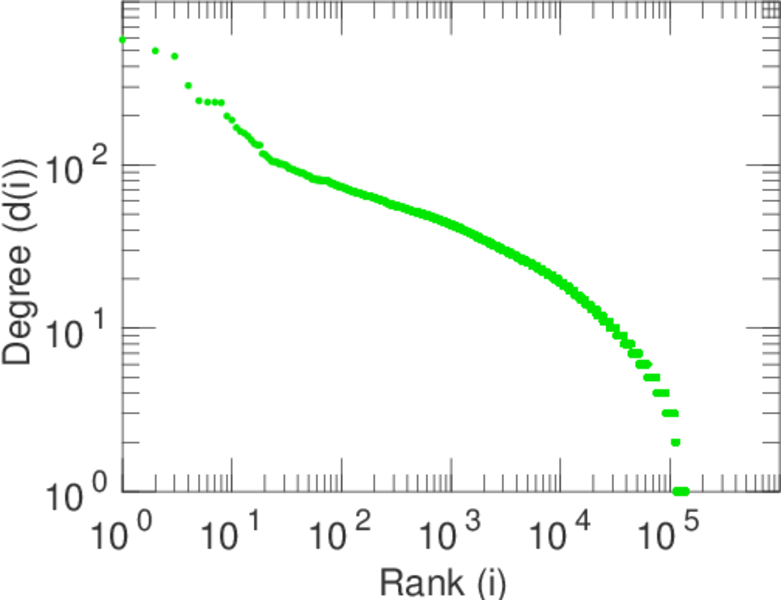
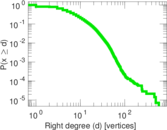
| Power law exponent | γ = | 1.859 36
|
| Tail power law exponent | γt = | 5.021 00
|
| Tail power law exponent with p | γ3 = | 5.021 00
|
| p-value | p = | 0.000 00
|
| Left tail power law exponent with p | γ3,1 = | 1.541 00
|
| Left p-value | p1 = | 0.000 00
|
| Right tail power law exponent with p | γ3,2 = | 8.991 00
|
| Right p-value | p2 = | 0.000 00
|
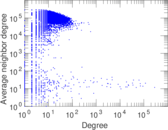
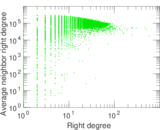
| Degree assortativity | ρ = | −0.215 724
|
| Degree assortativity p-value | pρ = | 0.000 00
|
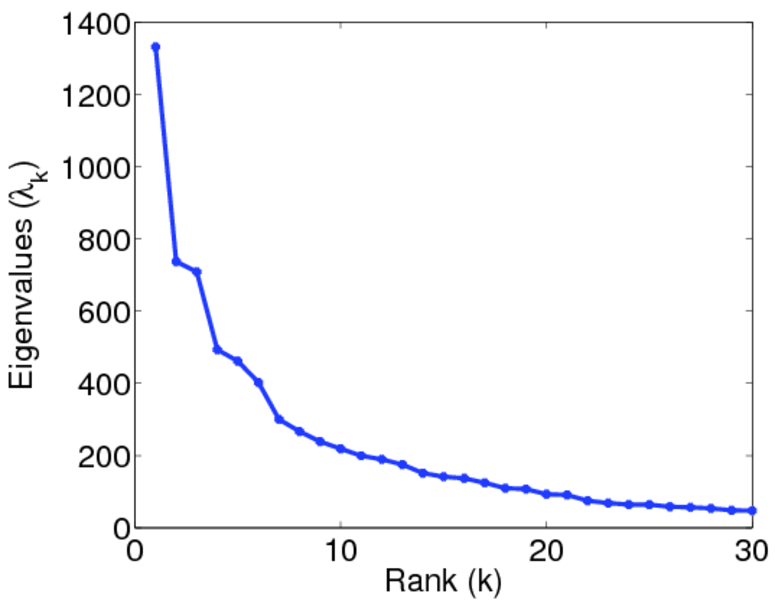
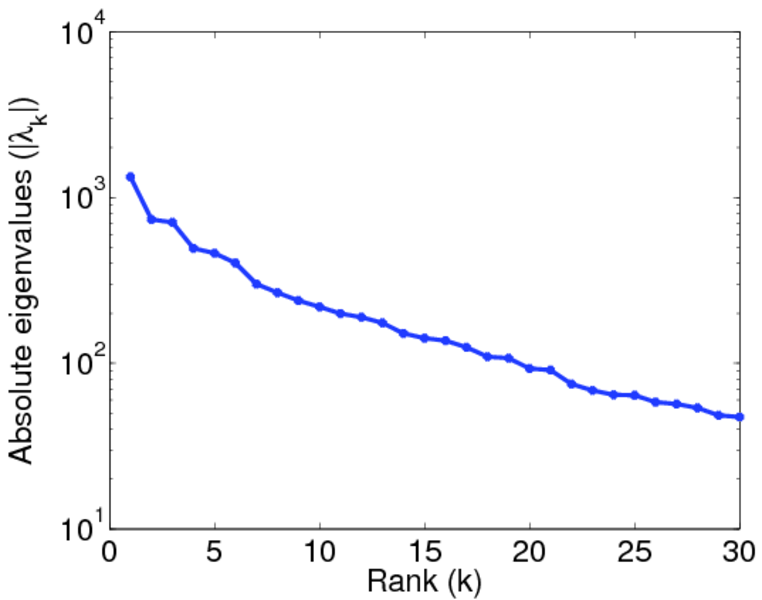
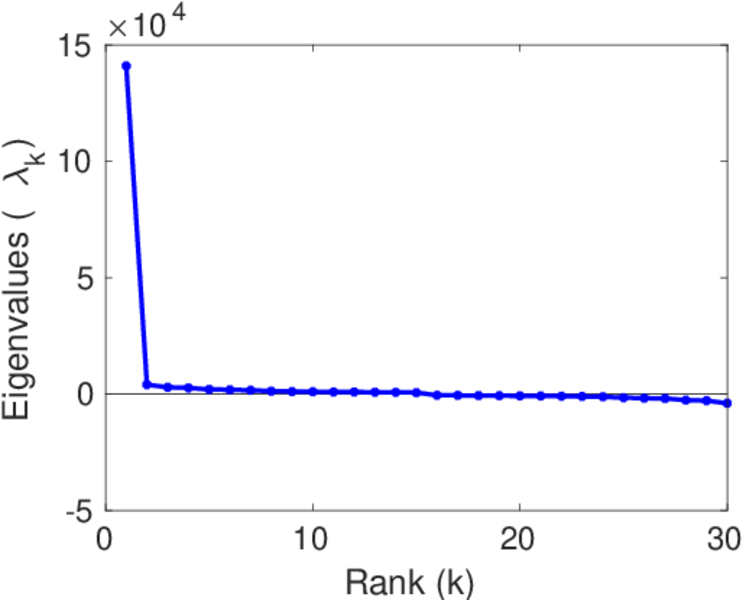
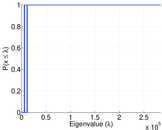
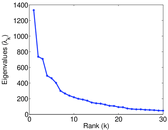
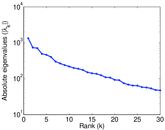
| Spectral norm | α = | 1,331.76
|
| Algebraic connectivity | a = | 0.045 707 5
|
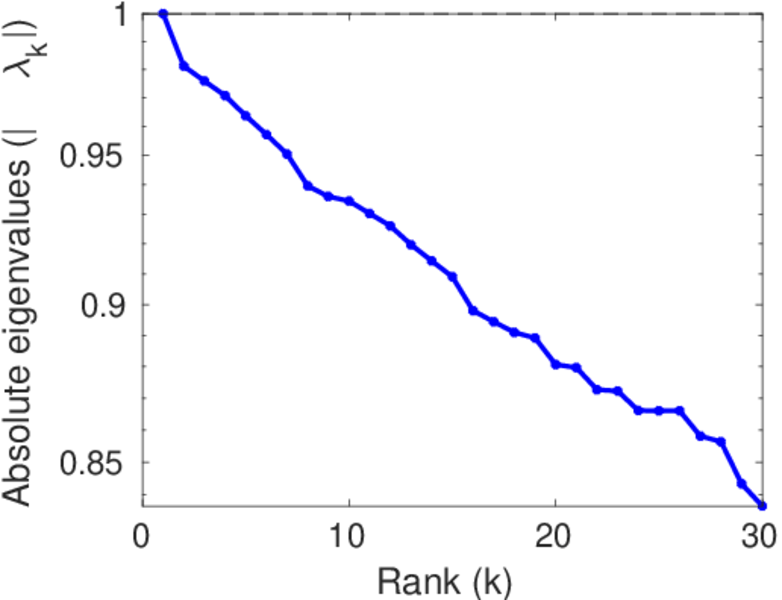
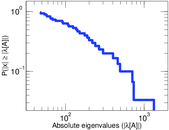
| Spectral separation | |λ1[A] / λ2[A]| = | 1.806 73
|
| Controllability | C = | 139,319
|
| Relative controllability | Cr = | 0.992 308
|
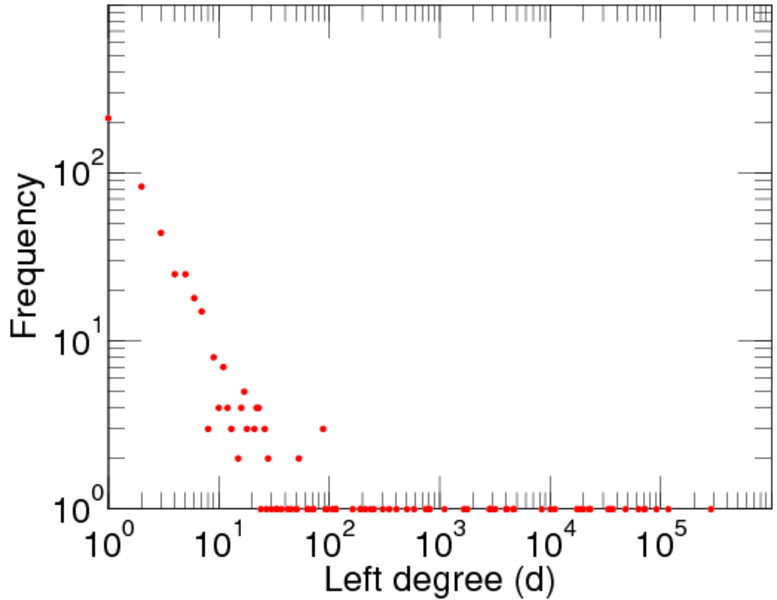
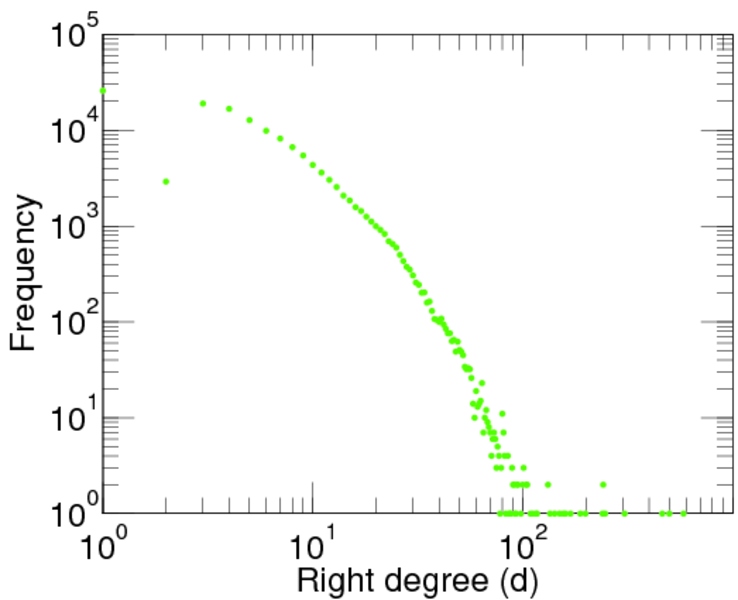
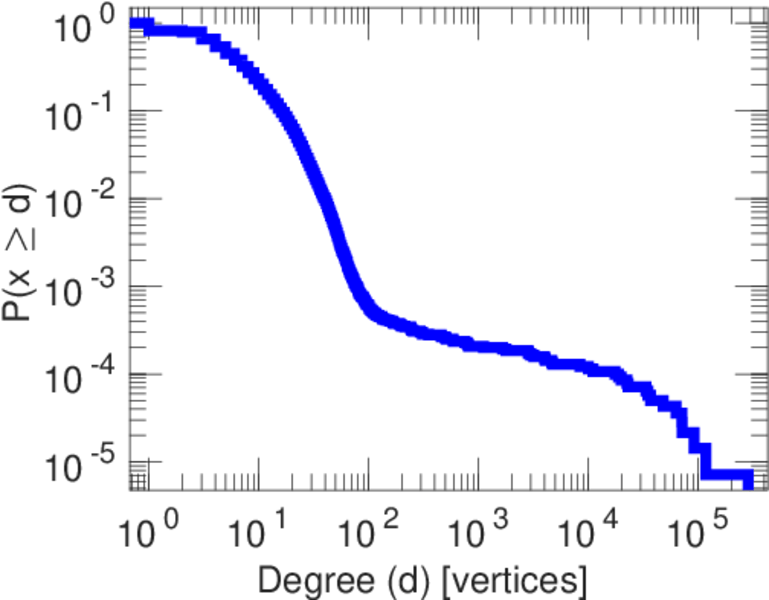
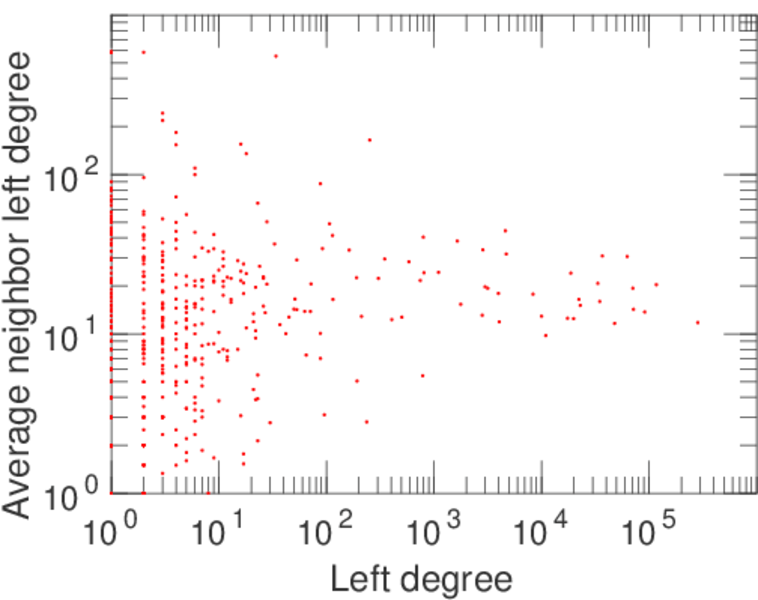
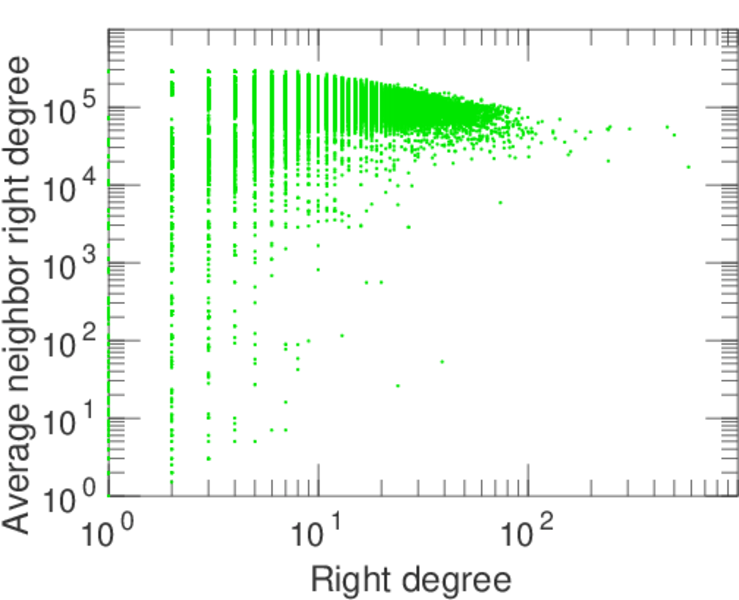
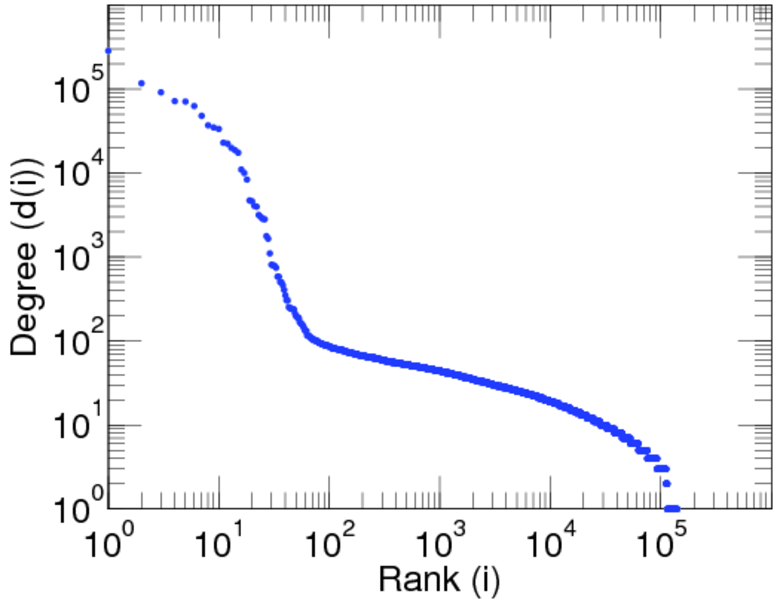
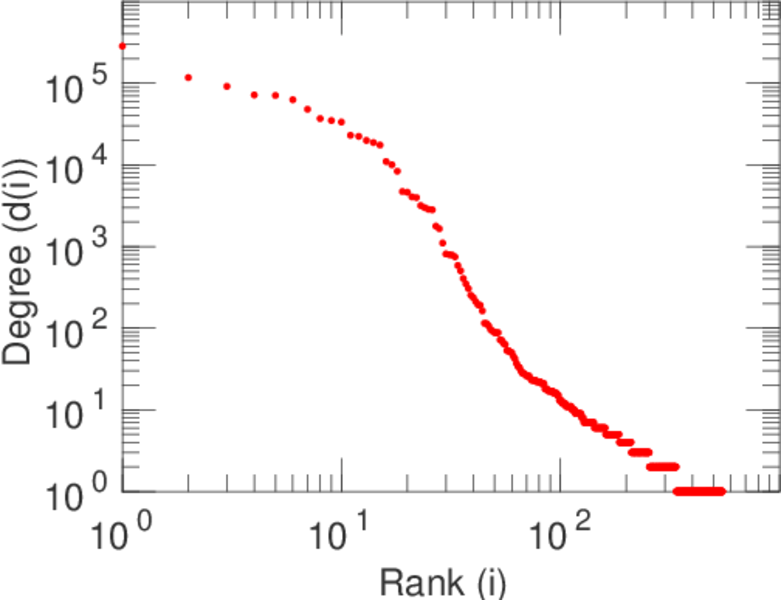
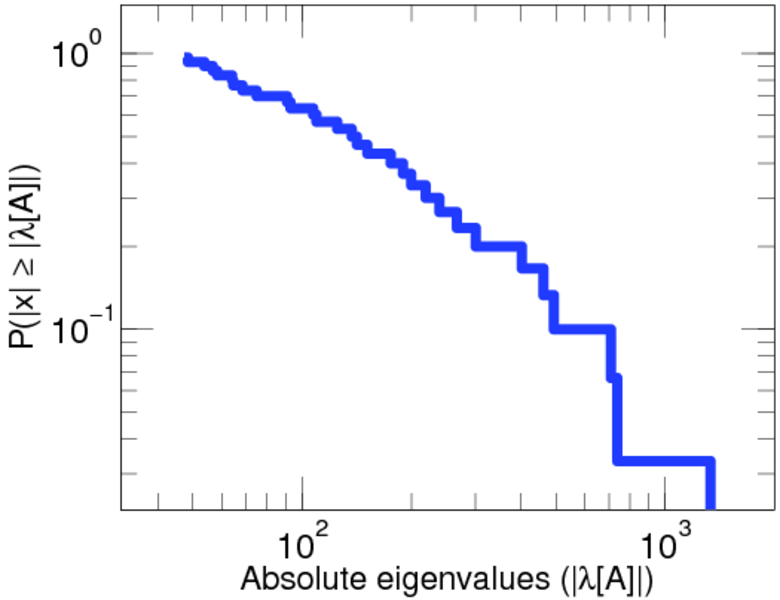
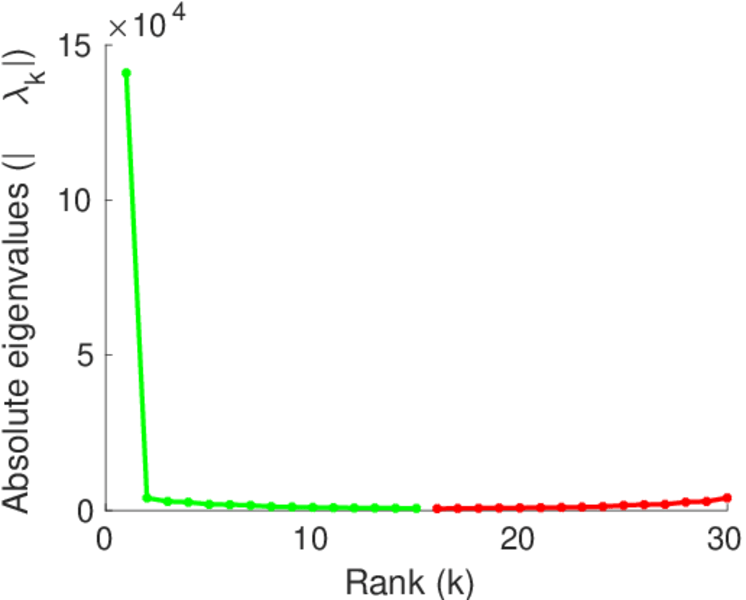
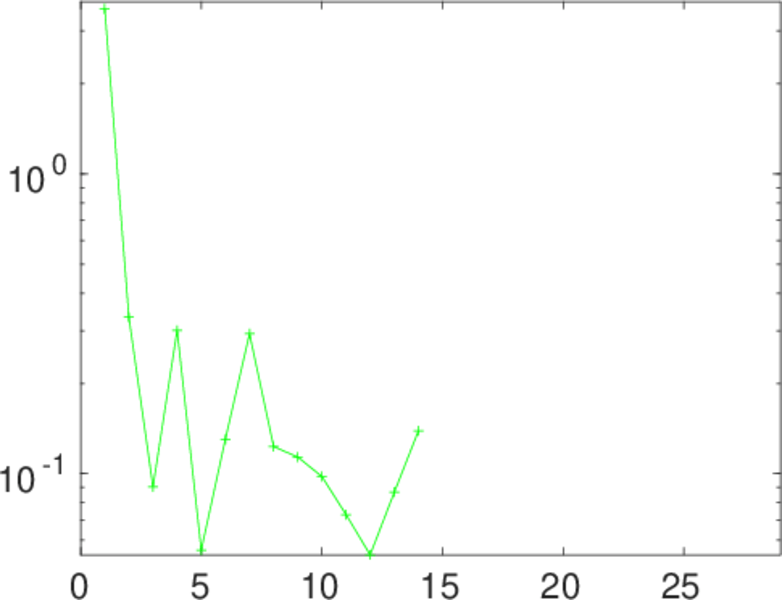
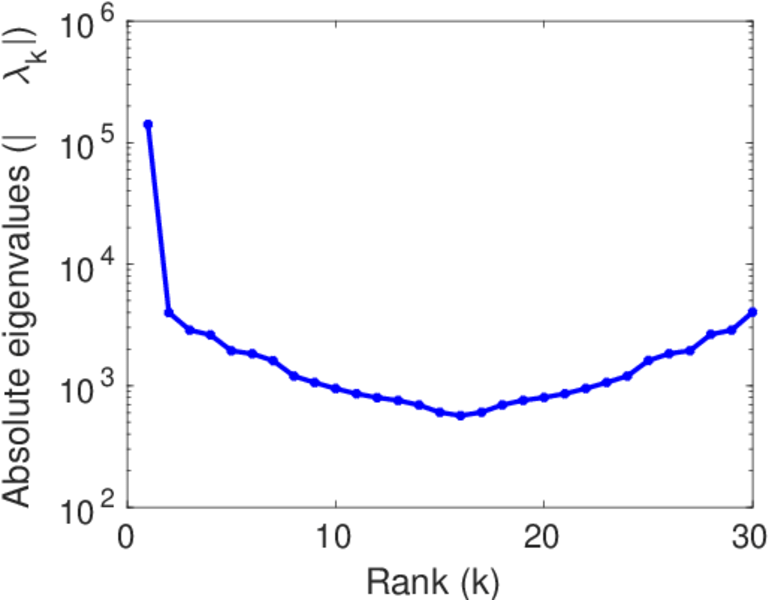
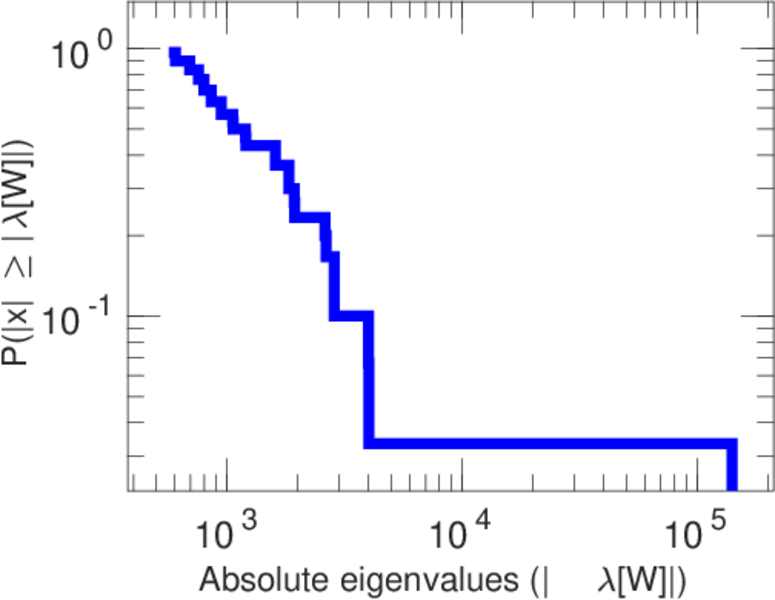
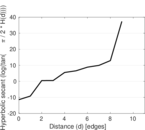
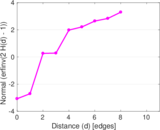
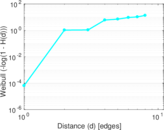
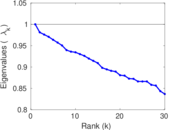
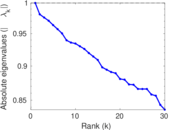
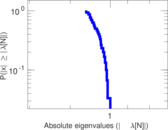
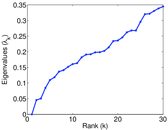
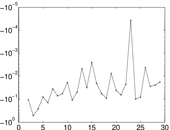
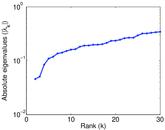
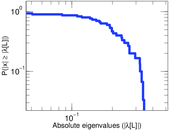
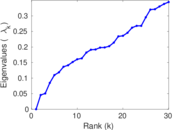
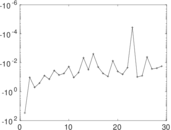
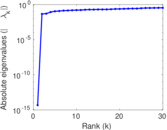
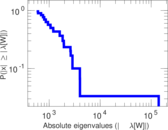
Plots


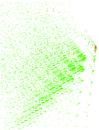
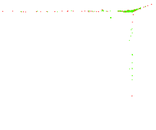


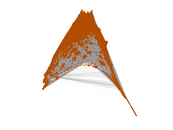


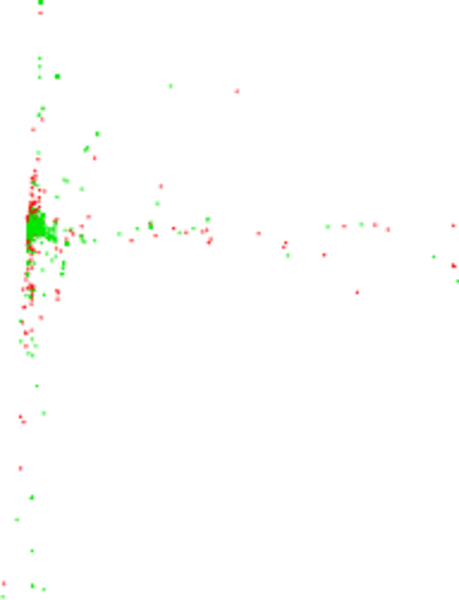
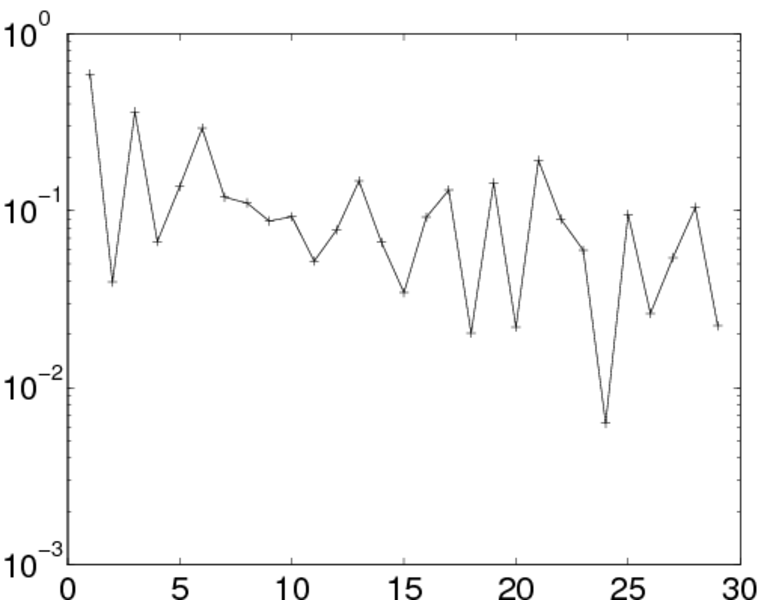
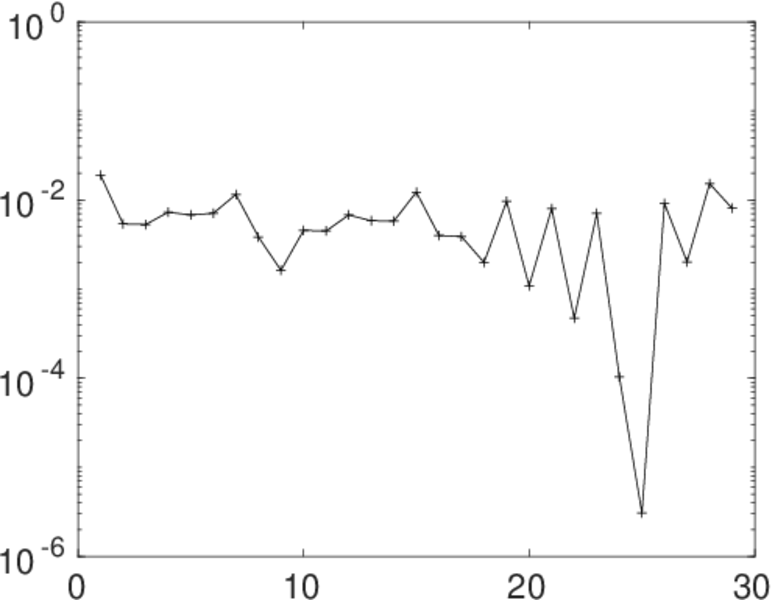
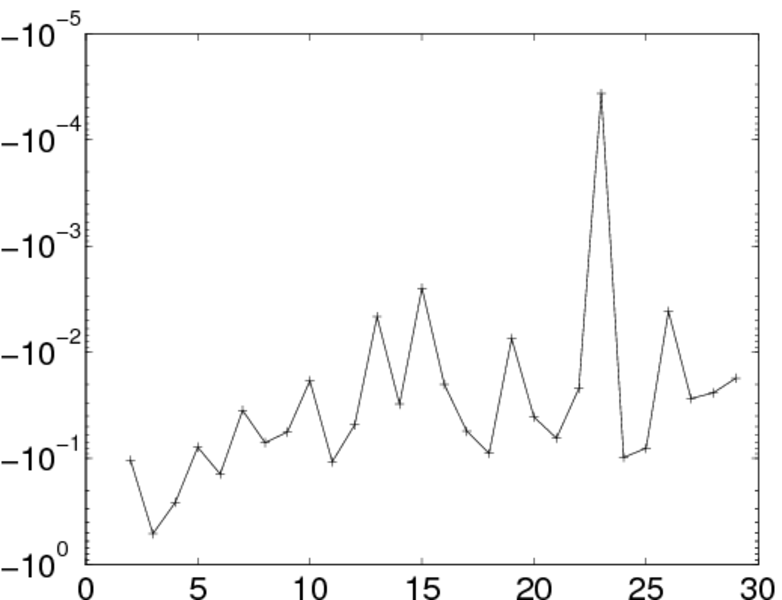
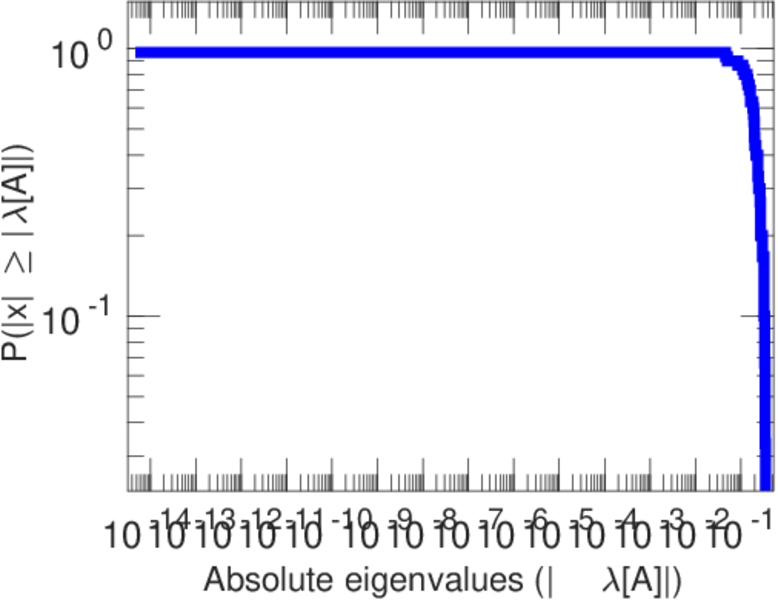
Matrix decompositions plots


Downloads
References
|
[1]
|
Jérôme Kunegis.
KONECT – The Koblenz Network Collection.
In Proc. Int. Conf. on World Wide Web Companion, pages
1343–1350, 2013.
[ http ]
|
|
[2]
|
Wikimedia Foundation.
Wikimedia downloads.
http://dumps.wikimedia.org/, January 2010.
|
 KONECT ‣ Networks ‣
Buy Me a Coffee
KONECT ‣ Networks ‣
Buy Me a Coffee