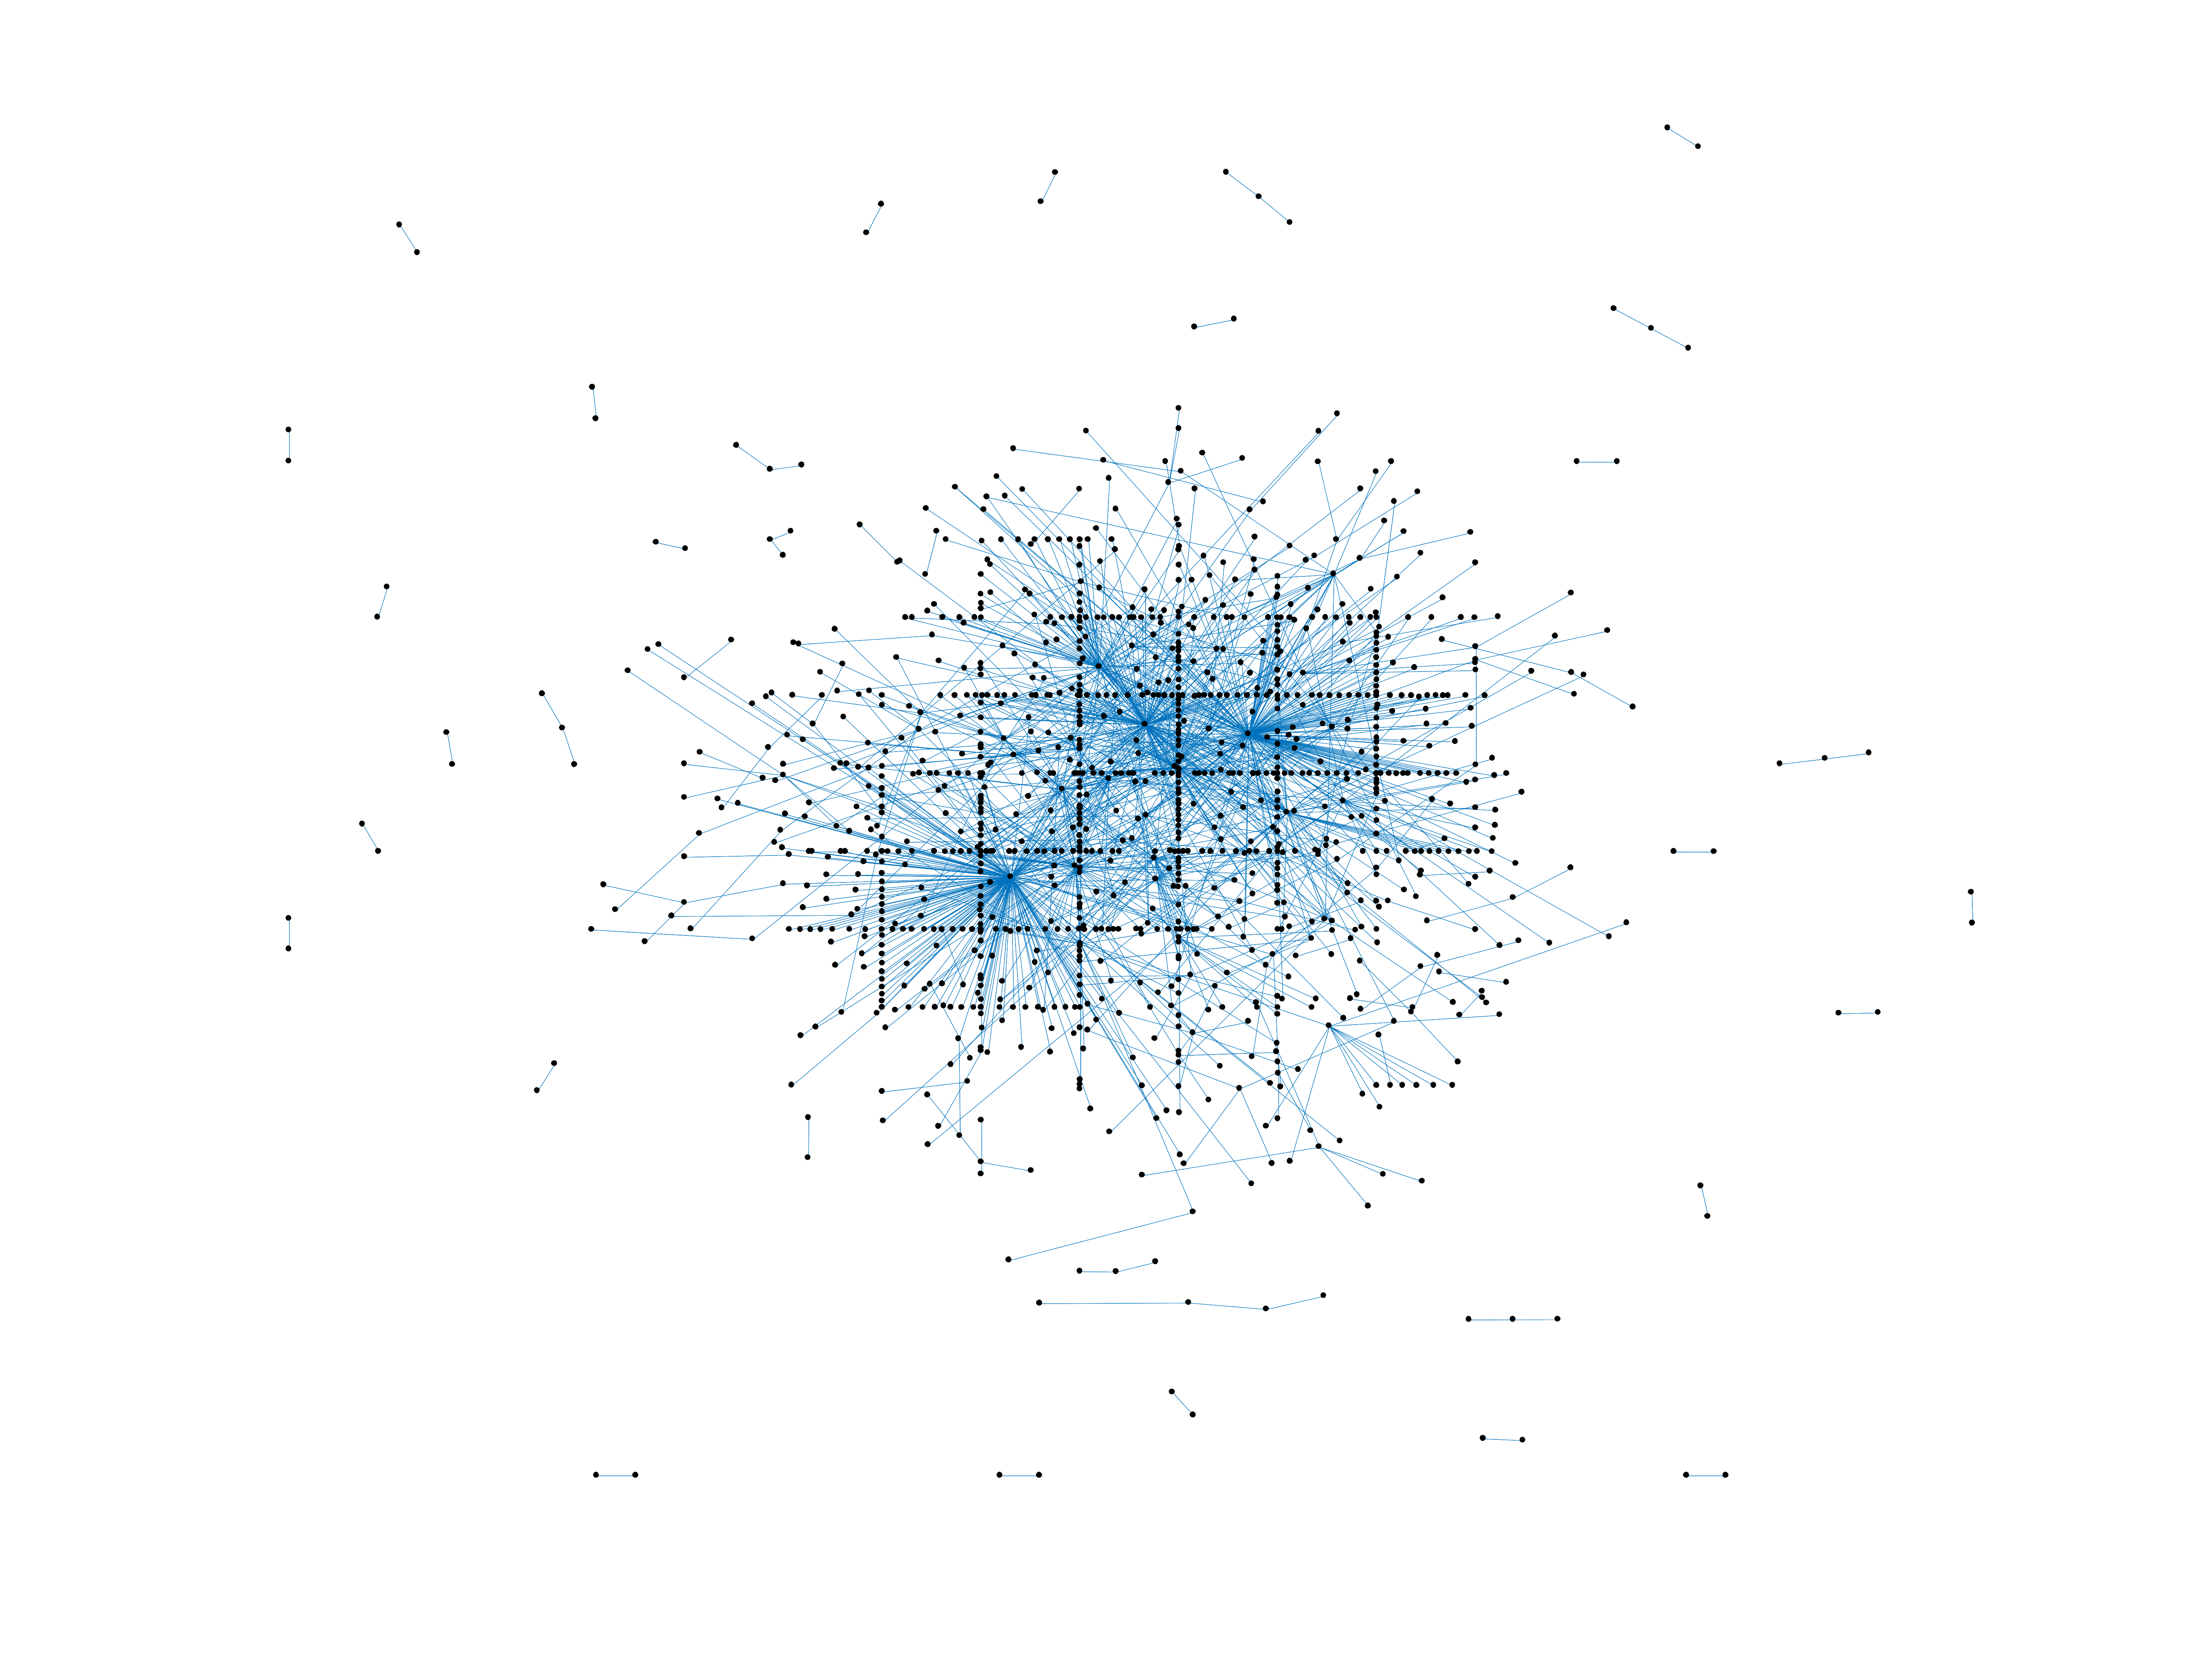
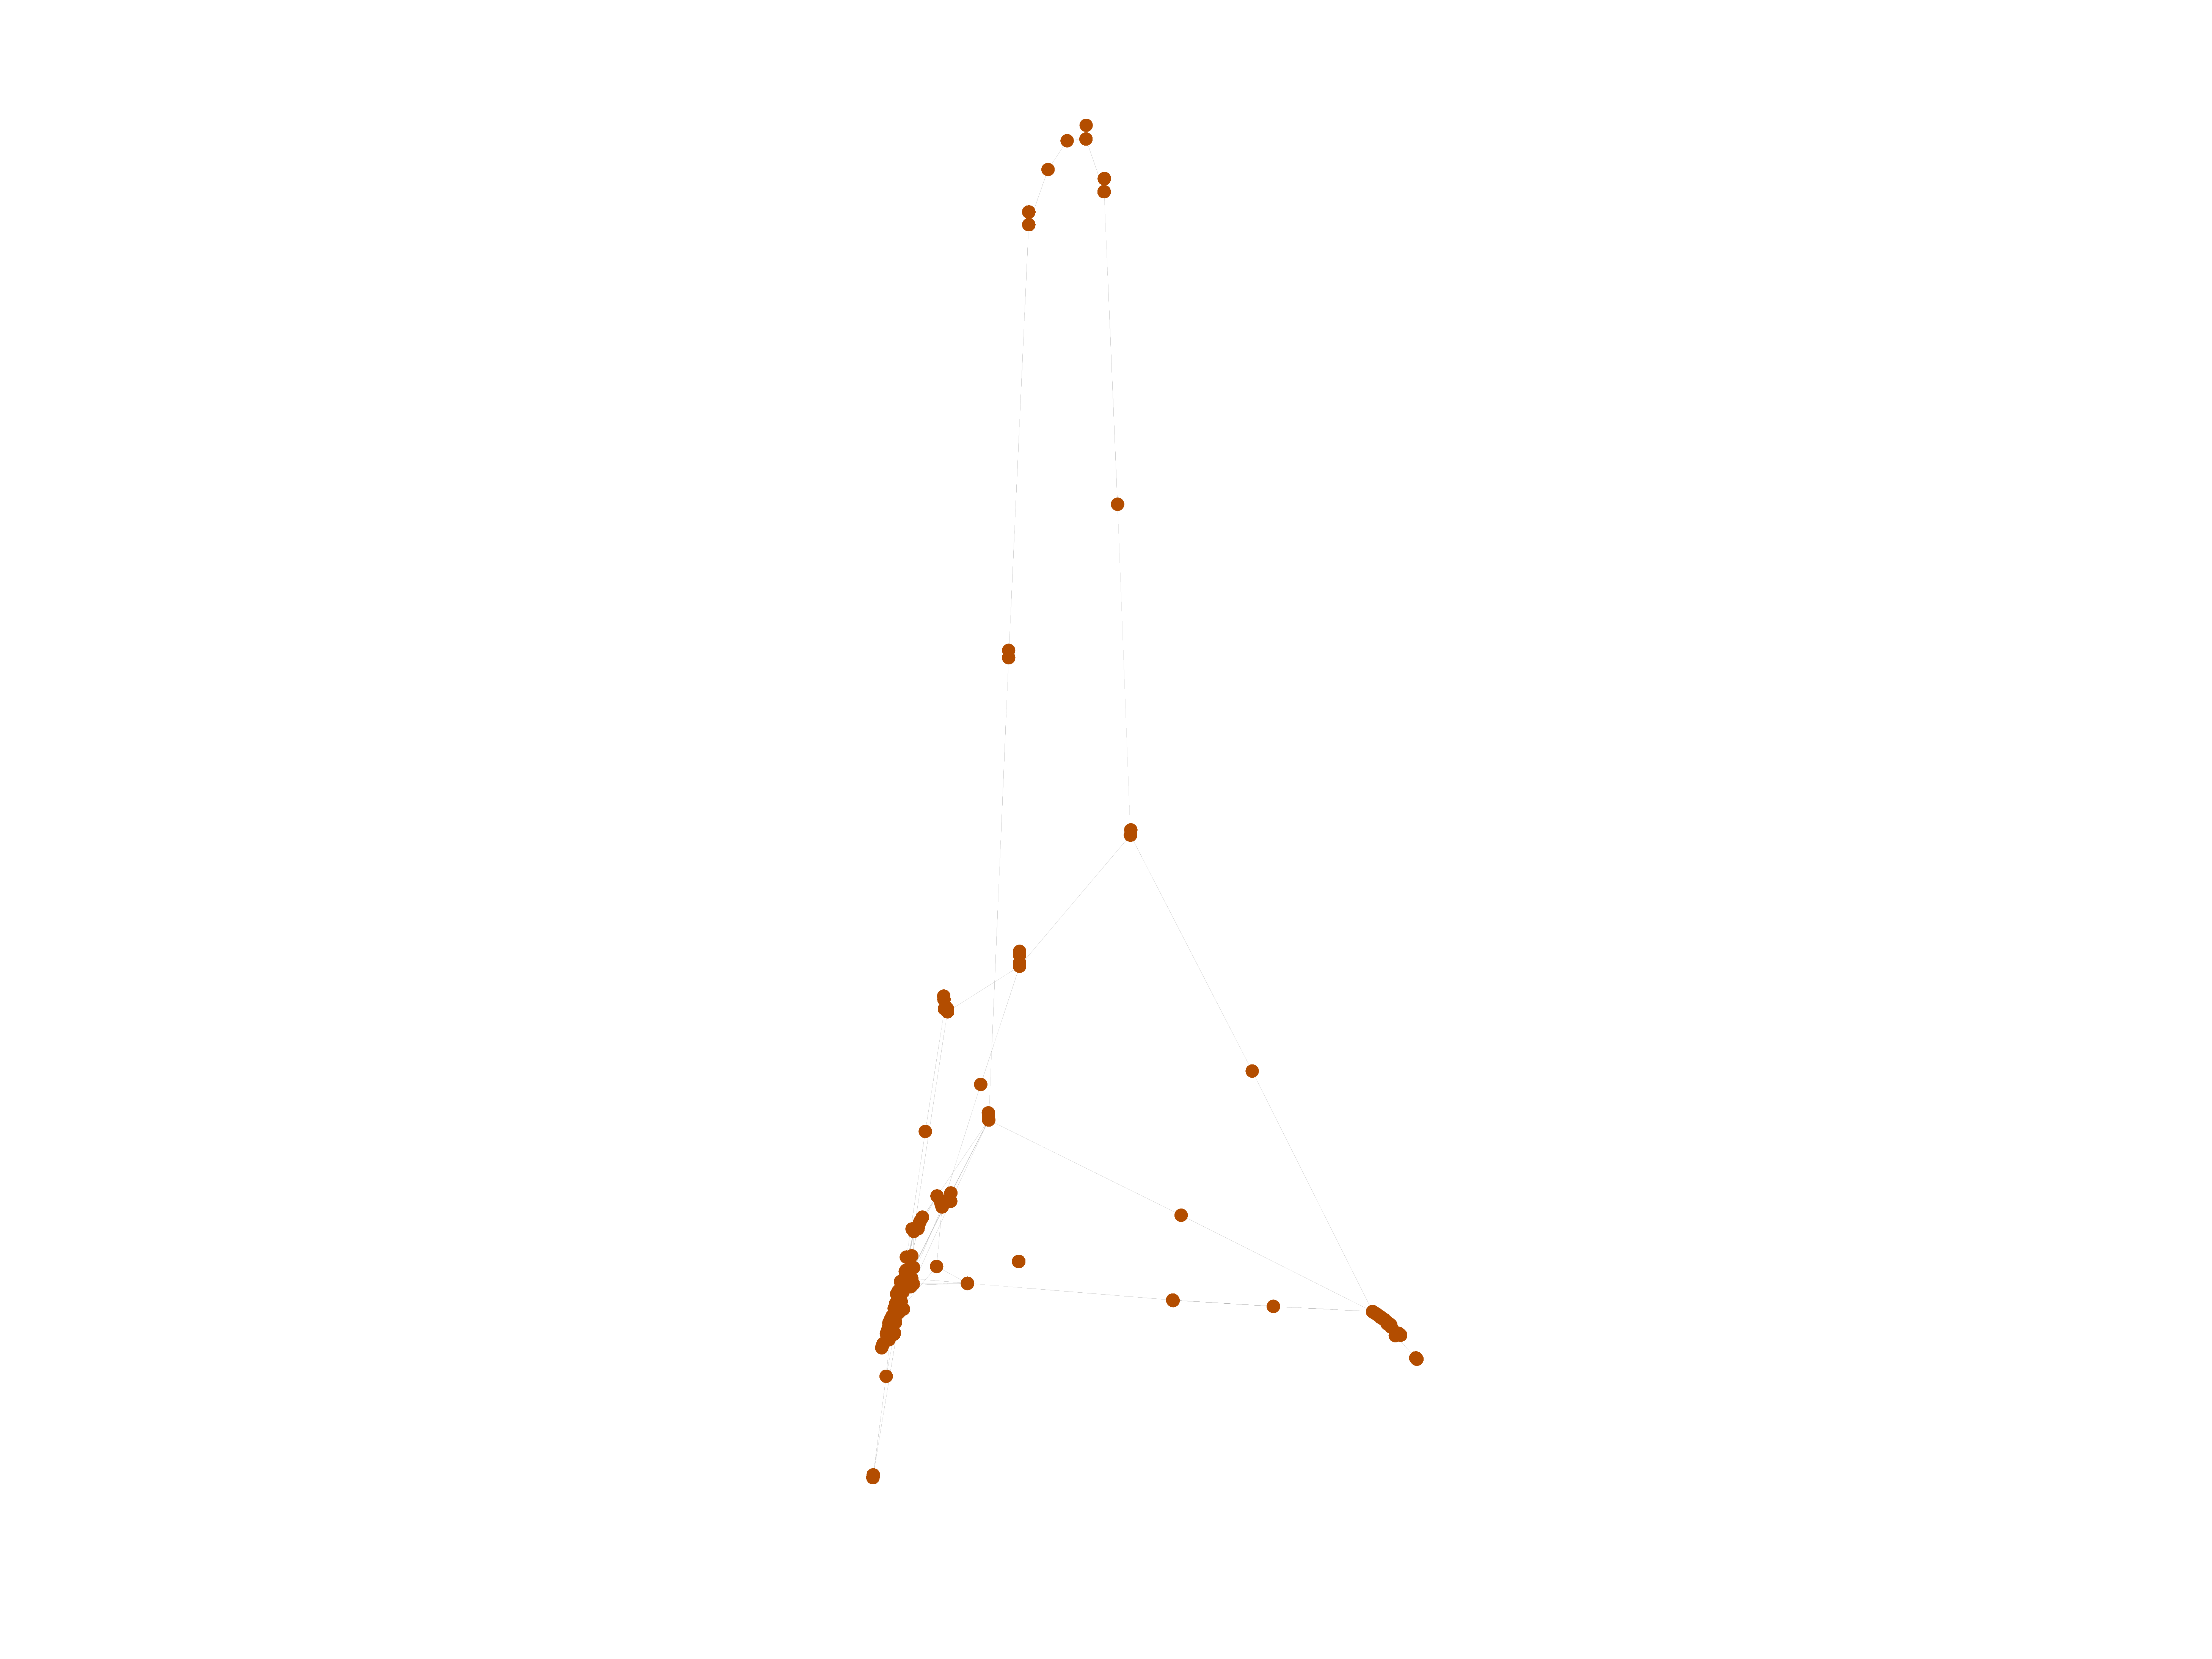
Wikibooks edits (eu)
This is the bipartite edit network of the Basque Wikibooks. It contains users
and pages from the Basque Wikibooks, connected by edit events. Each edge
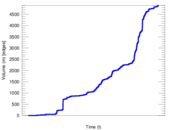
represents an edit. The dataset includes the timestamp of each edit.
Metadata
Statistics
| Size | n = | 1,197
|
| Left size | n1 = | 189
|
| Right size | n2 = | 1,008
|
| Volume | m = | 4,898
|
| Unique edge count | m̿ = | 1,294
|
| Wedge count | s = | 49,521
|
| Claw count | z = | 2,301,777
|
| Cross count | x = | 90,383,767
|
| Square count | q = | 1,975
|
| 4-Tour count | T4 = | 216,584
|
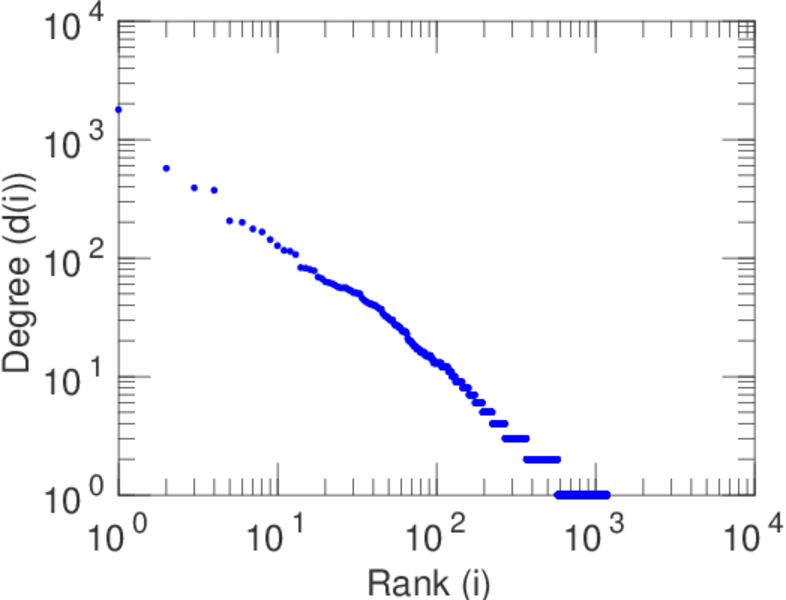
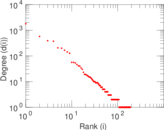
| Maximum degree | dmax = | 1,786
|
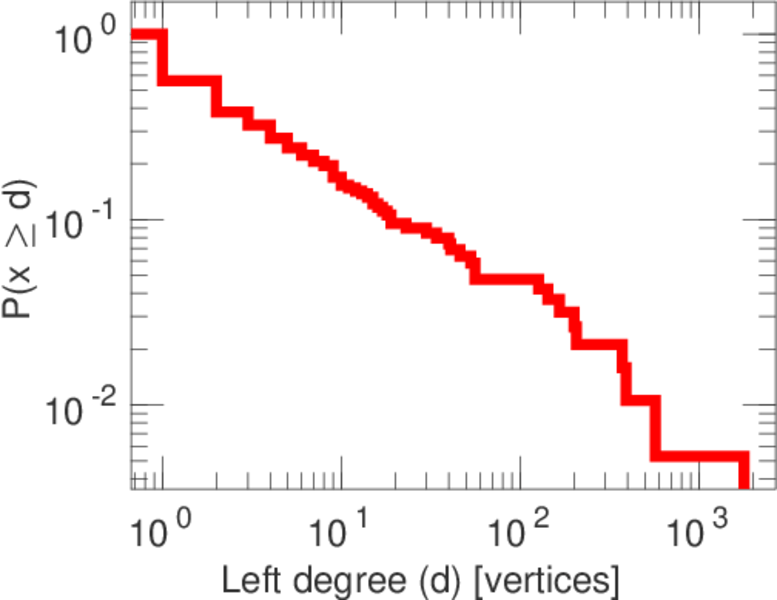
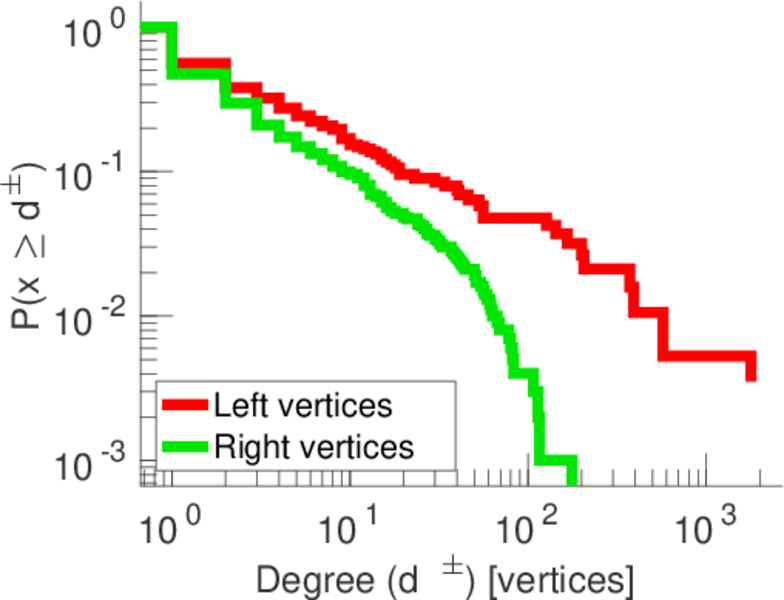
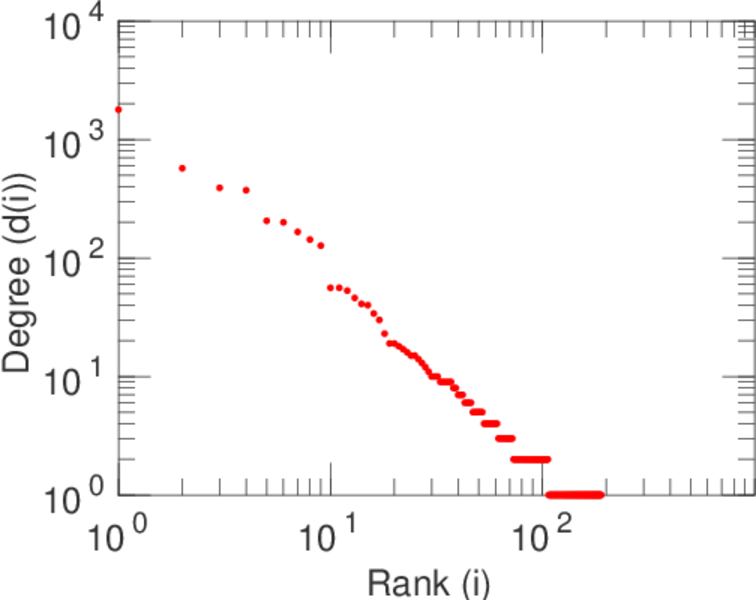
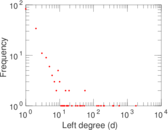
| Maximum left degree | d1max = | 1,786
|
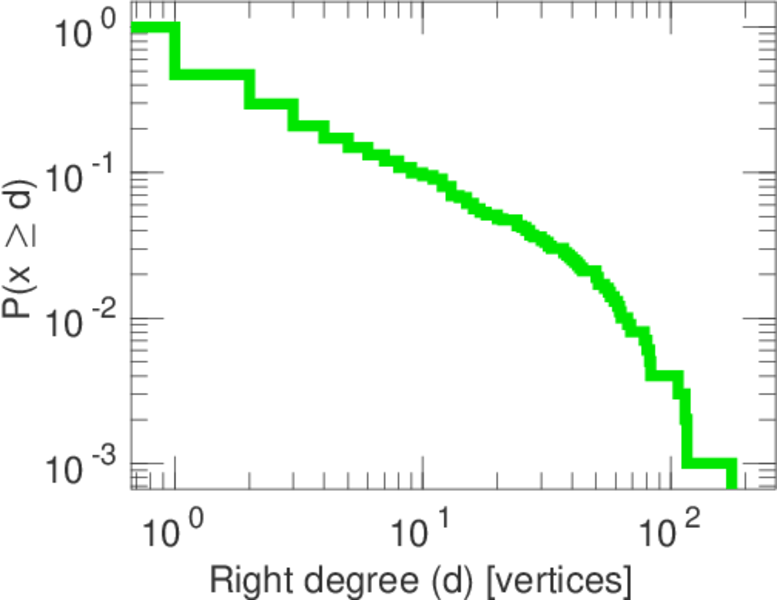
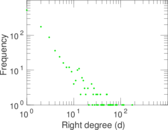
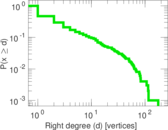
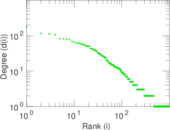
| Maximum right degree | d2max = | 176
|
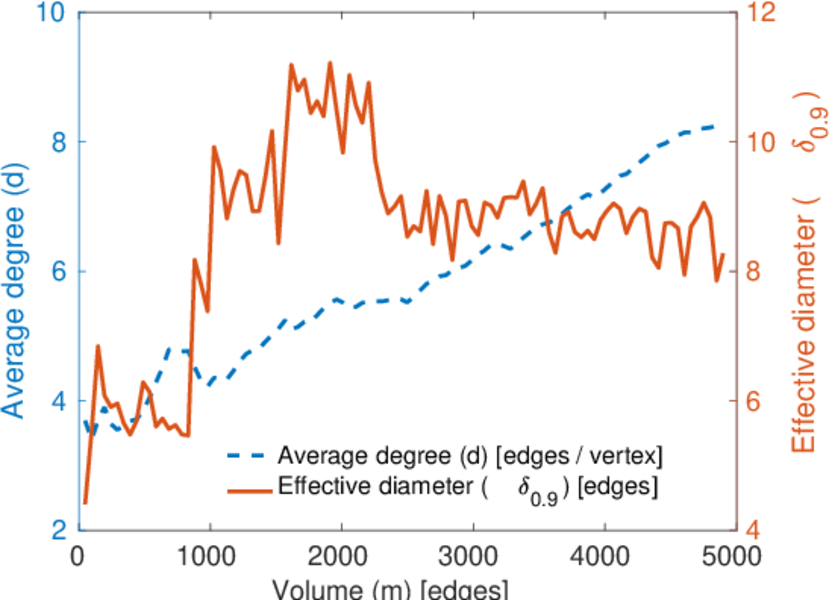
| Average degree | d = | 8.183 79
|
| Average left degree | d1 = | 25.915 3
|
| Average right degree | d2 = | 4.859 13
|
| Fill | p = | 0.006 792 22
|
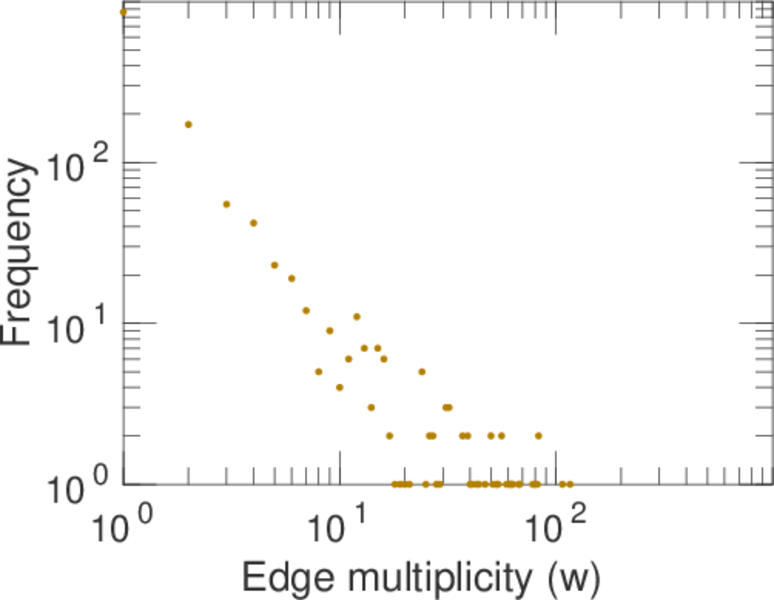
| Average edge multiplicity | m̃ = | 3.785 16
|
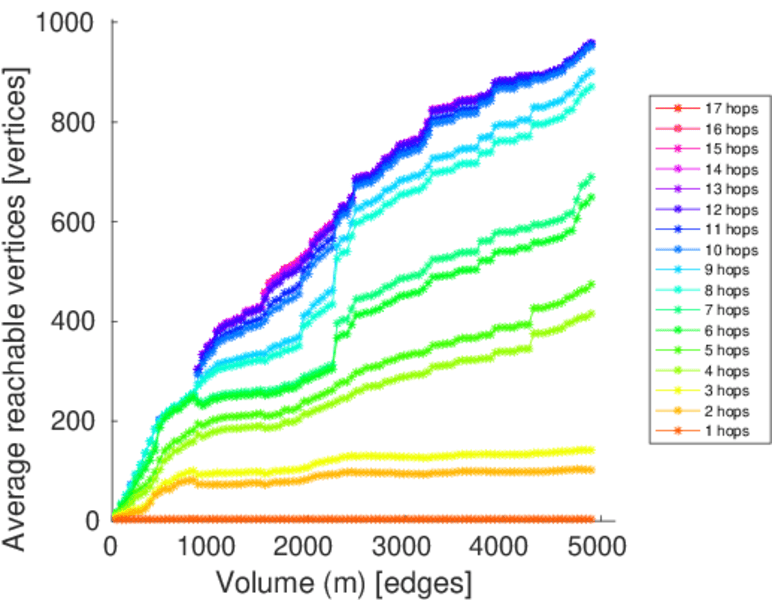
| Size of LCC | N = | 956
|
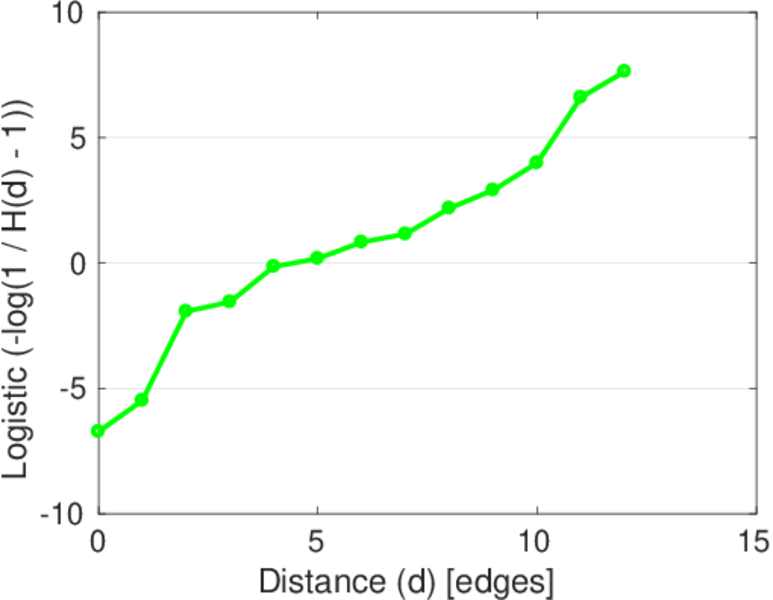
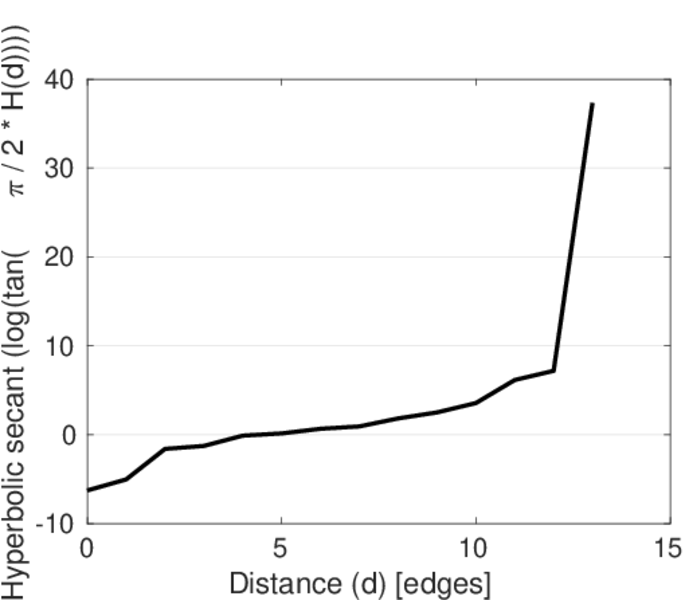
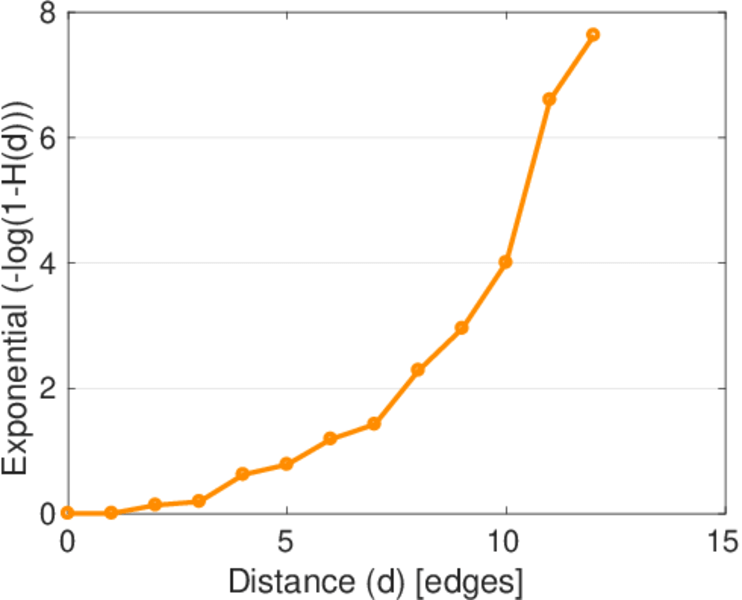
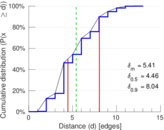
| Diameter | δ = | 13
|
| 50-Percentile effective diameter | δ0.5 = | 4.463 55
|
| 90-Percentile effective diameter | δ0.9 = | 8.037 49
|
| Median distance | δM = | 5
|
| Mean distance | δm = | 5.409 22
|
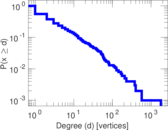
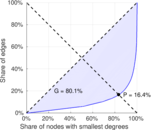
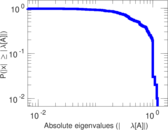
| Gini coefficient | G = | 0.804 072
|
| Balanced inequality ratio | P = | 0.167 313
|
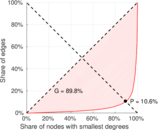
| Left balanced inequality ratio | P1 = | 0.105 553
|
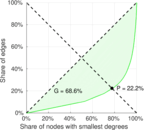
| Right balanced inequality ratio | P2 = | 0.222 131
|
| Relative edge distribution entropy | Her = | 0.840 057
|
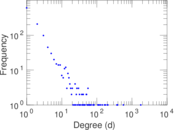
| Power law exponent | γ = | 4.749 14
|
| Tail power law exponent | γt = | 2.571 00
|
| Tail power law exponent with p | γ3 = | 2.571 00
|
| p-value | p = | 0.000 00
|
| Left tail power law exponent with p | γ3,1 = | 1.811 00
|
| Left p-value | p1 = | 0.752 000
|
| Right tail power law exponent with p | γ3,2 = | 2.971 00
|
| Right p-value | p2 = | 0.000 00
|
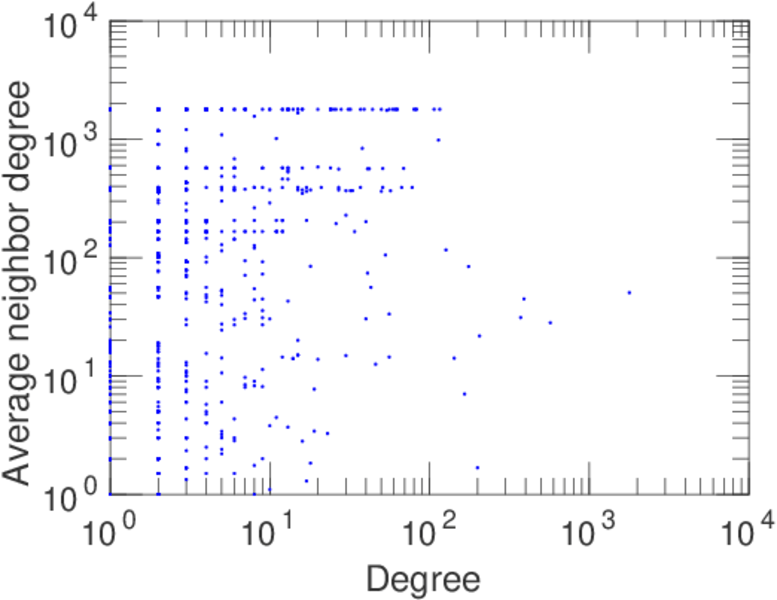
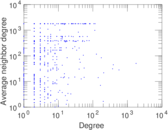
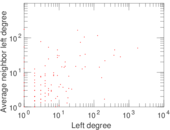
| Degree assortativity | ρ = | −0.177 514
|
| Degree assortativity p-value | pρ = | 1.271 60 × 10−10
|
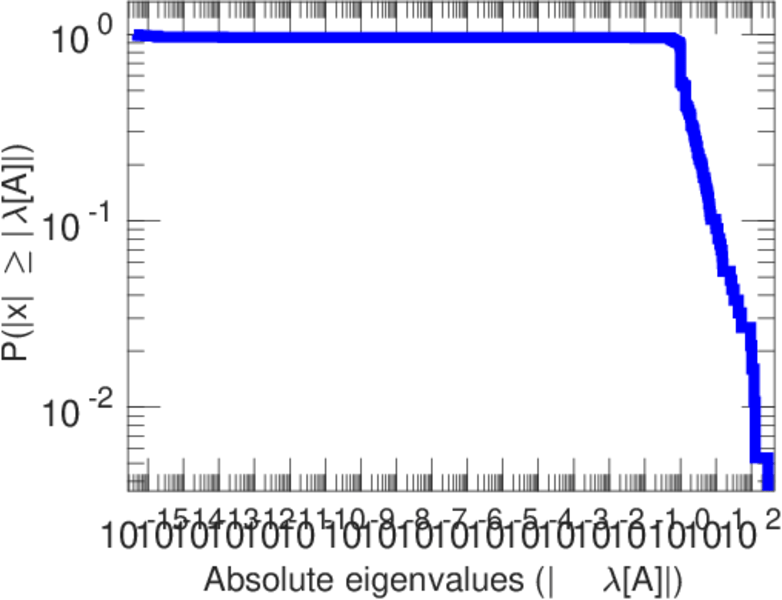
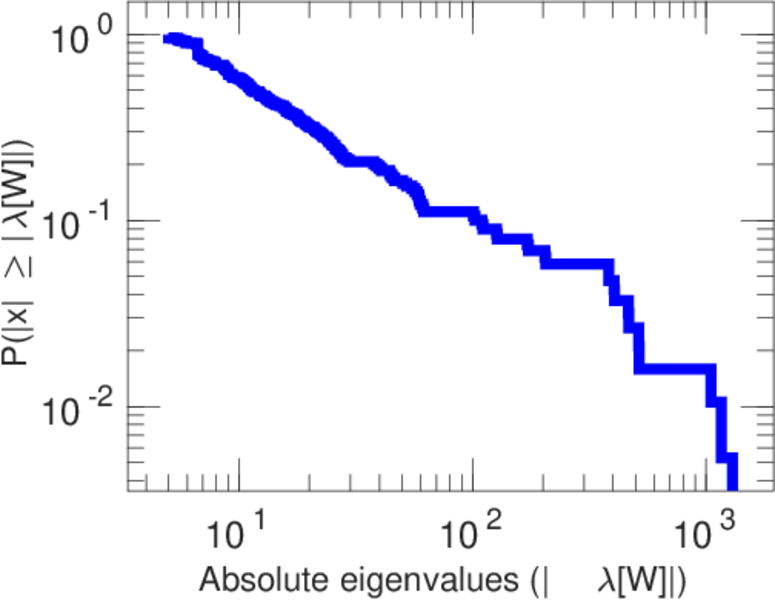
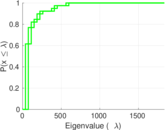
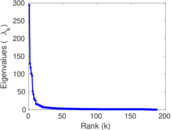
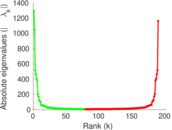
| Spectral norm | α = | 293.729
|
| Algebraic connectivity | a = | 0.006 555 60
|
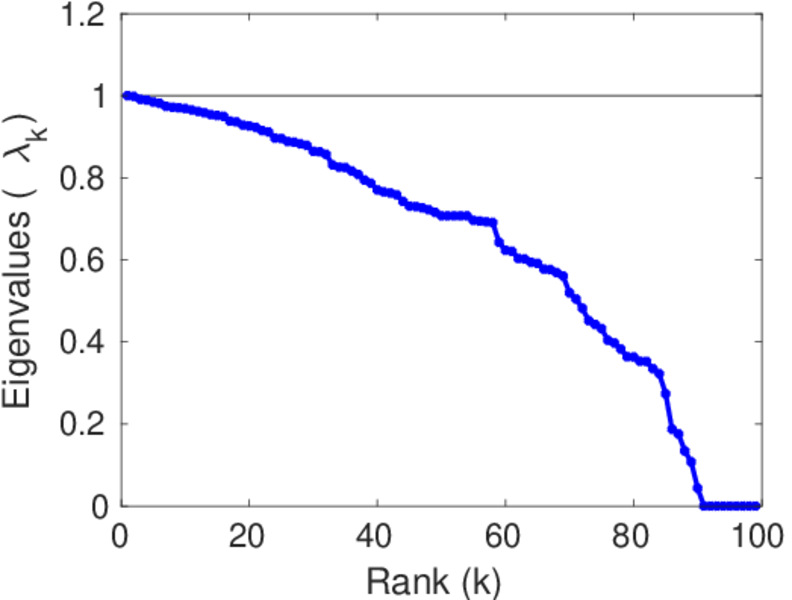
| Spectral separation | |λ1[A] / λ2[A]| = | 2.267 29
|
| Controllability | C = | 824
|
| Relative controllability | Cr = | 0.695 946
|
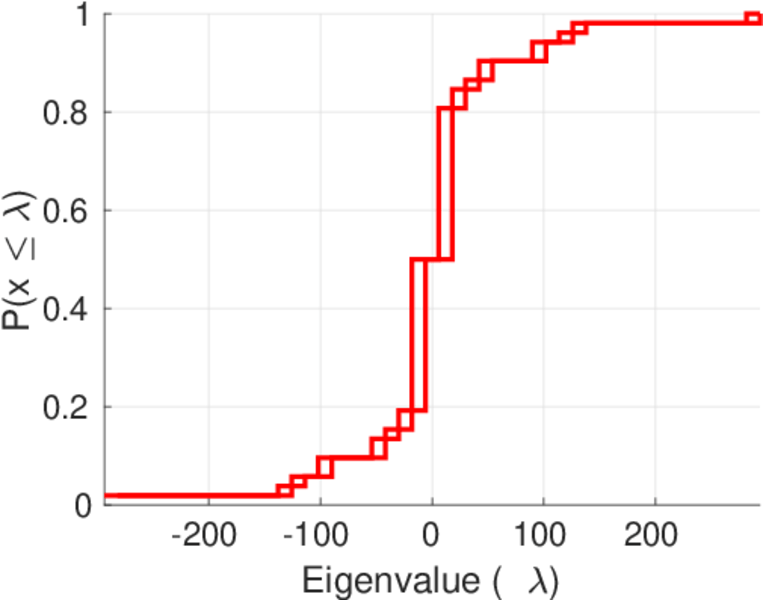
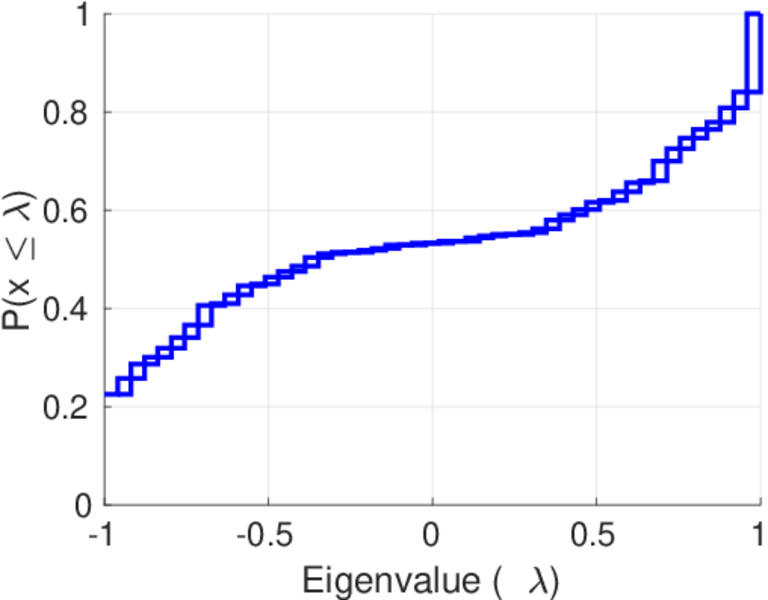
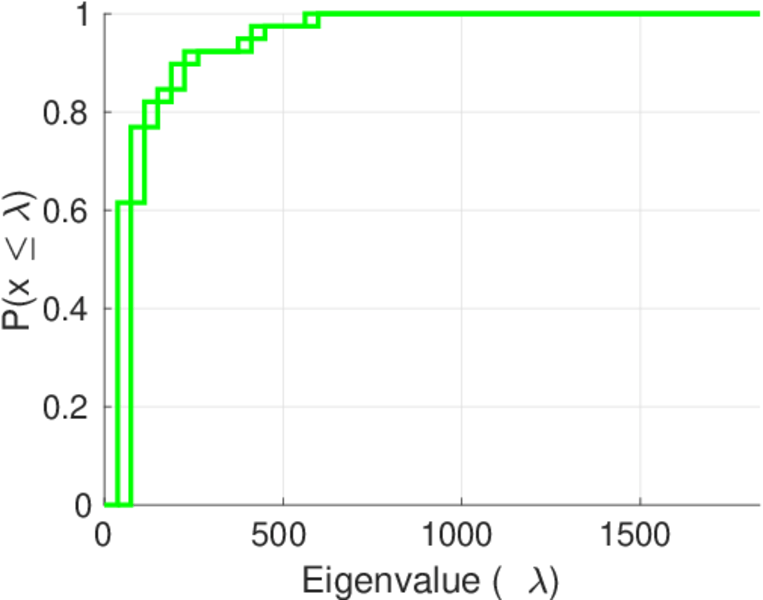
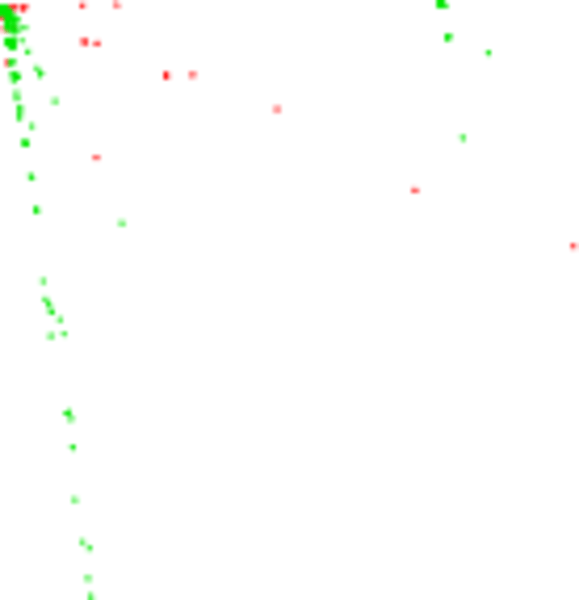
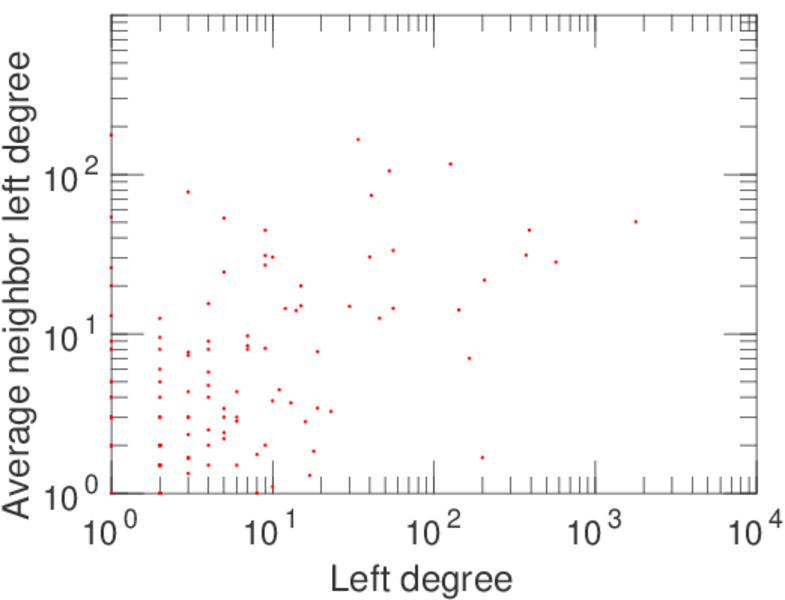
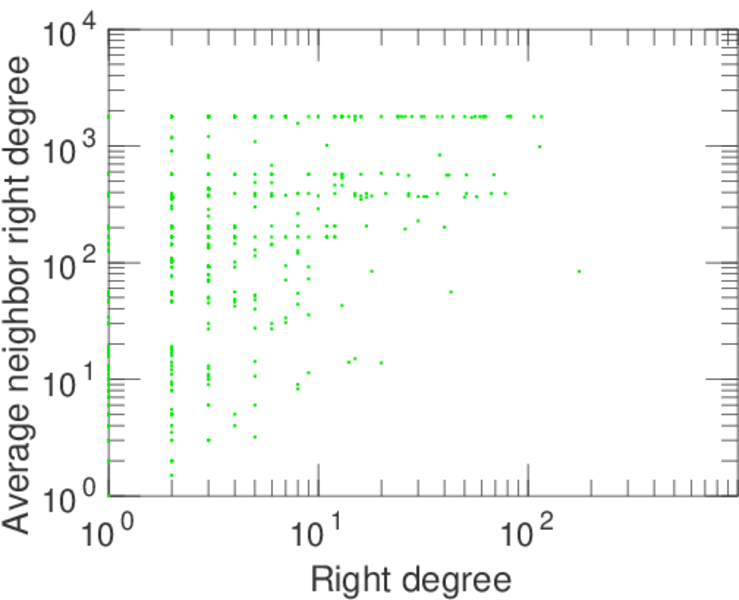
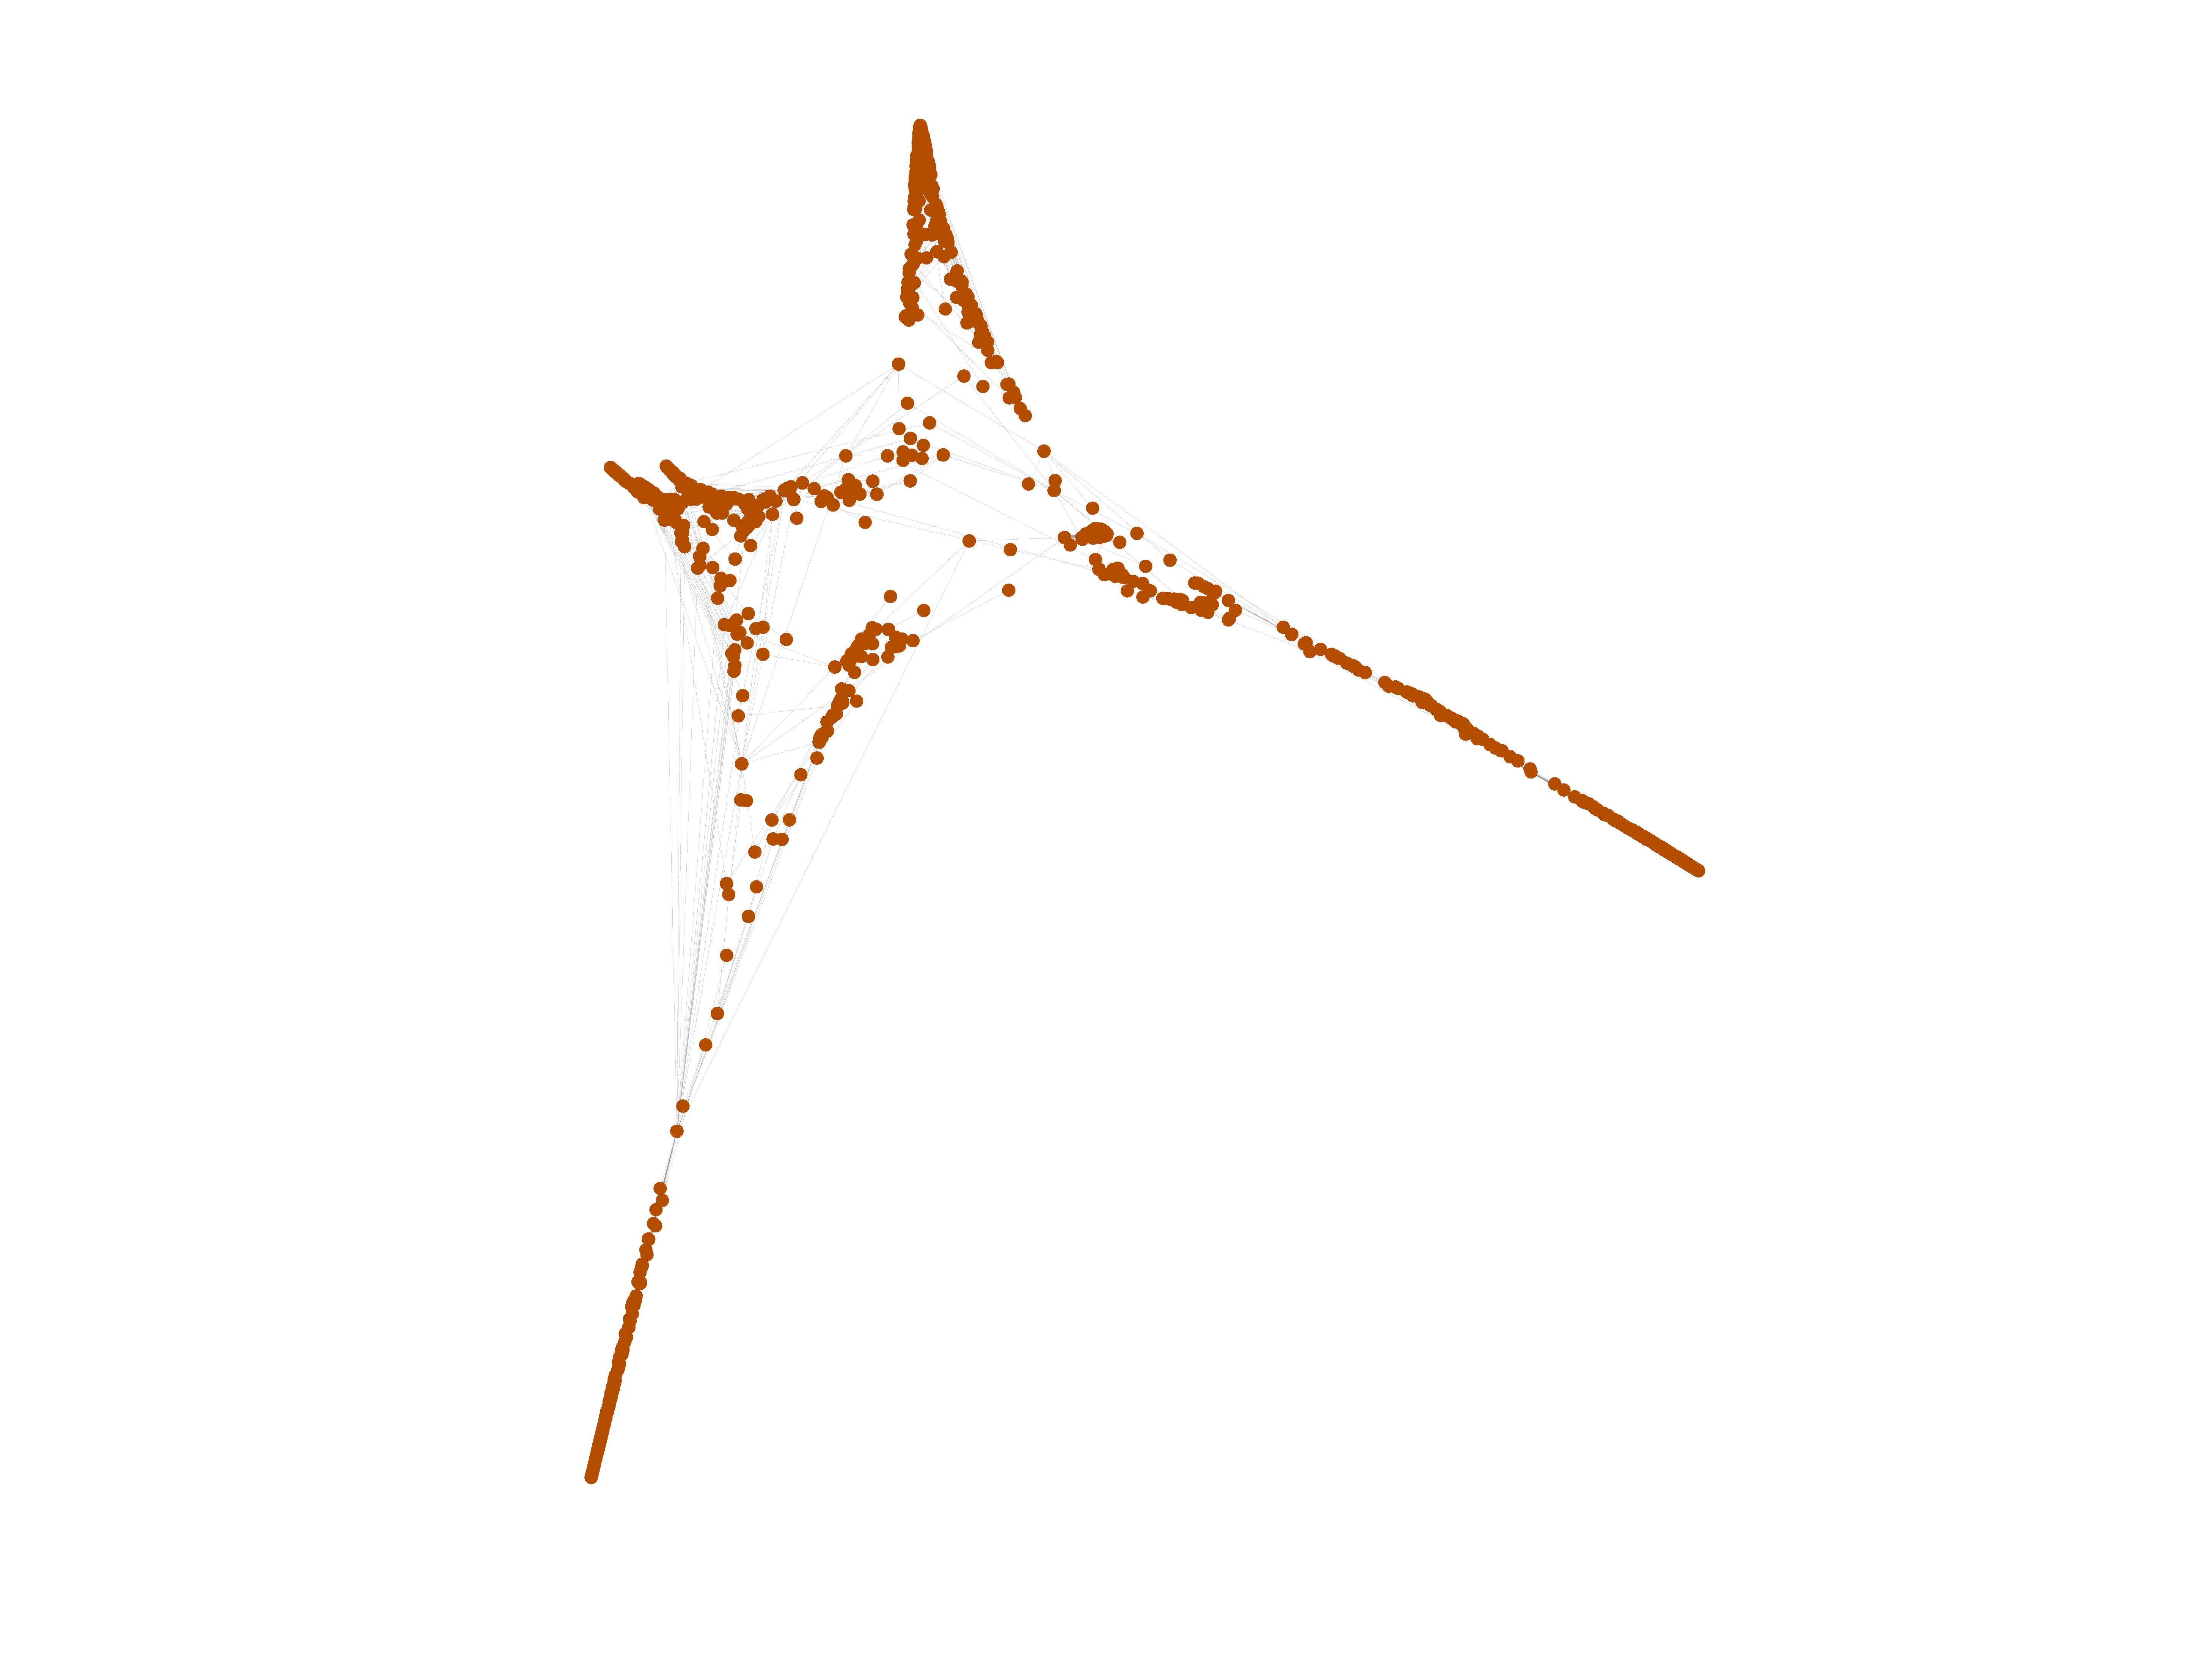
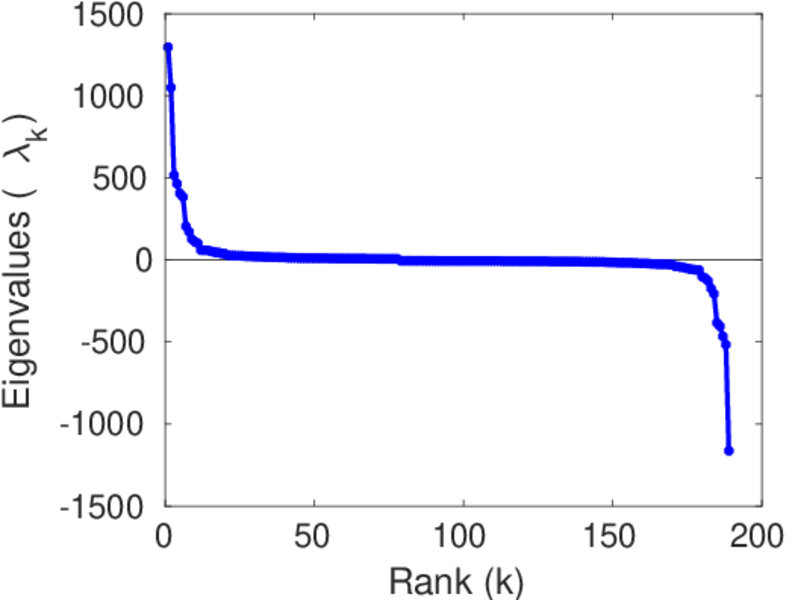
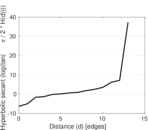
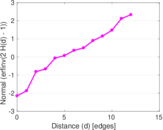
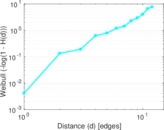
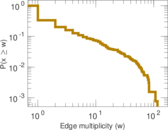
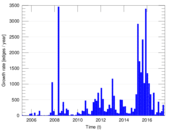
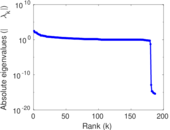
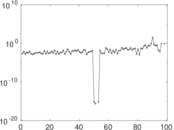
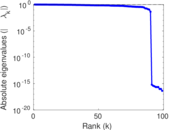
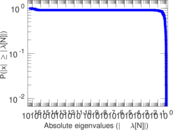
Plots


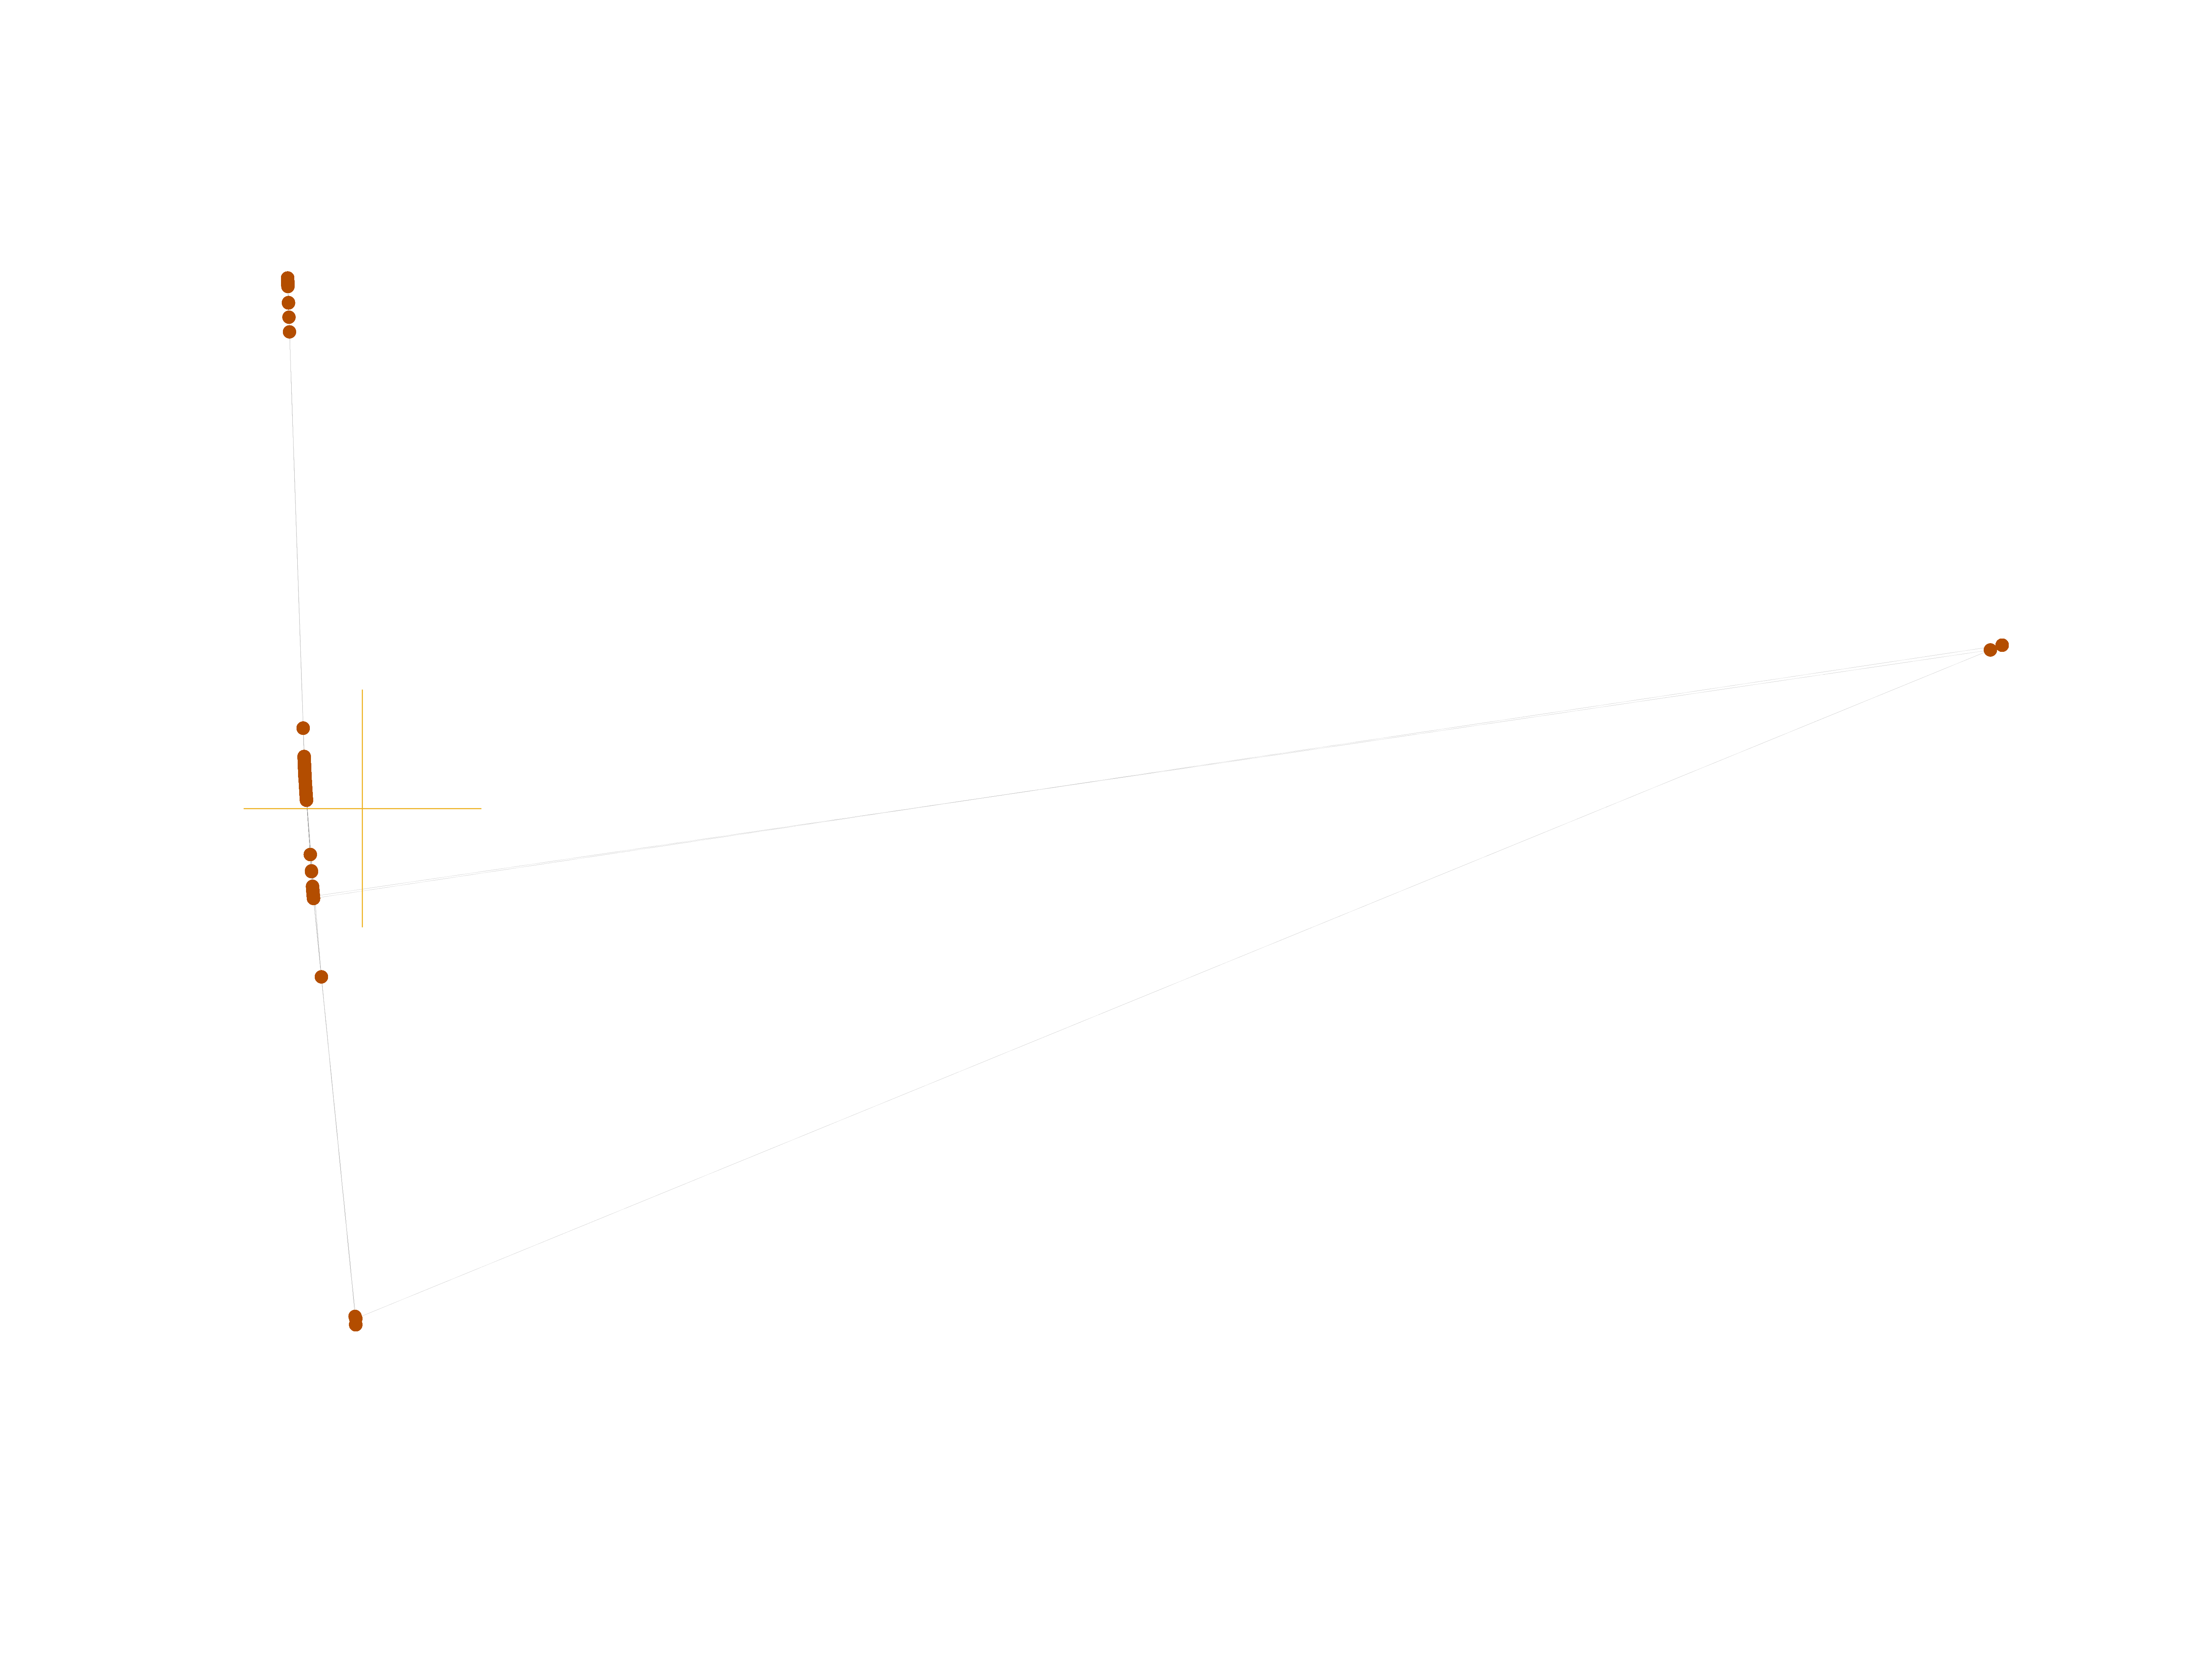
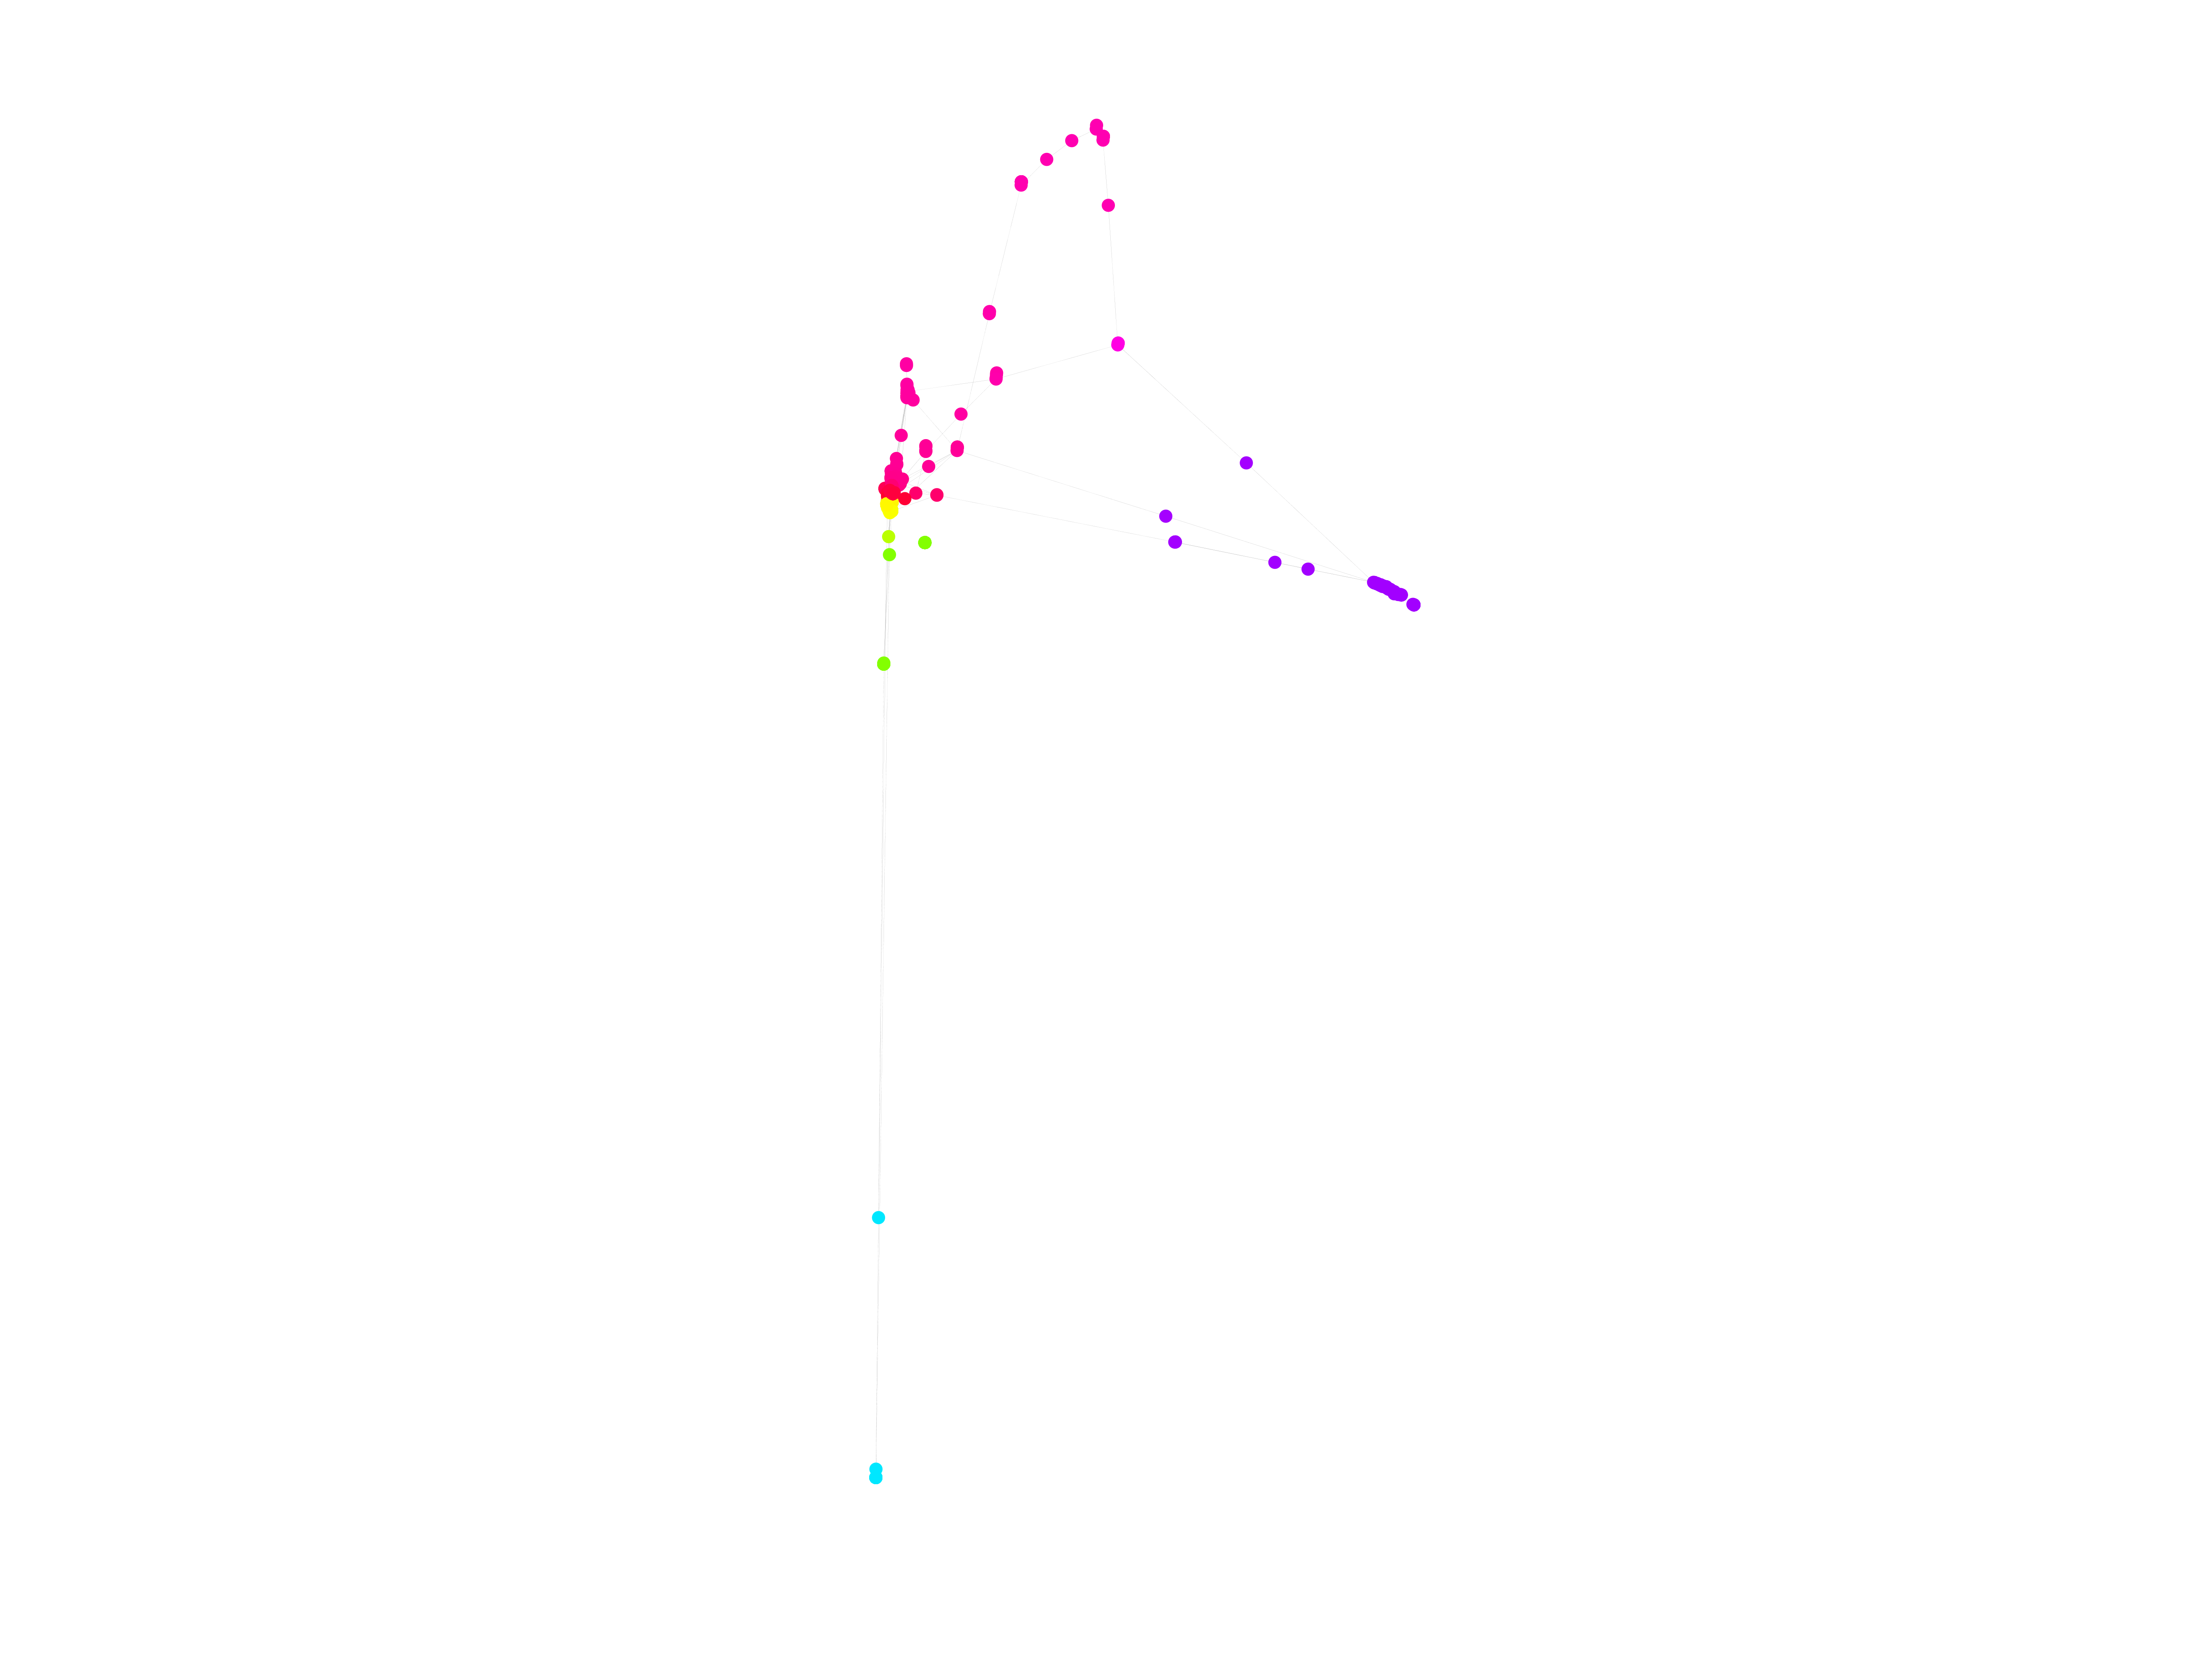
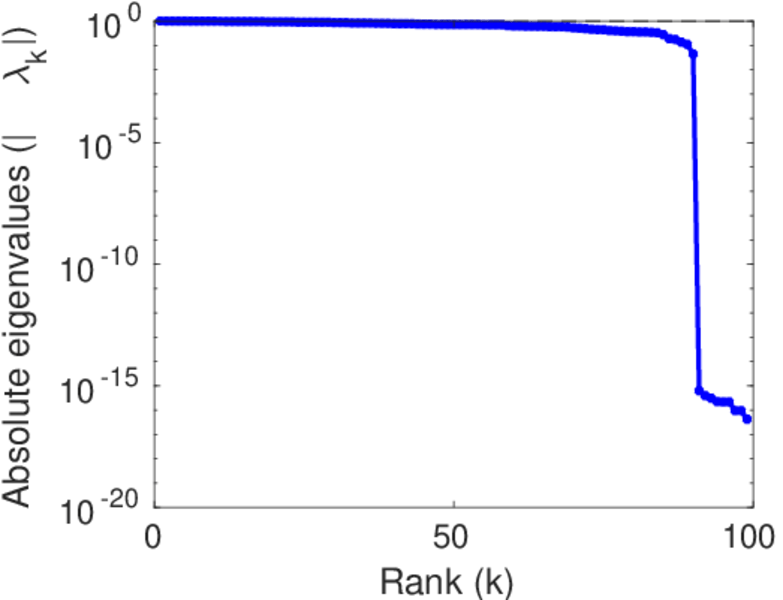
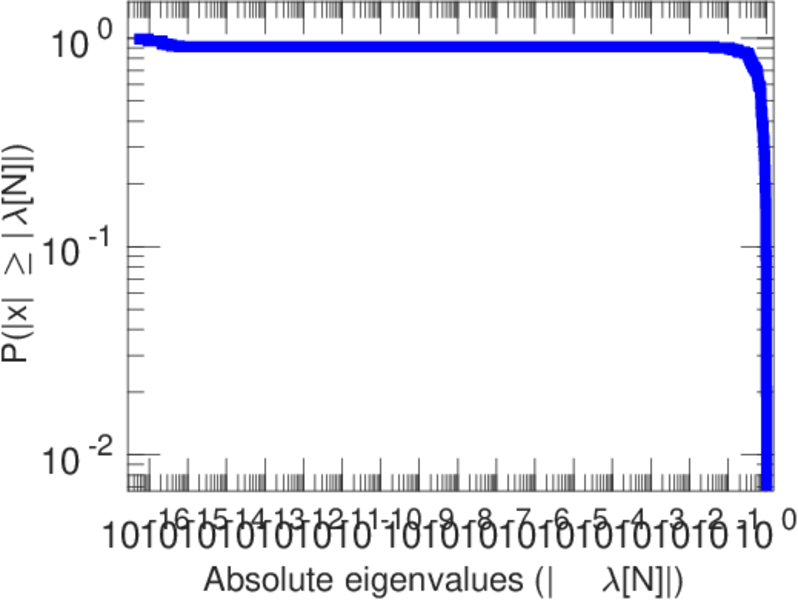
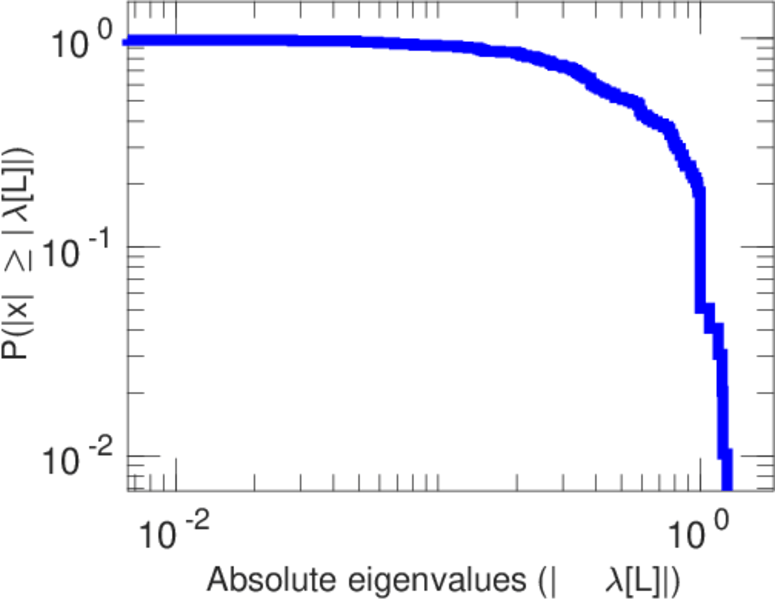
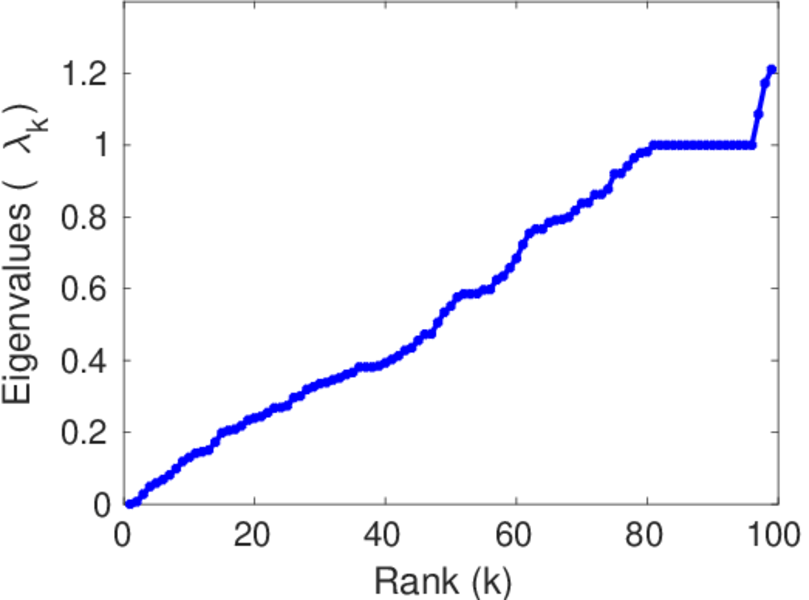
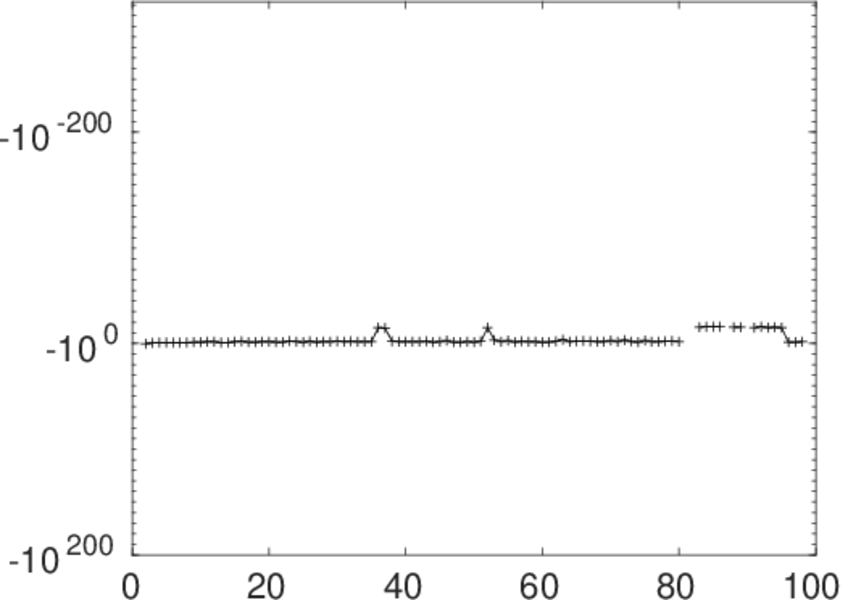
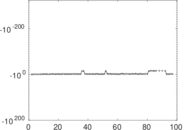
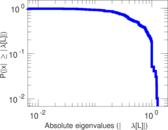
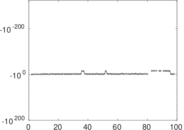
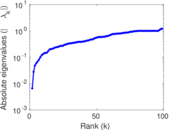
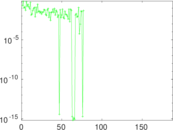
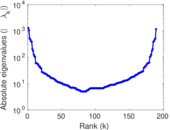
Matrix decompositions plots


Downloads
References
|
[1]
|
Jérôme Kunegis.
KONECT – The Koblenz Network Collection.
In Proc. Int. Conf. on World Wide Web Companion, pages
1343–1350, 2013.
[ http ]
|
|
[2]
|
Wikimedia Foundation.
Wikimedia downloads.
http://dumps.wikimedia.org/, January 2010.
|
 KONECT ‣ Networks ‣
Buy Me a Coffee
KONECT ‣ Networks ‣
Buy Me a Coffee