Wikiquote edits (eu)
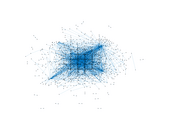
This is the bipartite edit network of the Basque Wikiquote. It contains users
and pages from the Basque Wikiquote, connected by edit events. Each edge
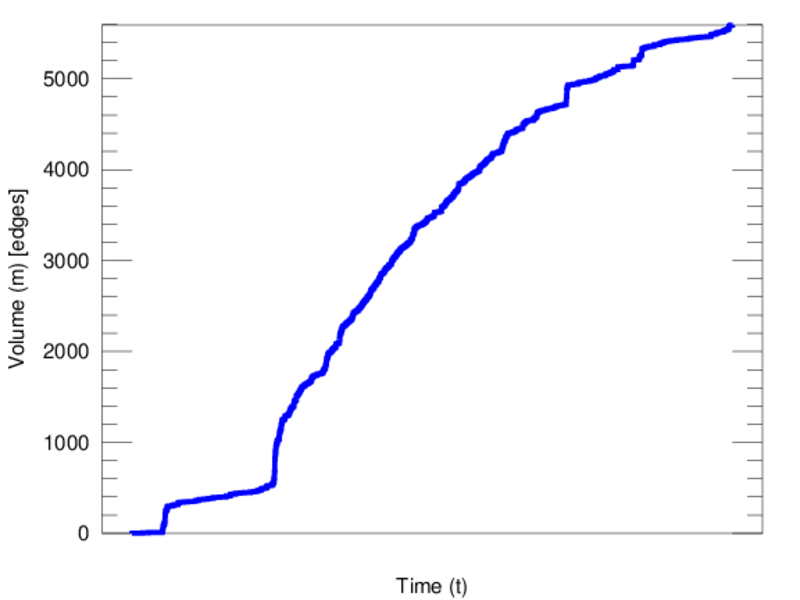
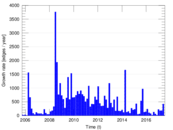
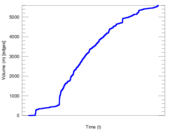
represents an edit. The dataset includes the timestamp of each edit.
Metadata
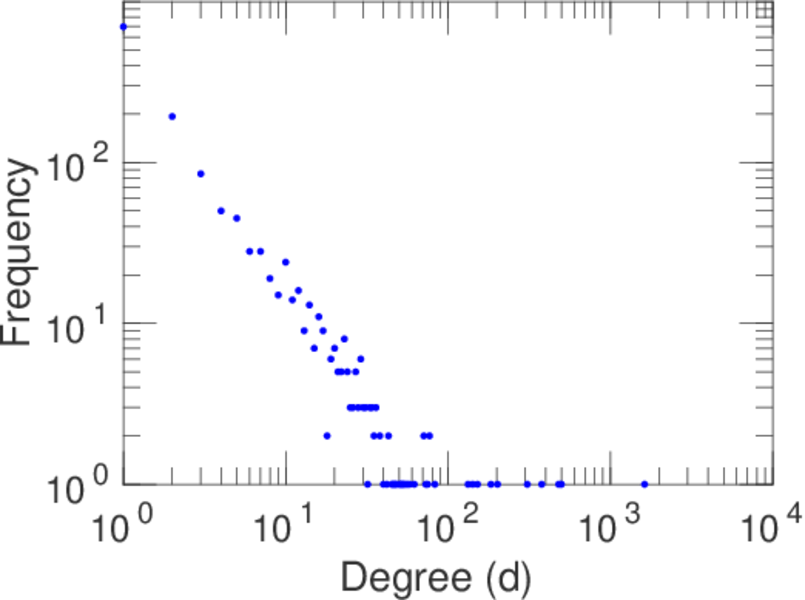
Statistics
| Size | n = | 1,380
|
| Left size | n1 = | 242
|
| Right size | n2 = | 1,138
|
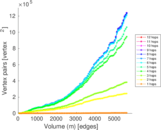
| Volume | m = | 5,591
|
| Unique edge count | m̿ = | 2,604
|
| Wedge count | s = | 161,015
|
| Claw count | z = | 11,478,179
|
| Cross count | x = | 766,536,575
|
| Square count | q = | 66,924
|
| 4-Tour count | T4 = | 1,187,072
|
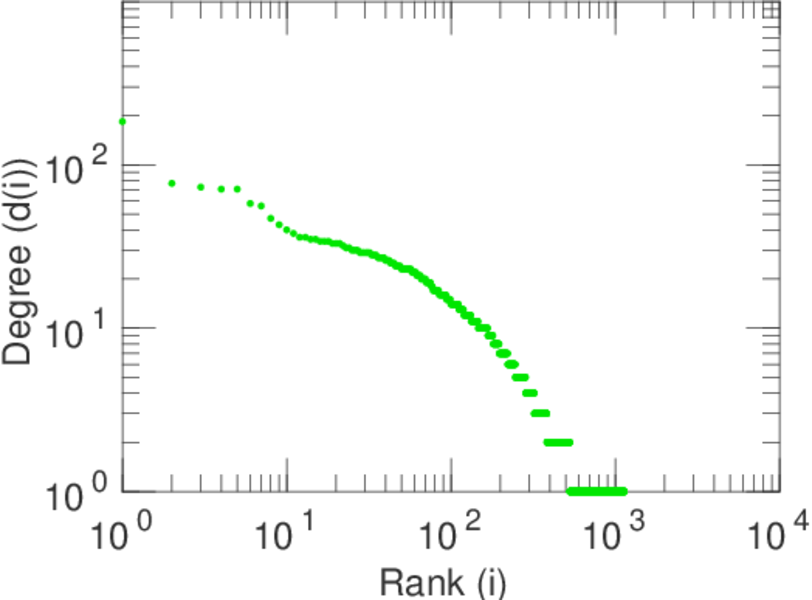
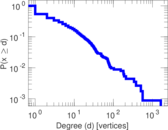
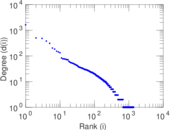
| Maximum degree | dmax = | 1,627
|
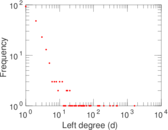
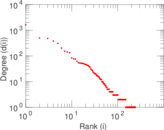
| Maximum left degree | d1max = | 1,627
|
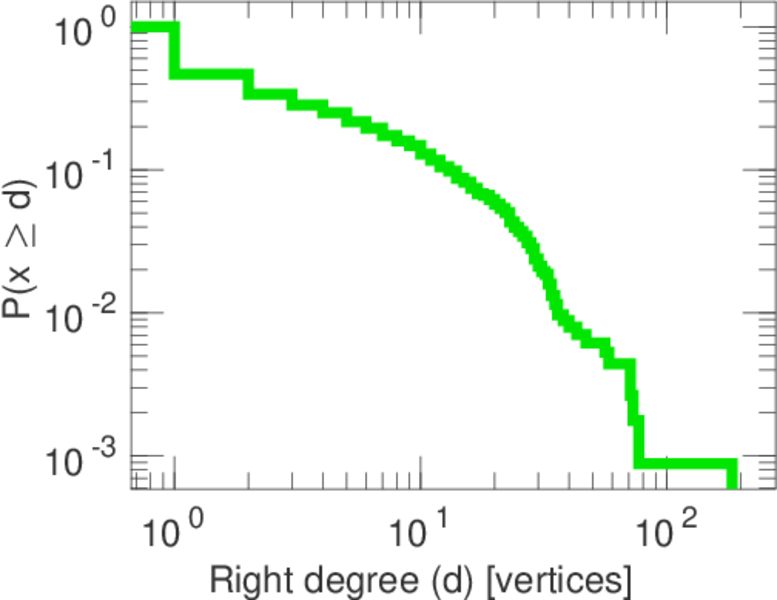
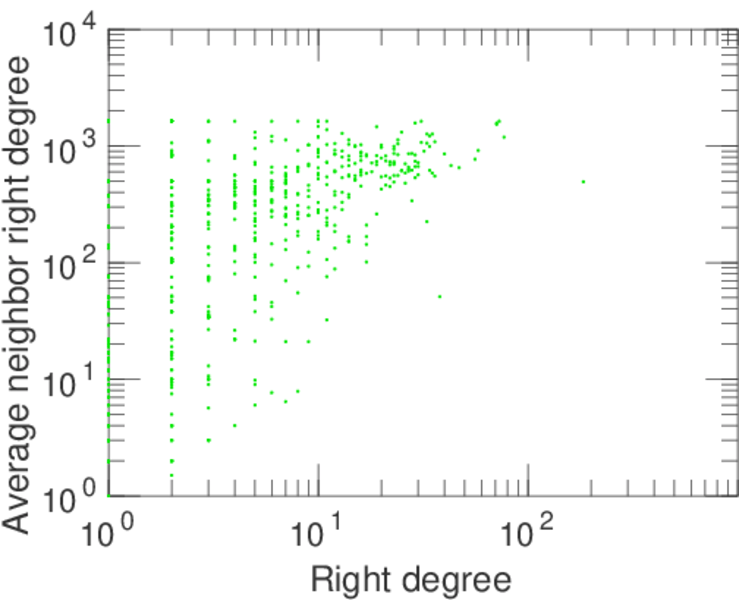
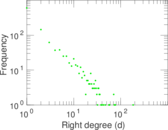
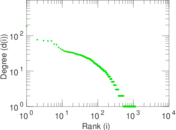
| Maximum right degree | d2max = | 184
|
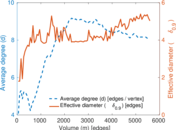
| Average degree | d = | 8.102 90
|
| Average left degree | d1 = | 23.103 3
|
| Average right degree | d2 = | 4.913 01
|
| Fill | p = | 0.009 455 48
|
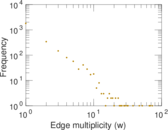
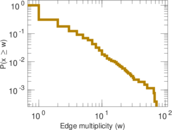
| Average edge multiplicity | m̃ = | 2.147 08
|
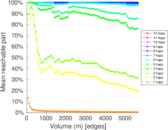
| Size of LCC | N = | 1,113
|
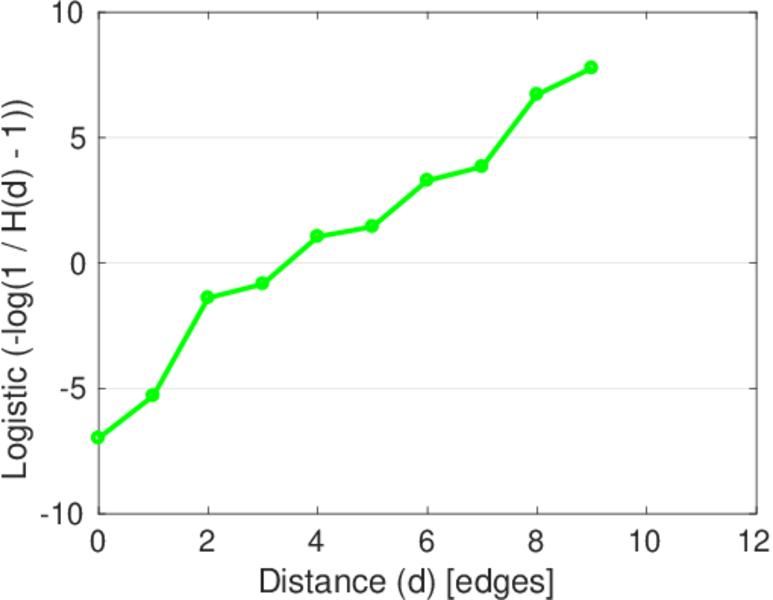
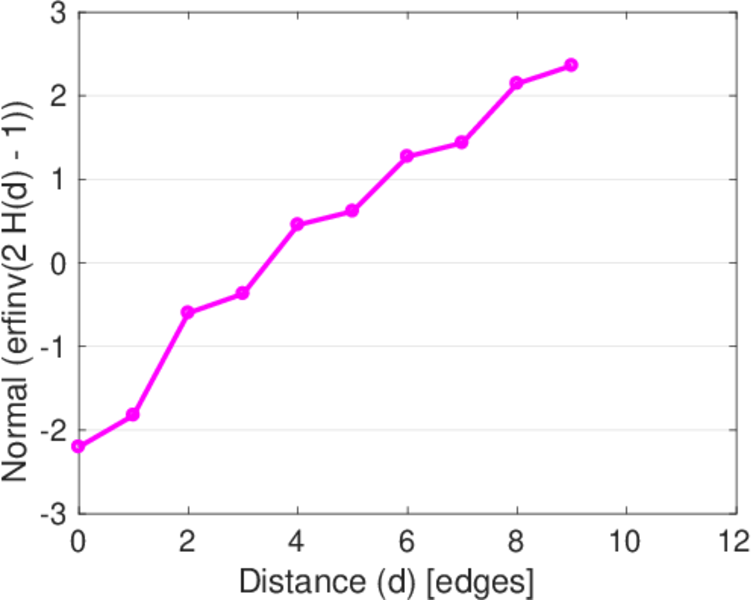
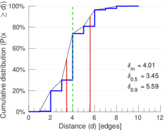
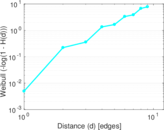
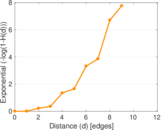
| Diameter | δ = | 11
|
| 50-Percentile effective diameter | δ0.5 = | 3.454 13
|
| 90-Percentile effective diameter | δ0.9 = | 5.588 82
|
| Median distance | δM = | 4
|
| Mean distance | δm = | 4.006 22
|
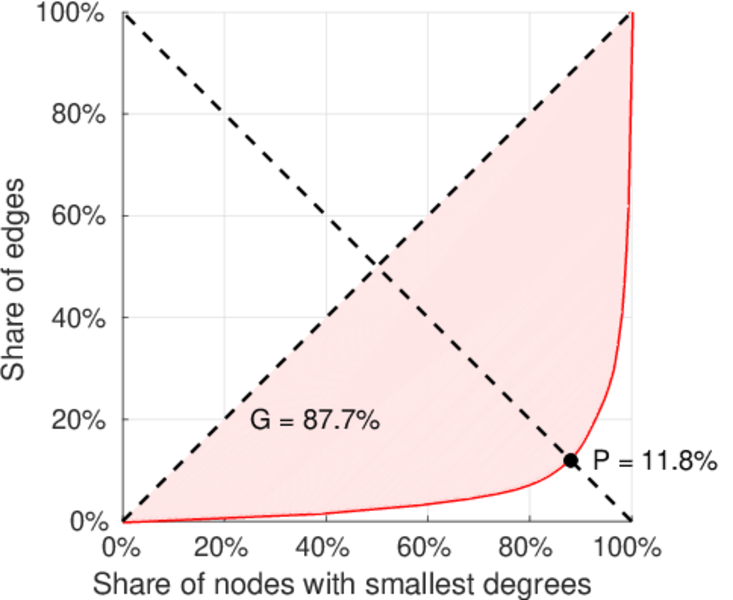
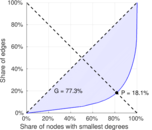
| Gini coefficient | G = | 0.784 428
|
| Balanced inequality ratio | P = | 0.182 257
|
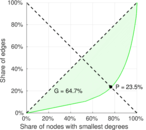
| Left balanced inequality ratio | P1 = | 0.117 868
|
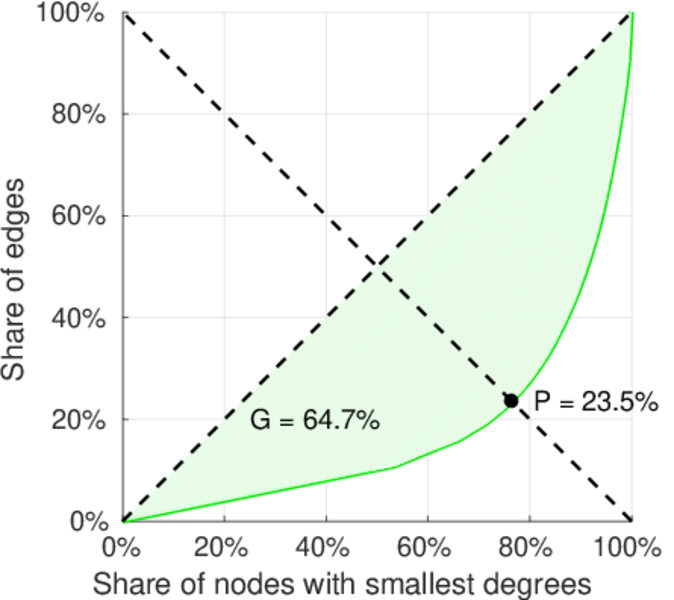
| Right balanced inequality ratio | P2 = | 0.234 842
|
| Relative edge distribution entropy | Her = | 0.820 699
|
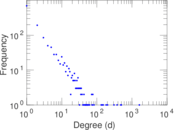
| Power law exponent | γ = | 2.777 57
|
| Tail power law exponent | γt = | 2.011 00
|
| Tail power law exponent with p | γ3 = | 2.011 00
|
| p-value | p = | 0.000 00
|
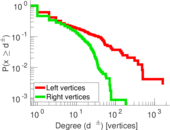
| Left tail power law exponent with p | γ3,1 = | 1.701 00
|
| Left p-value | p1 = | 0.230 000
|
| Right tail power law exponent with p | γ3,2 = | 6.761 00
|
| Right p-value | p2 = | 0.239 000
|
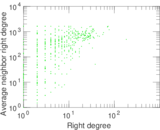
| Degree assortativity | ρ = | −0.131 391
|
| Degree assortativity p-value | pρ = | 1.687 75 × 10−11
|
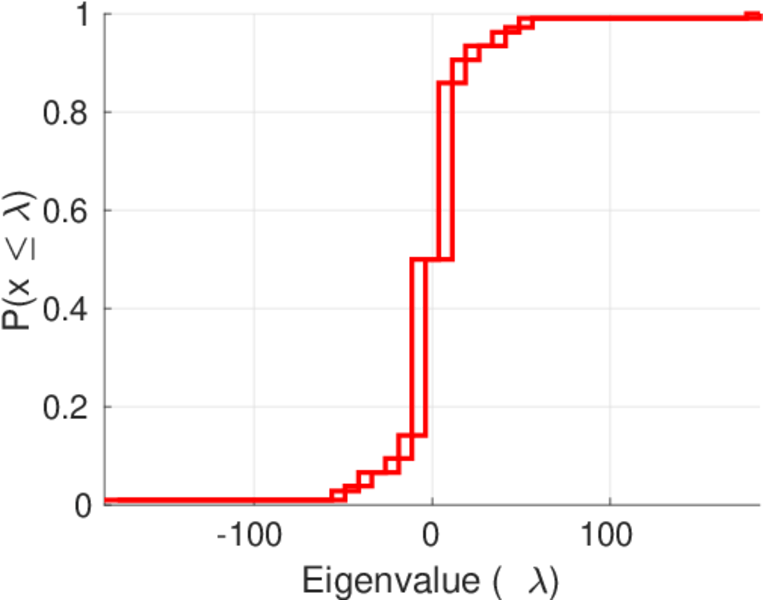
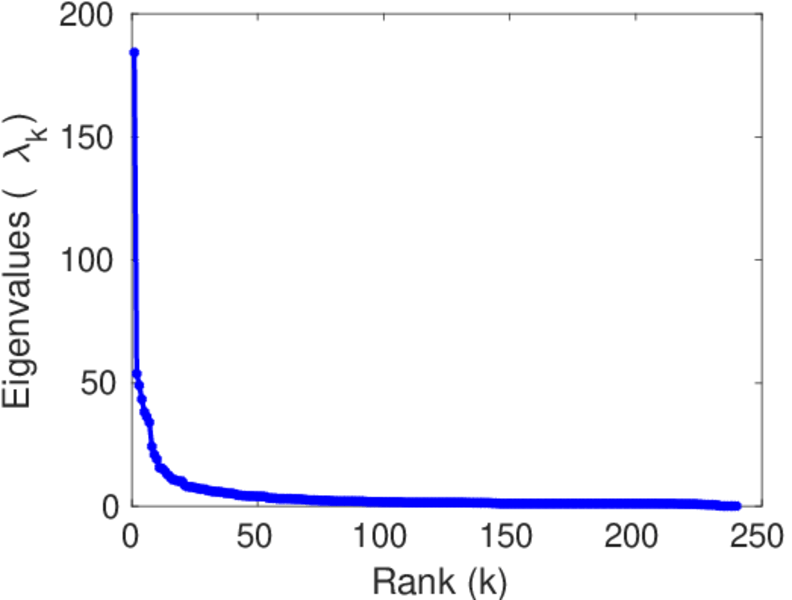
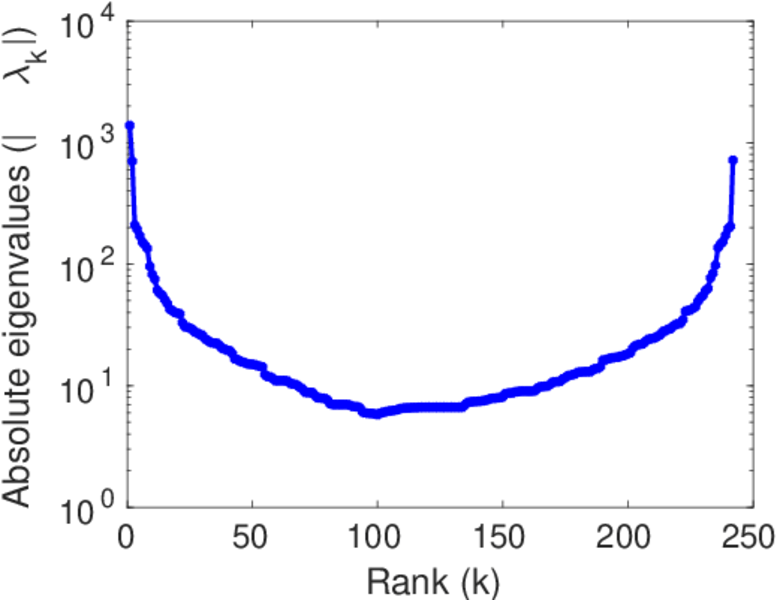
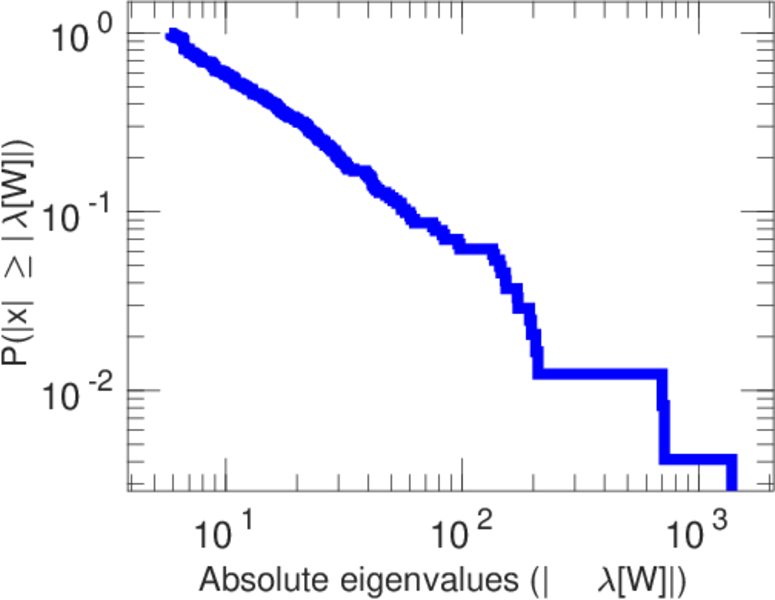
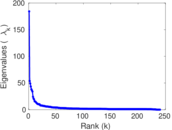
| Spectral norm | α = | 184.230
|
| Algebraic connectivity | a = | 0.030 187 7
|
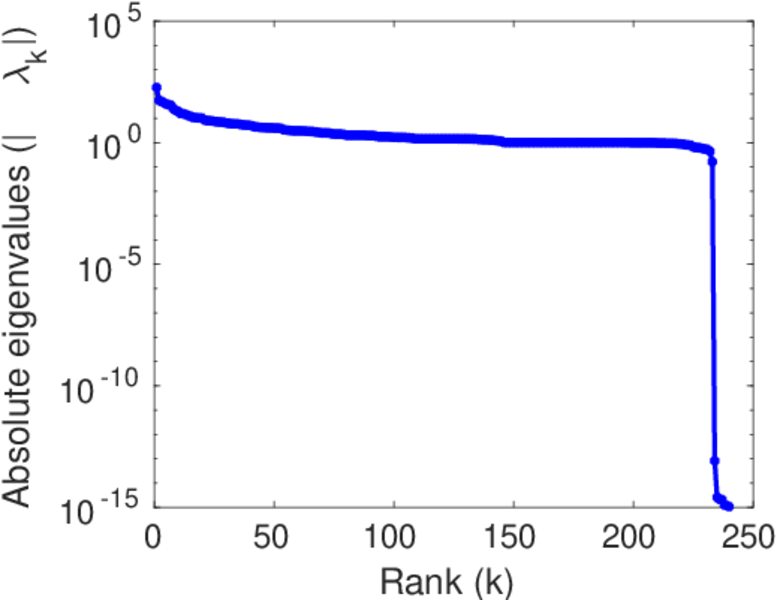
| Spectral separation | |λ1[A] / λ2[A]| = | 3.427 63
|
| Controllability | C = | 908
|
| Relative controllability | Cr = | 0.660 844
|
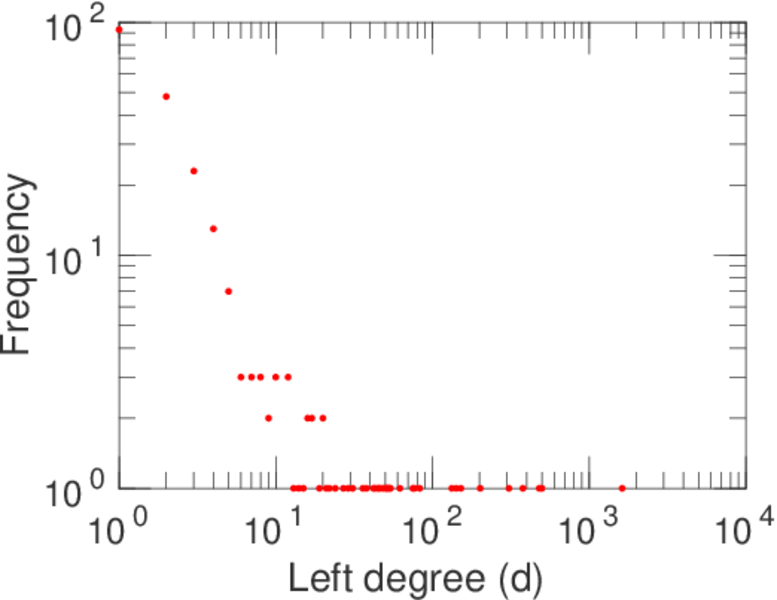
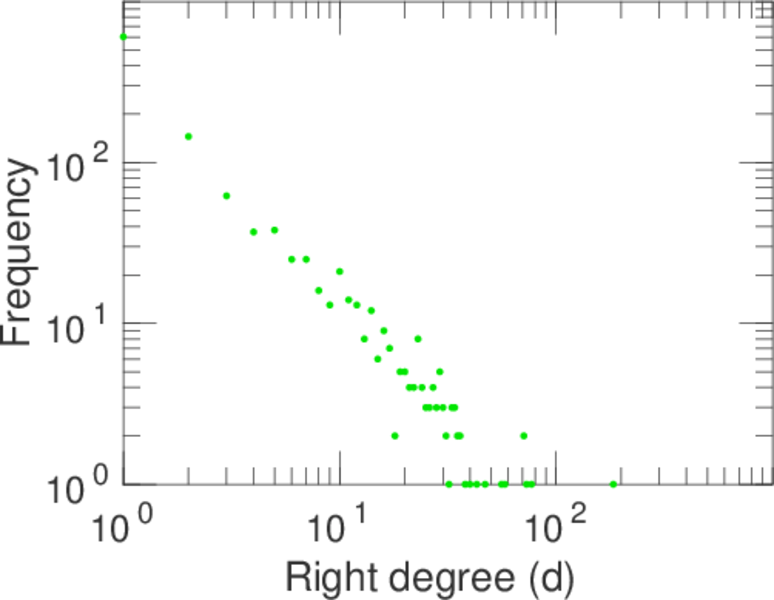
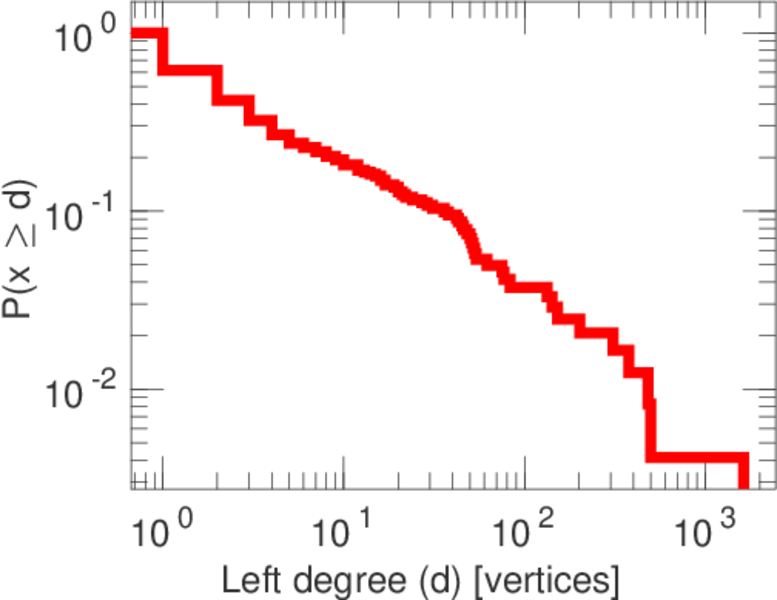
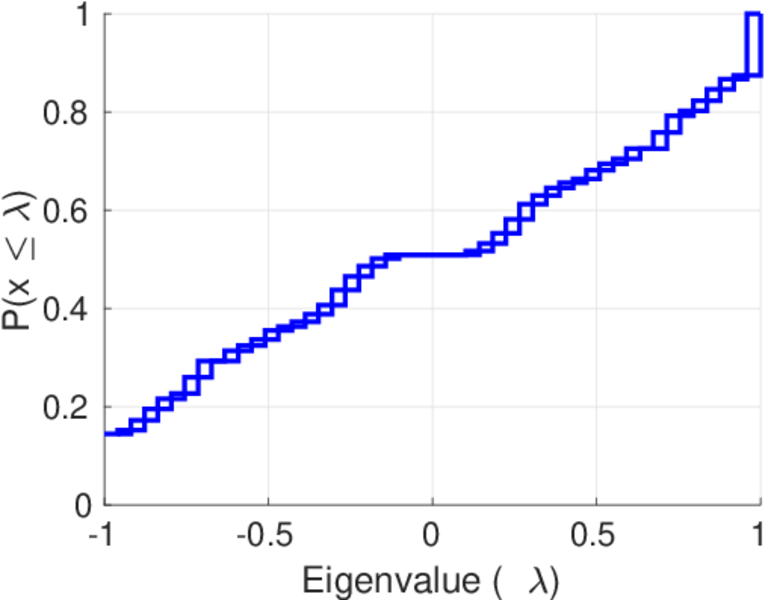
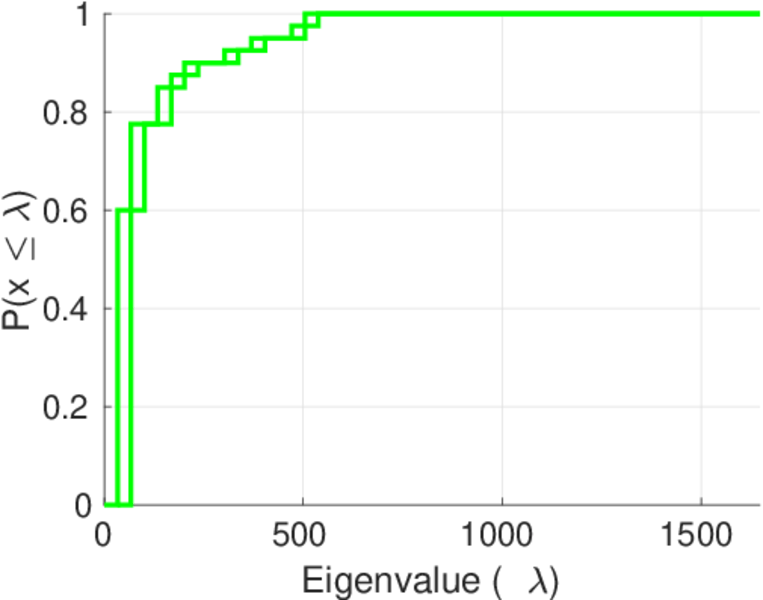
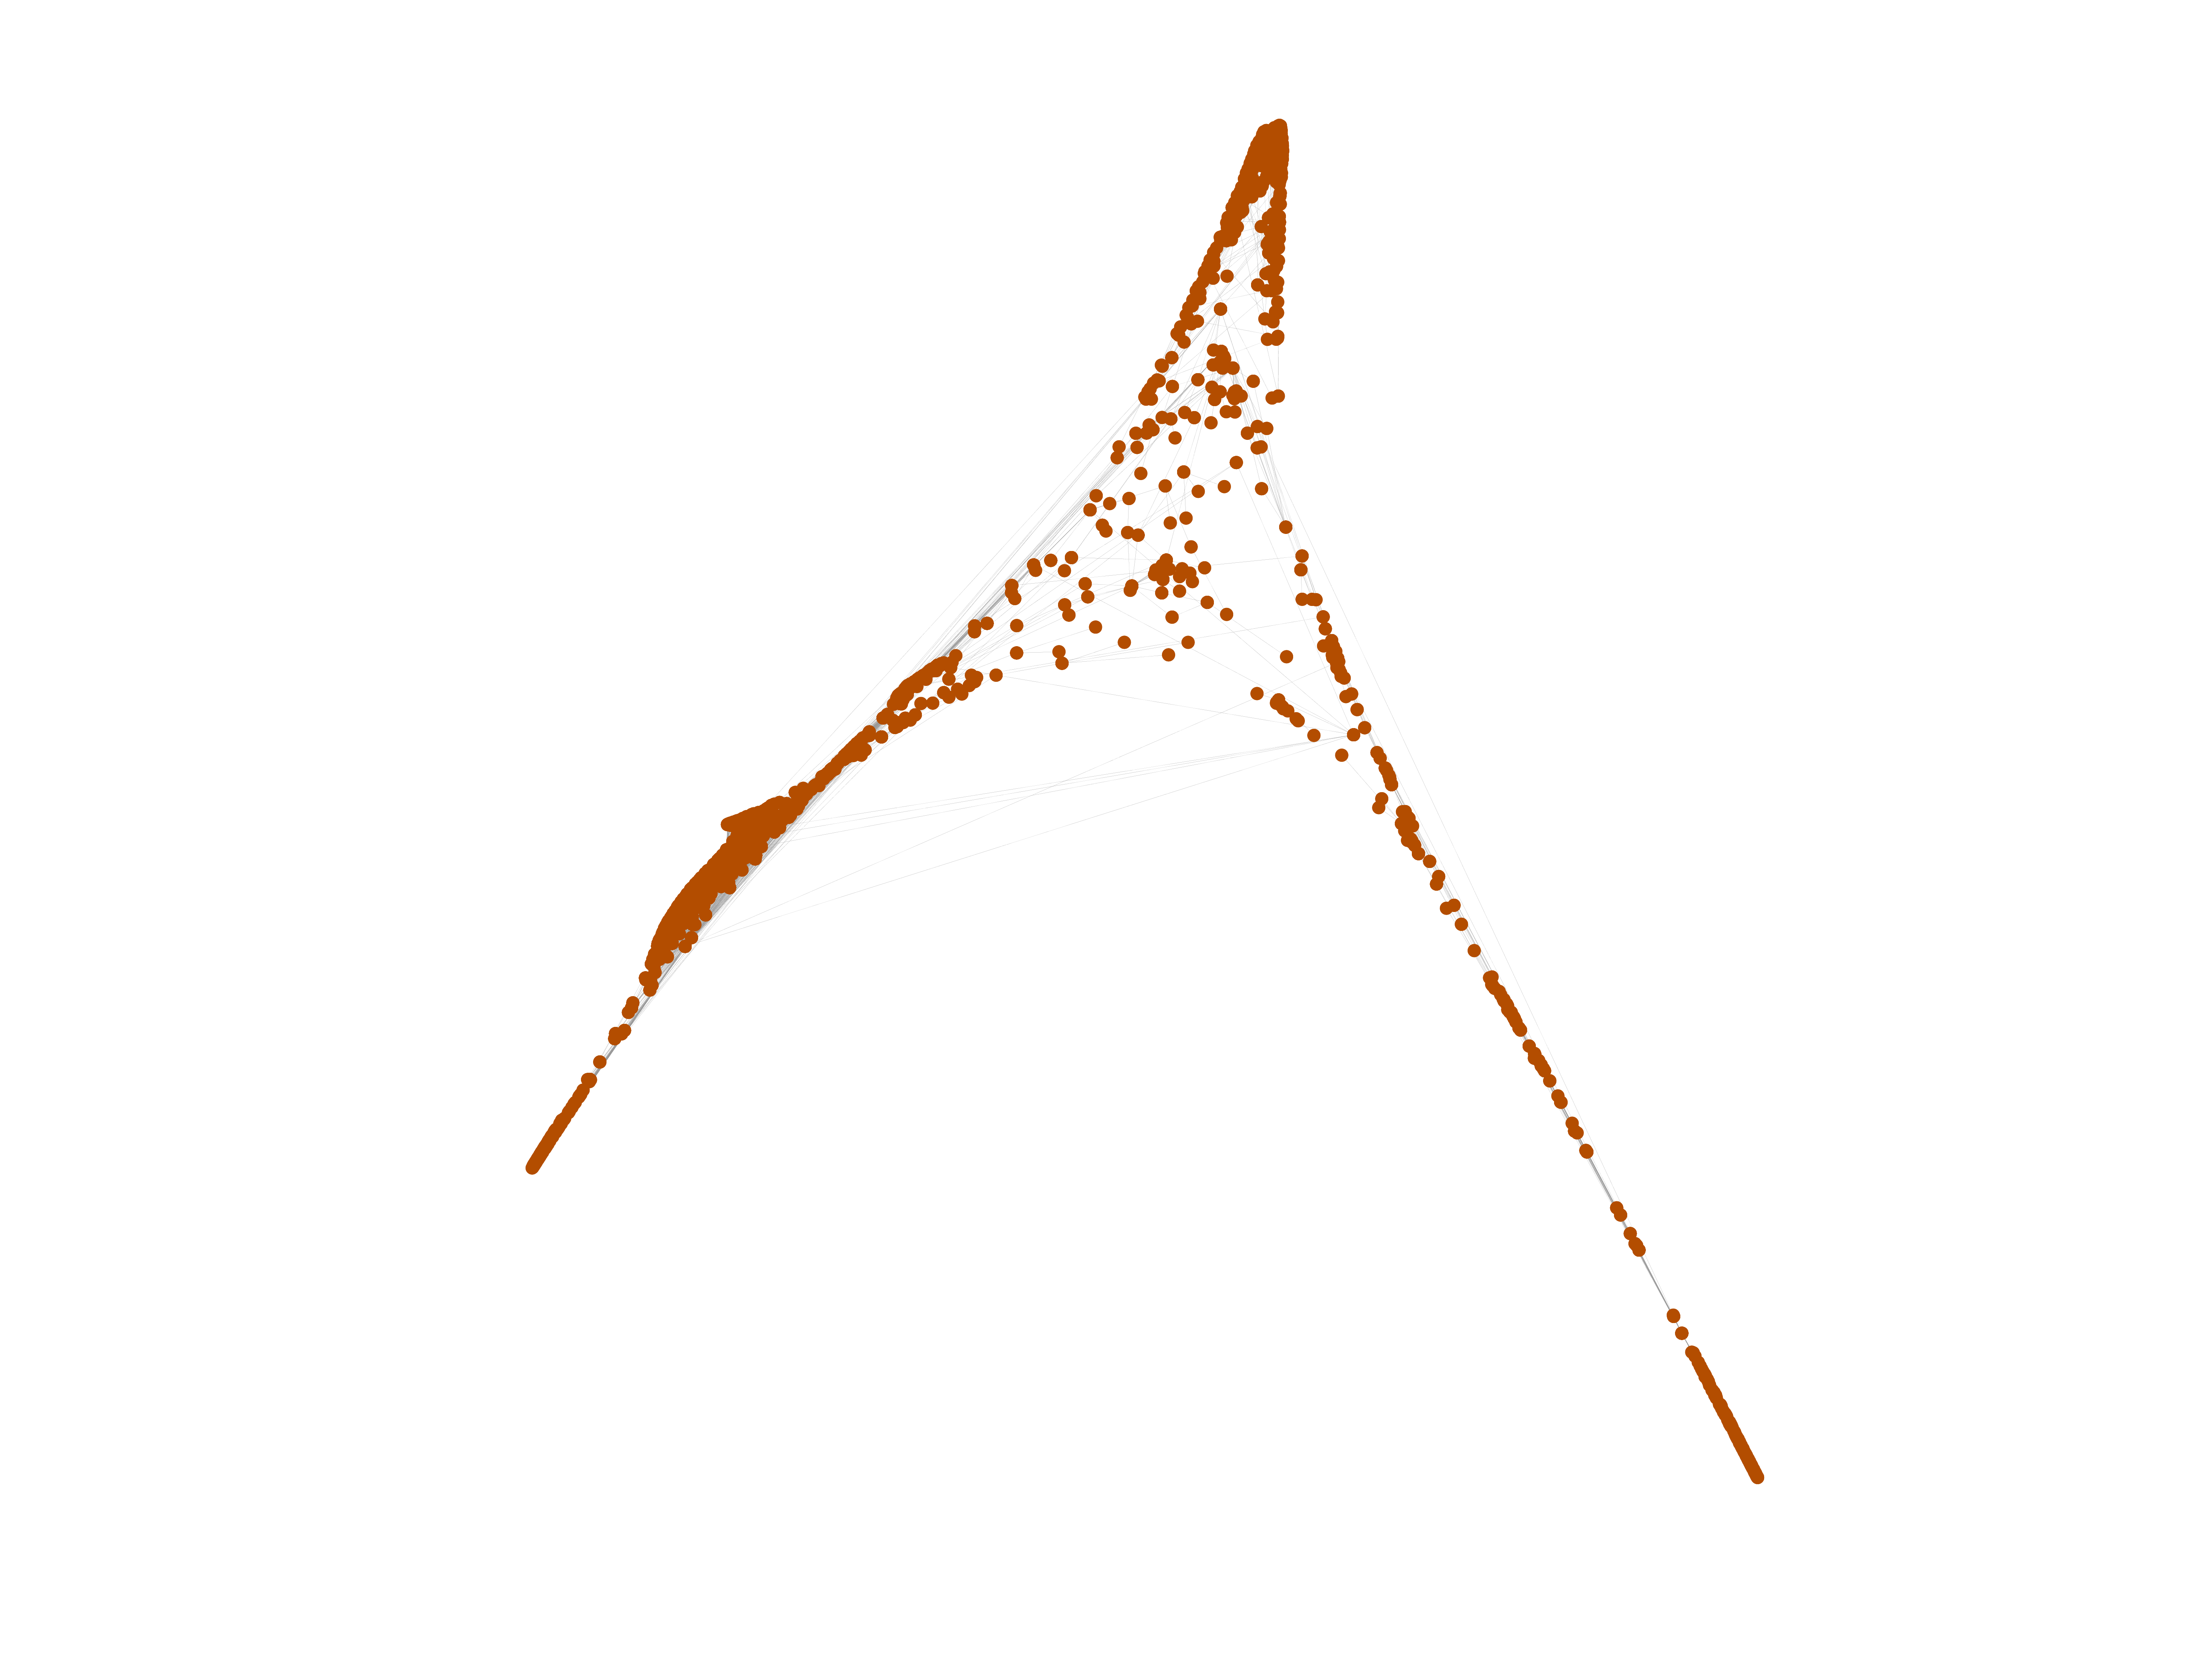
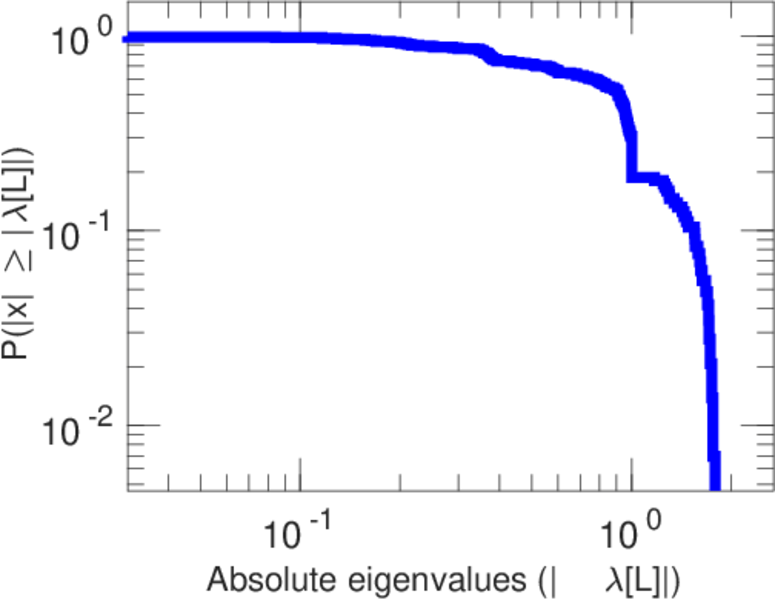
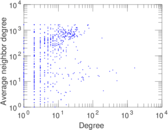
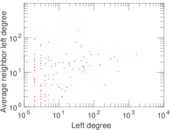
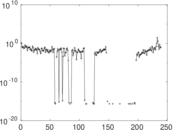
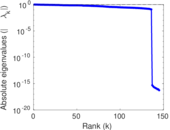
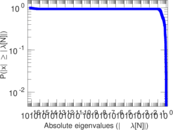
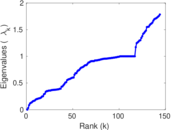
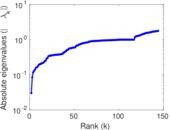
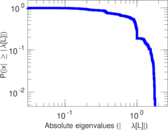
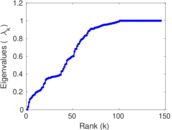
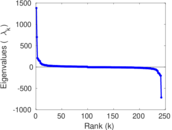
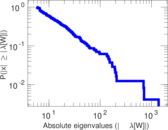
Plots


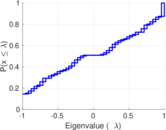
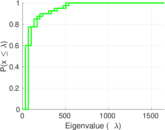


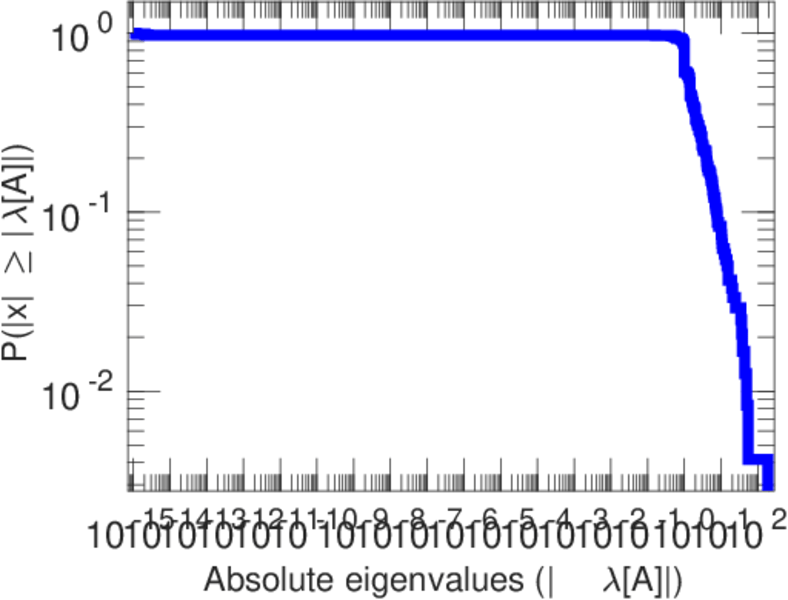
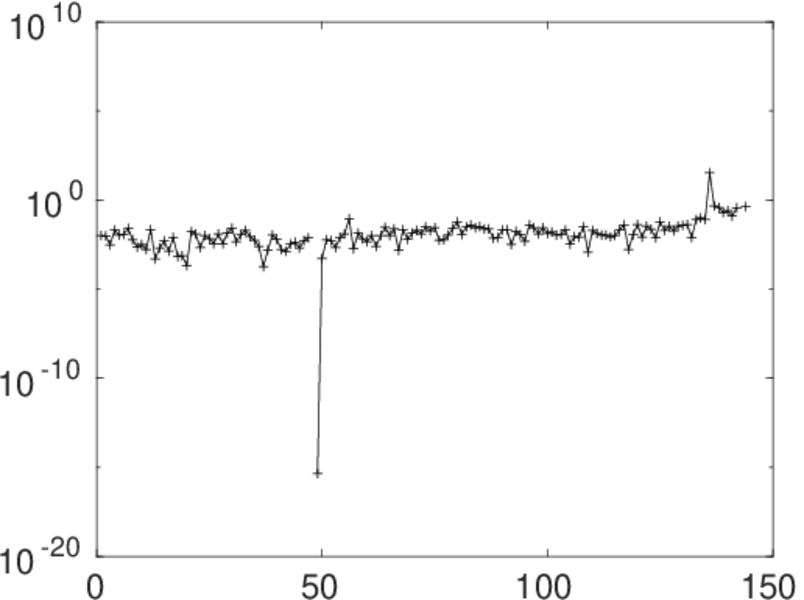
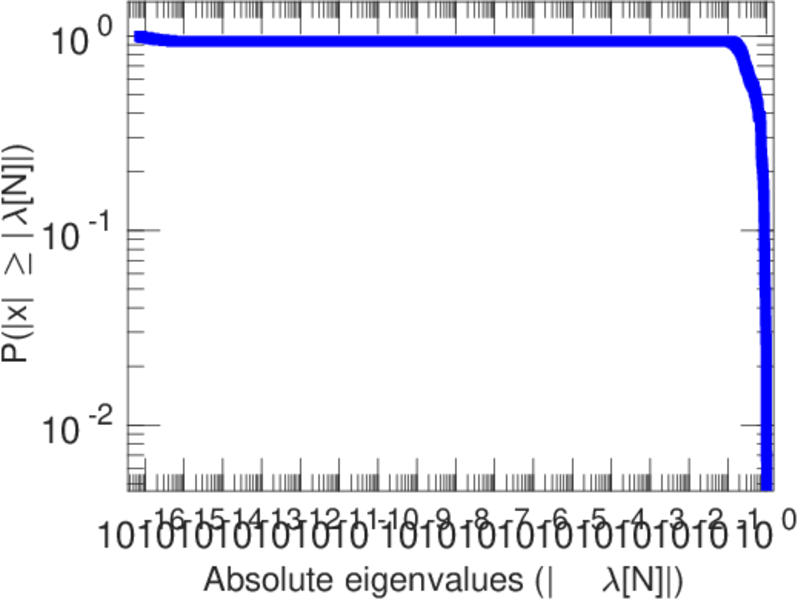
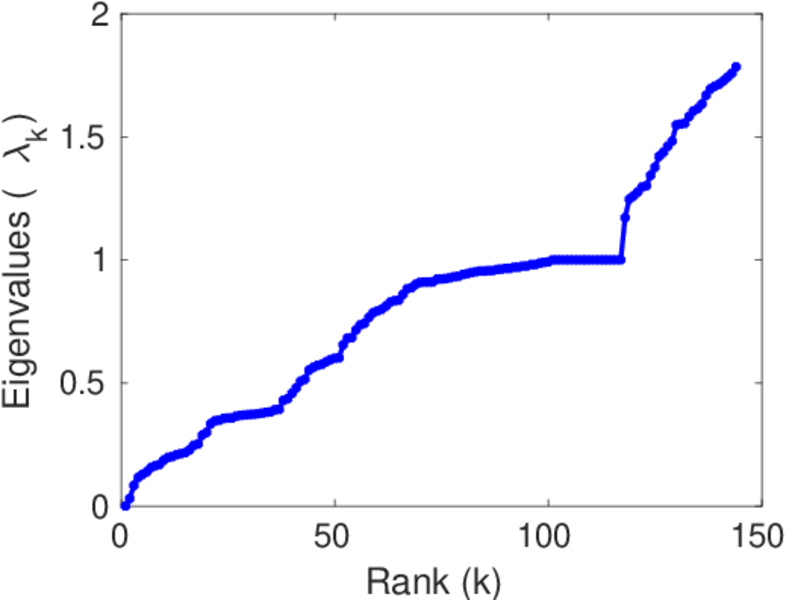
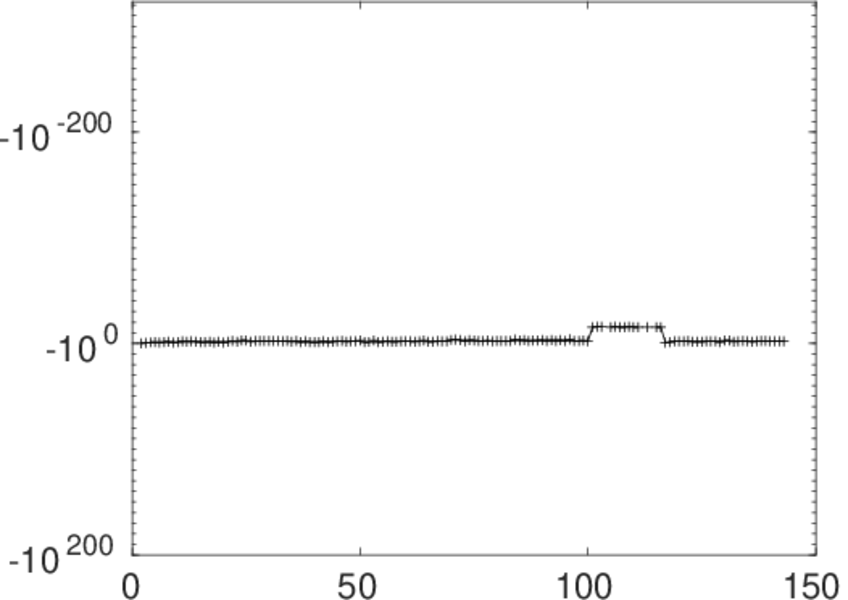
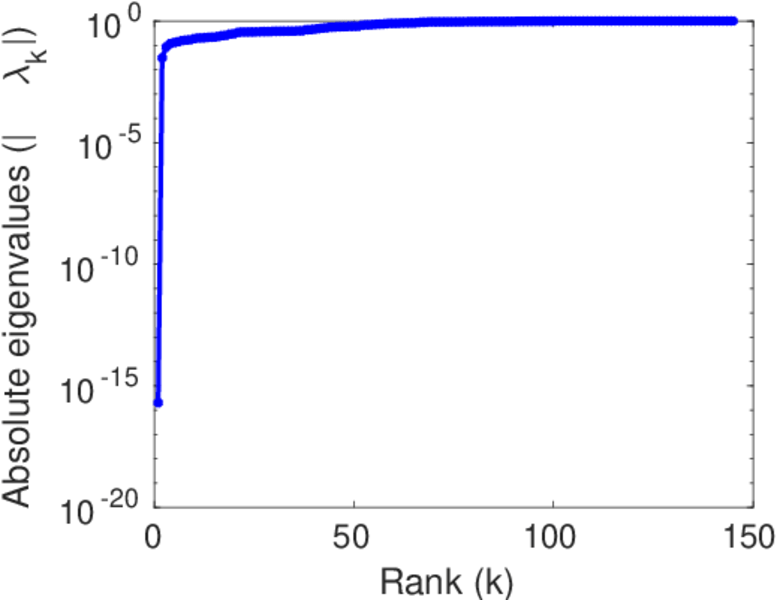
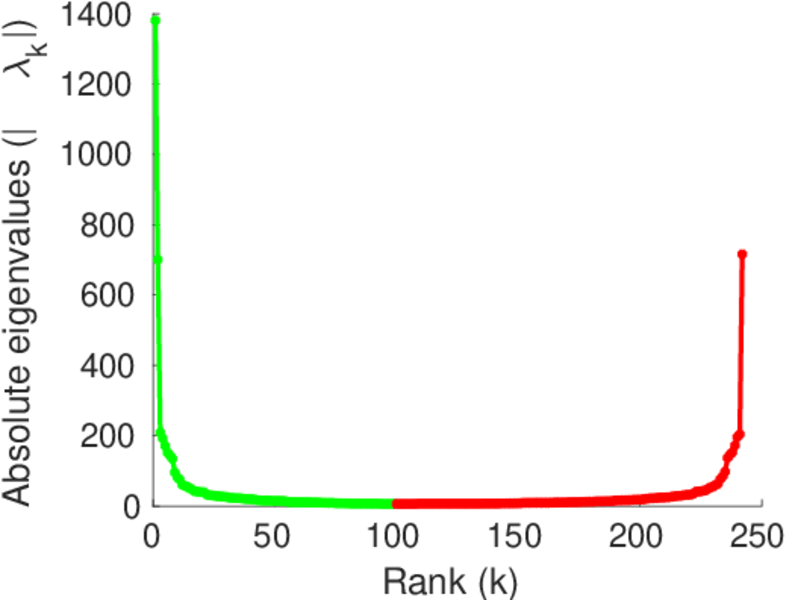
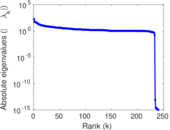
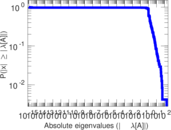
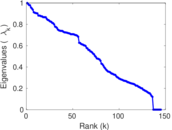
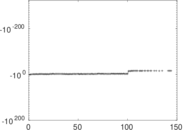
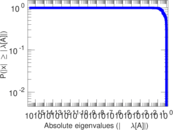
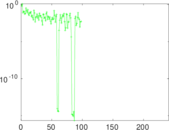
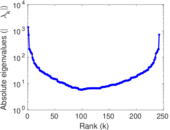
Matrix decompositions plots


Downloads
References
|
[1]
|
Jérôme Kunegis.
KONECT – The Koblenz Network Collection.
In Proc. Int. Conf. on World Wide Web Companion, pages
1343–1350, 2013.
[ http ]
|
|
[2]
|
Wikimedia Foundation.
Wikimedia downloads.
http://dumps.wikimedia.org/, January 2010.
|
 KONECT ‣ Networks ‣
Buy Me a Coffee
KONECT ‣ Networks ‣
Buy Me a Coffee