Wiktionary edits (eu)
This is the bipartite edit network of the Basque Wiktionary. It contains users
and pages from the Basque Wiktionary, connected by edit events. Each edge
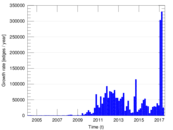
represents an edit. The dataset includes the timestamp of each edit.
Metadata
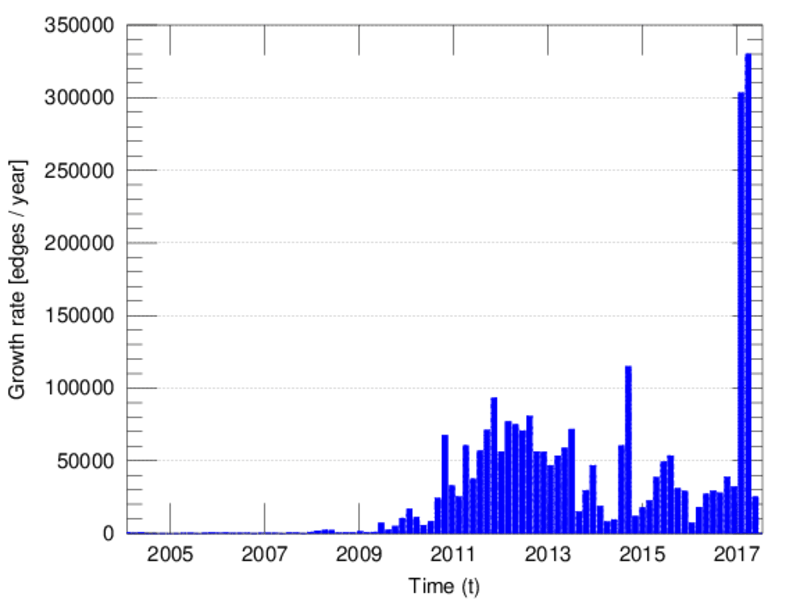
Statistics
| Size | n = | 62,637
|
| Left size | n1 = | 415
|
| Right size | n2 = | 62,222
|
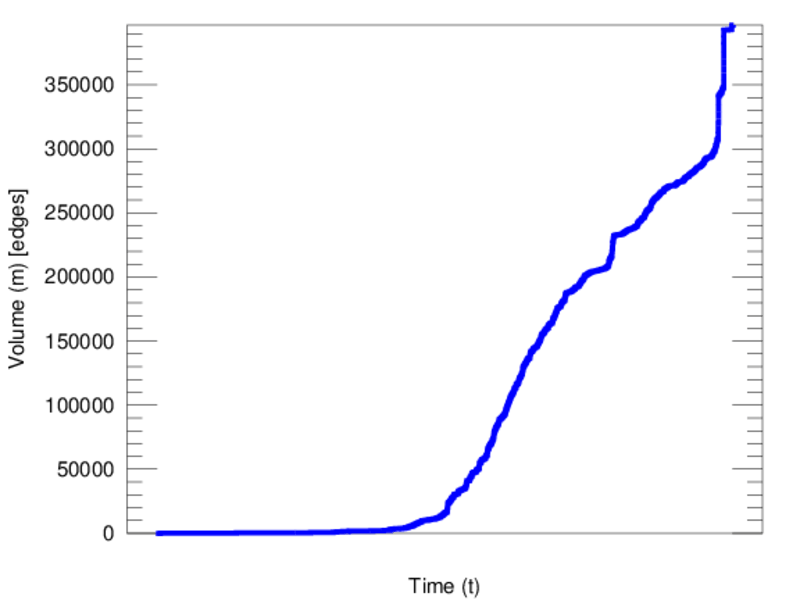
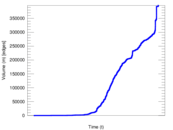
| Volume | m = | 396,614
|
| Unique edge count | m̿ = | 254,652
|
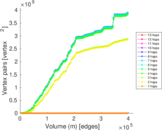
| Wedge count | s = | 3,398,854,234
|
| Claw count | z = | 39,916,326,085,948
|
| Cross count | x = | 394,331,612,010,999,296
|
| Square count | q = | 3,410,109,212
|
| 4-Tour count | T4 = | 40,876,800,420
|
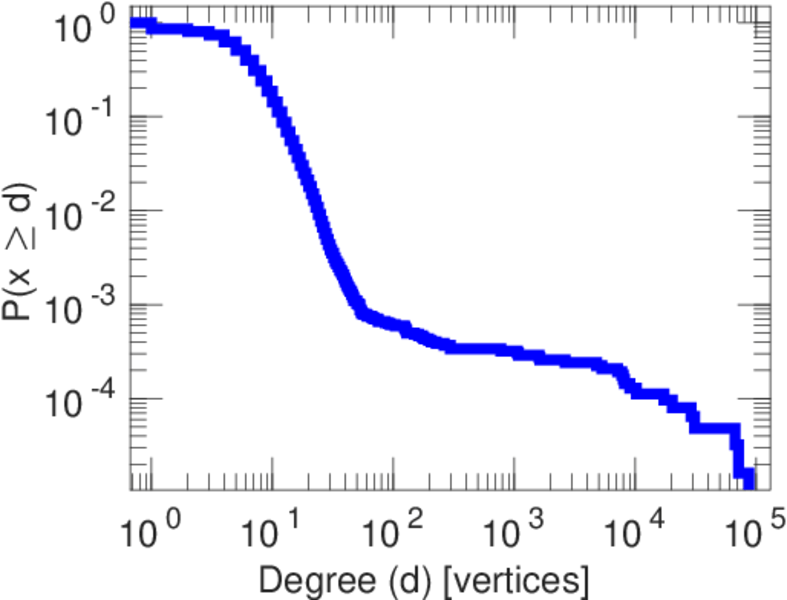
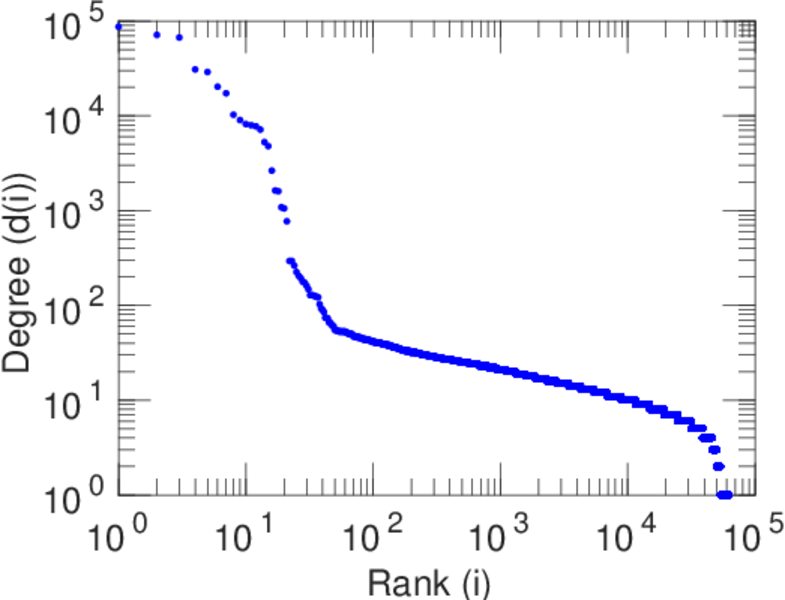
| Maximum degree | dmax = | 86,945
|
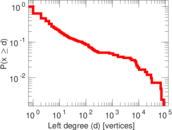
| Maximum left degree | d1max = | 86,945
|
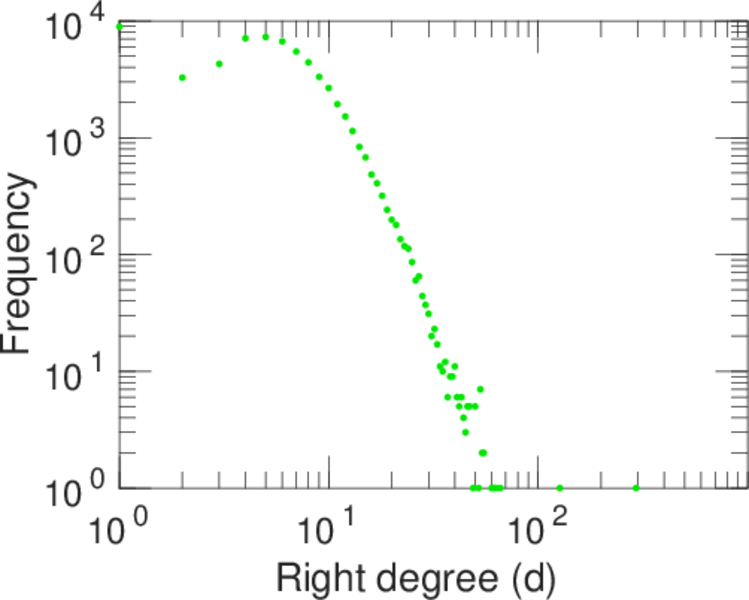
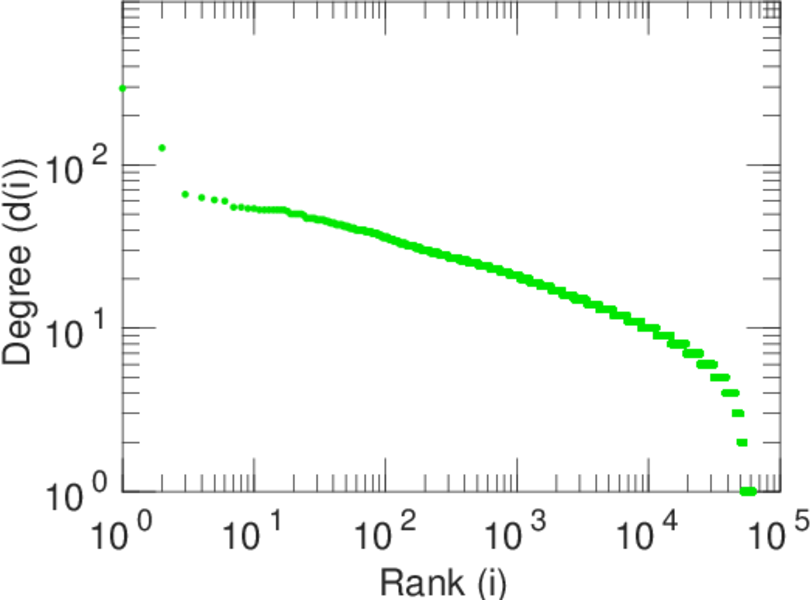
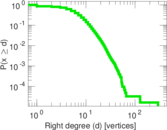
| Maximum right degree | d2max = | 294
|
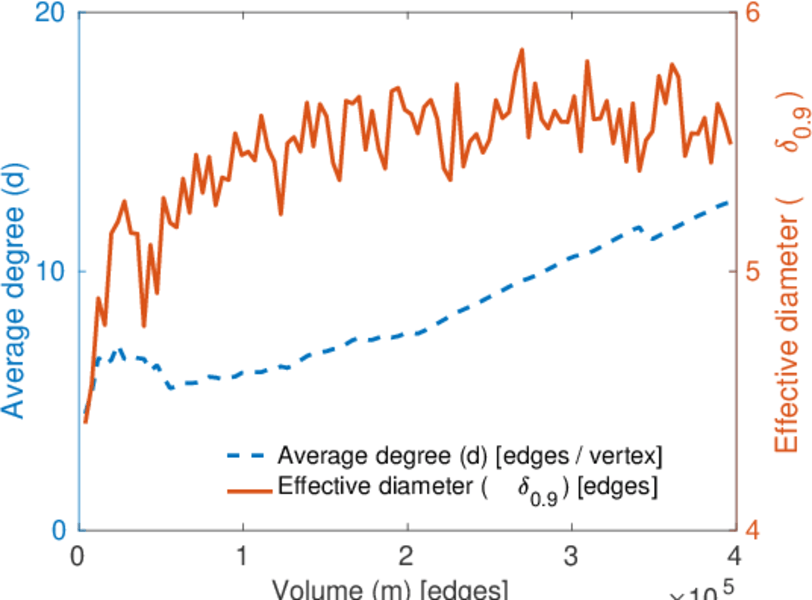
| Average degree | d = | 12.663 9
|
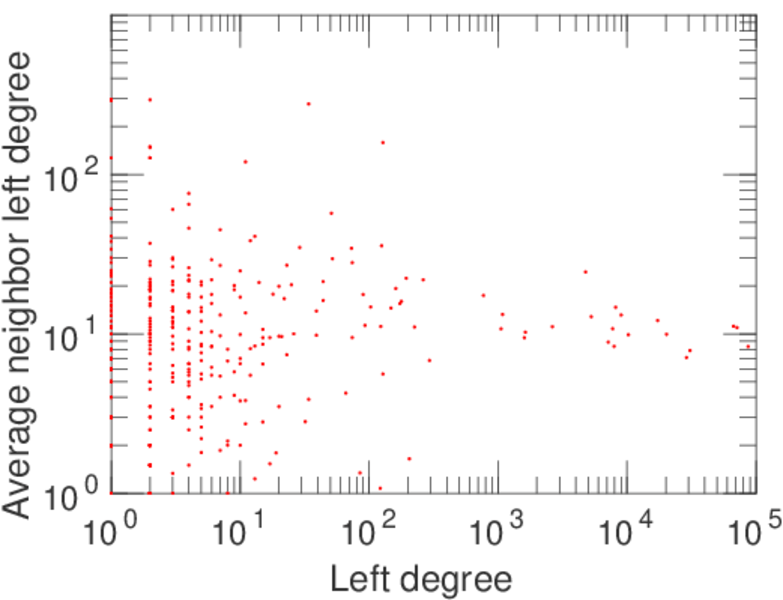
| Average left degree | d1 = | 955.696
|
| Average right degree | d2 = | 6.374 18
|
| Fill | p = | 0.009 861 77
|
| Average edge multiplicity | m̃ = | 1.557 47
|
| Size of LCC | N = | 62,409
|
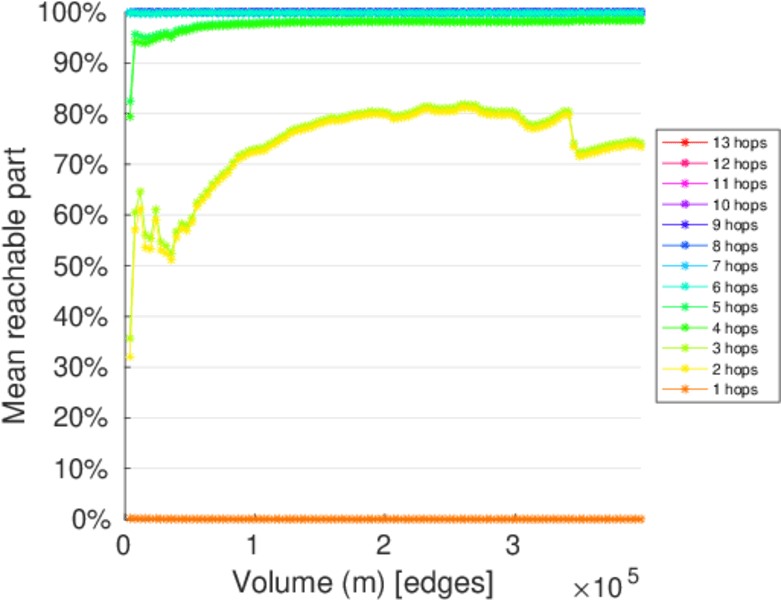
| Diameter | δ = | 12
|
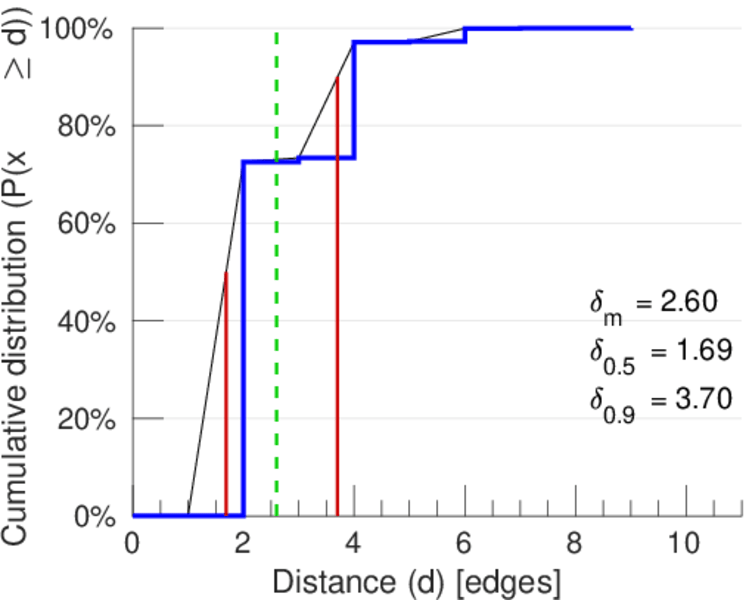
| 50-Percentile effective diameter | δ0.5 = | 1.688 94
|
| 90-Percentile effective diameter | δ0.9 = | 3.701 57
|
| Median distance | δM = | 2
|
| Mean distance | δm = | 2.599 22
|
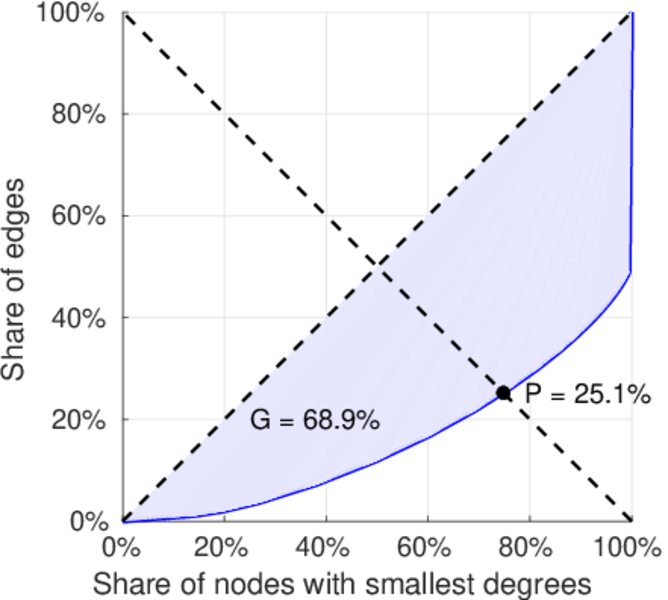
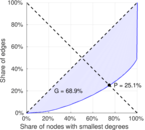
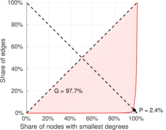
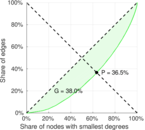
| Gini coefficient | G = | 0.687 469
|
| Balanced inequality ratio | P = | 0.251 331
|
| Left balanced inequality ratio | P1 = | 0.023 614 9
|
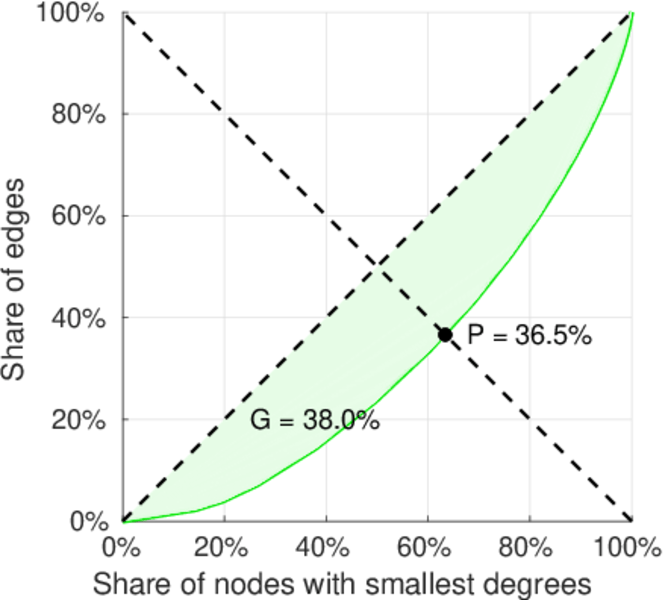
| Right balanced inequality ratio | P2 = | 0.364 828
|
| Relative edge distribution entropy | Her = | 0.673 132
|
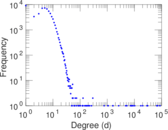
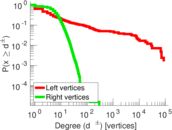
| Power law exponent | γ = | 1.811 42
|
| Tail power law exponent | γt = | 5.381 00
|
| Tail power law exponent with p | γ3 = | 5.381 00
|
| p-value | p = | 0.000 00
|
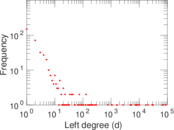
| Left tail power law exponent with p | γ3,1 = | 1.551 00
|
| Left p-value | p1 = | 0.000 00
|
| Right tail power law exponent with p | γ3,2 = | 8.791 00
|
| Right p-value | p2 = | 0.132 000
|
| Degree assortativity | ρ = | −0.159 047
|
| Degree assortativity p-value | pρ = | 0.000 00
|
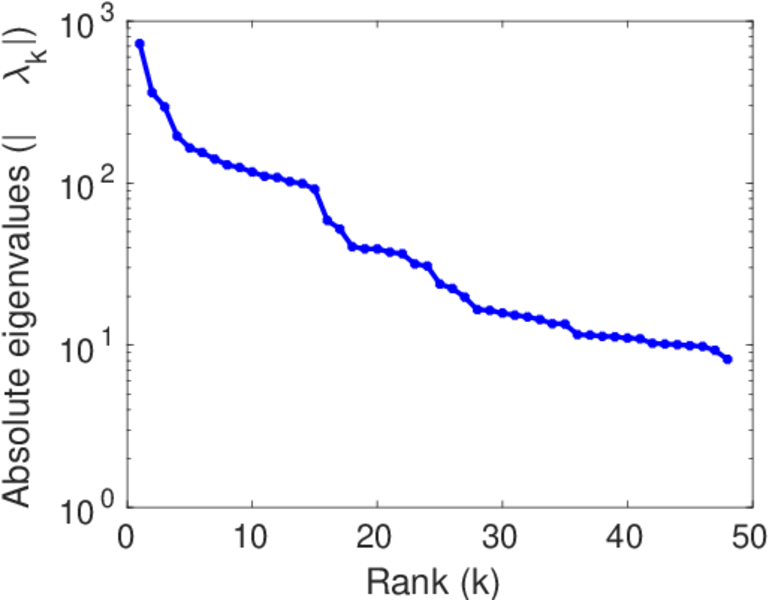
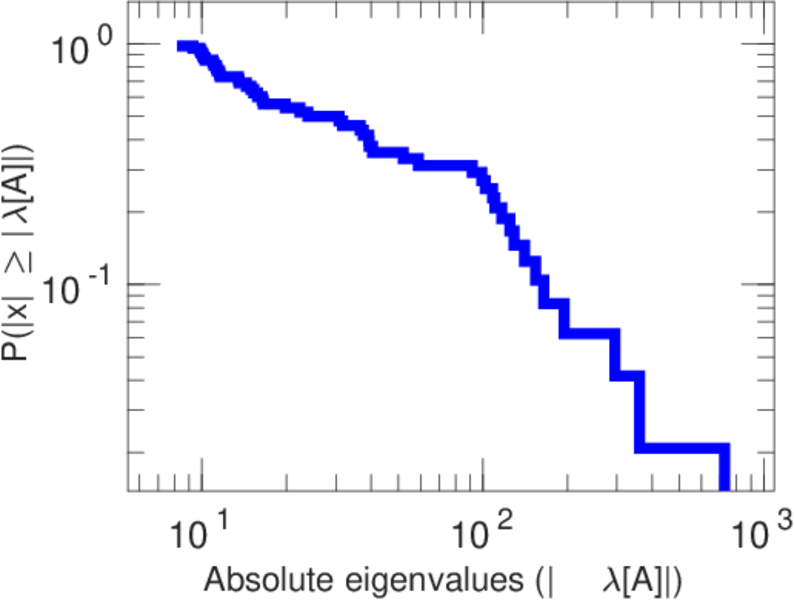
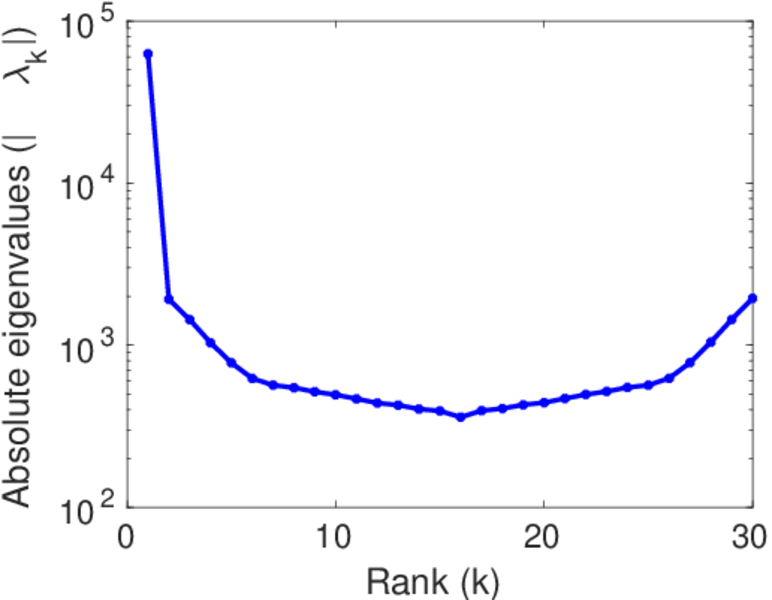
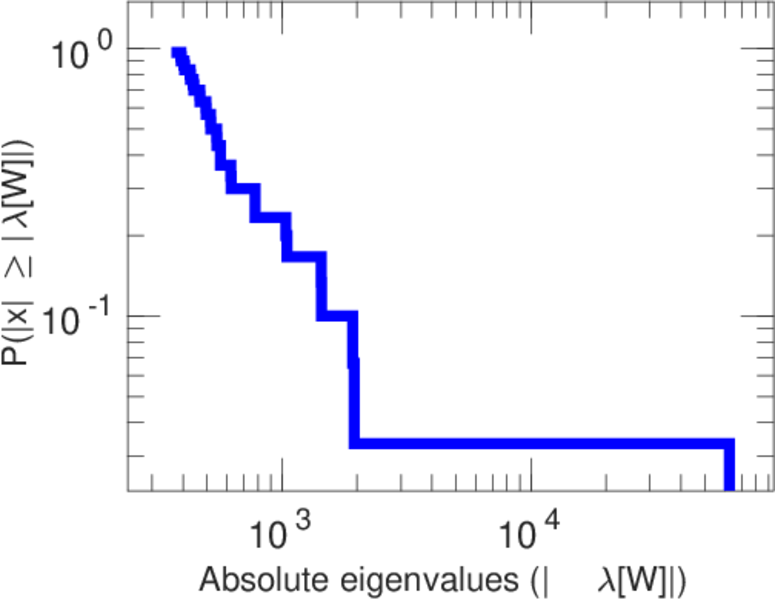
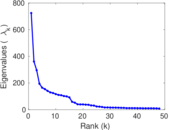
| Spectral norm | α = | 724.329
|
| Algebraic connectivity | a = | 0.020 668 8
|
| Spectral separation | |λ1[A] / λ2[A]| = | 2.006 93
|
| Controllability | C = | 61,805
|
| Relative controllability | Cr = | 0.987 158
|
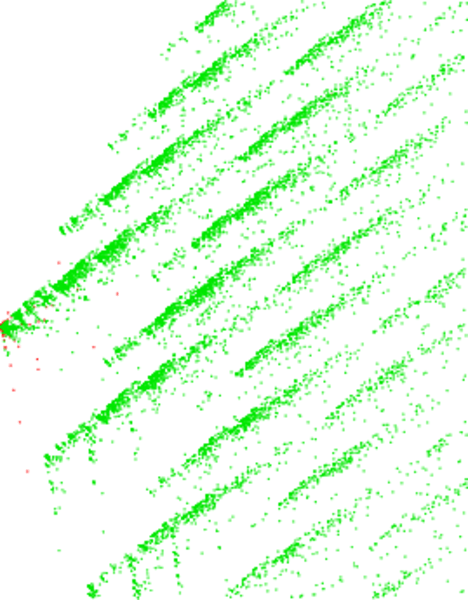
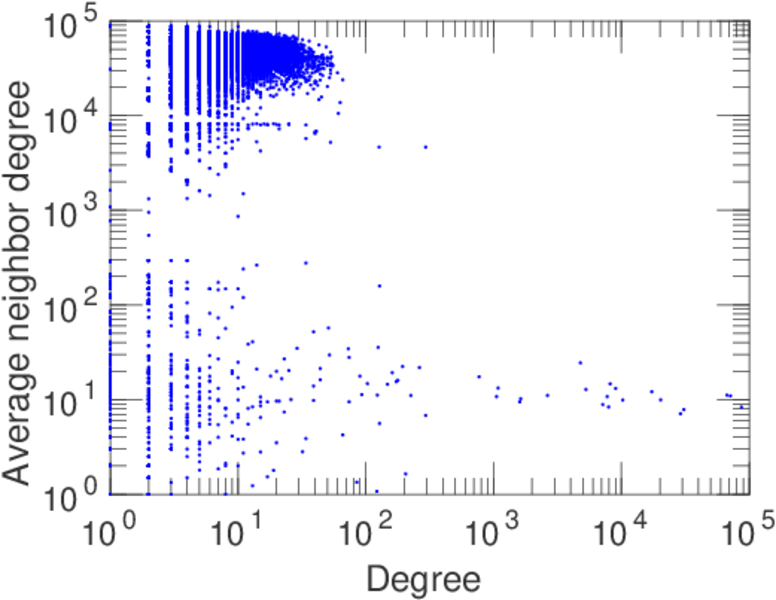
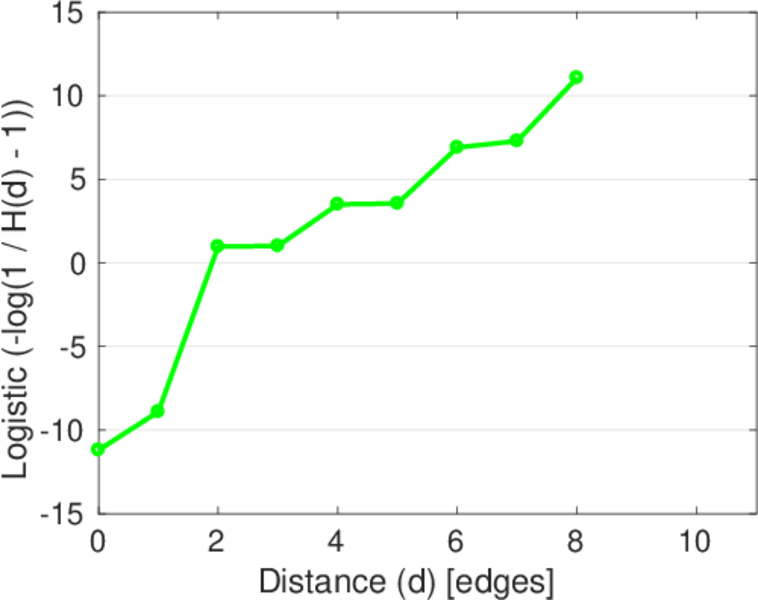
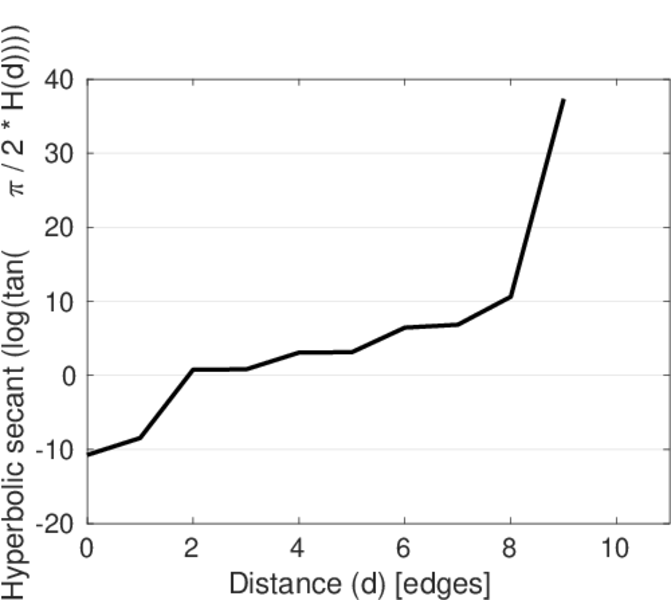
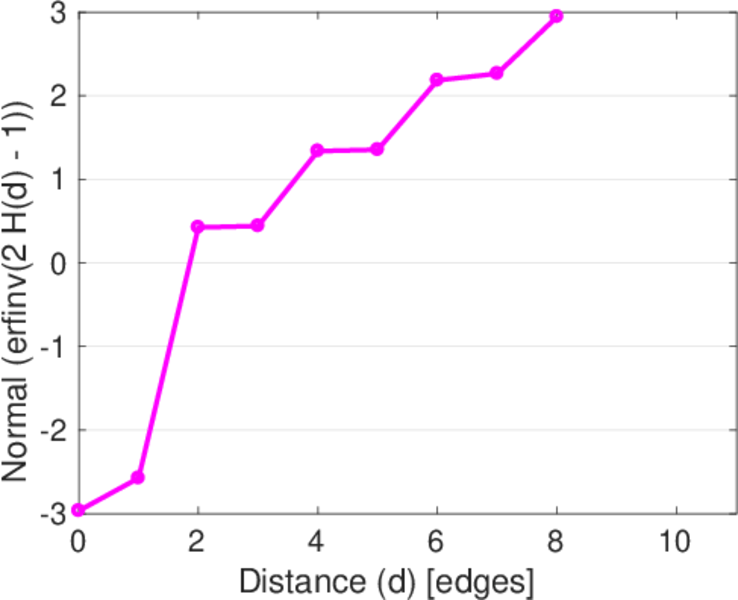
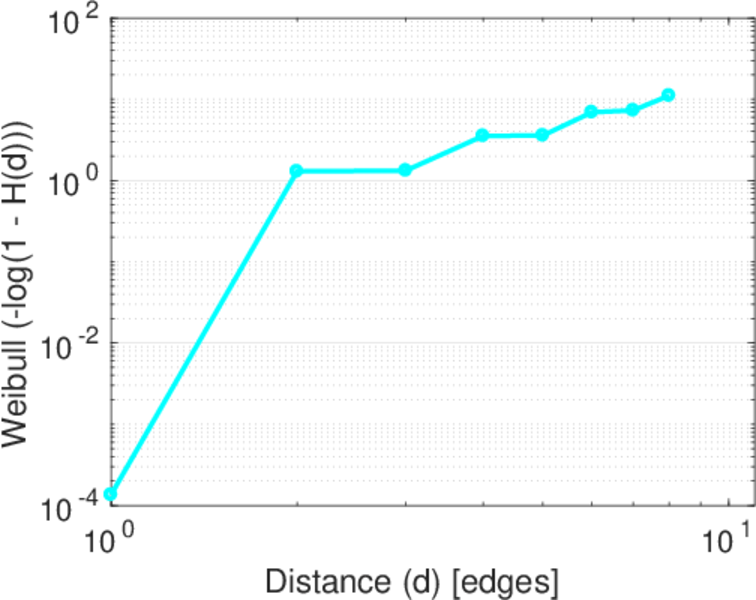
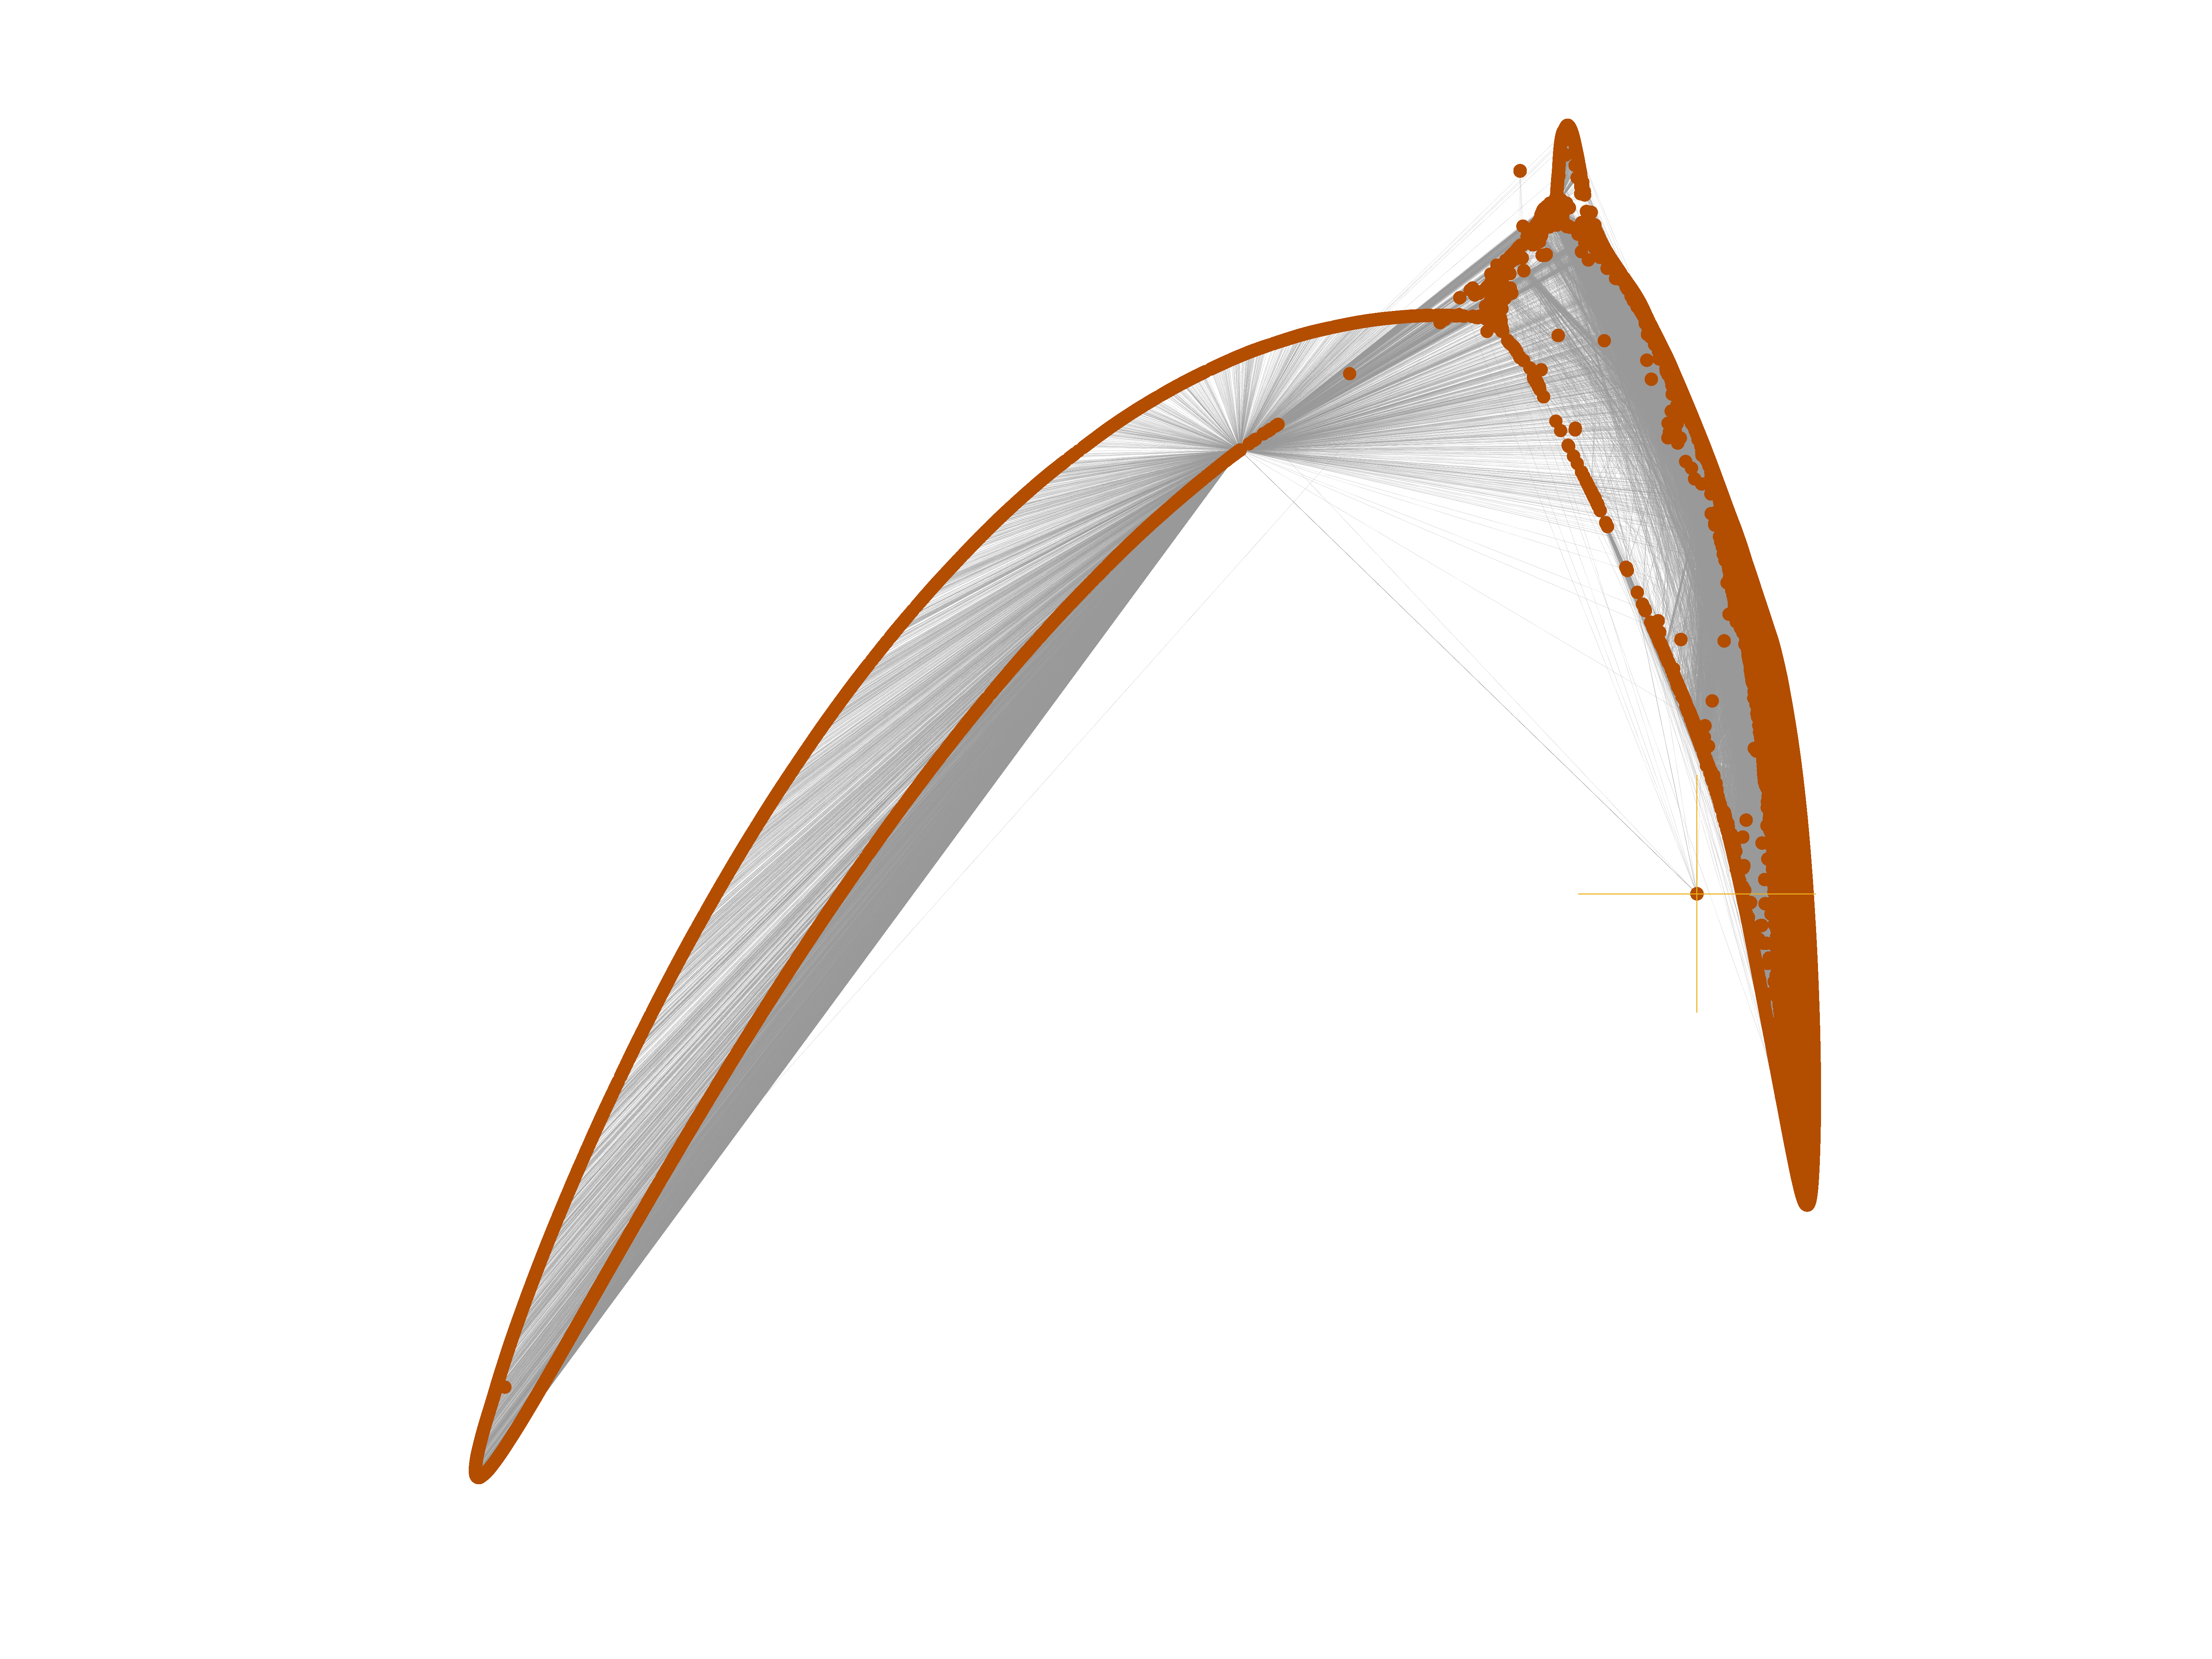
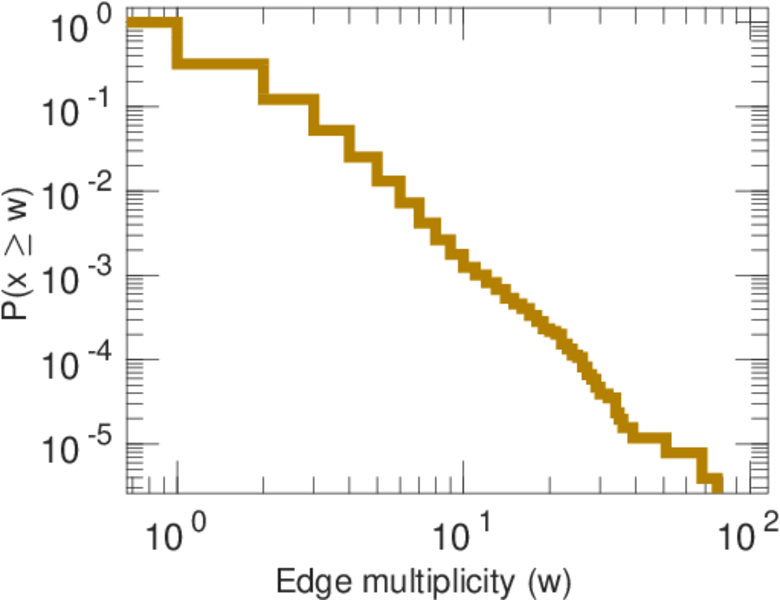
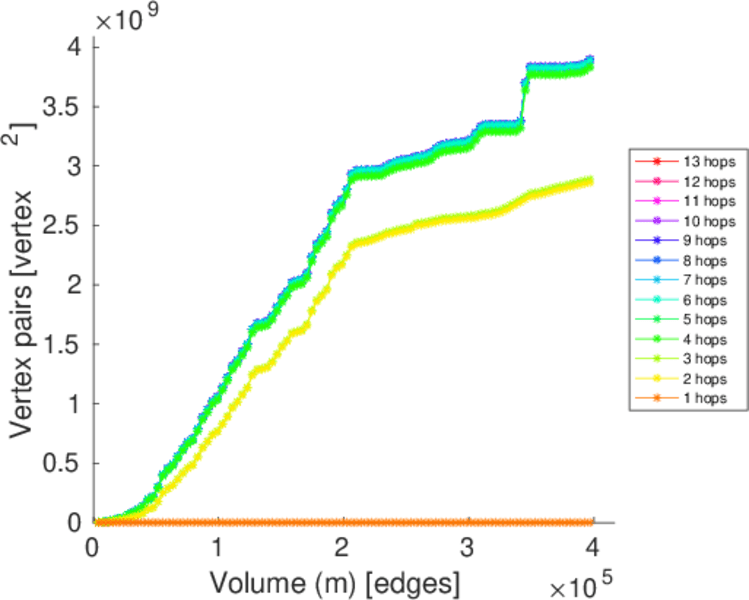
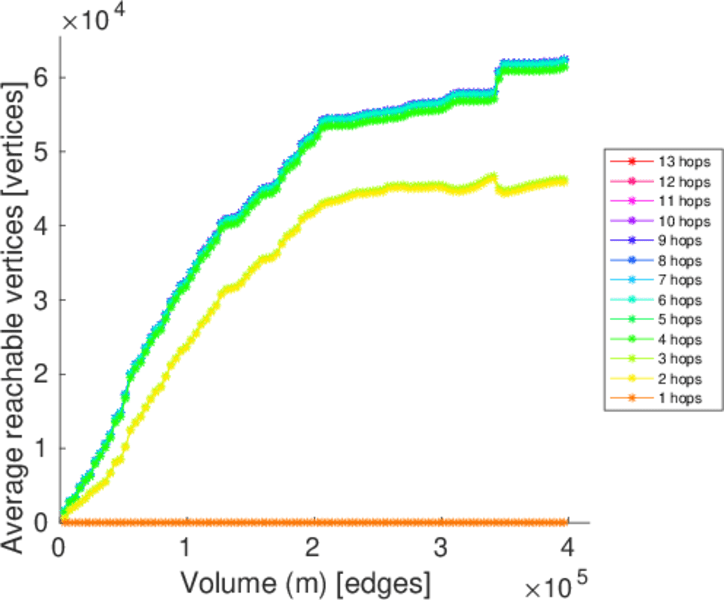
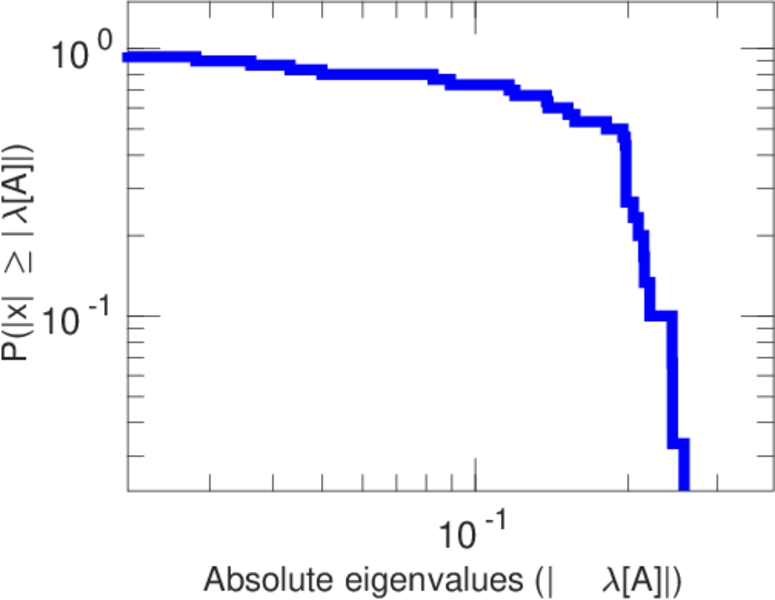
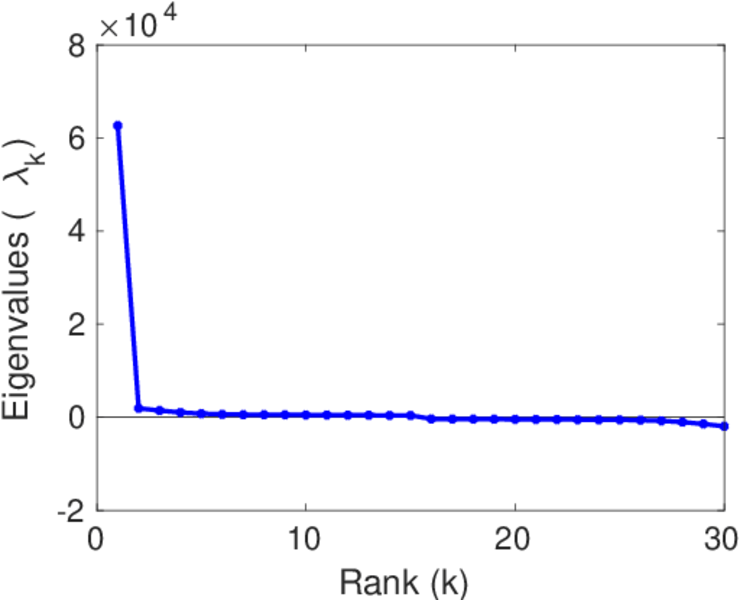
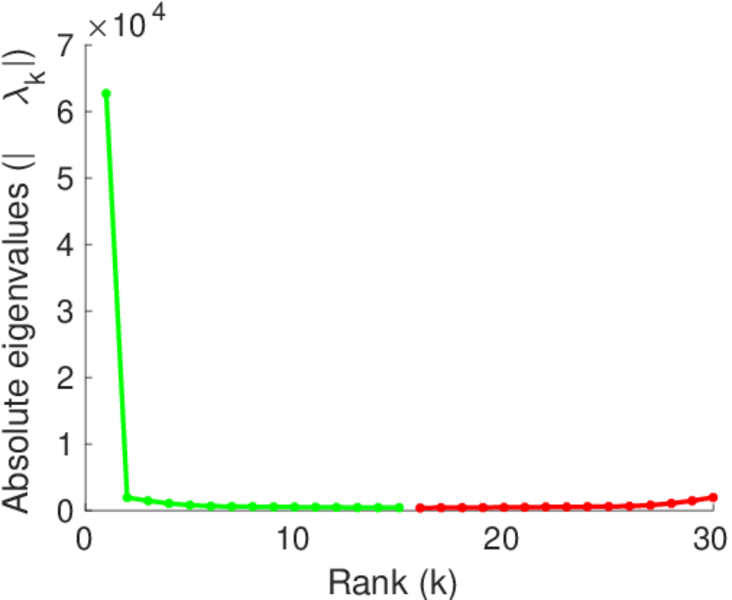
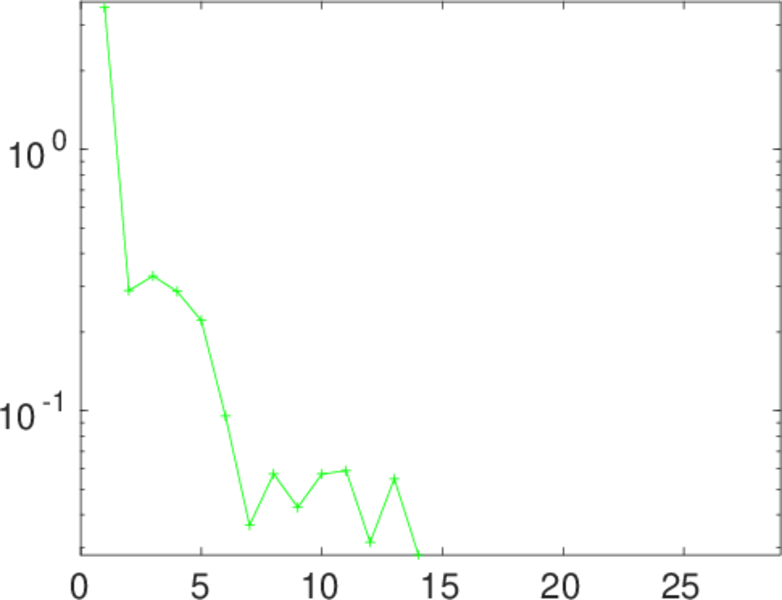
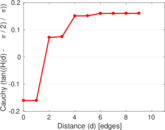
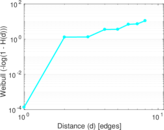
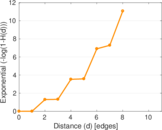
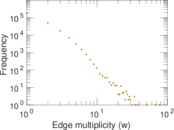
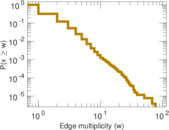
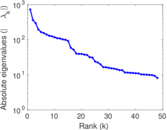
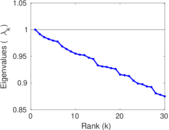
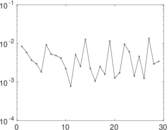
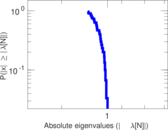
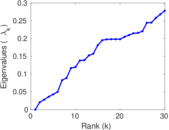
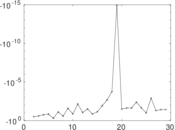
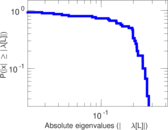
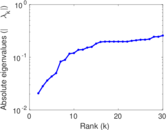
Plots


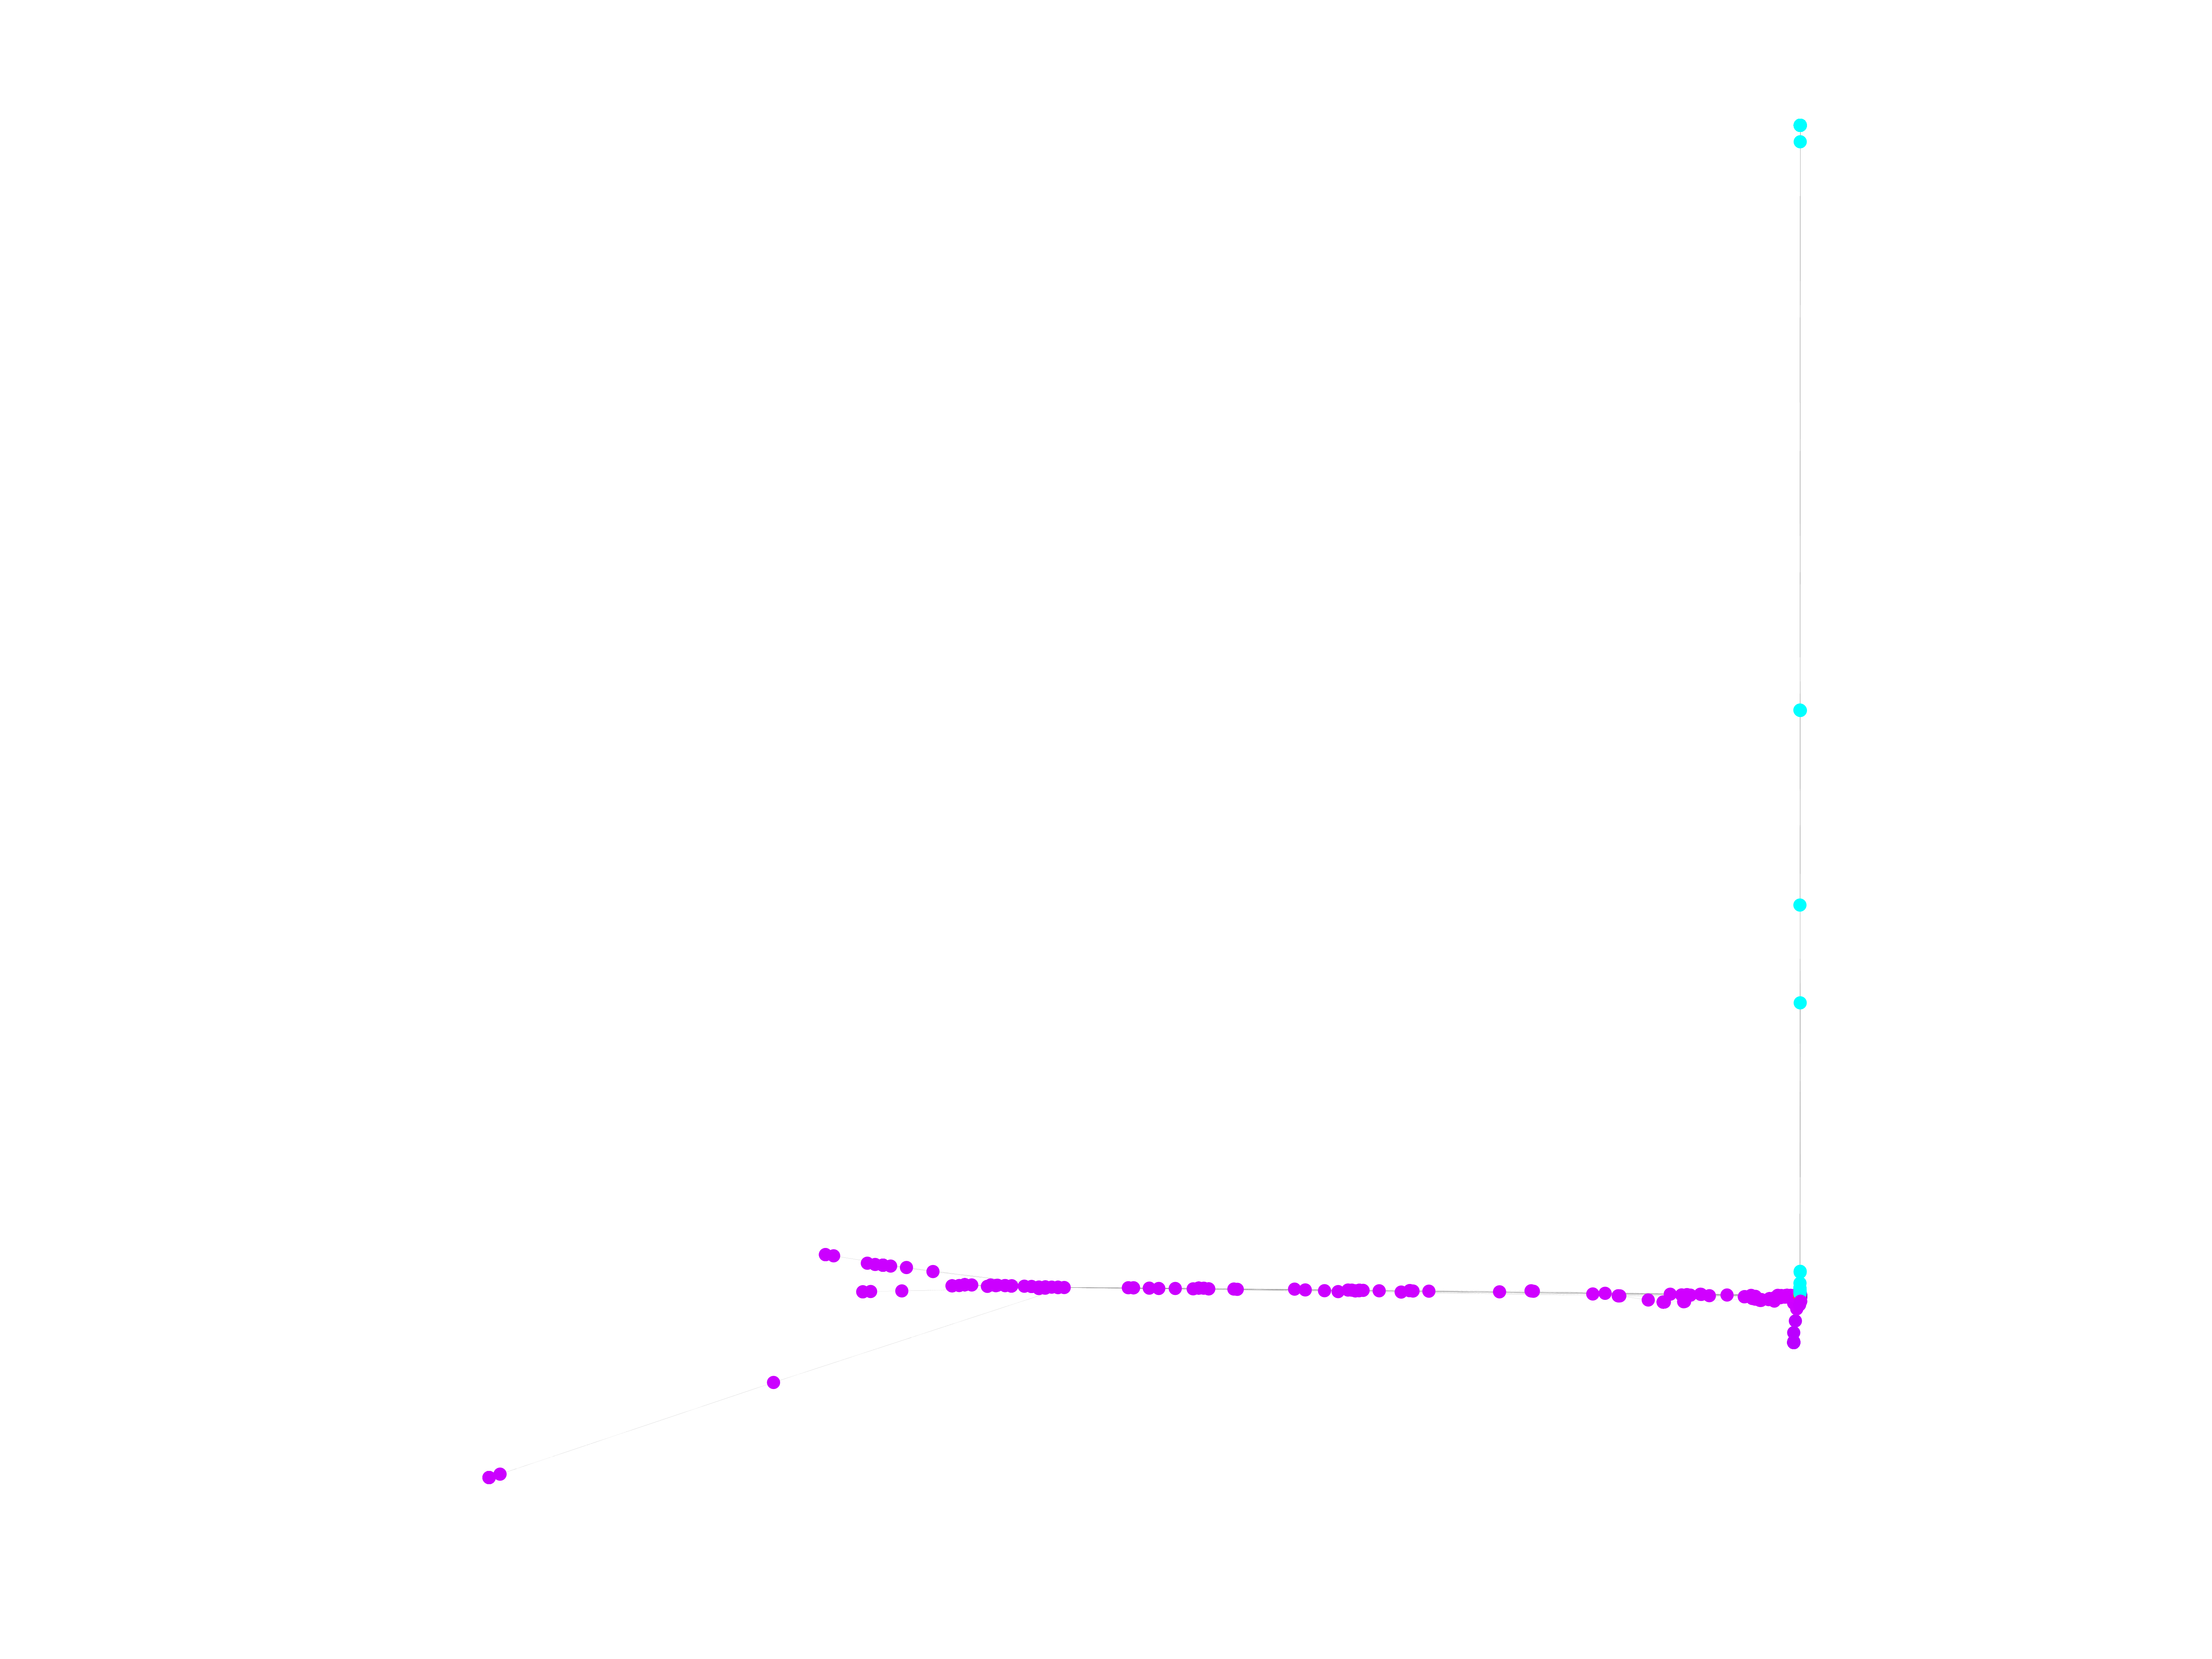
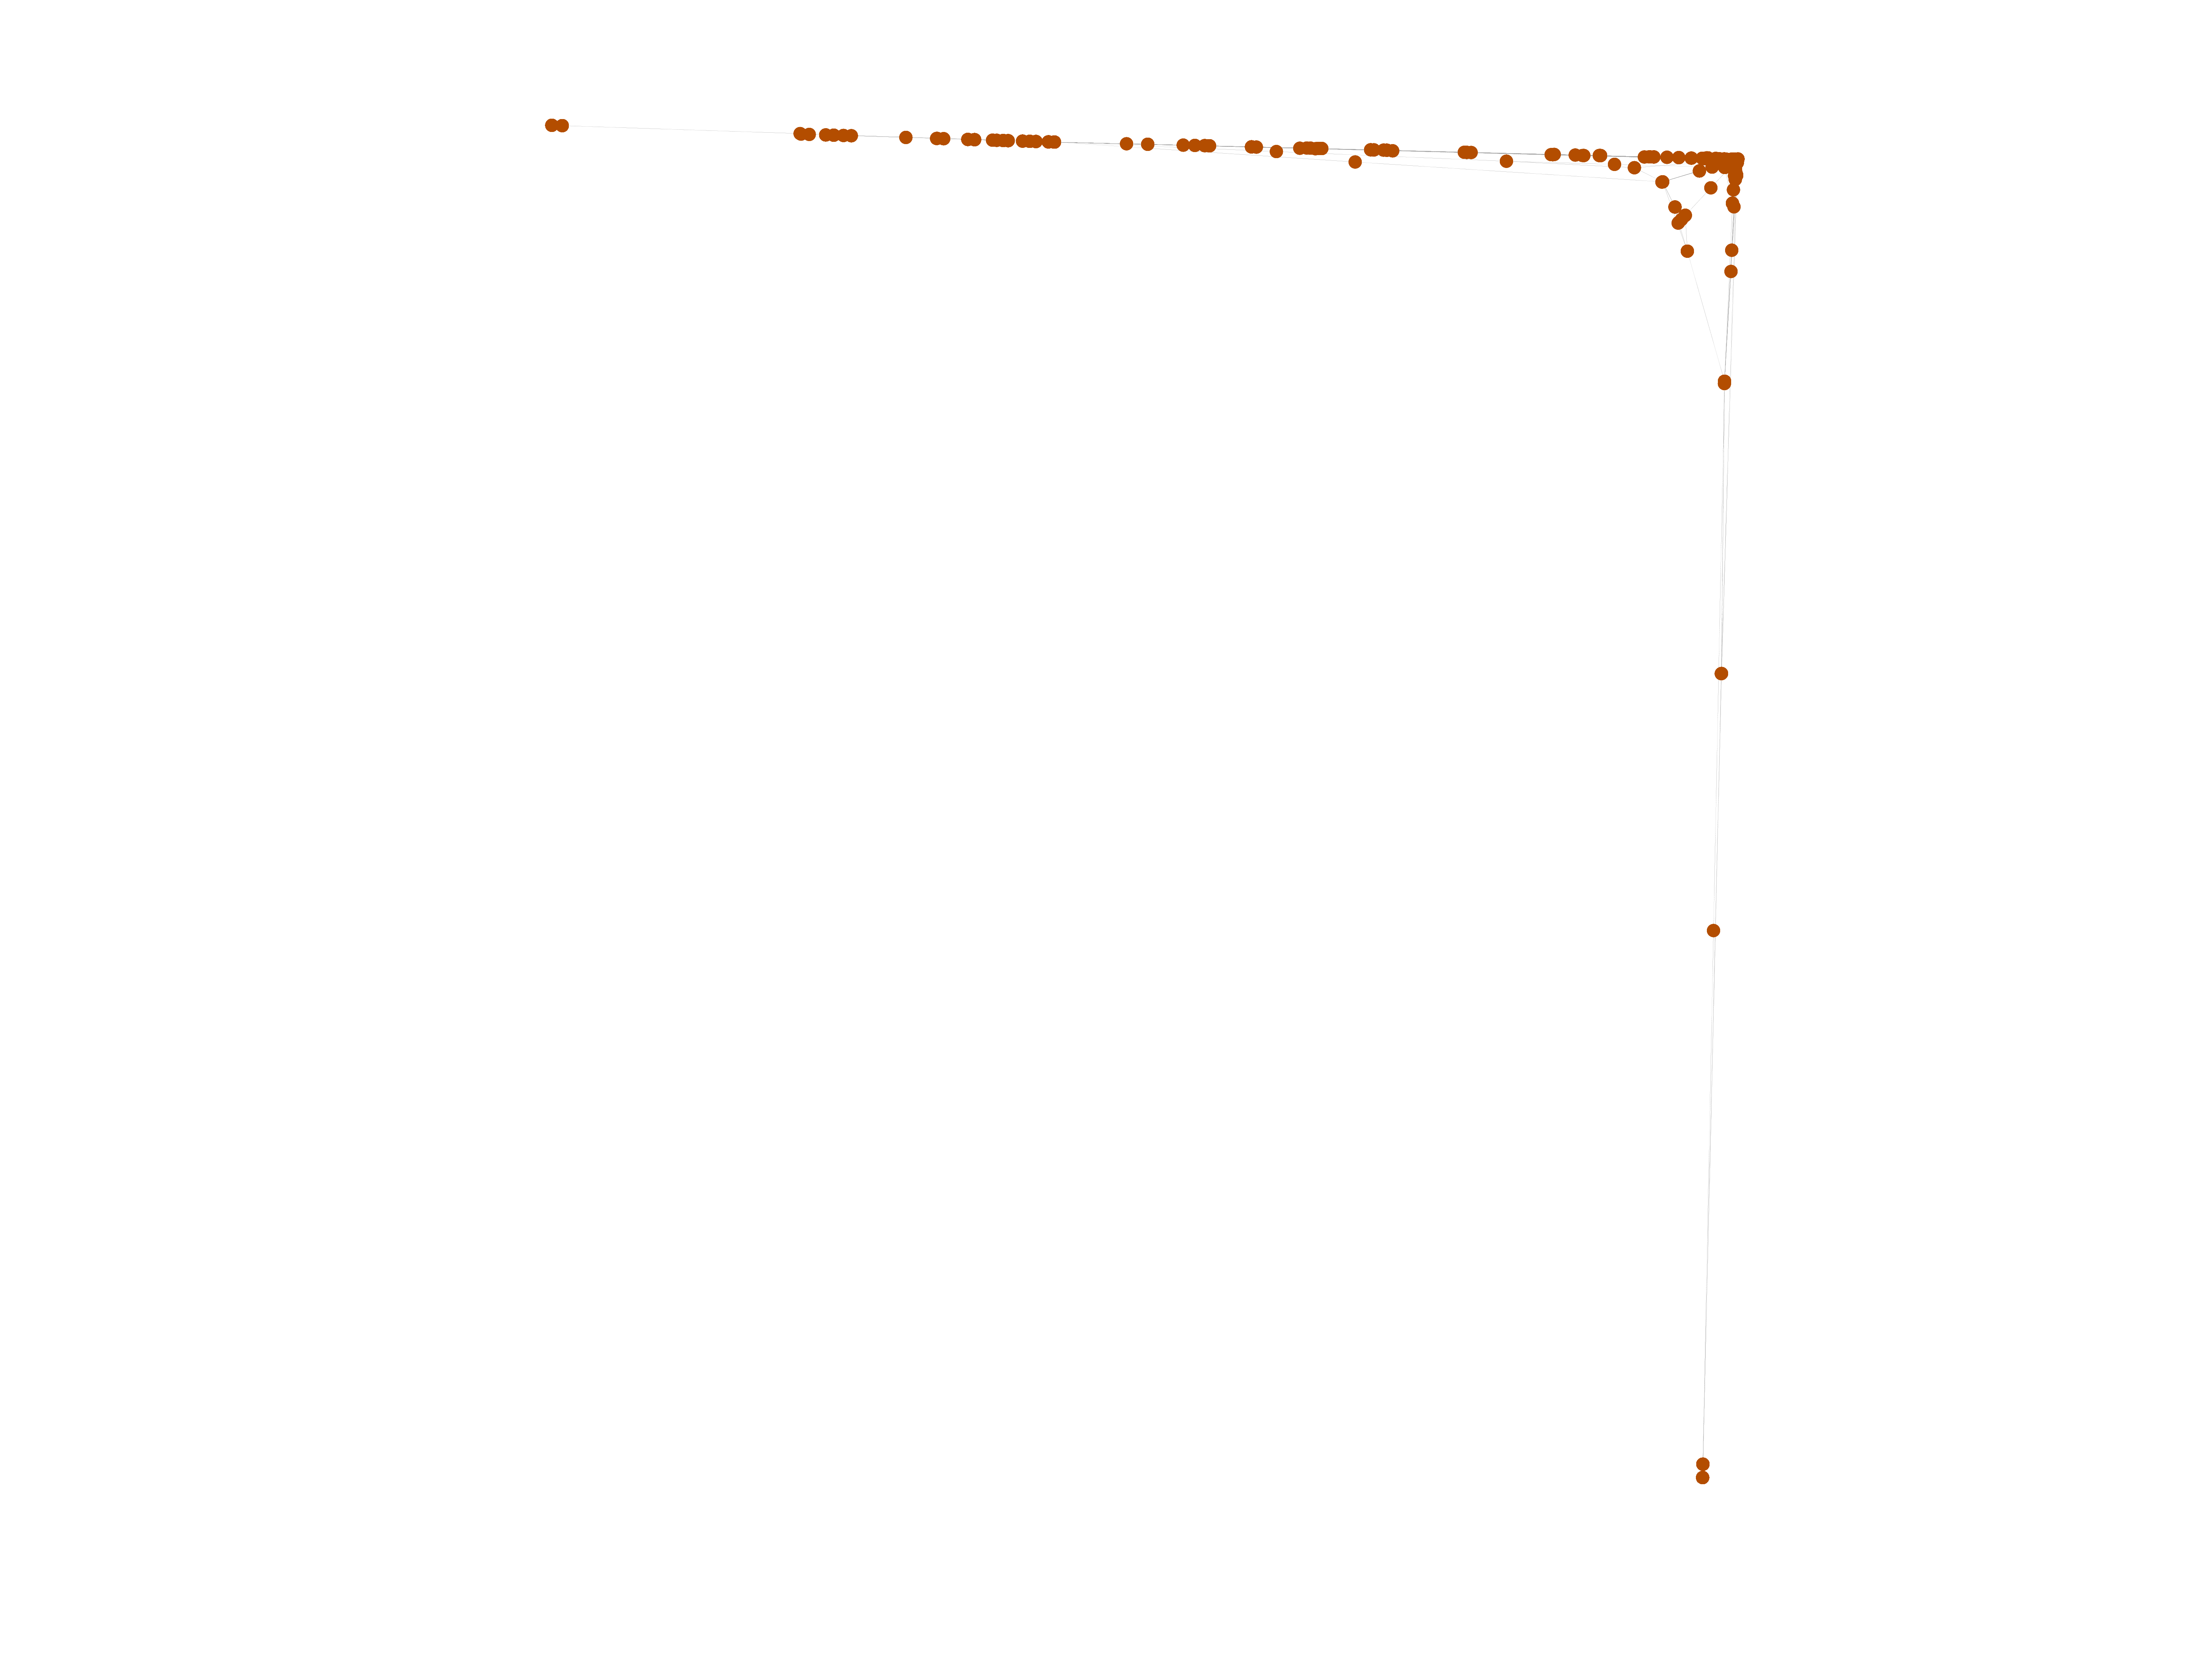
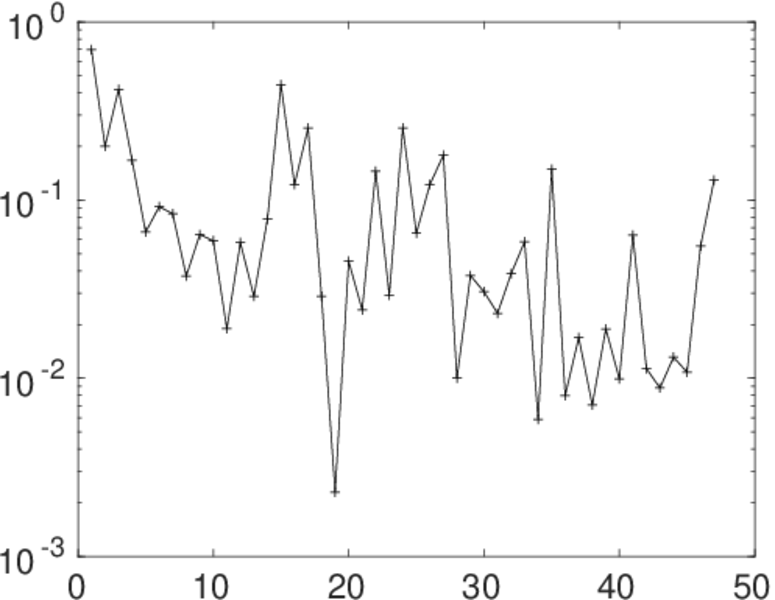
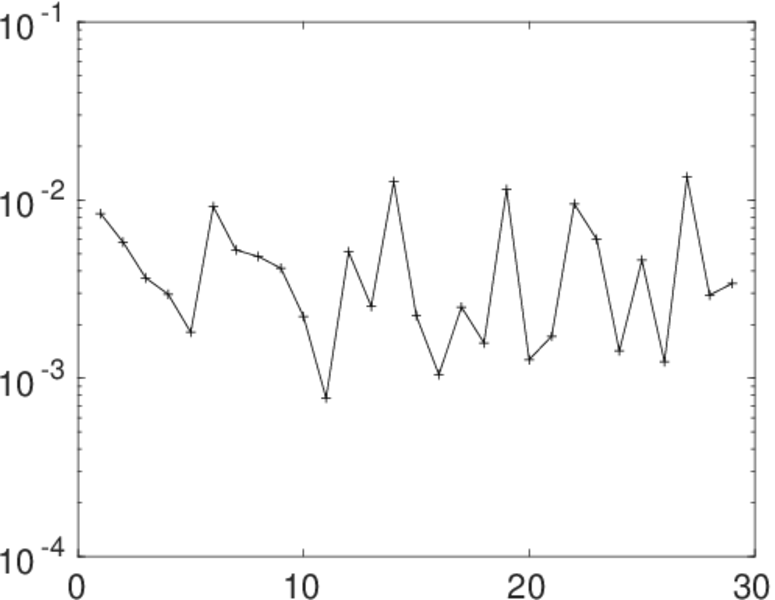
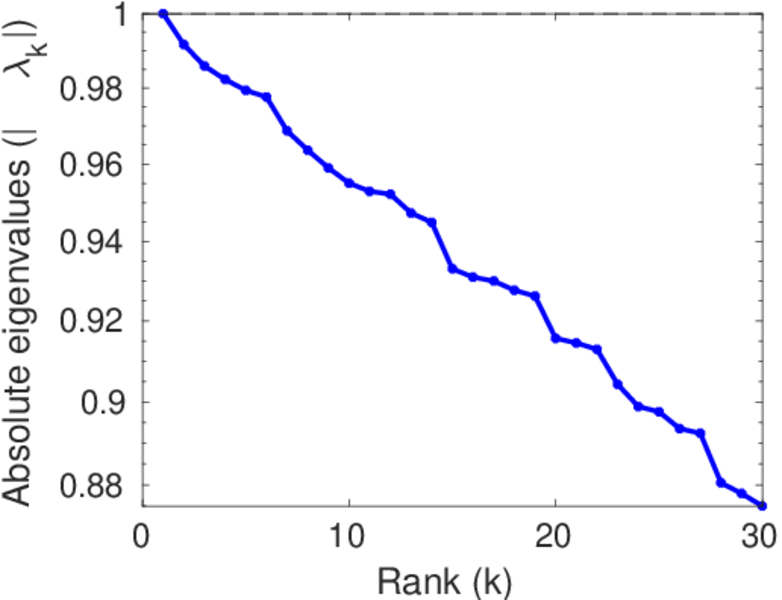
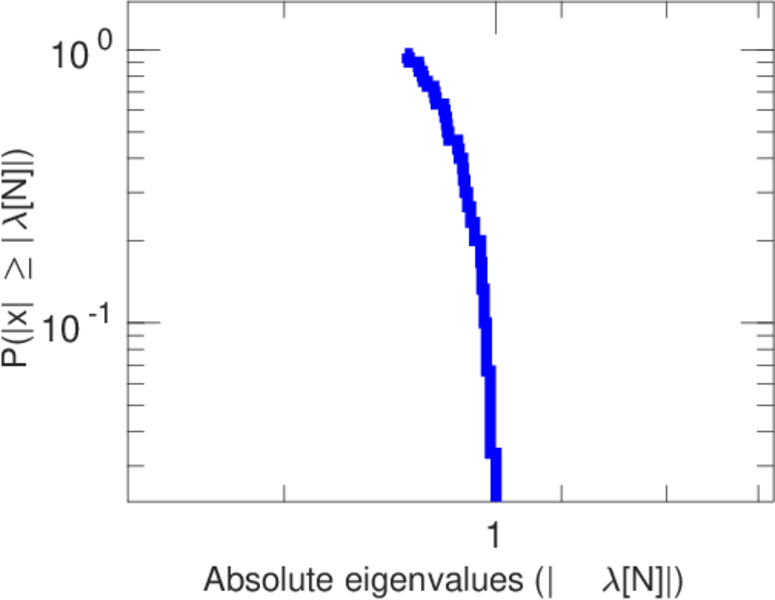
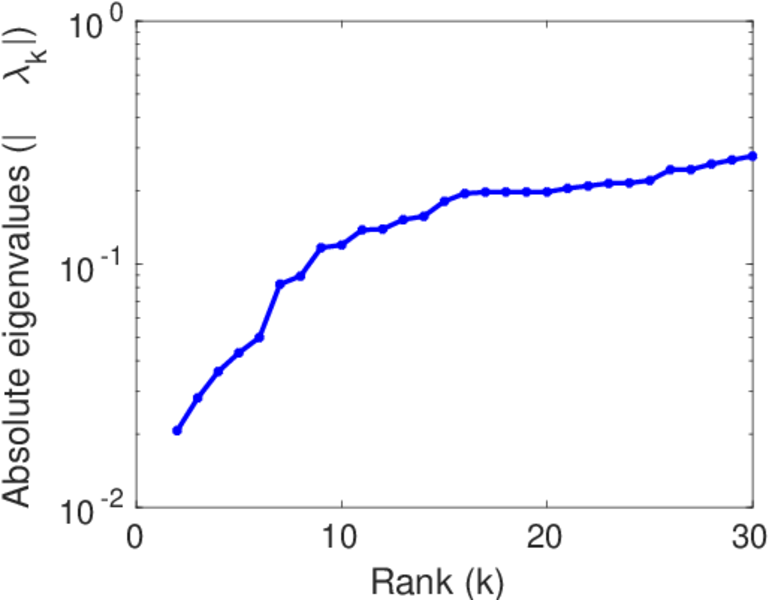
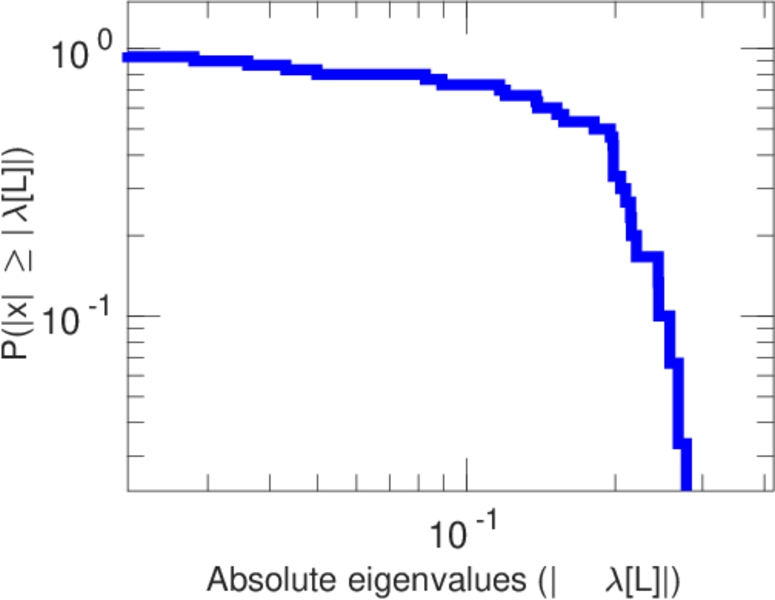
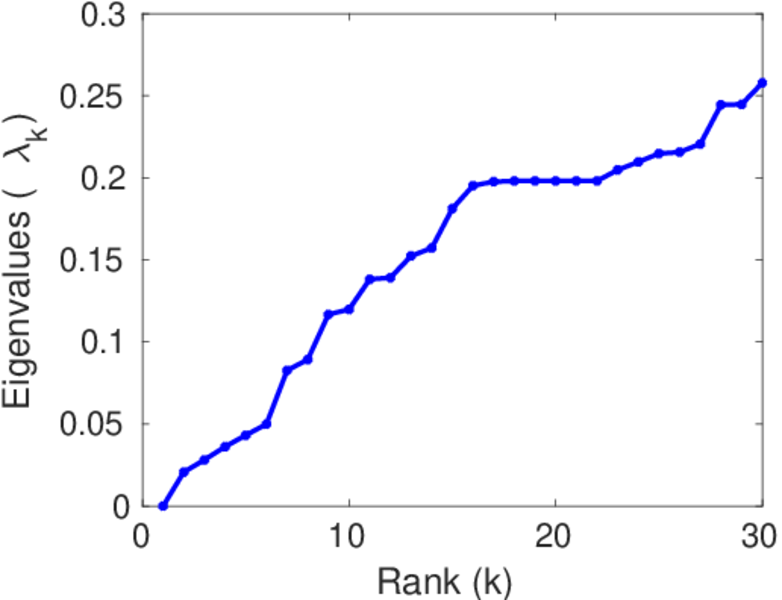
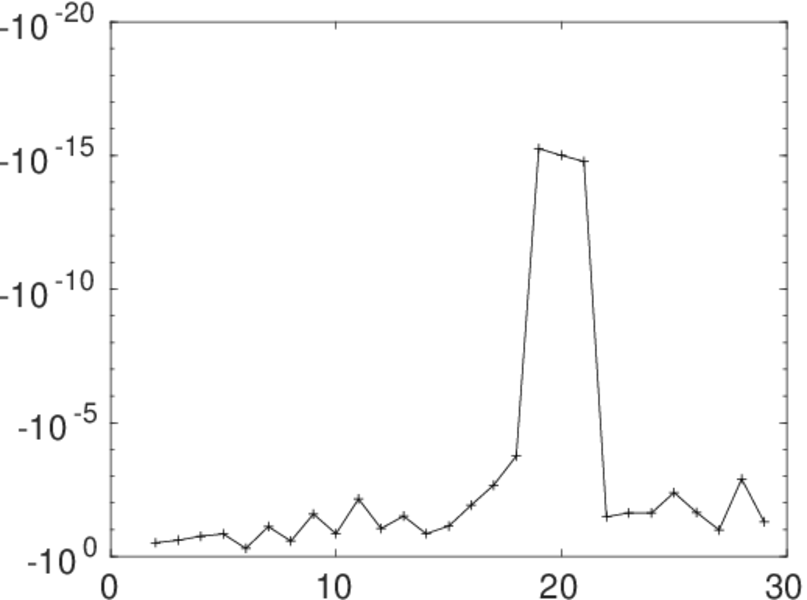
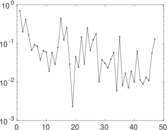
Matrix decompositions plots


Downloads
References
|
[1]
|
Jérôme Kunegis.
KONECT – The Koblenz Network Collection.
In Proc. Int. Conf. on World Wide Web Companion, pages
1343–1350, 2013.
[ http ]
|
|
[2]
|
Wikimedia Foundation.
Wikimedia downloads.
http://dumps.wikimedia.org/, January 2010.
|
 KONECT ‣ Networks ‣
Buy Me a Coffee
KONECT ‣ Networks ‣
Buy Me a Coffee