Wikipedia edits (fiu-vro)
This is the bipartite edit network of the Võro Wikipedia. It contains users
and pages from the Võro Wikipedia, connected by edit events. Each edge
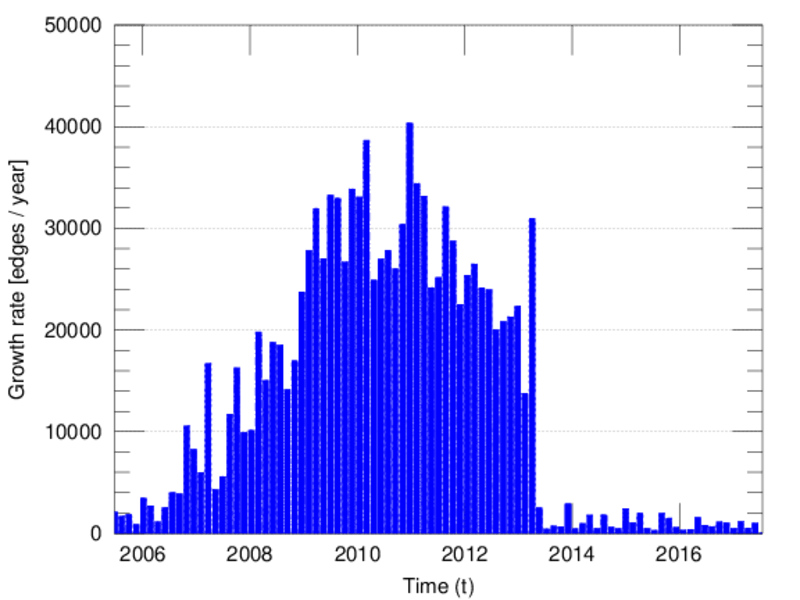
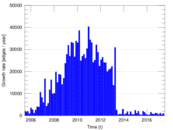
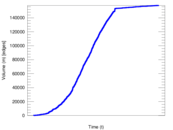
represents an edit. The dataset includes the timestamp of each edit.
Metadata
Statistics
| Size | n = | 10,914
|
| Left size | n1 = | 973
|
| Right size | n2 = | 9,941
|
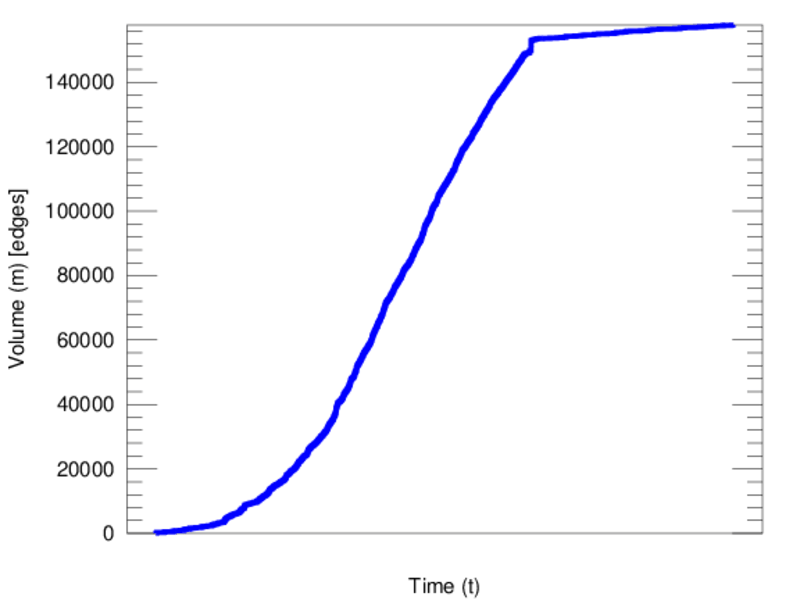
| Volume | m = | 157,786
|
| Unique edge count | m̿ = | 62,498
|
| Wedge count | s = | 67,745,208
|
| Claw count | z = | 85,748,239,329
|
| Cross count | x = | 112,043,500,312,777
|
| Square count | q = | 214,595,324
|
| 4-Tour count | T4 = | 1,987,912,104
|
| Maximum degree | dmax = | 19,288
|
| Maximum left degree | d1max = | 19,288
|
| Maximum right degree | d2max = | 277
|
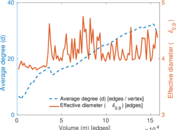
| Average degree | d = | 28.914 4
|
| Average left degree | d1 = | 162.164
|
| Average right degree | d2 = | 15.872 2
|
| Fill | p = | 0.006 461 35
|
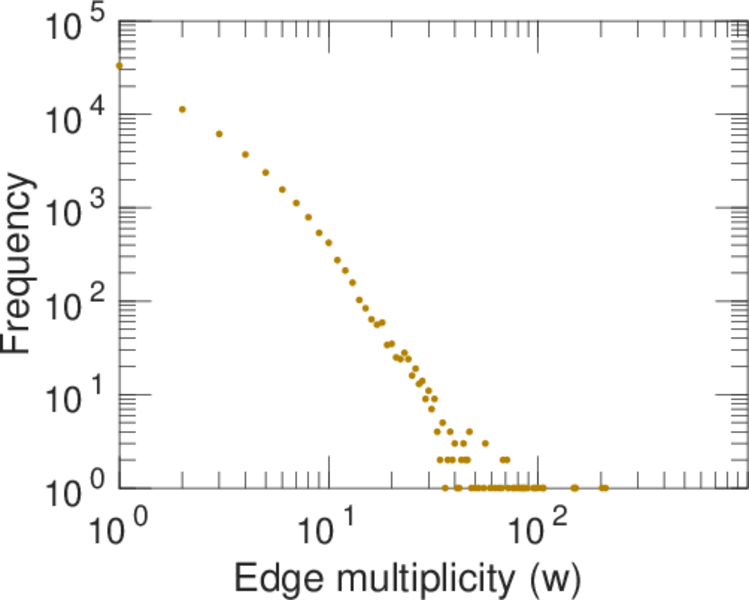
| Average edge multiplicity | m̃ = | 2.524 66
|
| Size of LCC | N = | 10,243
|
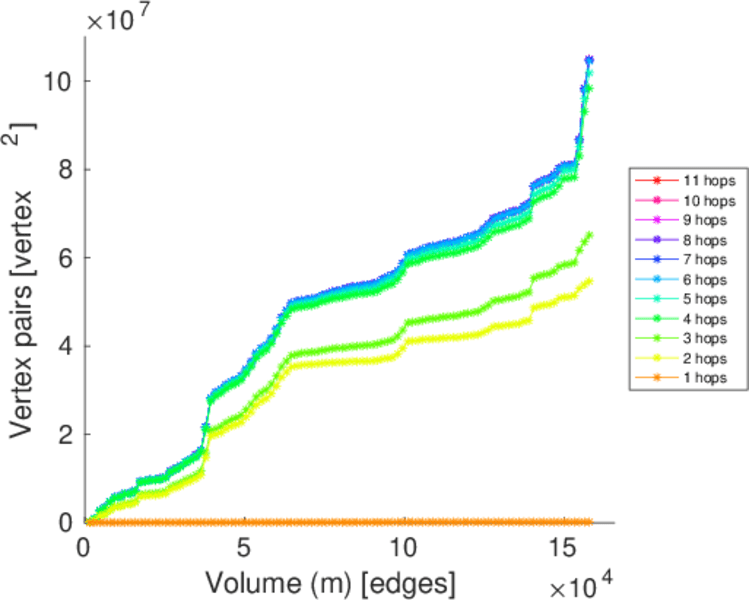
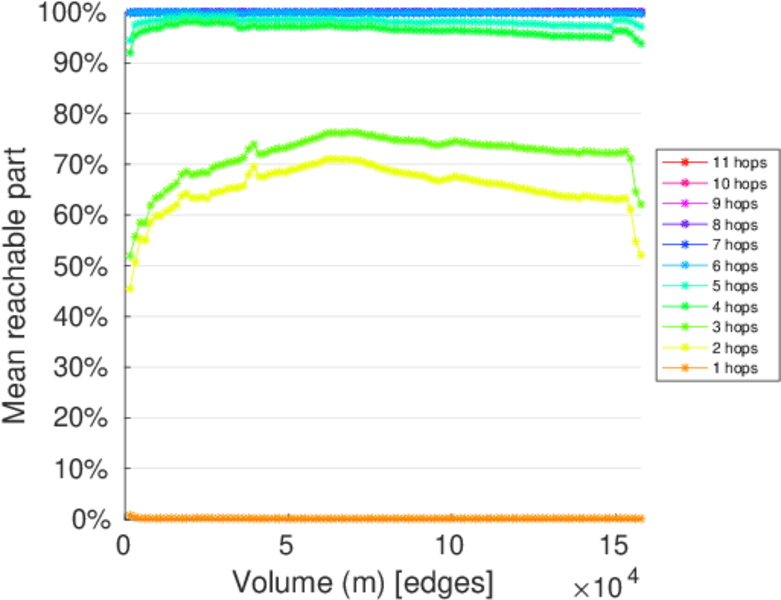
| Diameter | δ = | 11
|
| 50-Percentile effective diameter | δ0.5 = | 2.043 25
|
| 90-Percentile effective diameter | δ0.9 = | 3.908 88
|
| Median distance | δM = | 3
|
| Mean distance | δm = | 2.989 20
|
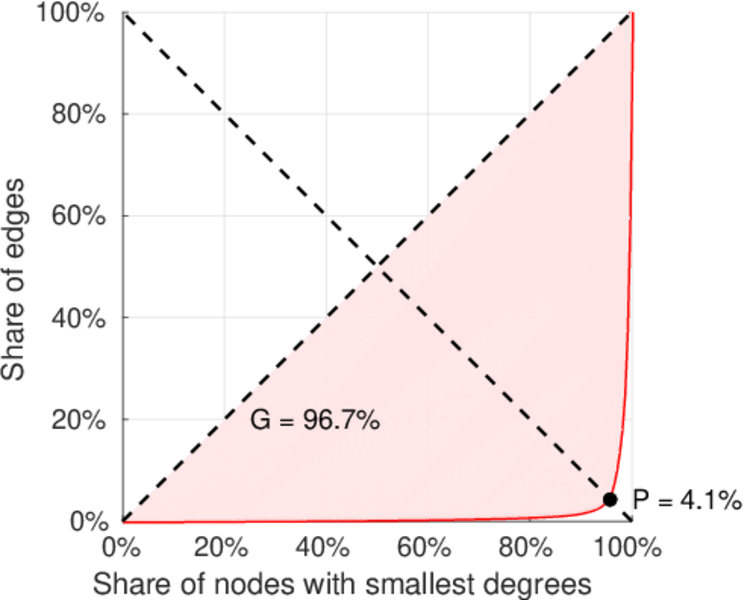
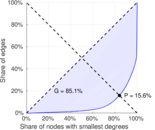
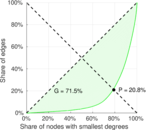
| Gini coefficient | G = | 0.845 649
|
| Balanced inequality ratio | P = | 0.162 036
|
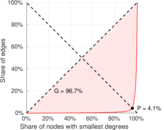
| Left balanced inequality ratio | P1 = | 0.041 112 6
|
| Right balanced inequality ratio | P2 = | 0.207 705
|
| Relative edge distribution entropy | Her = | 0.742 331
|
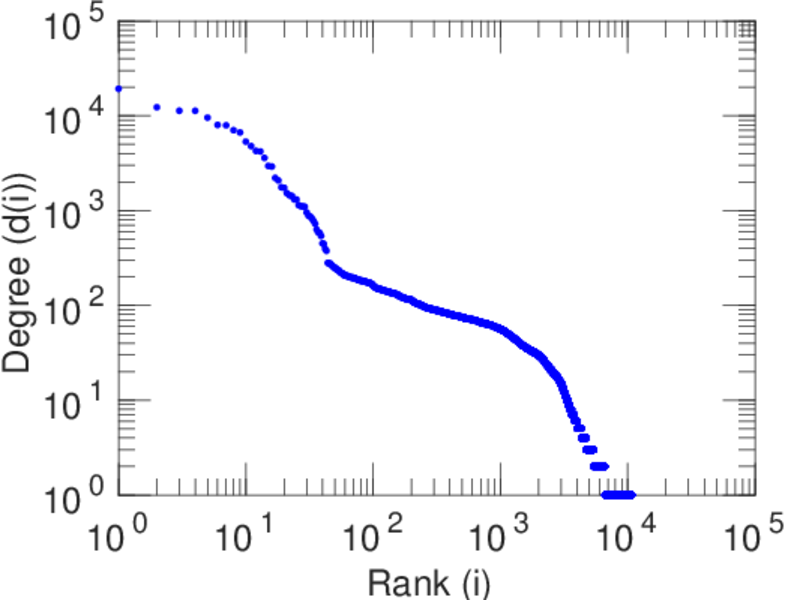
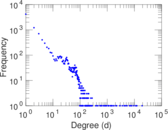
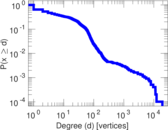
| Power law exponent | γ = | 2.008 54
|
| Tail power law exponent | γt = | 1.681 00
|
| Tail power law exponent with p | γ3 = | 1.681 00
|
| p-value | p = | 0.000 00
|
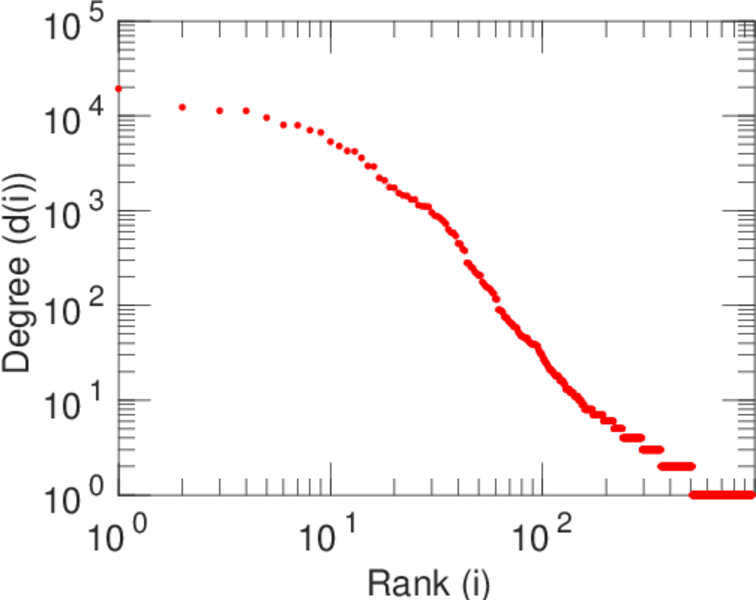
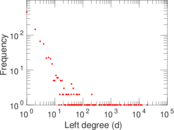
| Left tail power law exponent with p | γ3,1 = | 1.711 00
|
| Left p-value | p1 = | 0.000 00
|
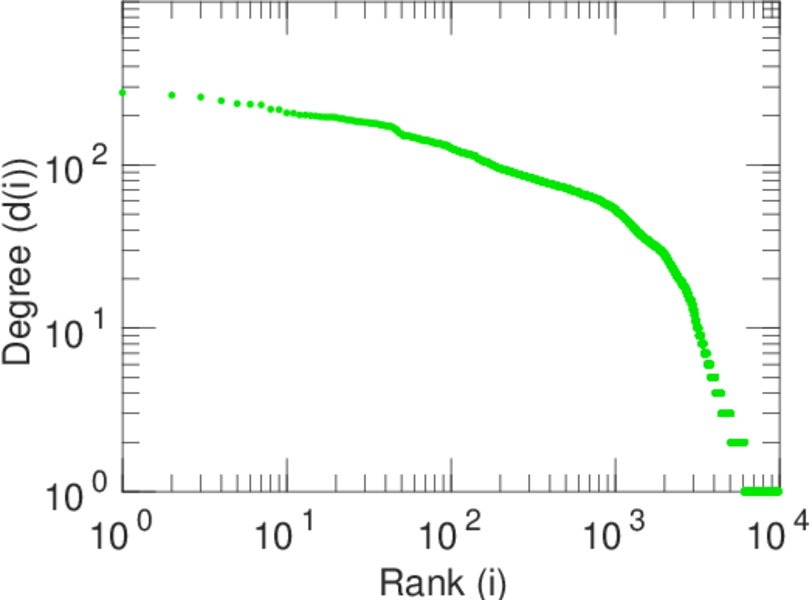
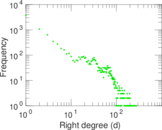
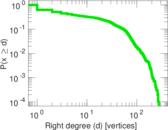
| Right tail power law exponent with p | γ3,2 = | 8.341 00
|
| Right p-value | p2 = | 0.156 000
|
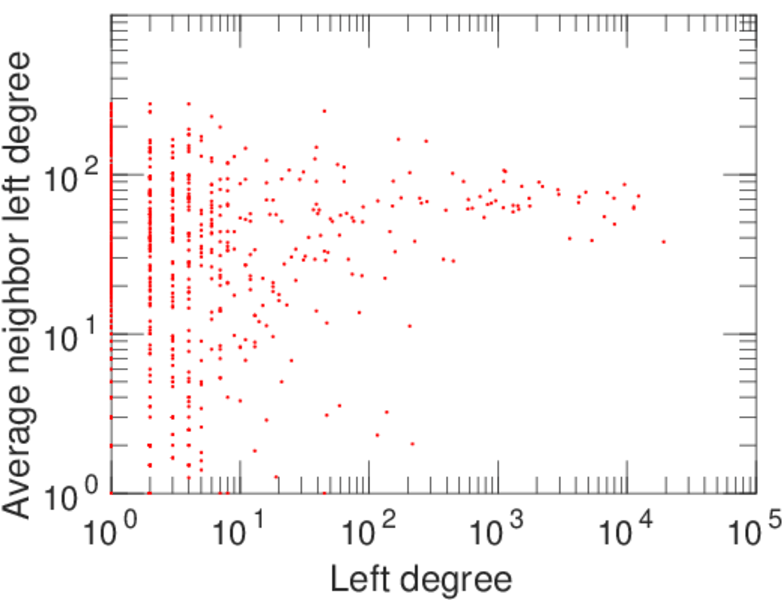
| Degree assortativity | ρ = | −0.366 302
|
| Degree assortativity p-value | pρ = | 0.000 00
|
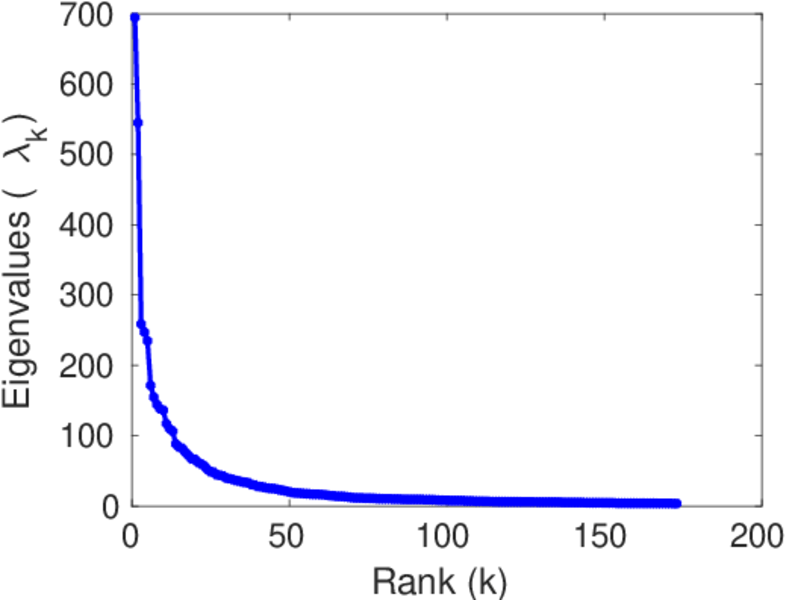
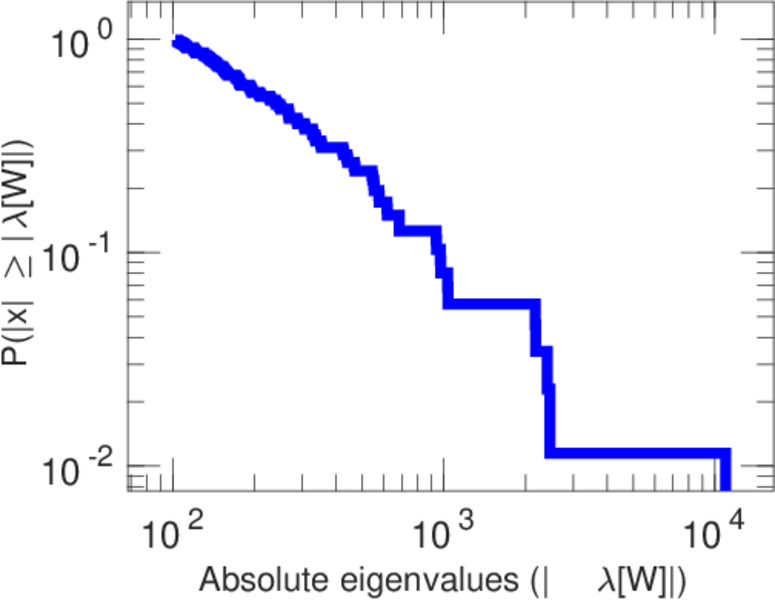
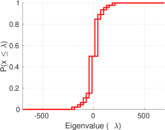
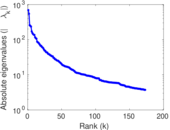
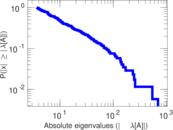
| Spectral norm | α = | 694.438
|
| Algebraic connectivity | a = | 0.018 048 2
|
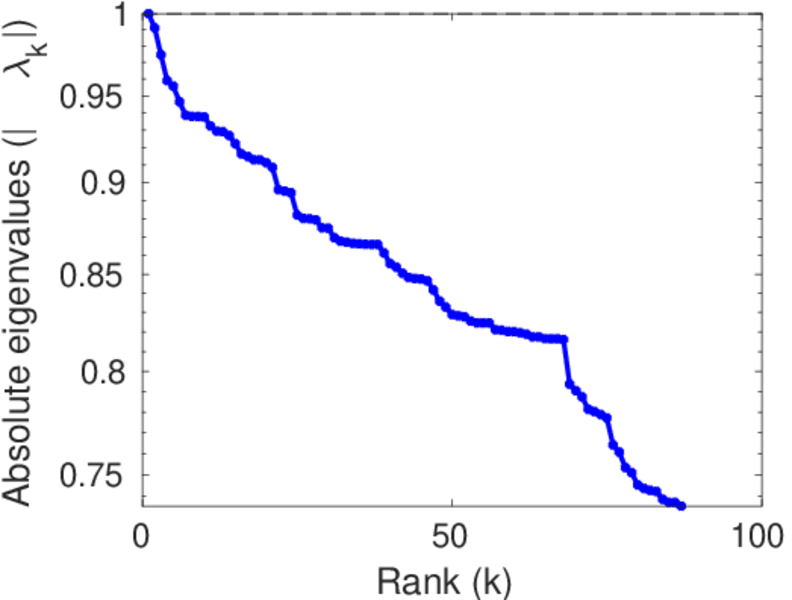
| Spectral separation | |λ1[A] / λ2[A]| = | 1.274 53
|
| Controllability | C = | 9,011
|
| Relative controllability | Cr = | 0.833 966
|
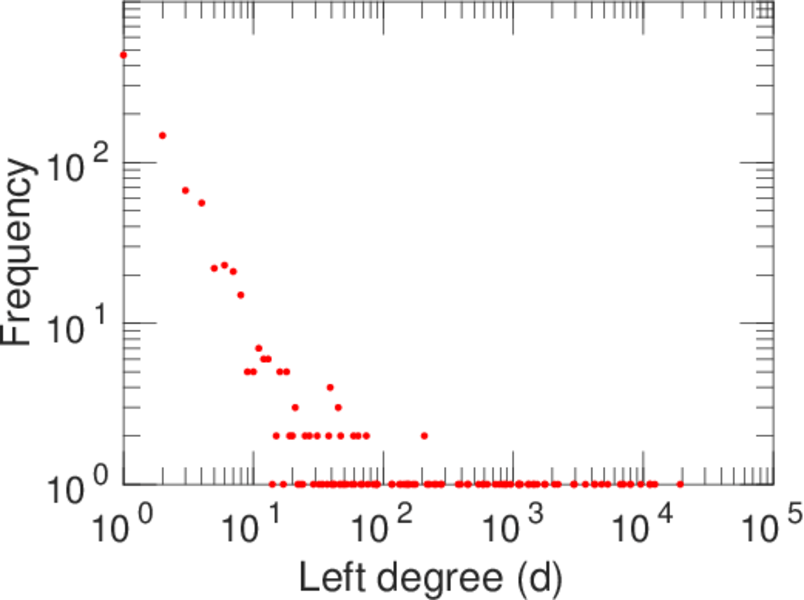
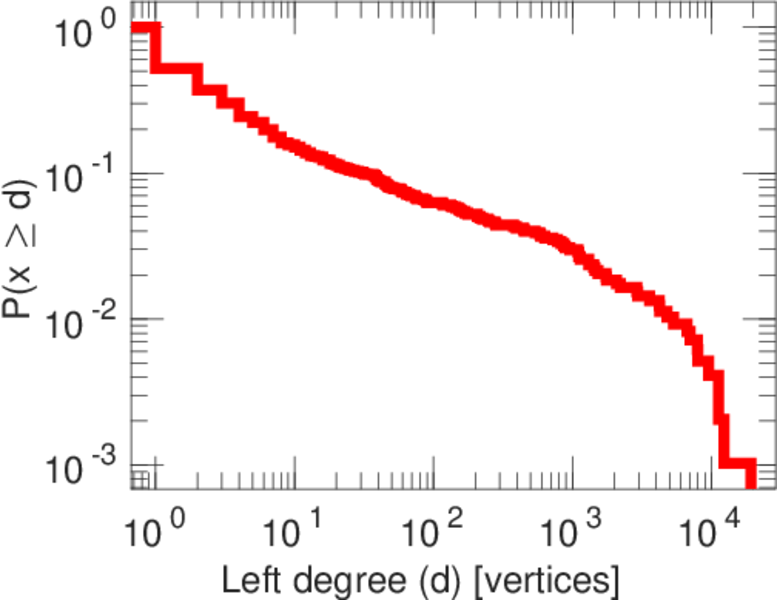
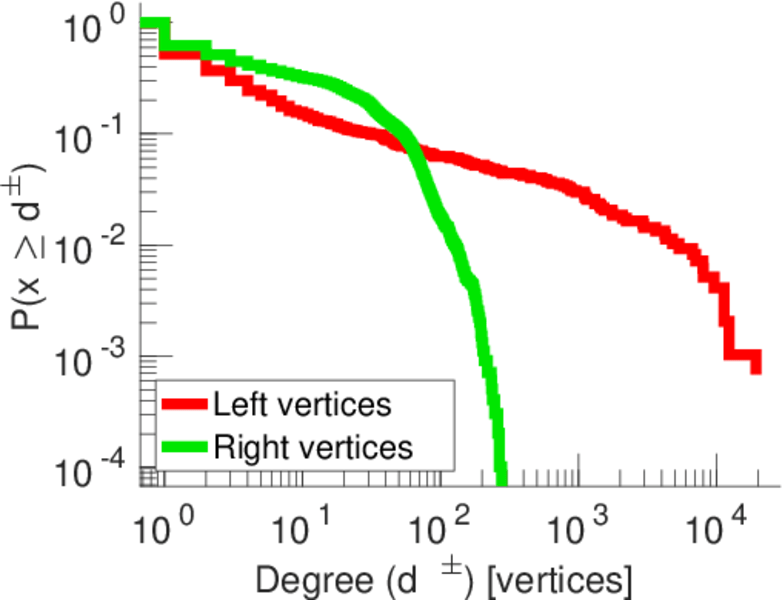
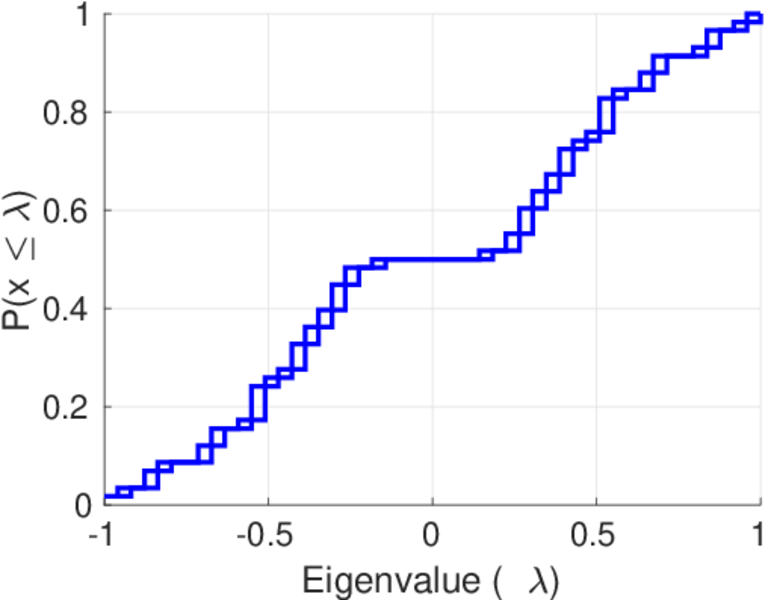
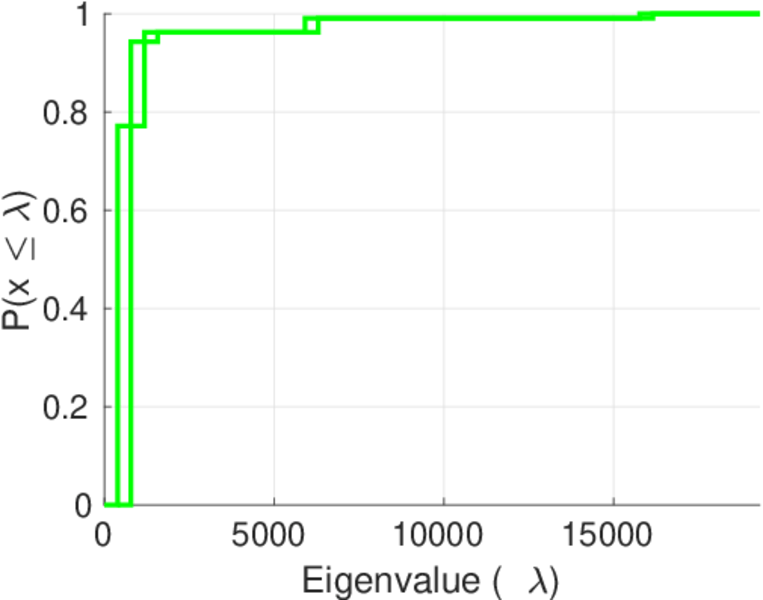
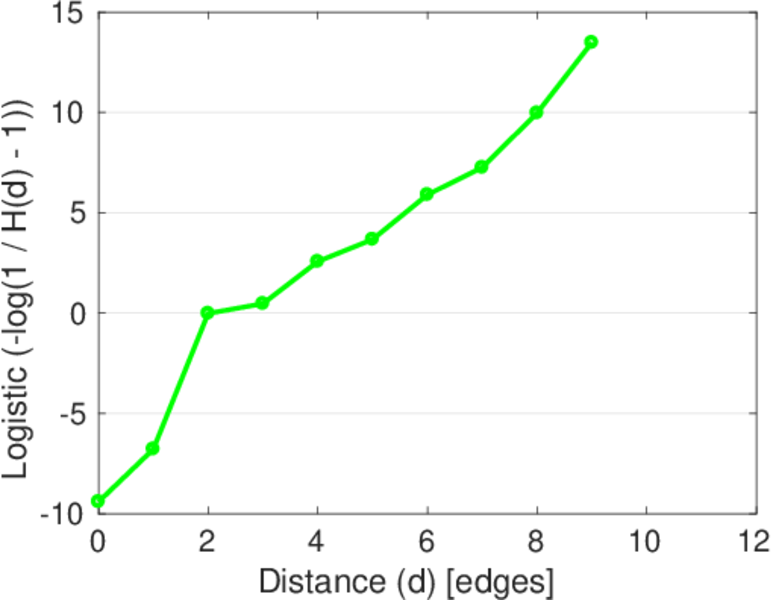
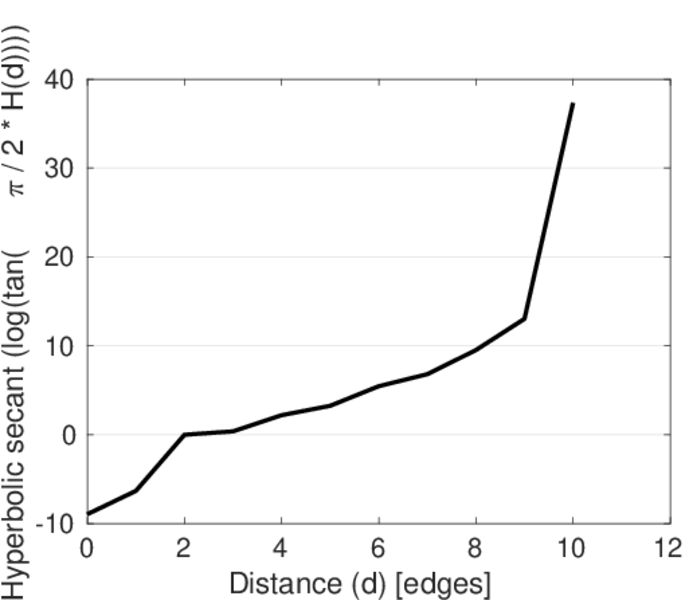
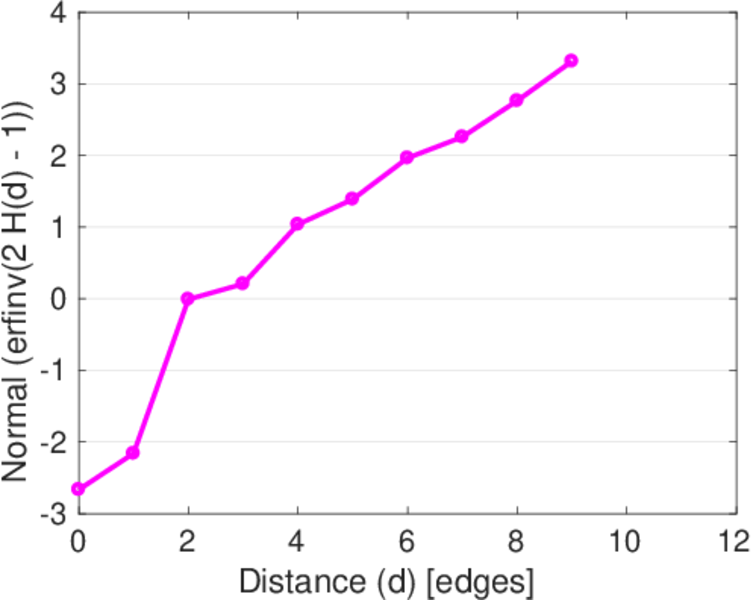
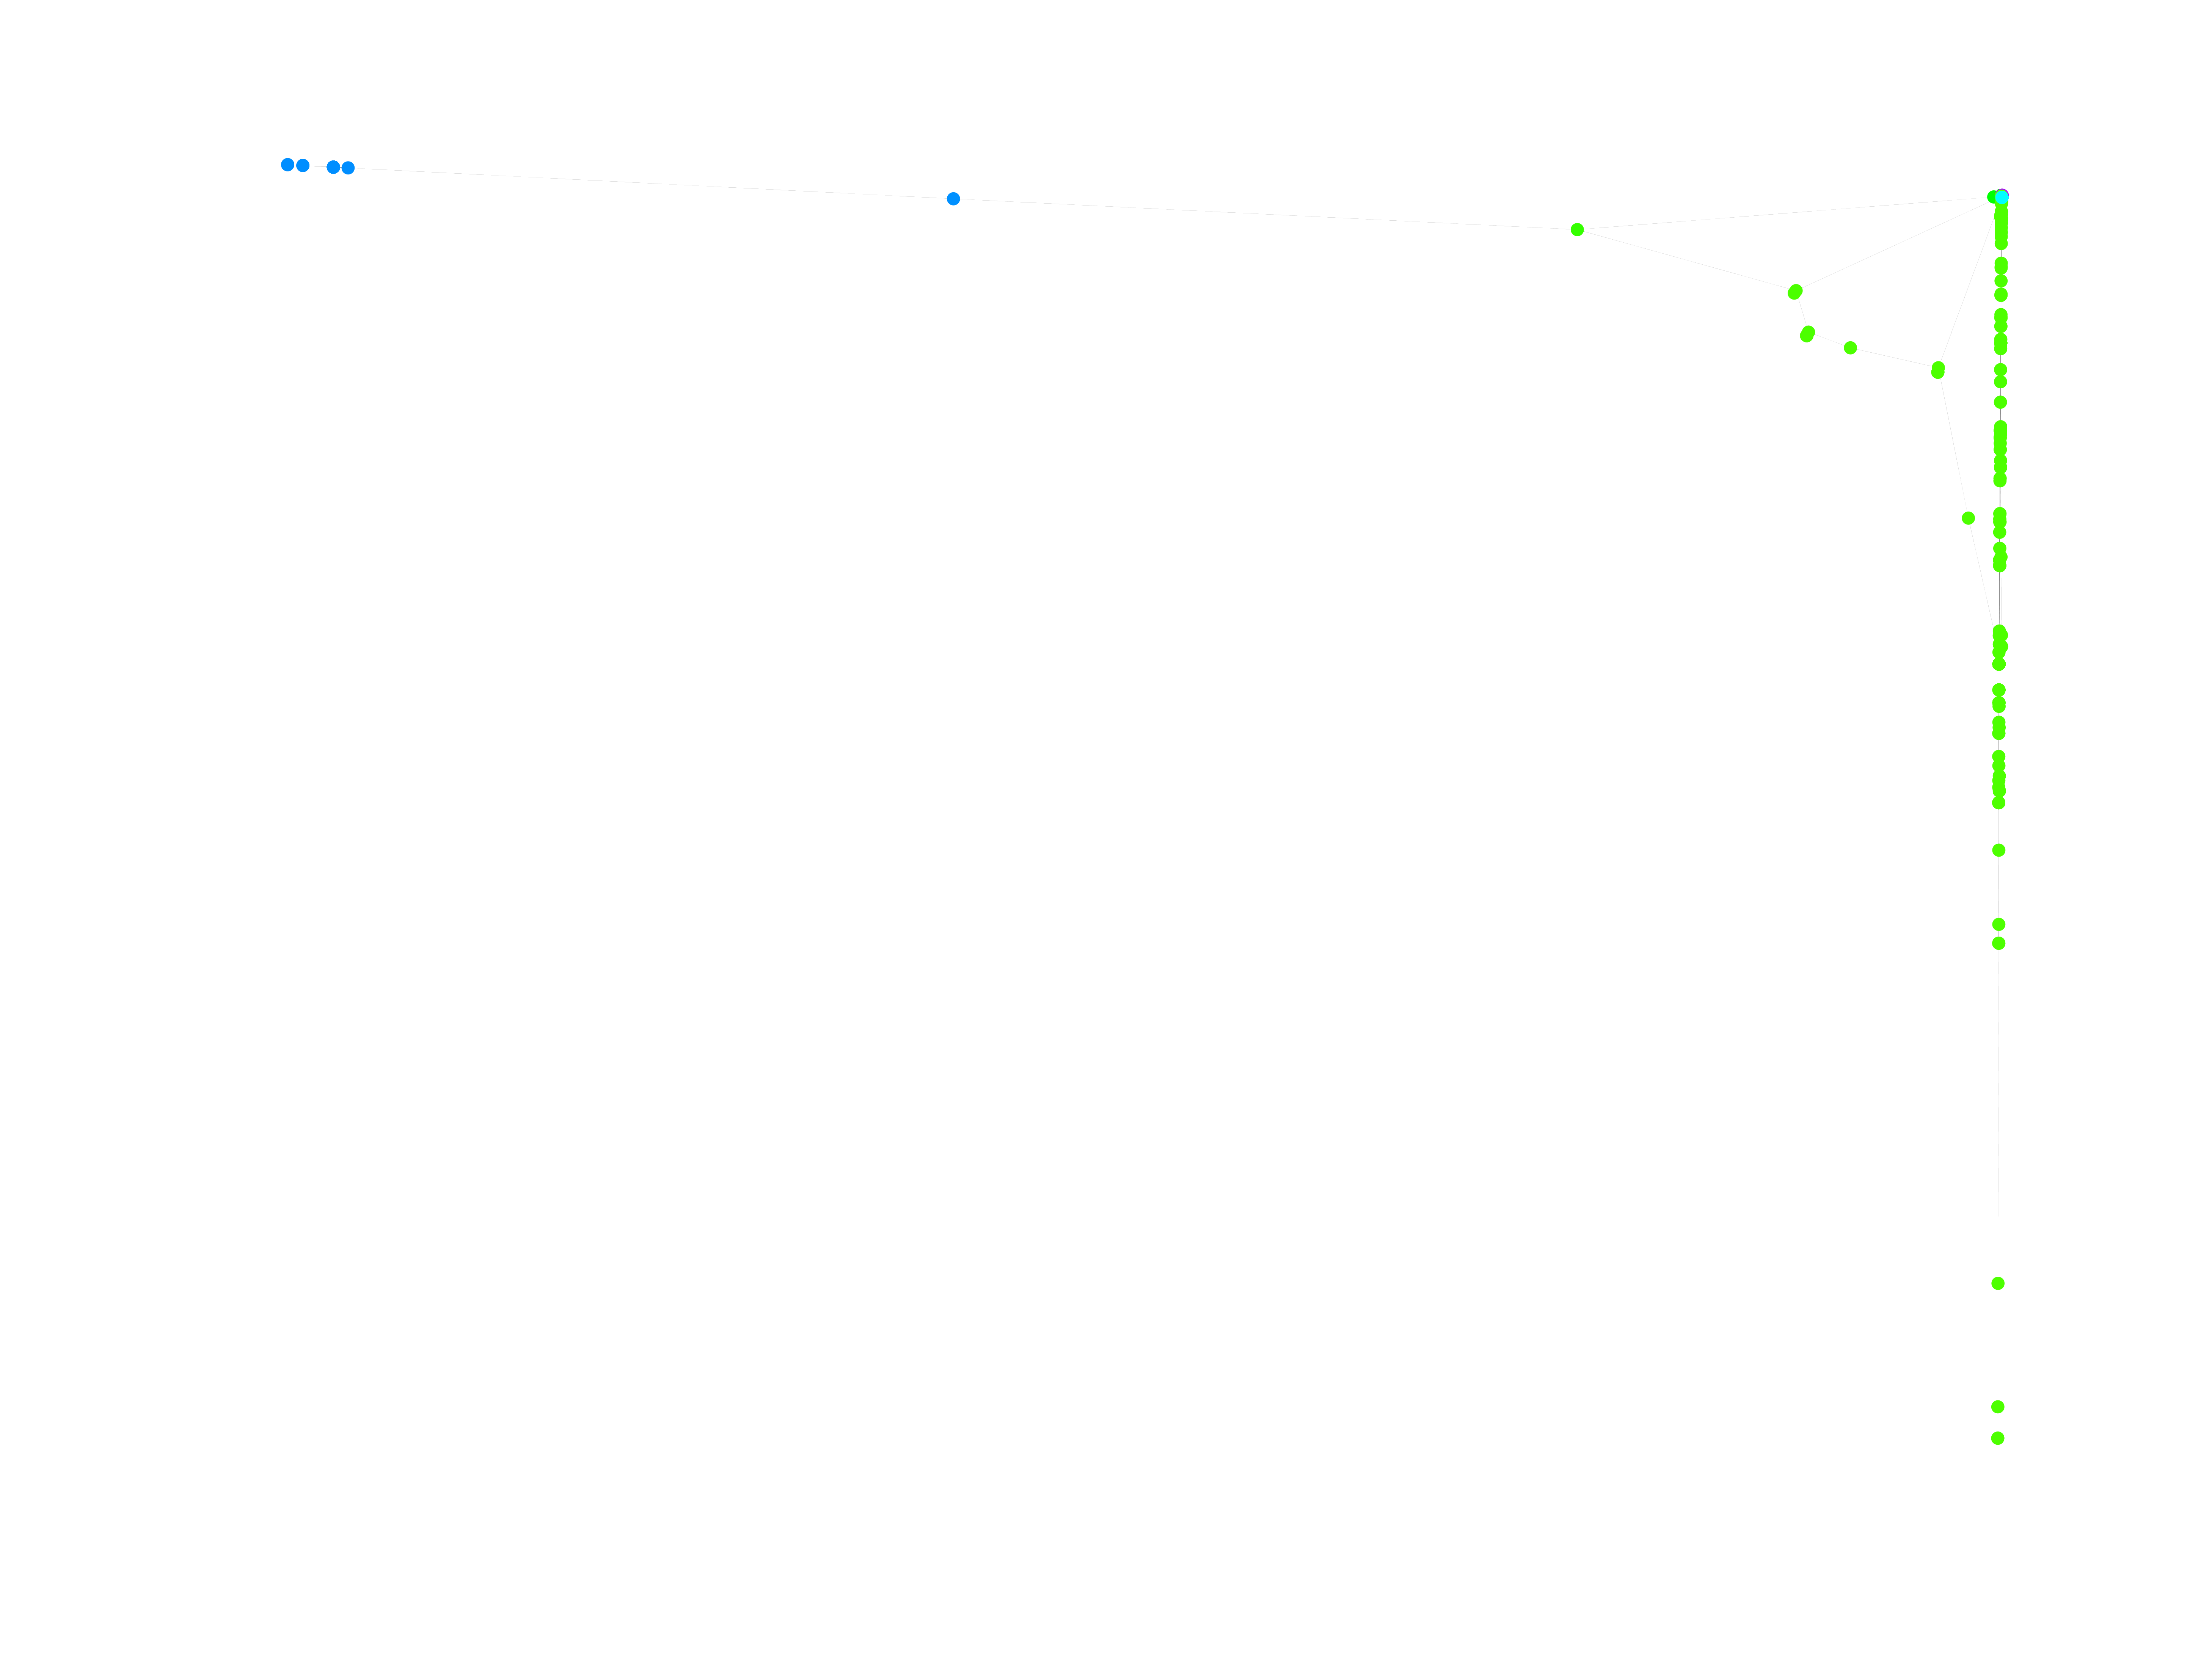
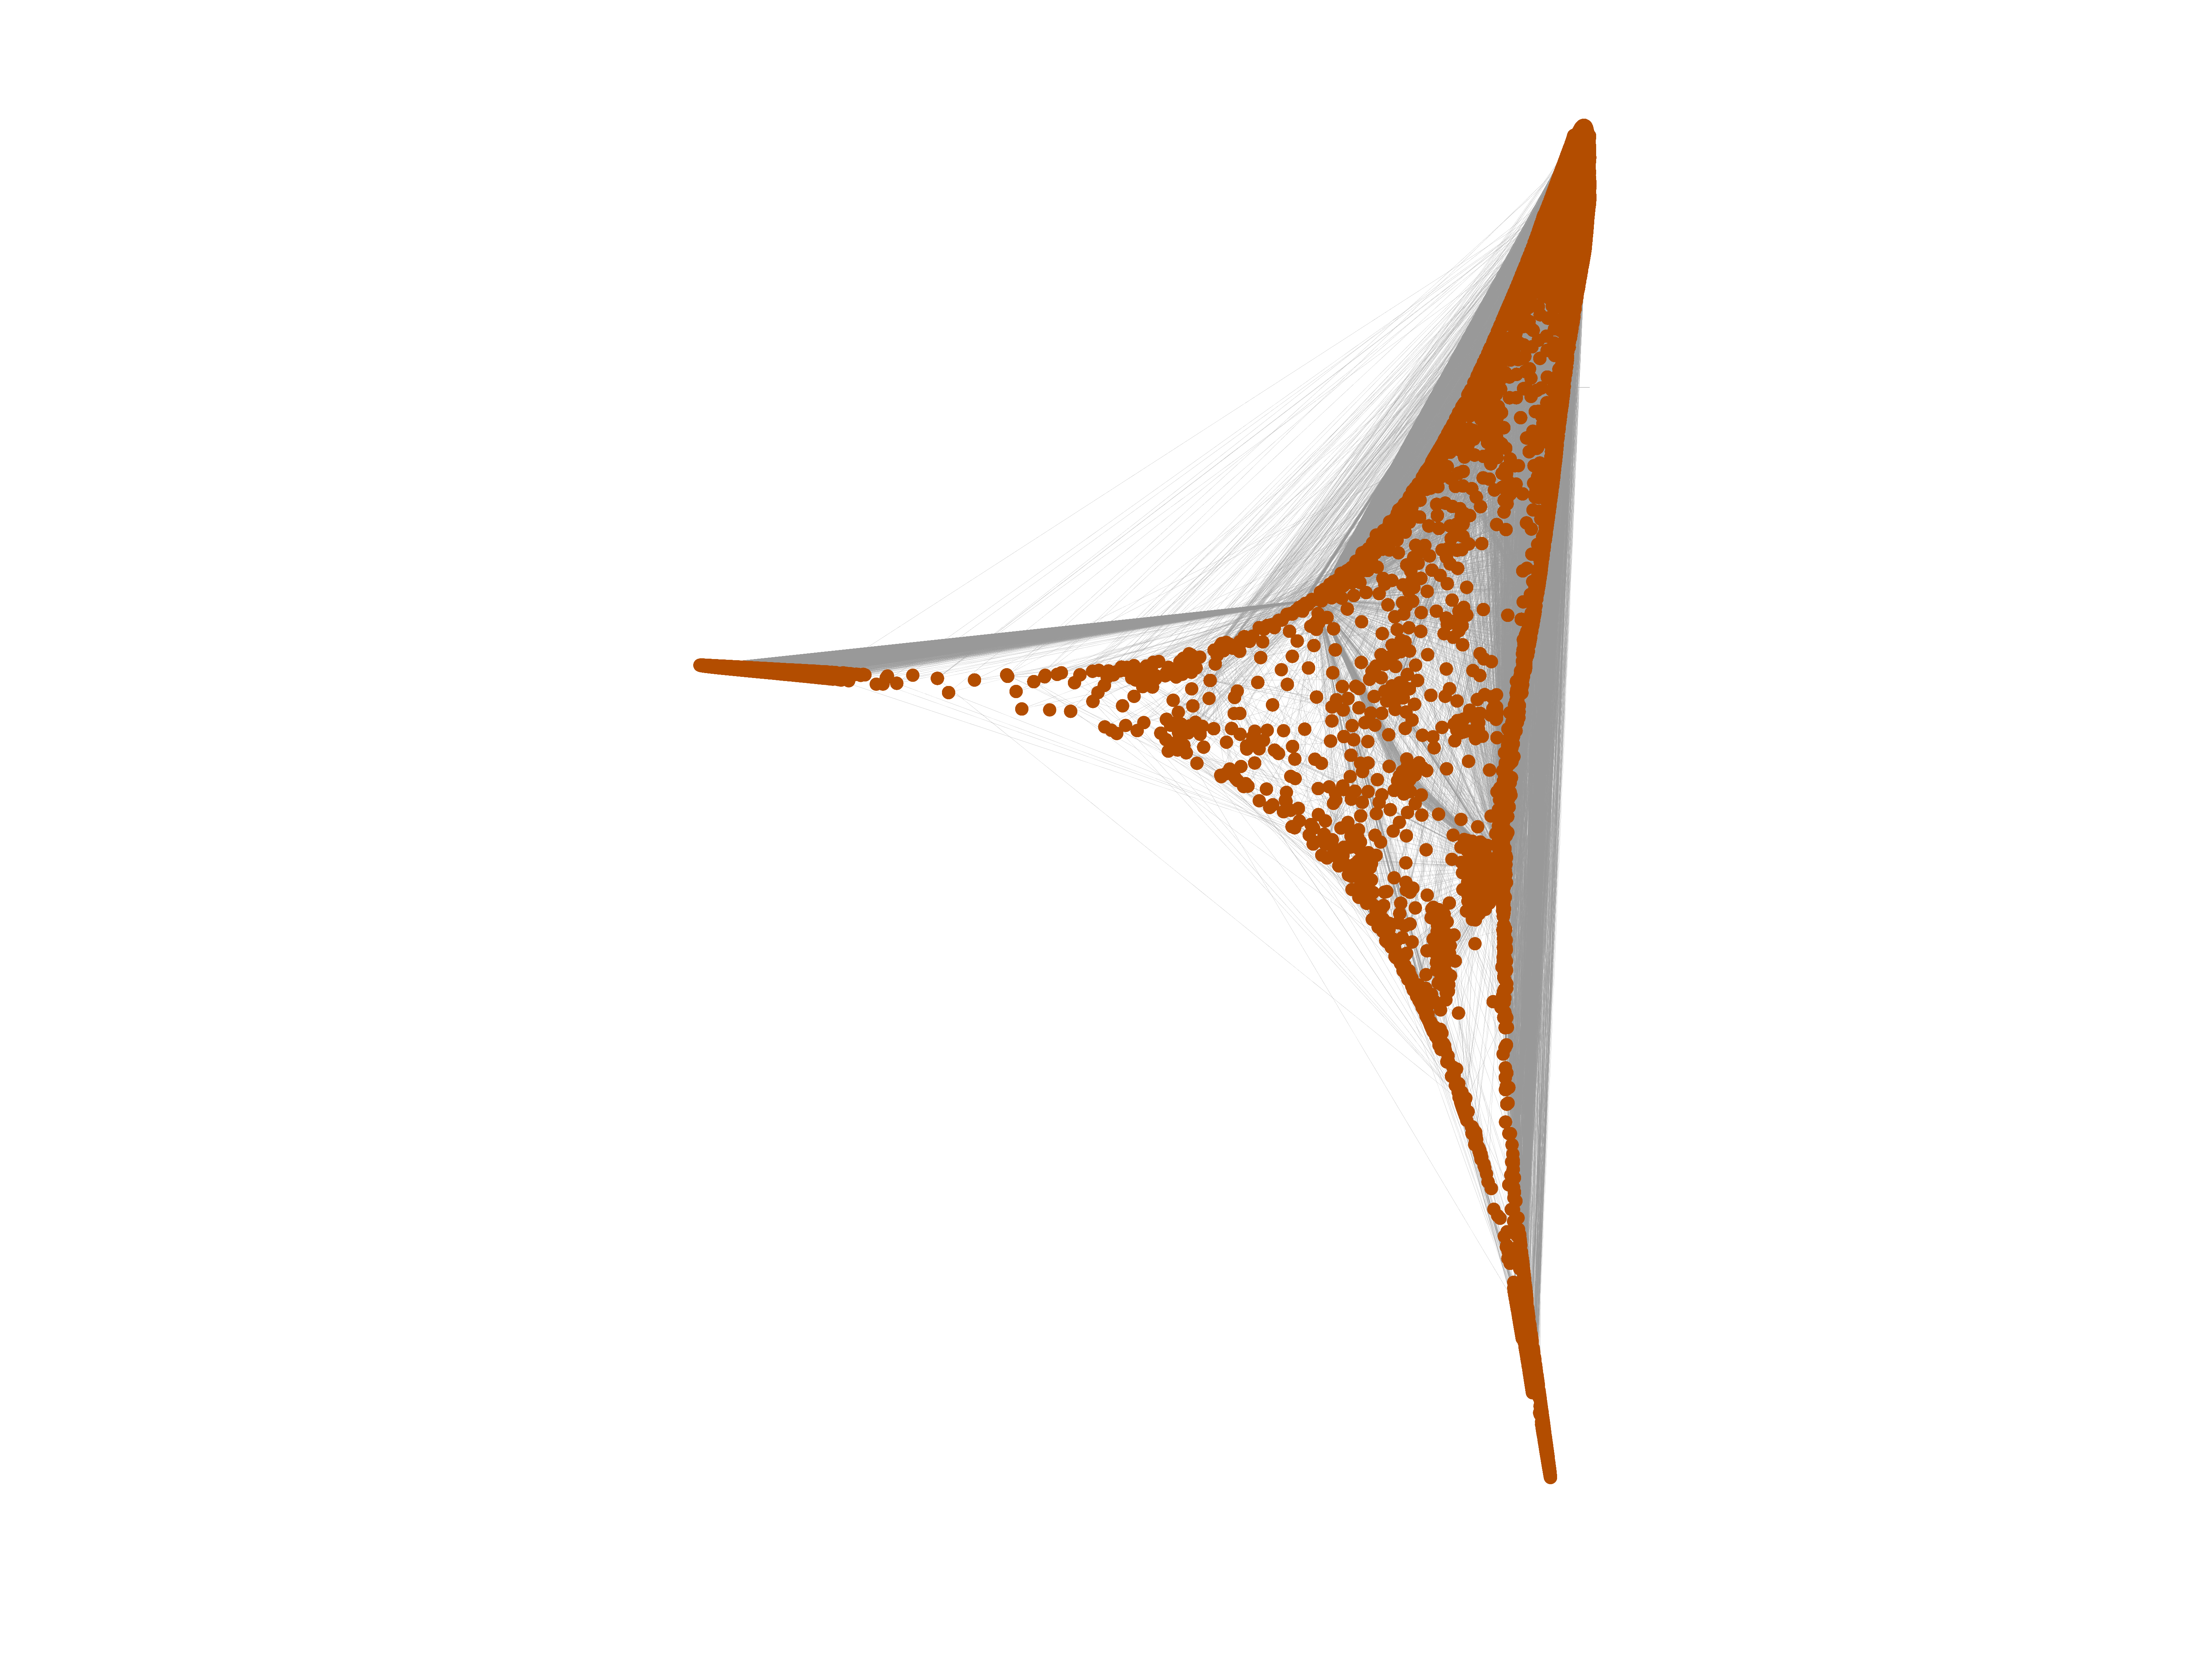
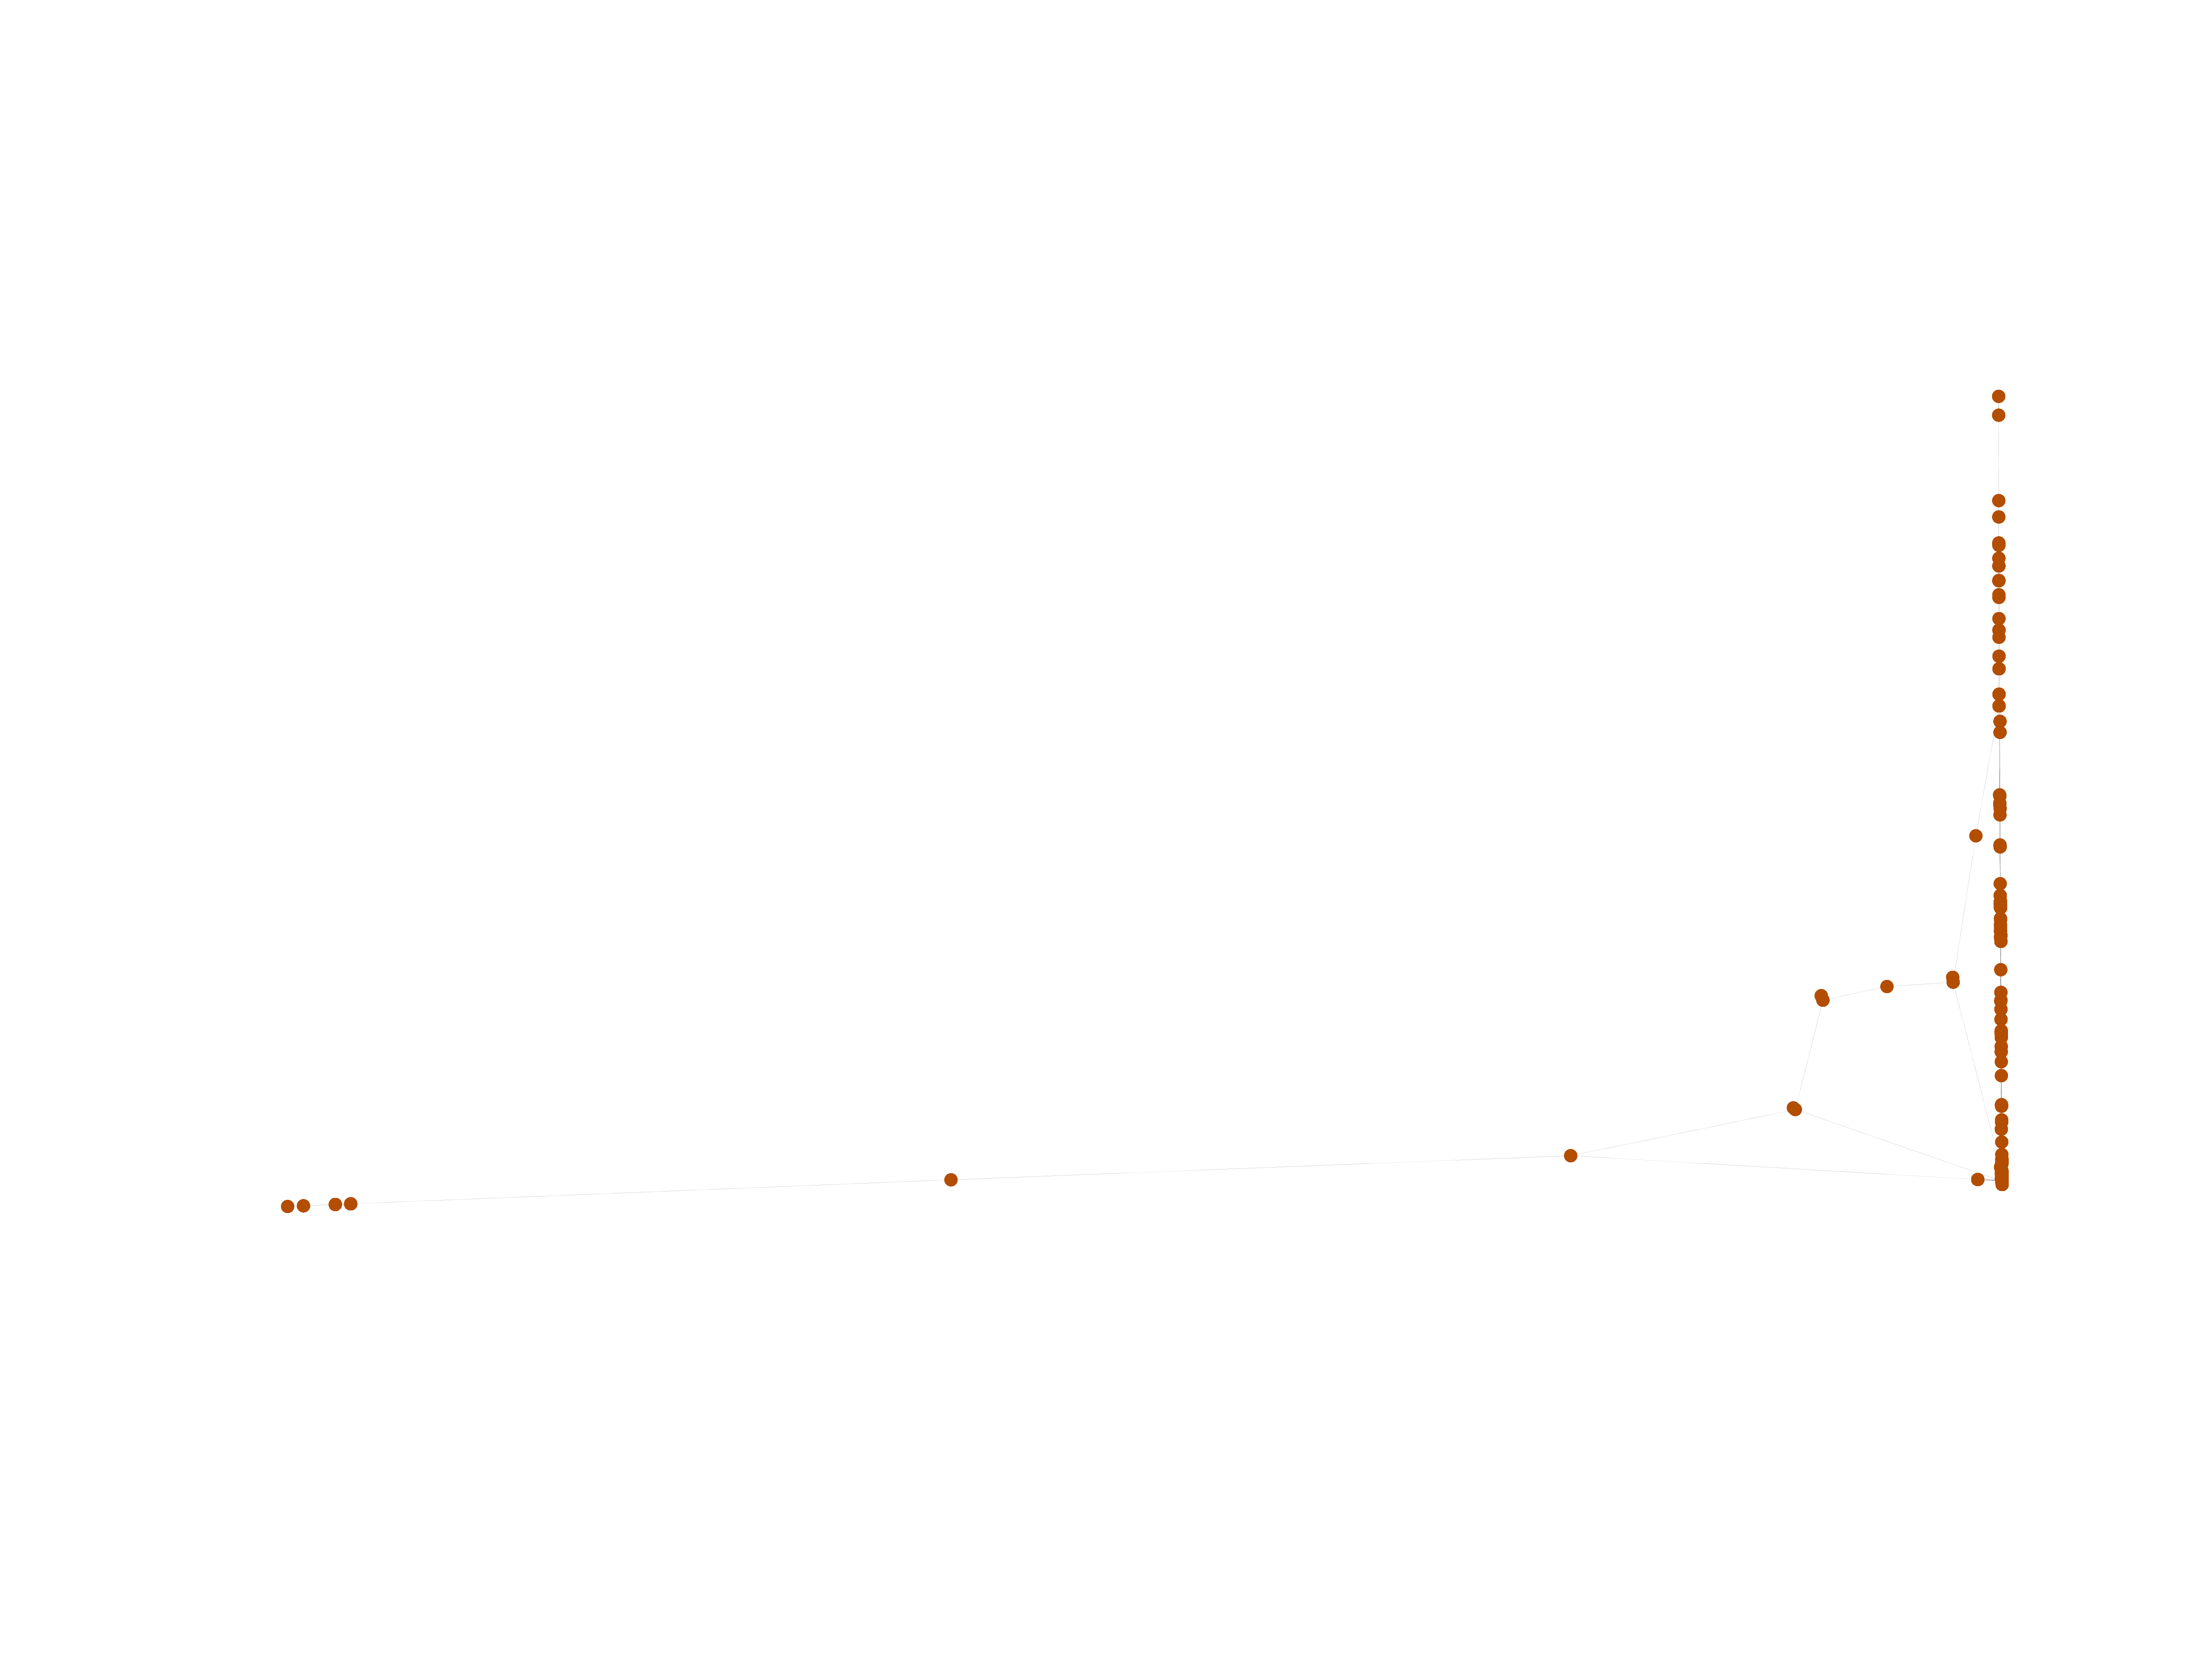
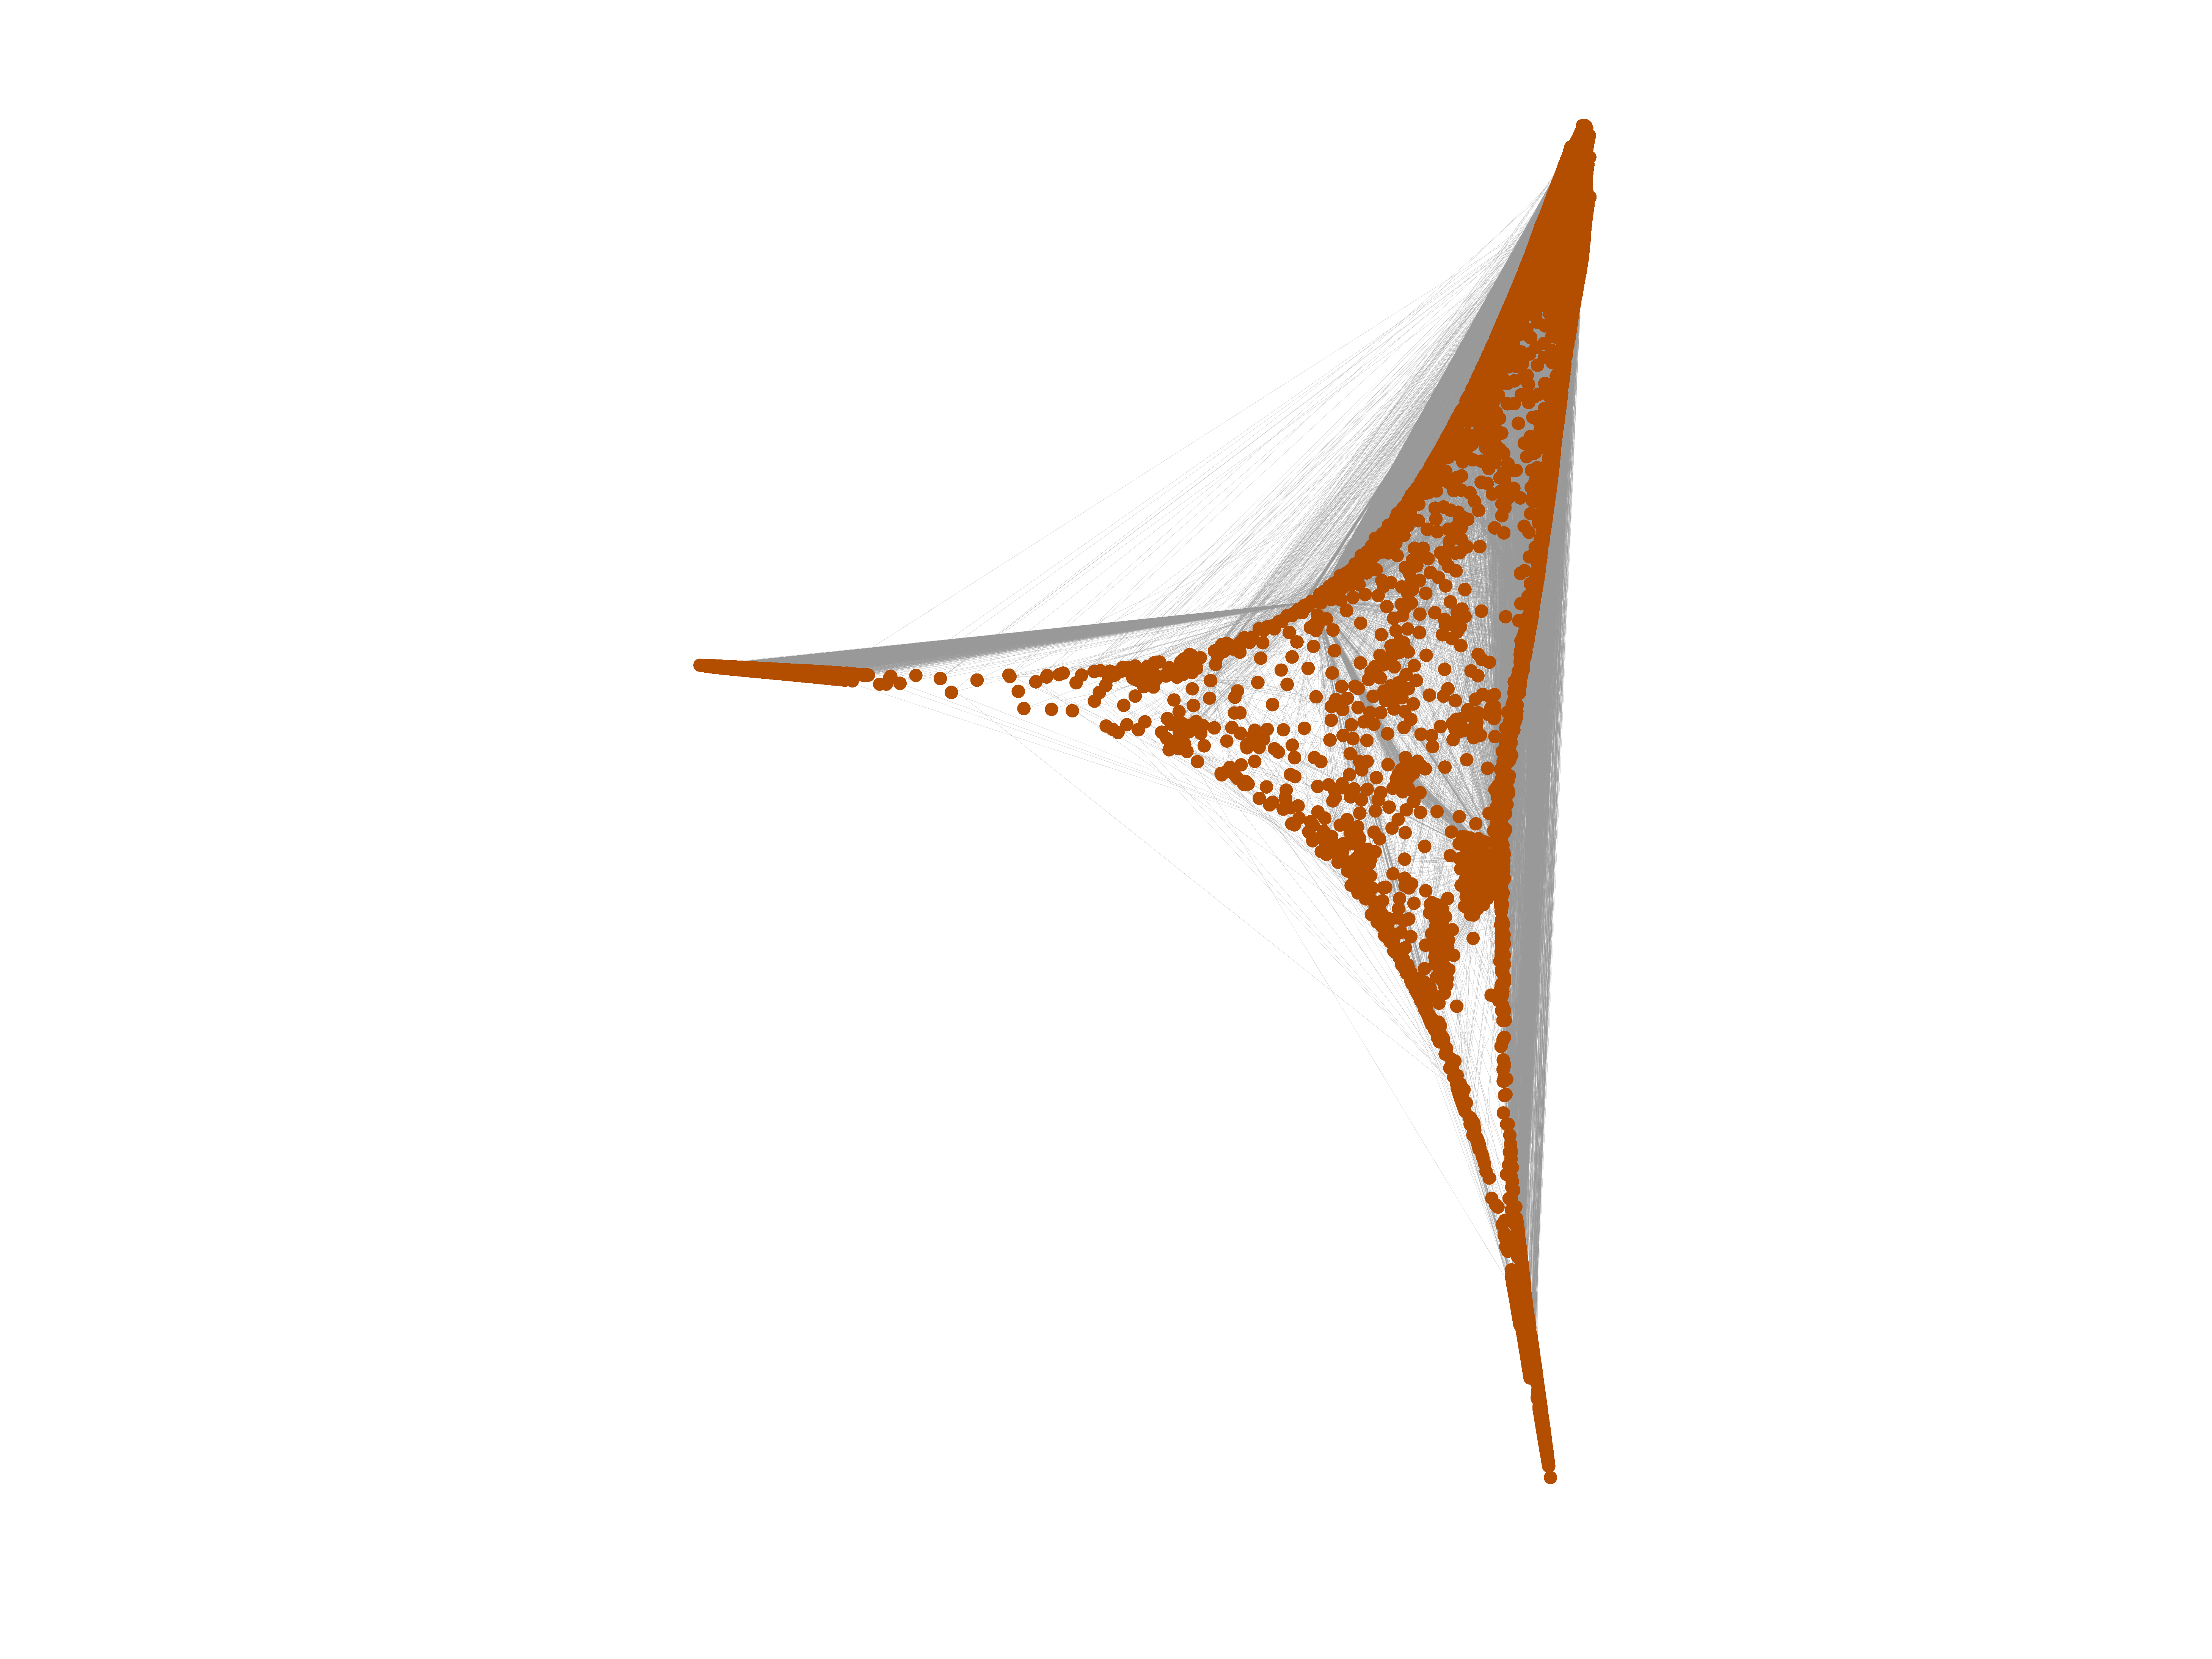
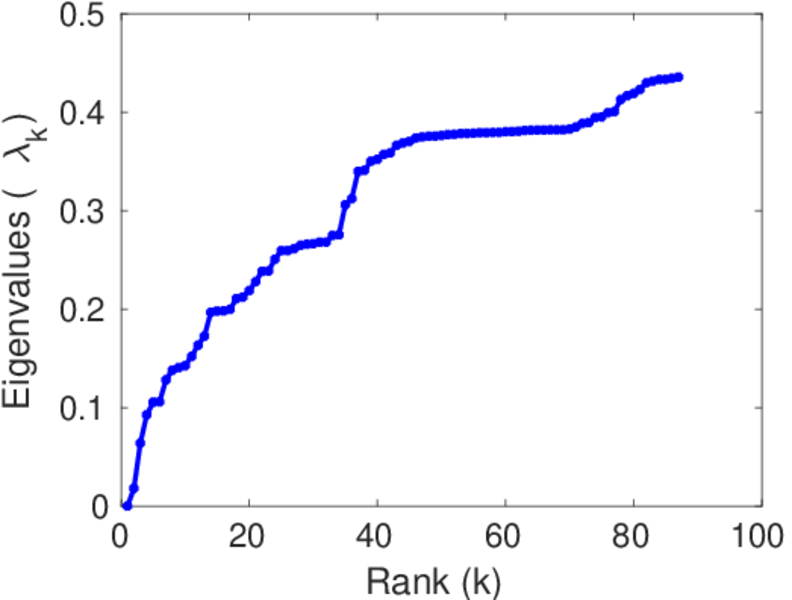
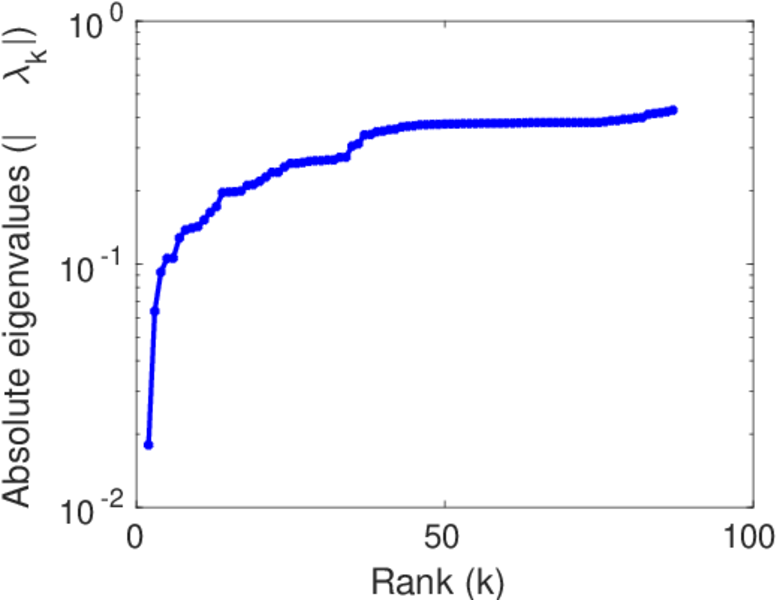
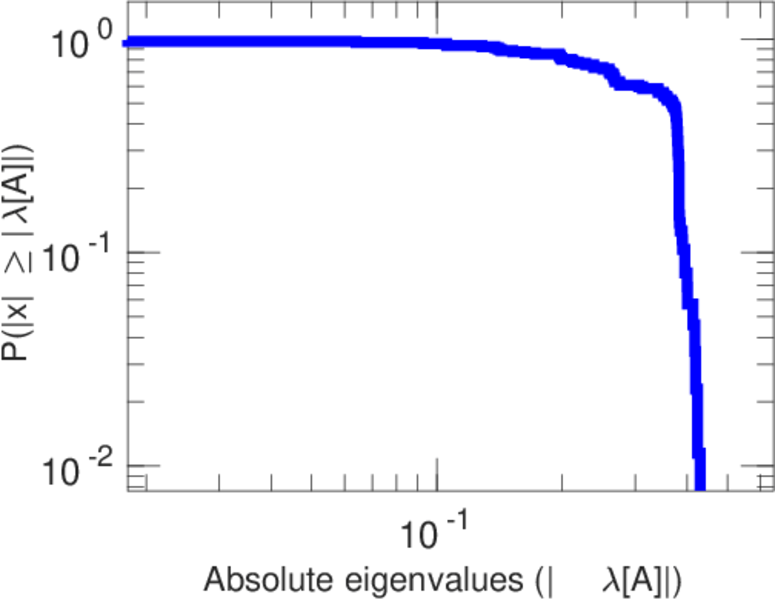
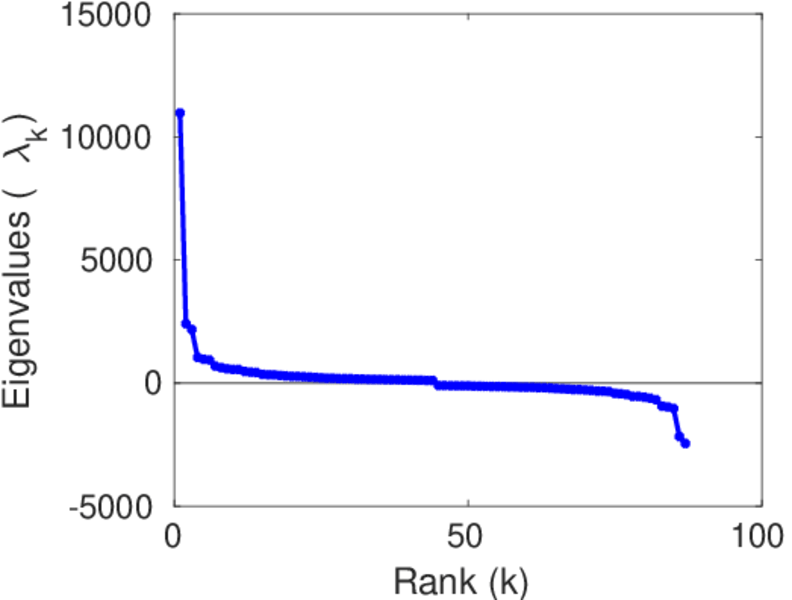
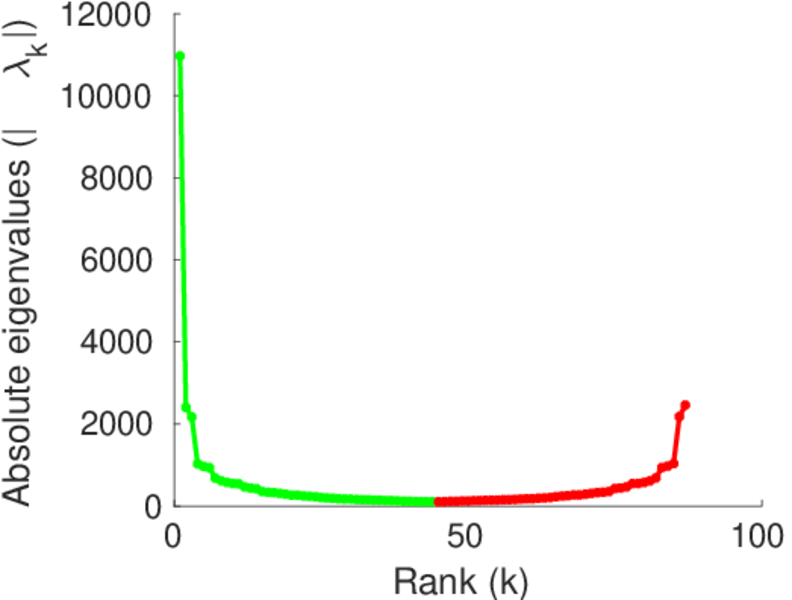
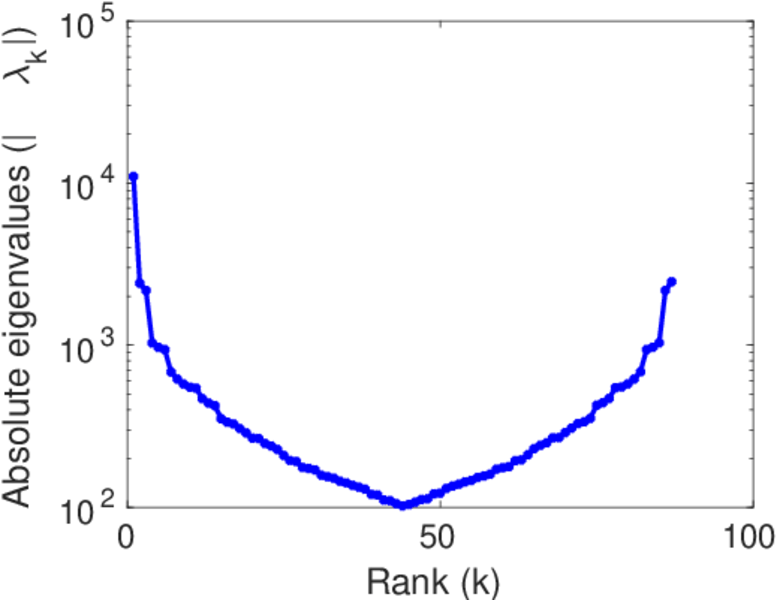
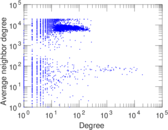
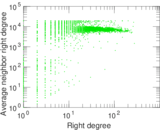
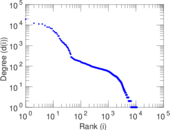
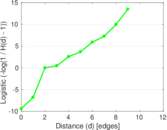
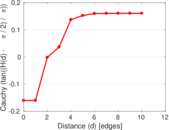
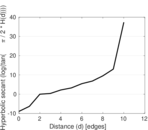
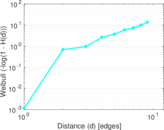
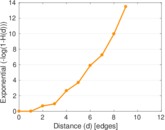
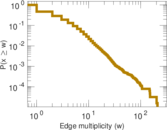
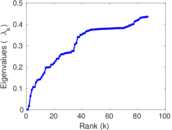
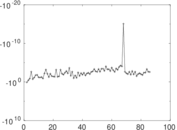
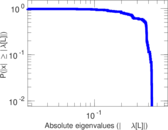
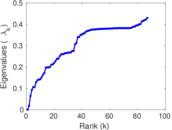
Plots


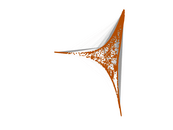


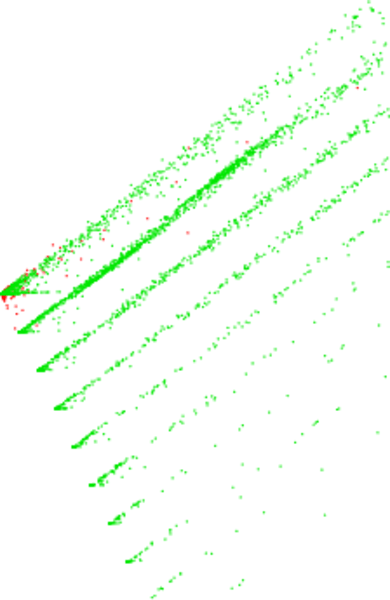
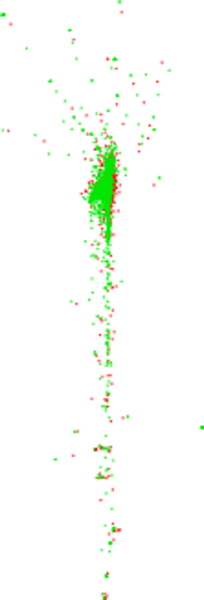
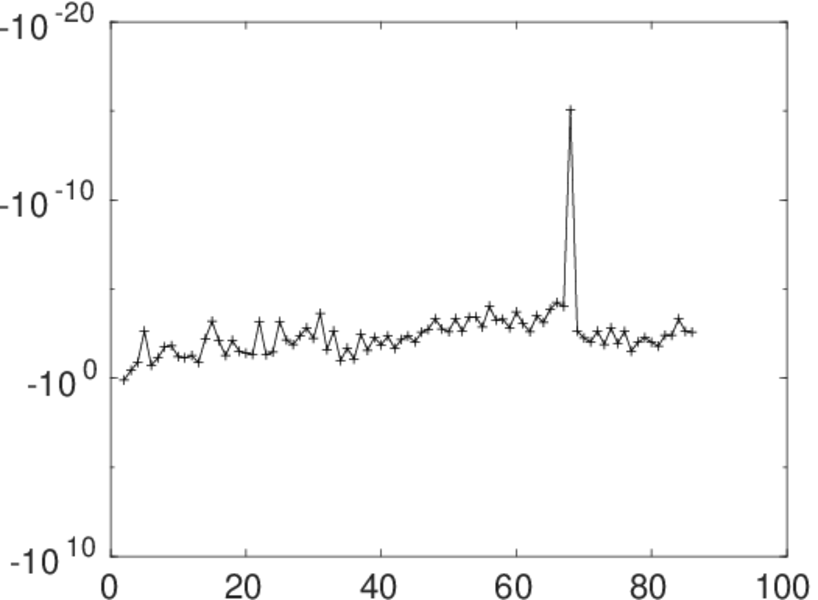
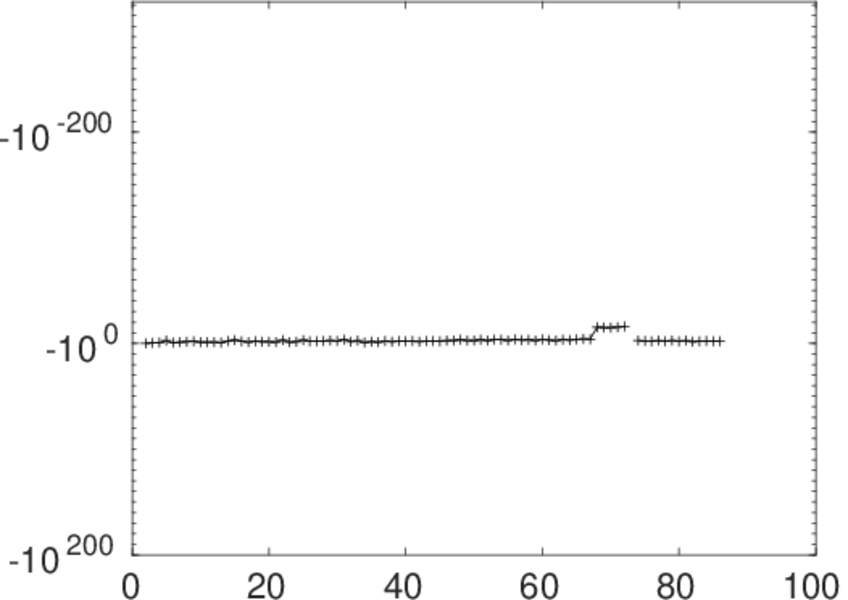
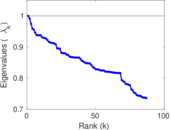
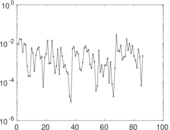
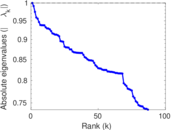
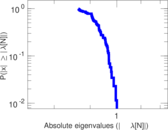
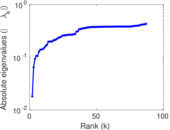
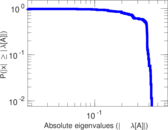
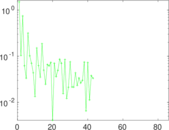
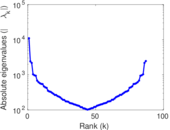
Matrix decompositions plots


Downloads
References
|
[1]
|
Jérôme Kunegis.
KONECT – The Koblenz Network Collection.
In Proc. Int. Conf. on World Wide Web Companion, pages
1343–1350, 2013.
[ http ]
|
|
[2]
|
Wikimedia Foundation.
Wikimedia downloads.
http://dumps.wikimedia.org/, January 2010.
|
 KONECT ‣ Networks ‣
Buy Me a Coffee
KONECT ‣ Networks ‣
Buy Me a Coffee