Wikibooks edits (fi)
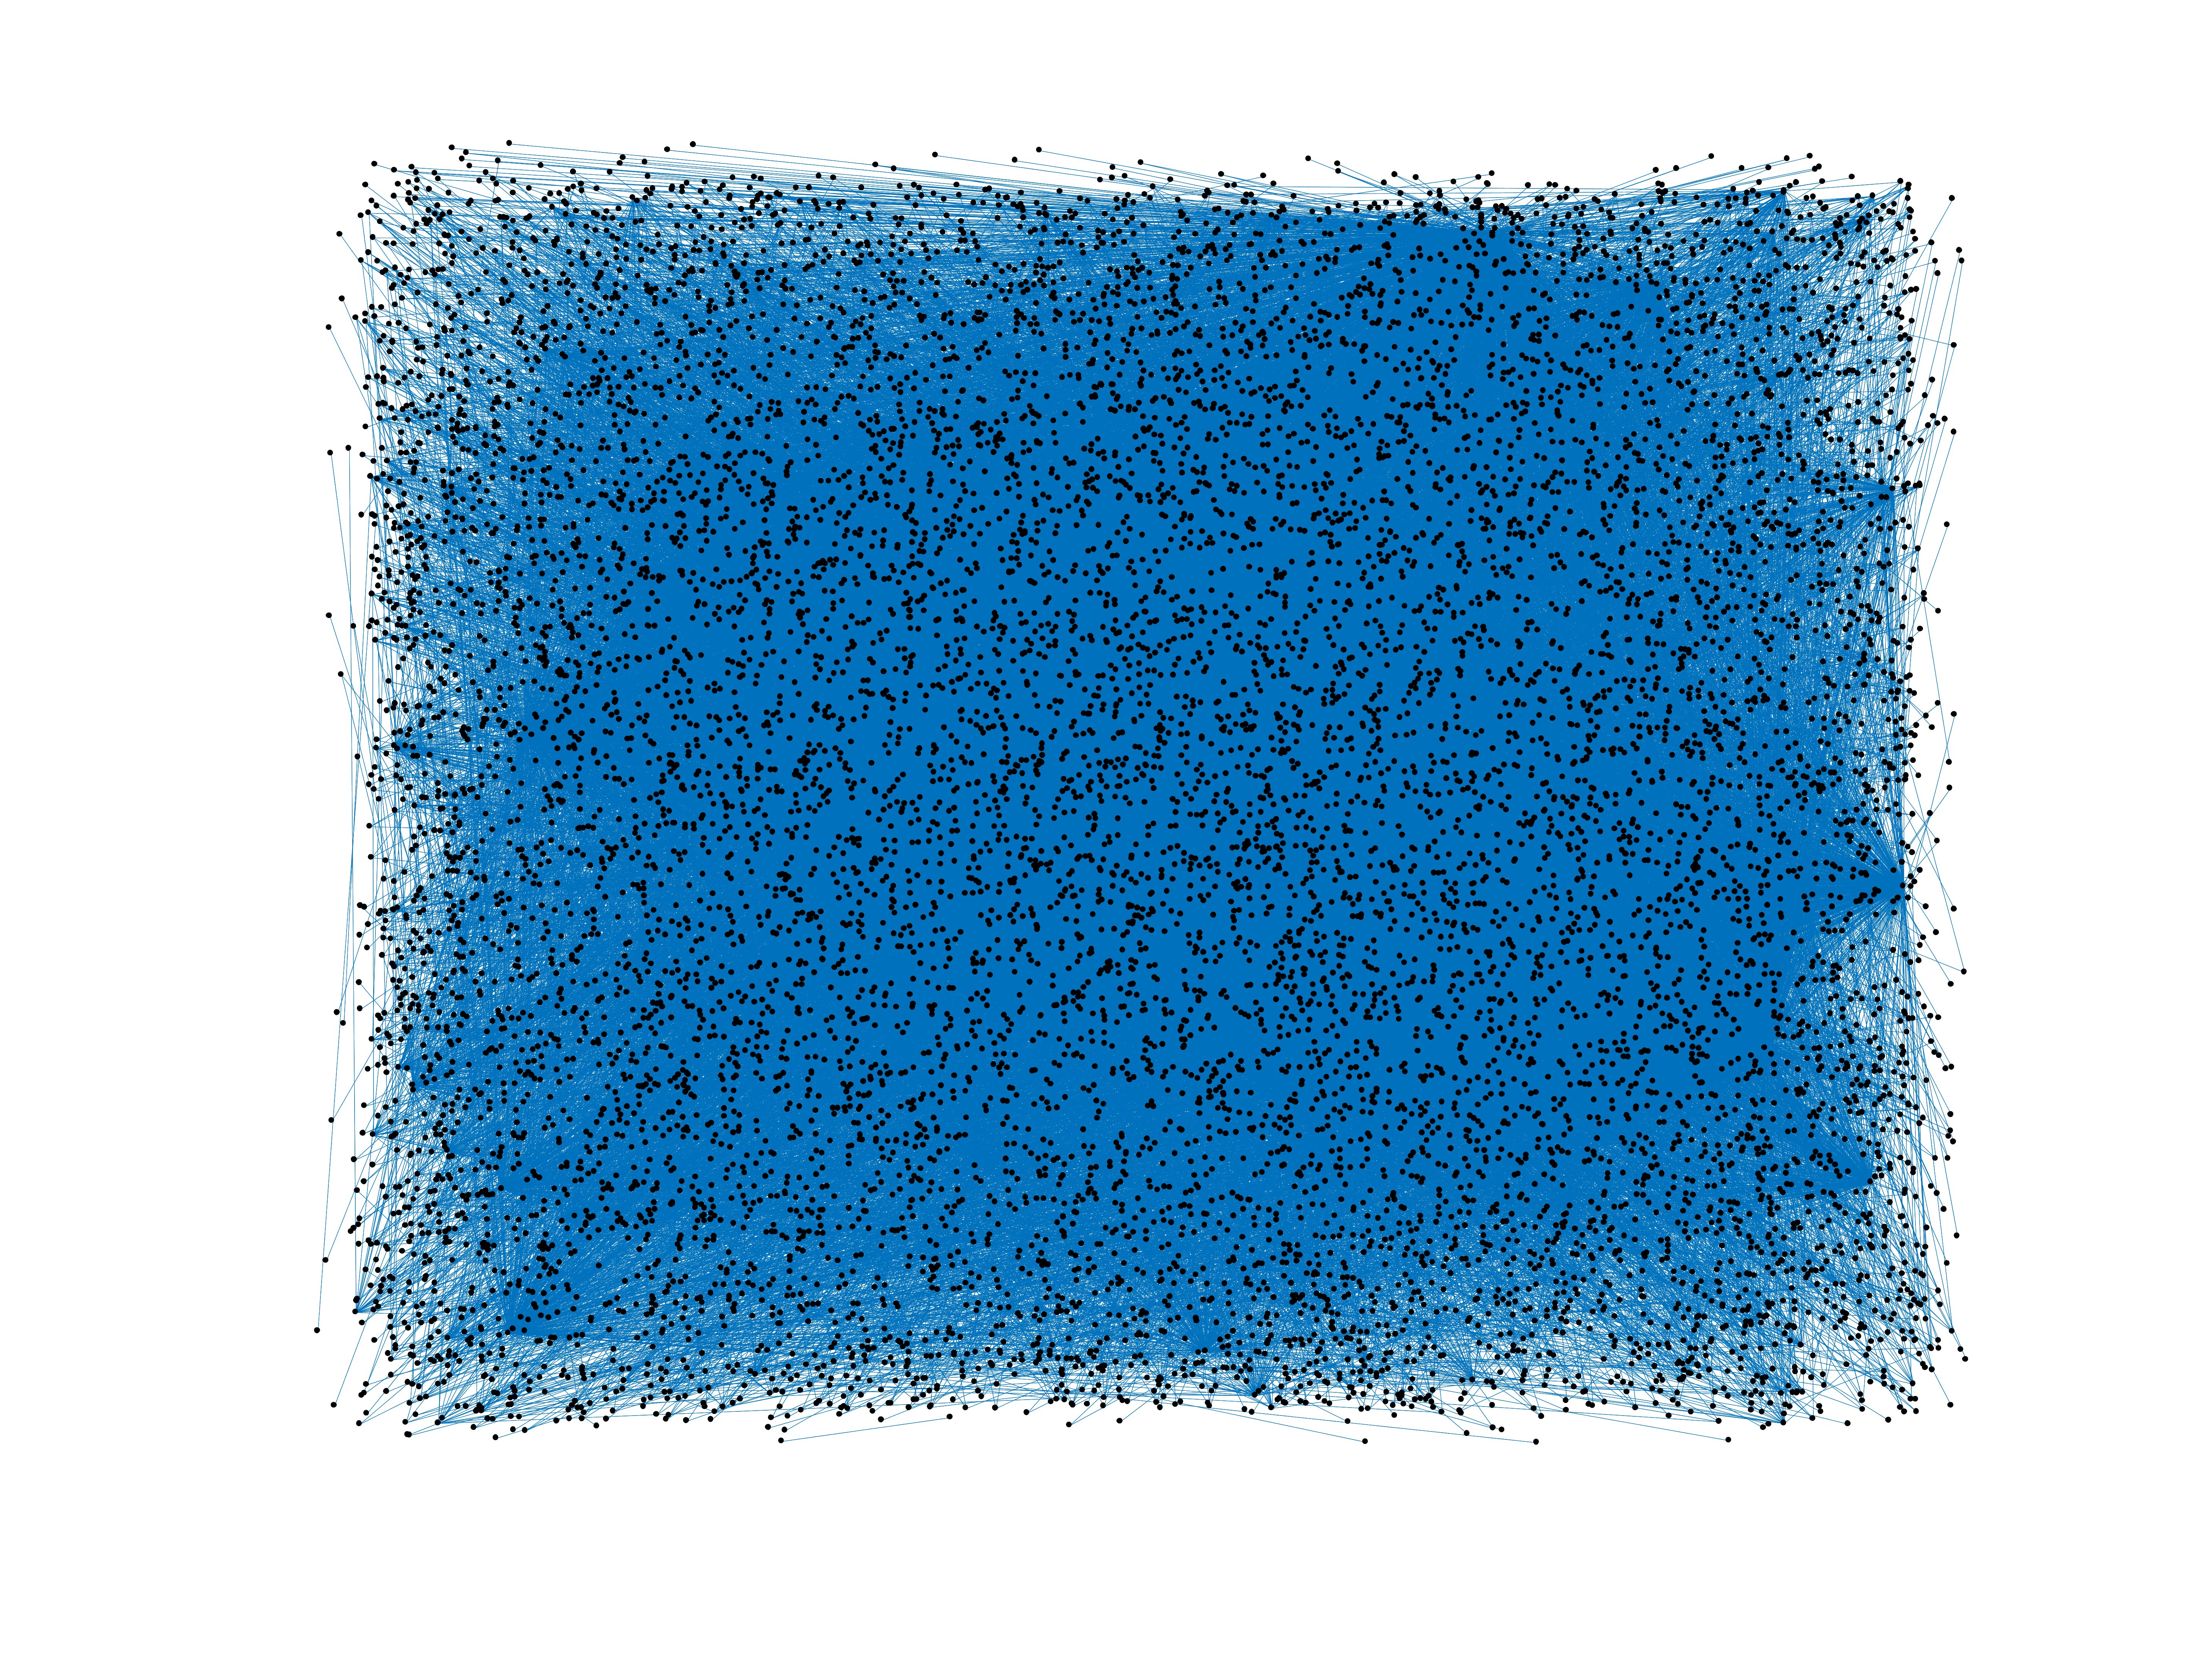
This is the bipartite edit network of the Finnish Wikibooks. It contains users
and pages from the Finnish Wikibooks, connected by edit events. Each edge
represents an edit. The dataset includes the timestamp of each edit.
Metadata
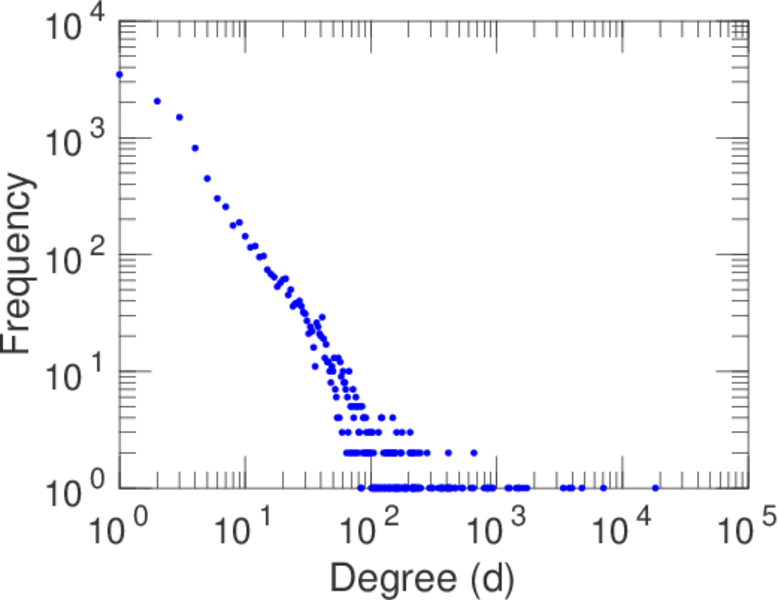
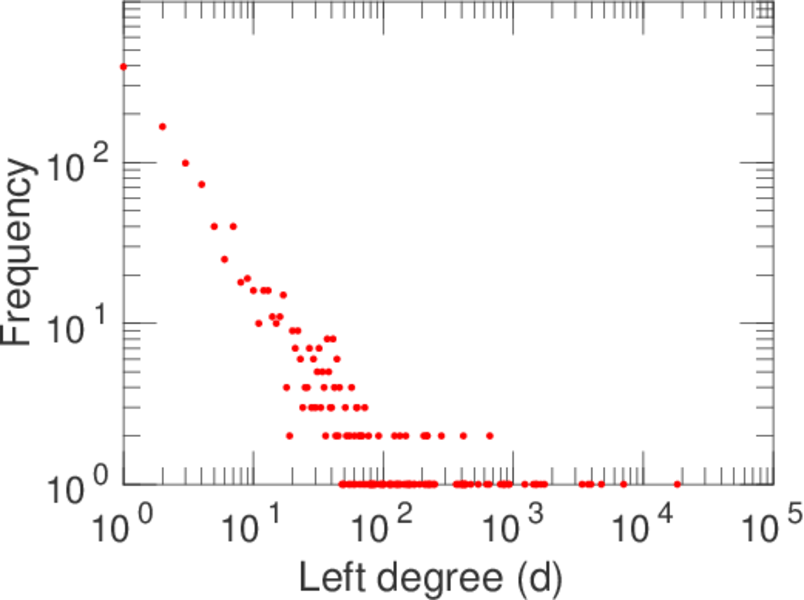
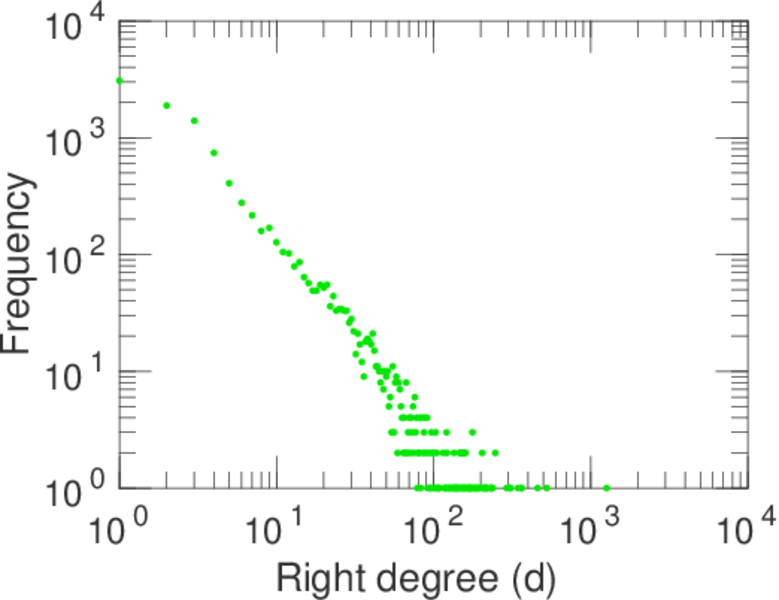
Statistics
| Size | n = | 11,769
|
| Left size | n1 = | 1,249
|
| Right size | n2 = | 10,520
|
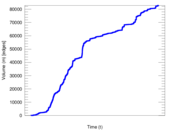
| Volume | m = | 82,866
|
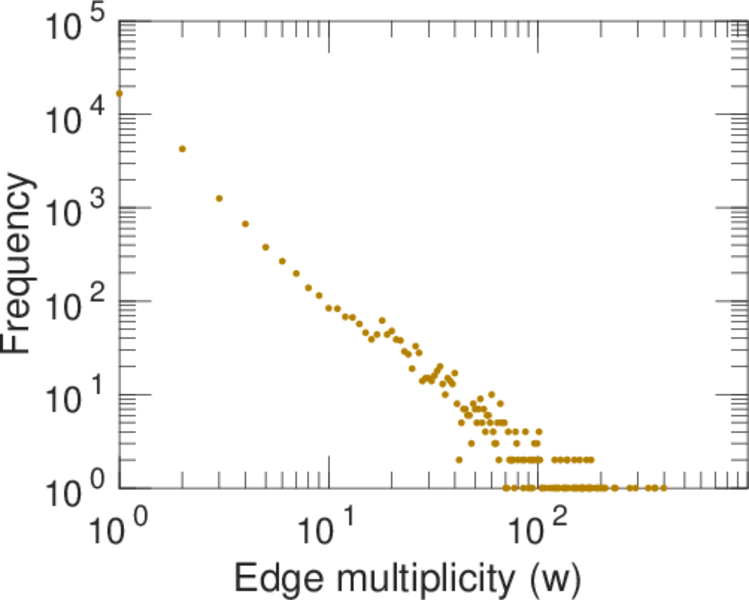
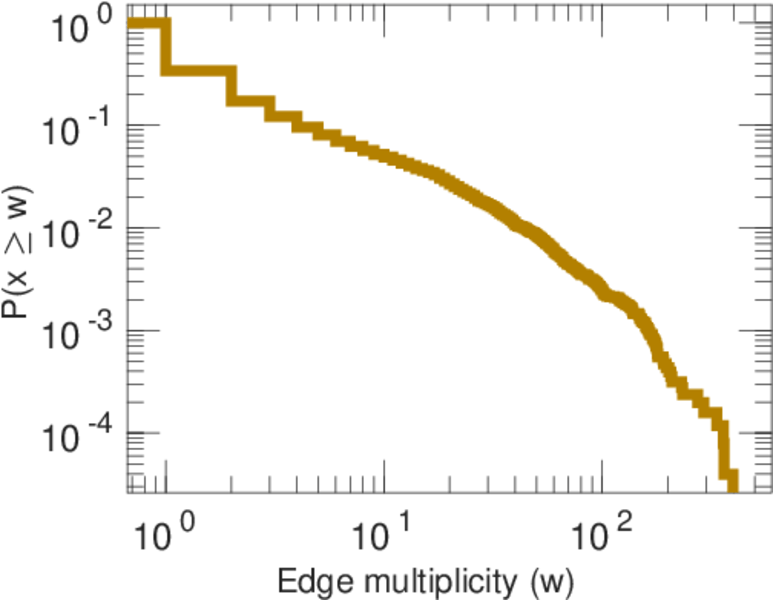
| Unique edge count | m̿ = | 25,319
|
| Wedge count | s = | 8,792,385
|
| Claw count | z = | 4,531,271,976
|
| Cross count | x = | 2,212,495,517,118
|
| Square count | q = | 1,855,178
|
| 4-Tour count | T4 = | 50,090,346
|
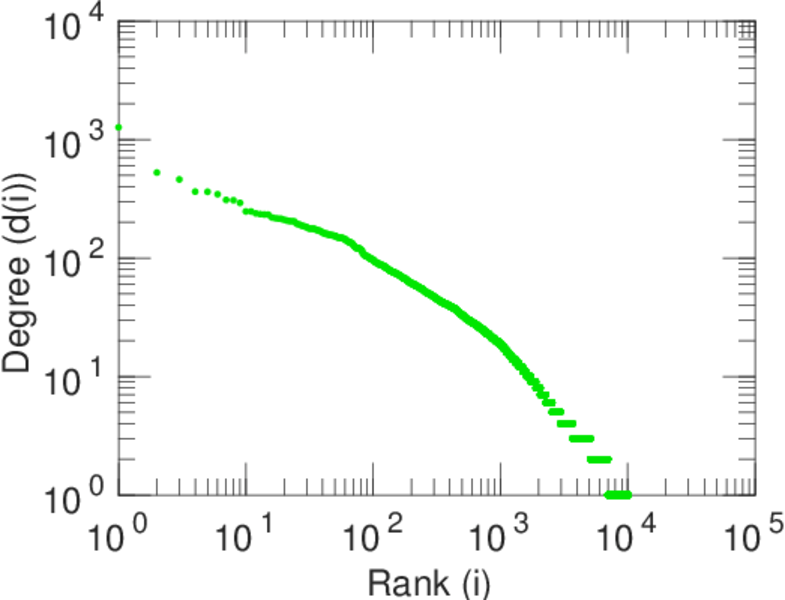
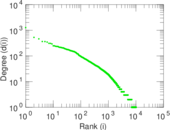
| Maximum degree | dmax = | 18,317
|
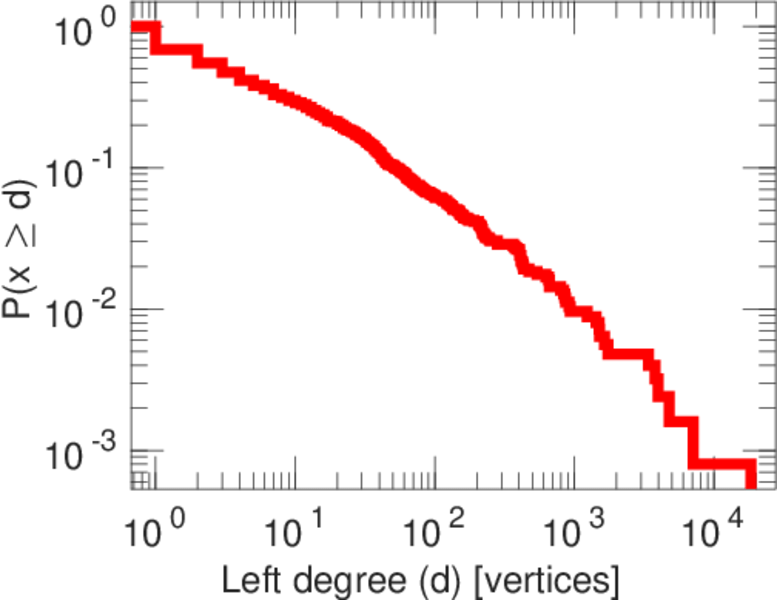
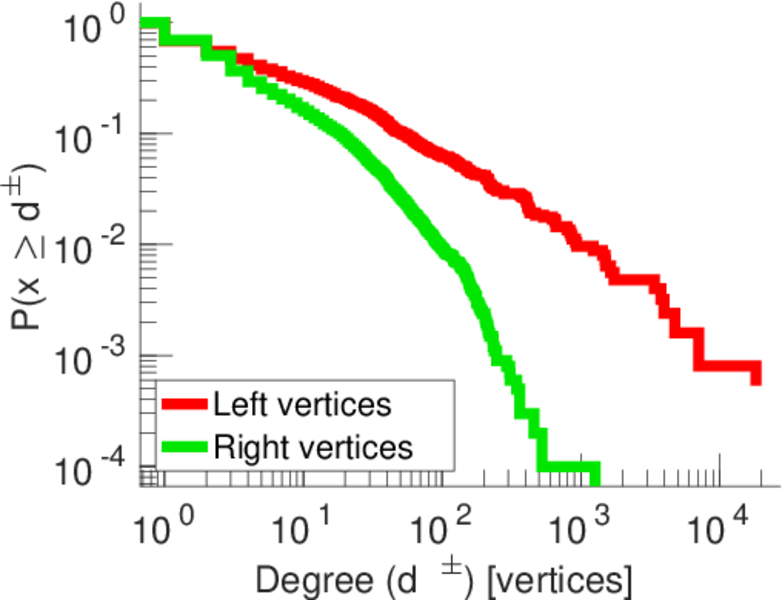
| Maximum left degree | d1max = | 18,317
|
| Maximum right degree | d2max = | 1,266
|
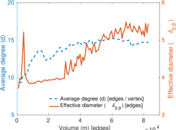
| Average degree | d = | 14.082 1
|
| Average left degree | d1 = | 66.345 9
|
| Average right degree | d2 = | 7.877 00
|
| Fill | p = | 0.001 926 94
|
| Average edge multiplicity | m̃ = | 3.272 88
|
| Size of LCC | N = | 10,934
|
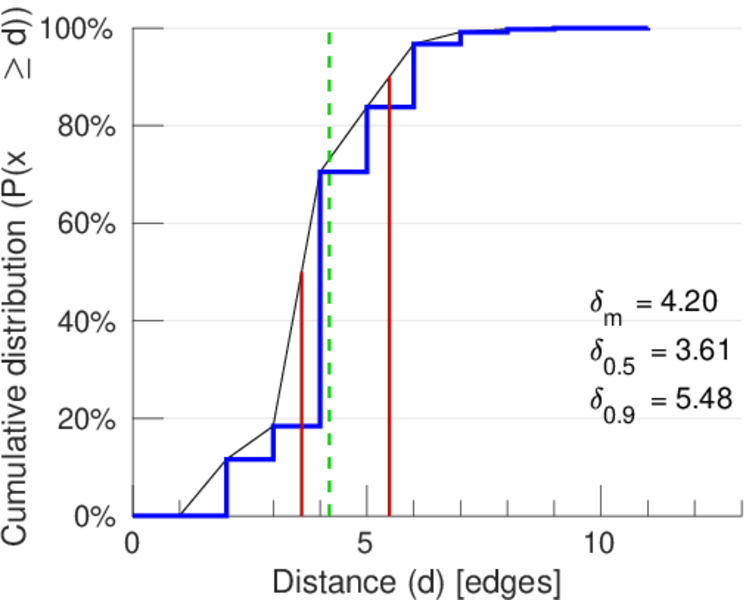
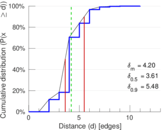
| Diameter | δ = | 13
|
| 50-Percentile effective diameter | δ0.5 = | 3.606 63
|
| 90-Percentile effective diameter | δ0.9 = | 5.480 42
|
| Median distance | δM = | 4
|
| Mean distance | δm = | 4.200 50
|
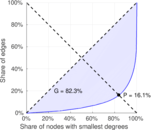
| Gini coefficient | G = | 0.829 337
|
| Balanced inequality ratio | P = | 0.158 618
|
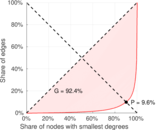
| Left balanced inequality ratio | P1 = | 0.095 998 4
|
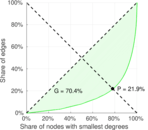
| Right balanced inequality ratio | P2 = | 0.218 594
|
| Relative edge distribution entropy | Her = | 0.798 832
|
| Power law exponent | γ = | 2.501 65
|
| Tail power law exponent | γt = | 2.281 00
|
| Tail power law exponent with p | γ3 = | 2.281 00
|
| p-value | p = | 0.000 00
|
| Left tail power law exponent with p | γ3,1 = | 1.641 00
|
| Left p-value | p1 = | 0.310 000
|
| Right tail power law exponent with p | γ3,2 = | 2.681 00
|
| Right p-value | p2 = | 0.000 00
|
| Degree assortativity | ρ = | −0.209 454
|
| Degree assortativity p-value | pρ = | 5.570 77 × 10−249
|
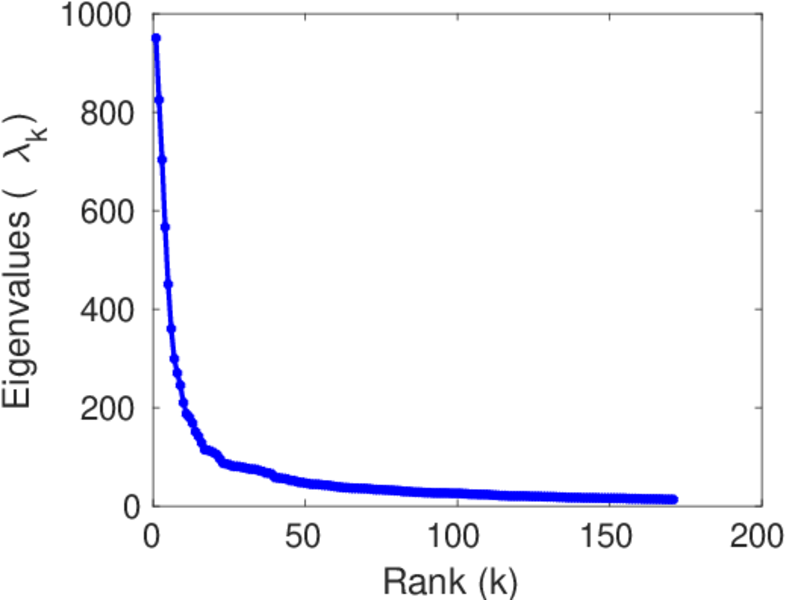
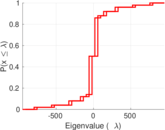
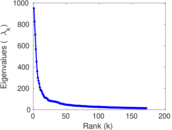
| Spectral norm | α = | 950.468
|
| Algebraic connectivity | a = | 0.029 756 3
|
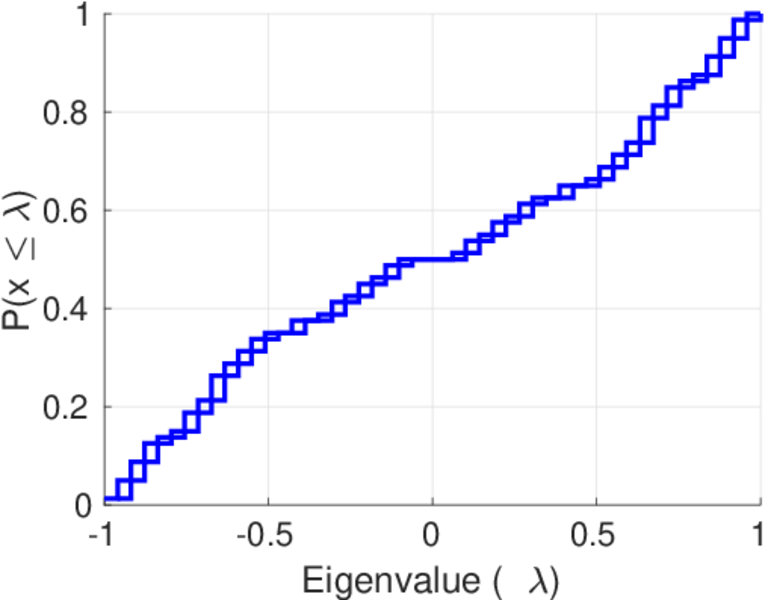
| Spectral separation | |λ1[A] / λ2[A]| = | 1.152 52
|
| Controllability | C = | 9,146
|
| Relative controllability | Cr = | 0.808 736
|
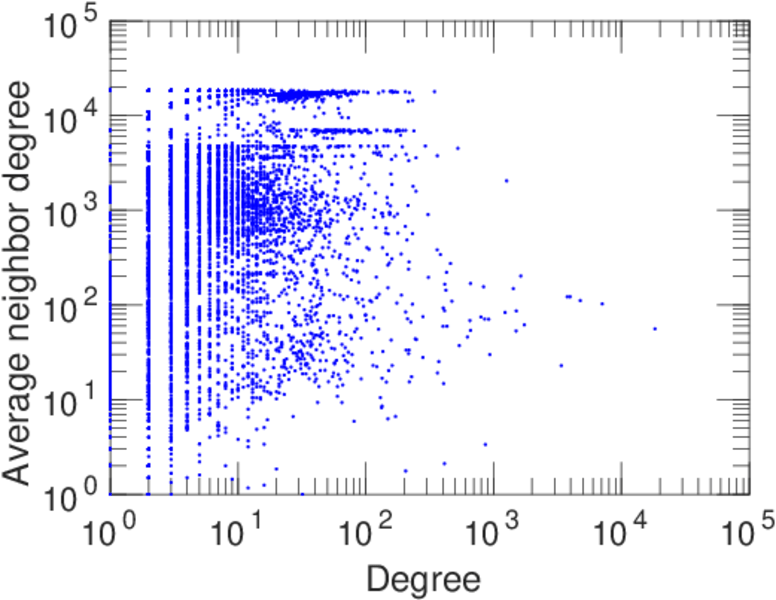
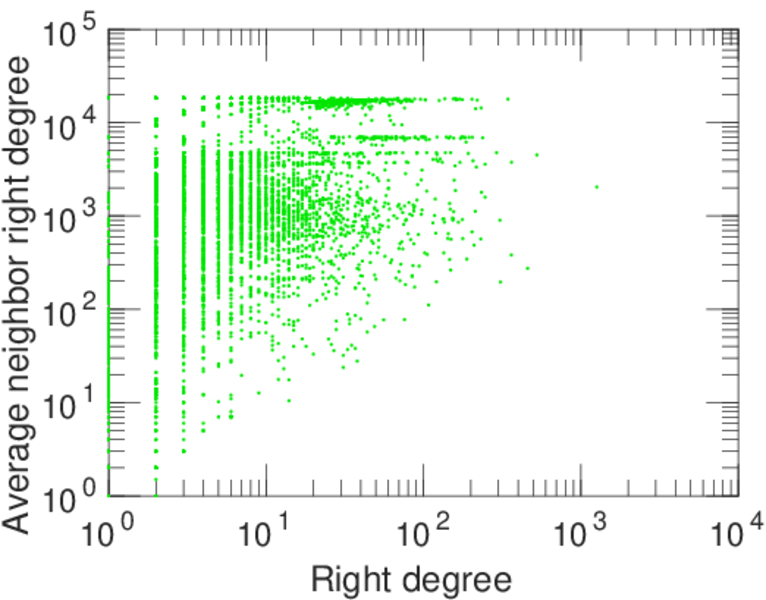
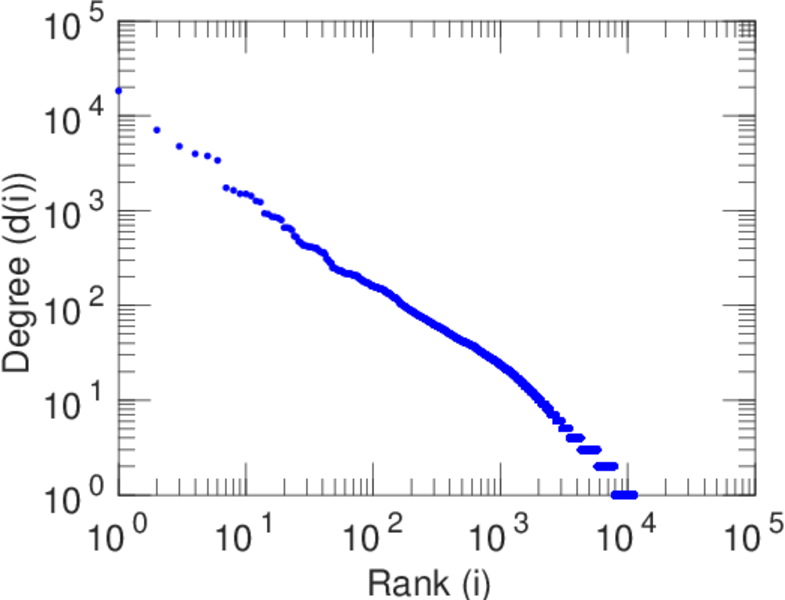
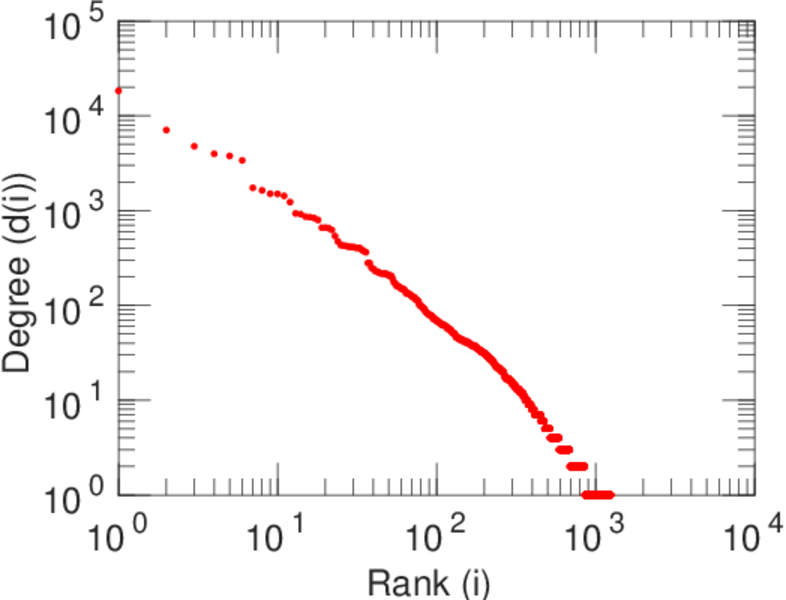
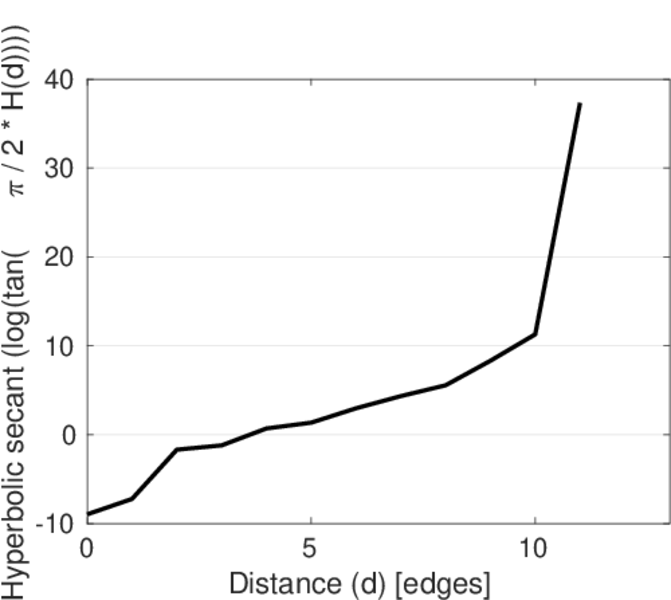
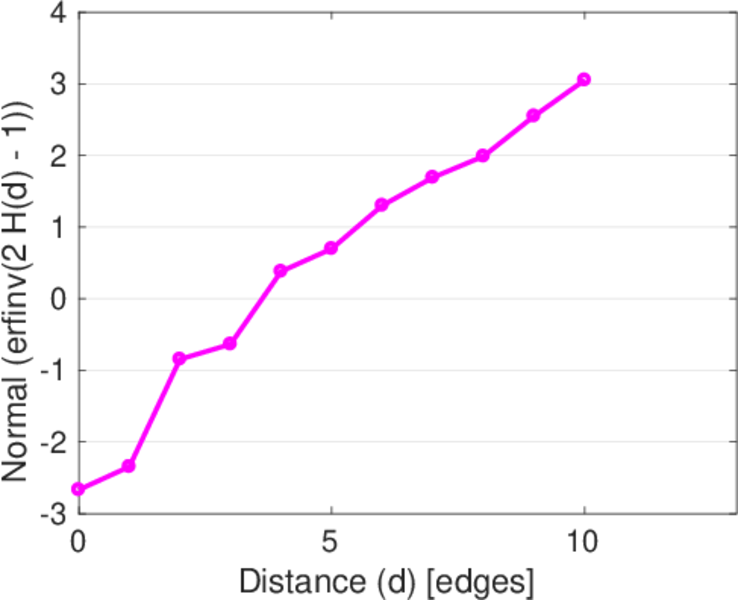
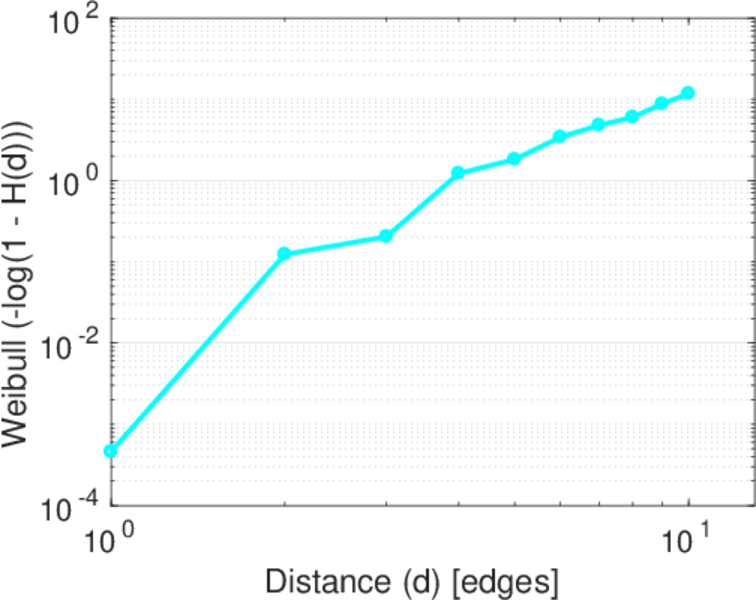
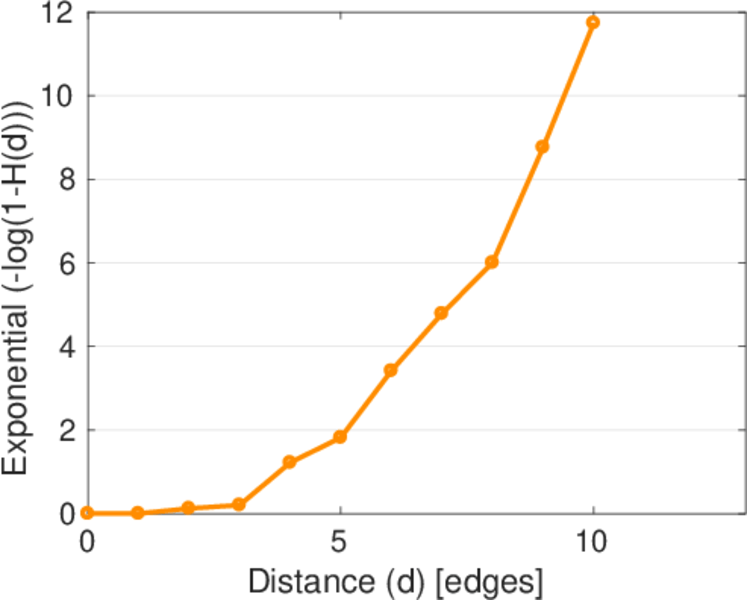
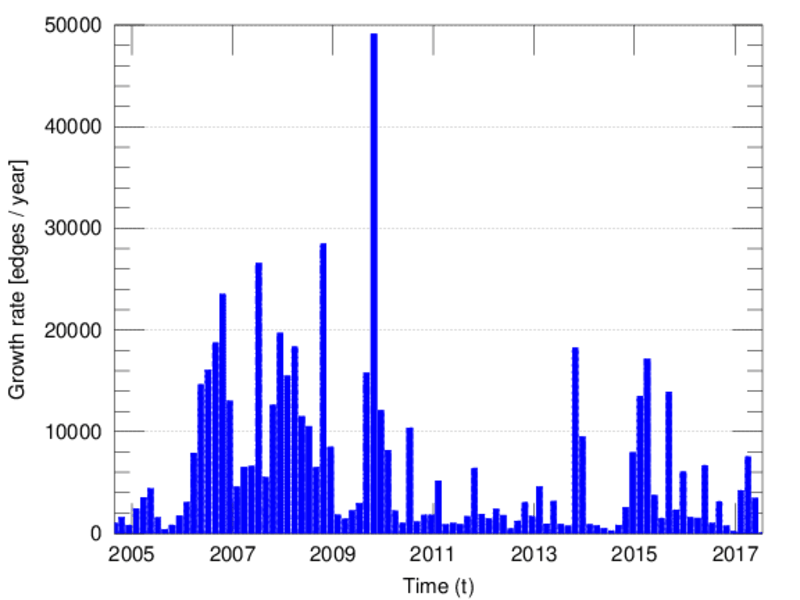
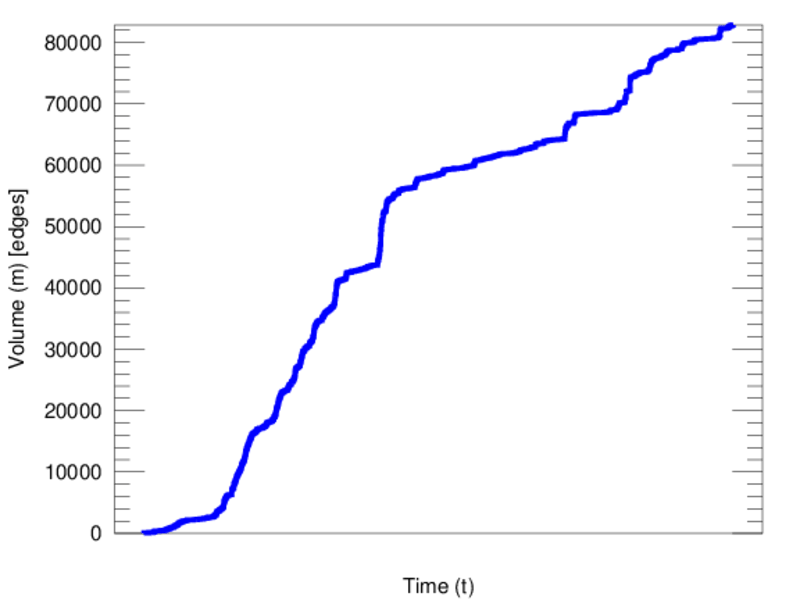
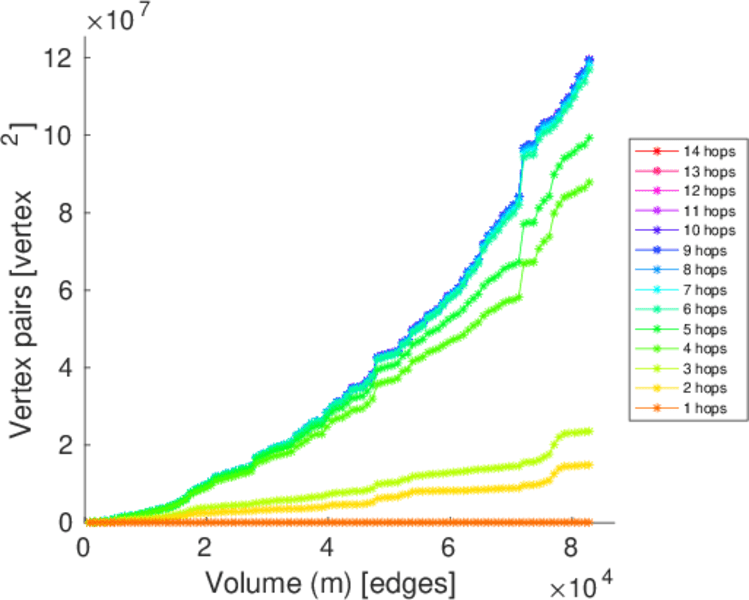
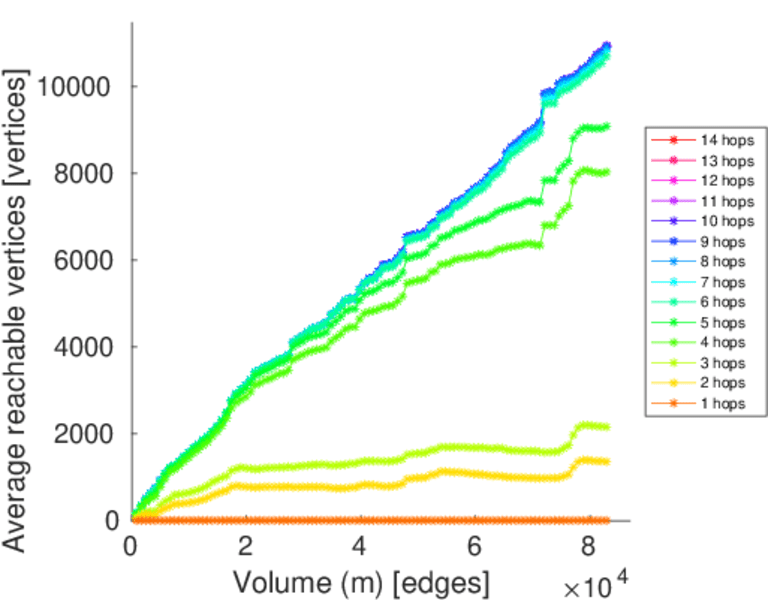
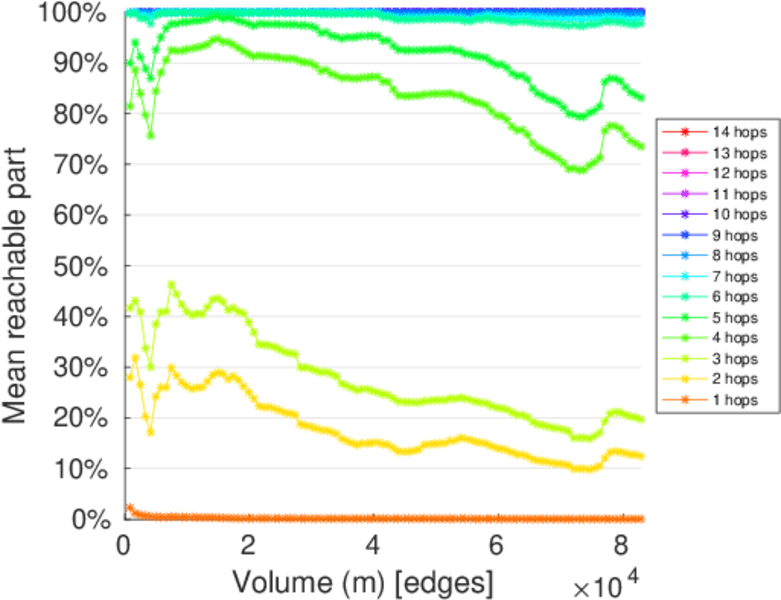
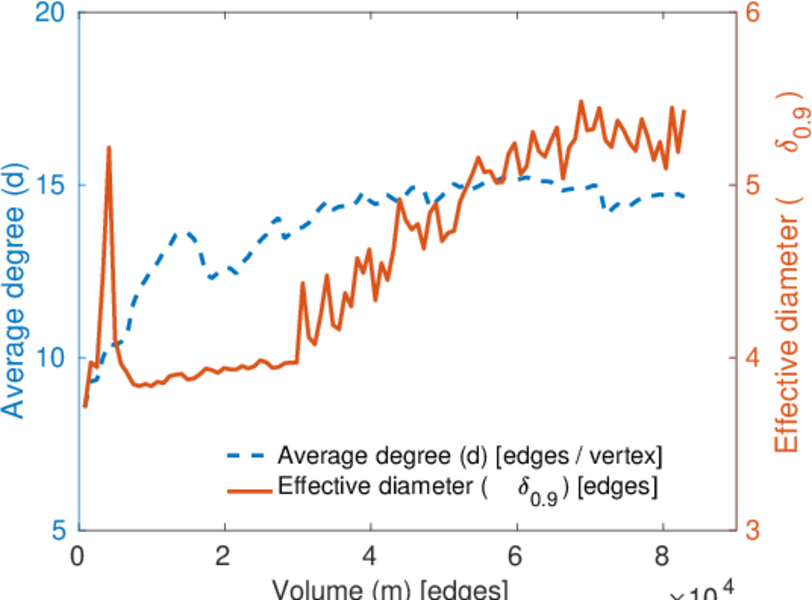
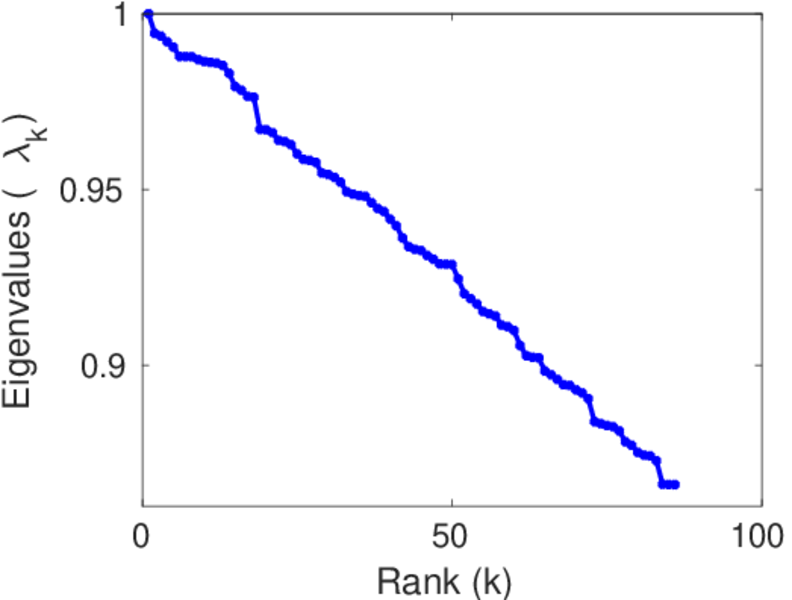
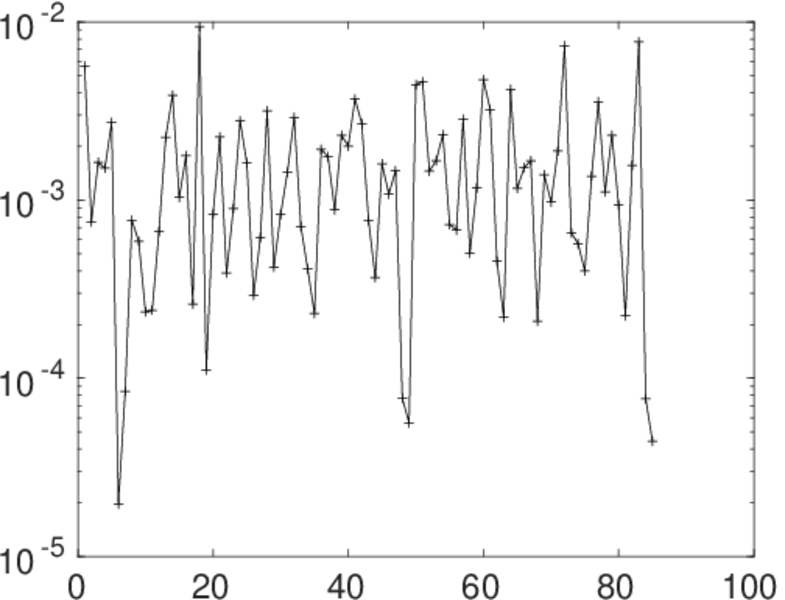
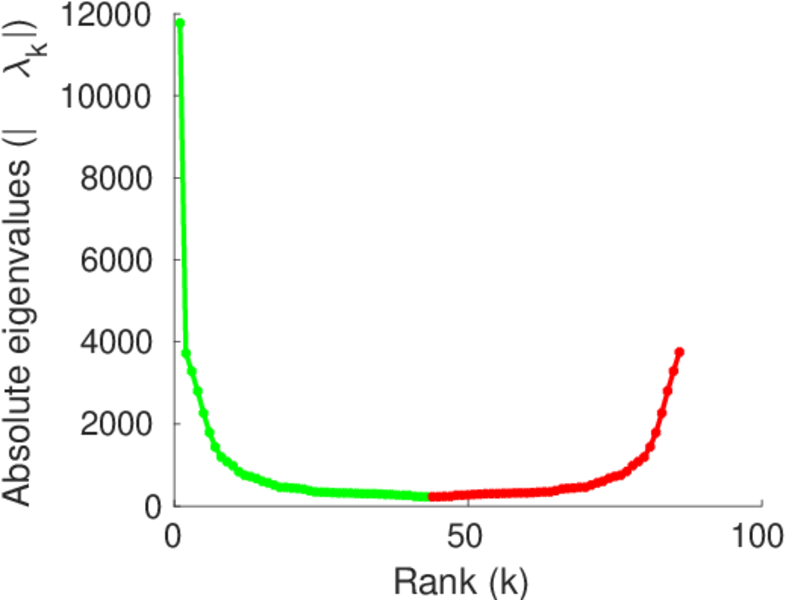
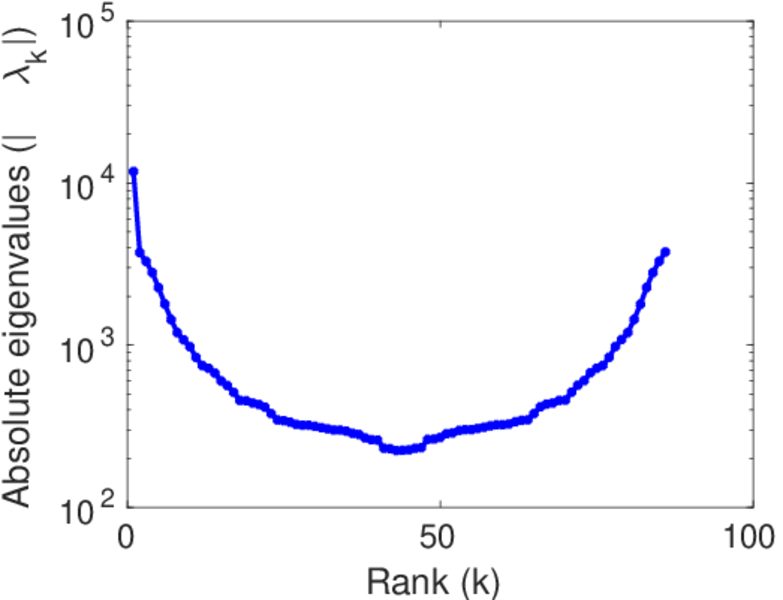
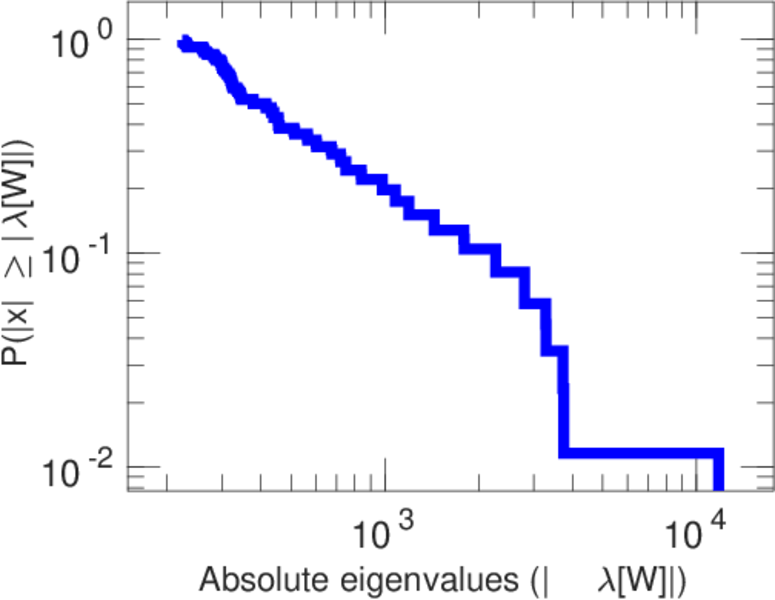
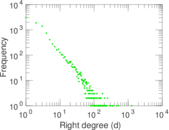
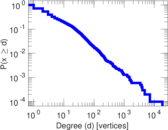
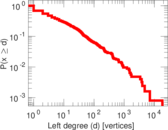
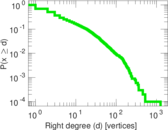
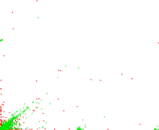
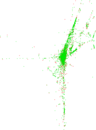
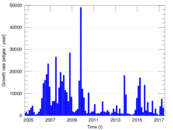
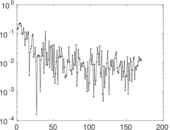
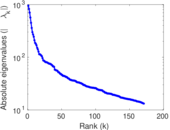
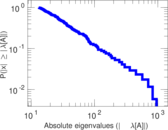
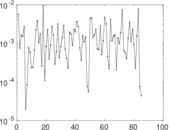
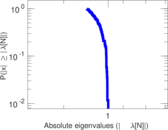
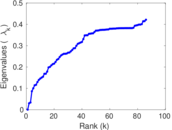
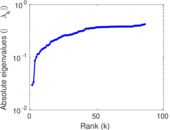
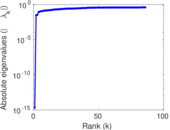
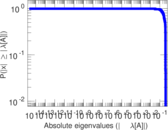
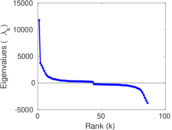
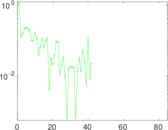
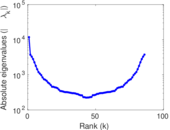
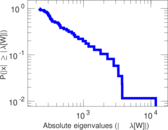
Plots


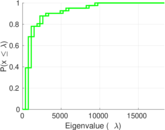


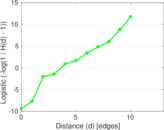

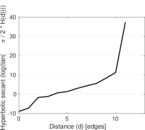
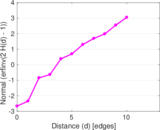


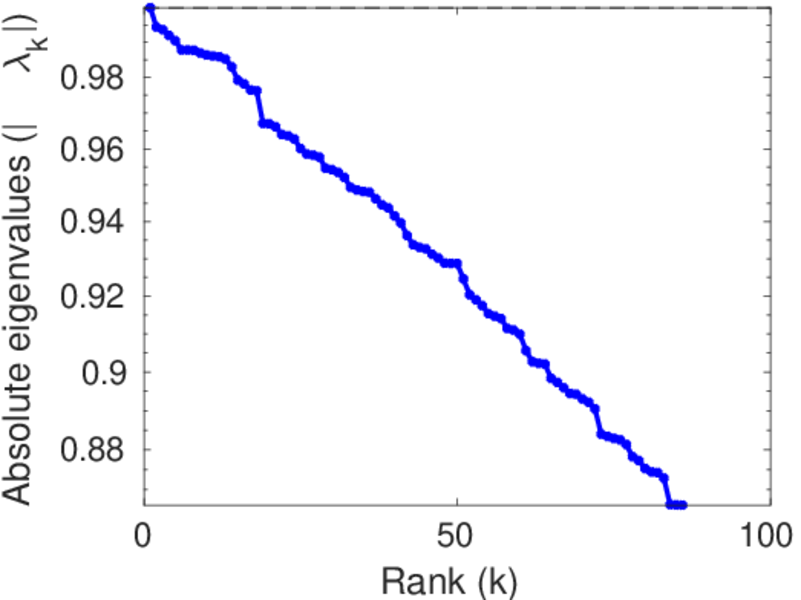
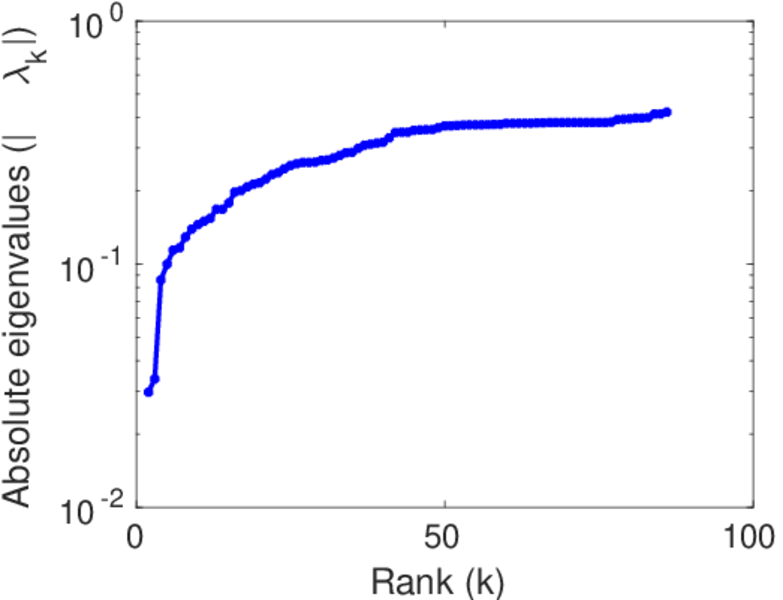
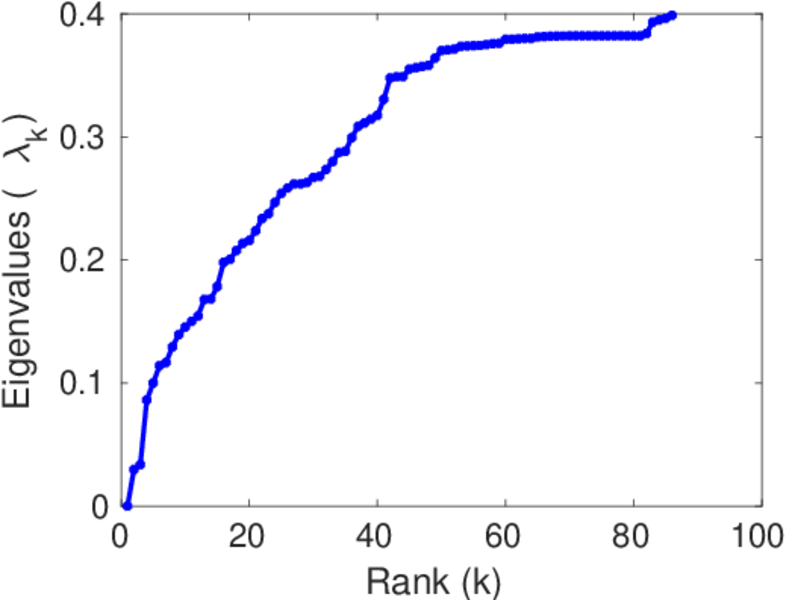
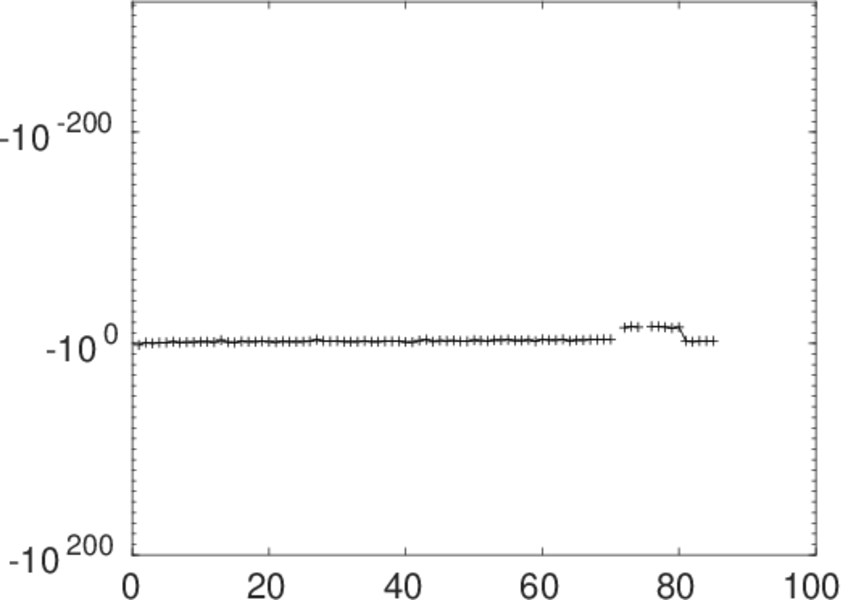
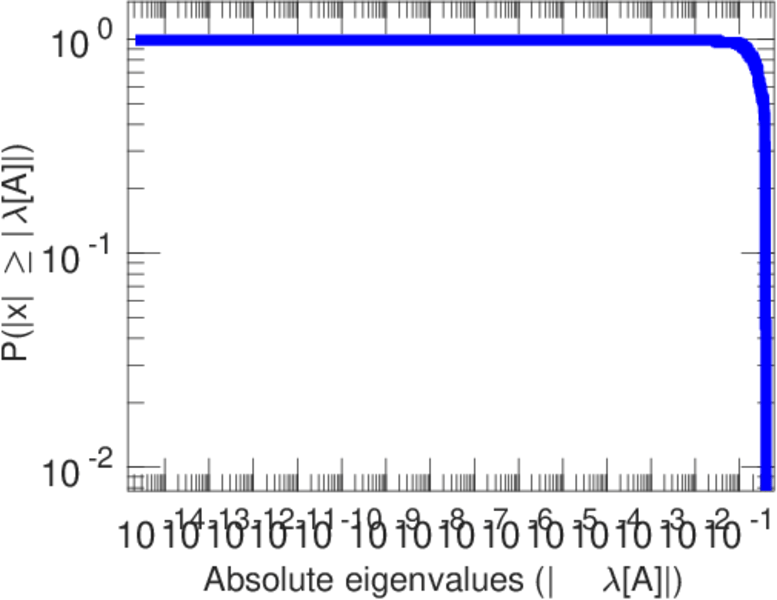
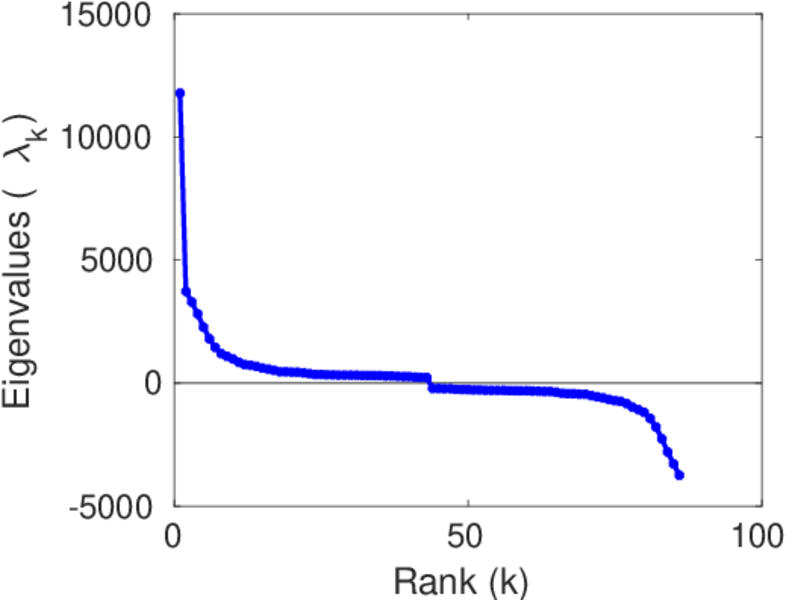
Matrix decompositions plots


Downloads
References
|
[1]
|
Jérôme Kunegis.
KONECT – The Koblenz Network Collection.
In Proc. Int. Conf. on World Wide Web Companion, pages
1343–1350, 2013.
[ http ]
|
|
[2]
|
Wikimedia Foundation.
Wikimedia downloads.
http://dumps.wikimedia.org/, January 2010.
|
 KONECT ‣ Networks ‣
Buy Me a Coffee
KONECT ‣ Networks ‣
Buy Me a Coffee