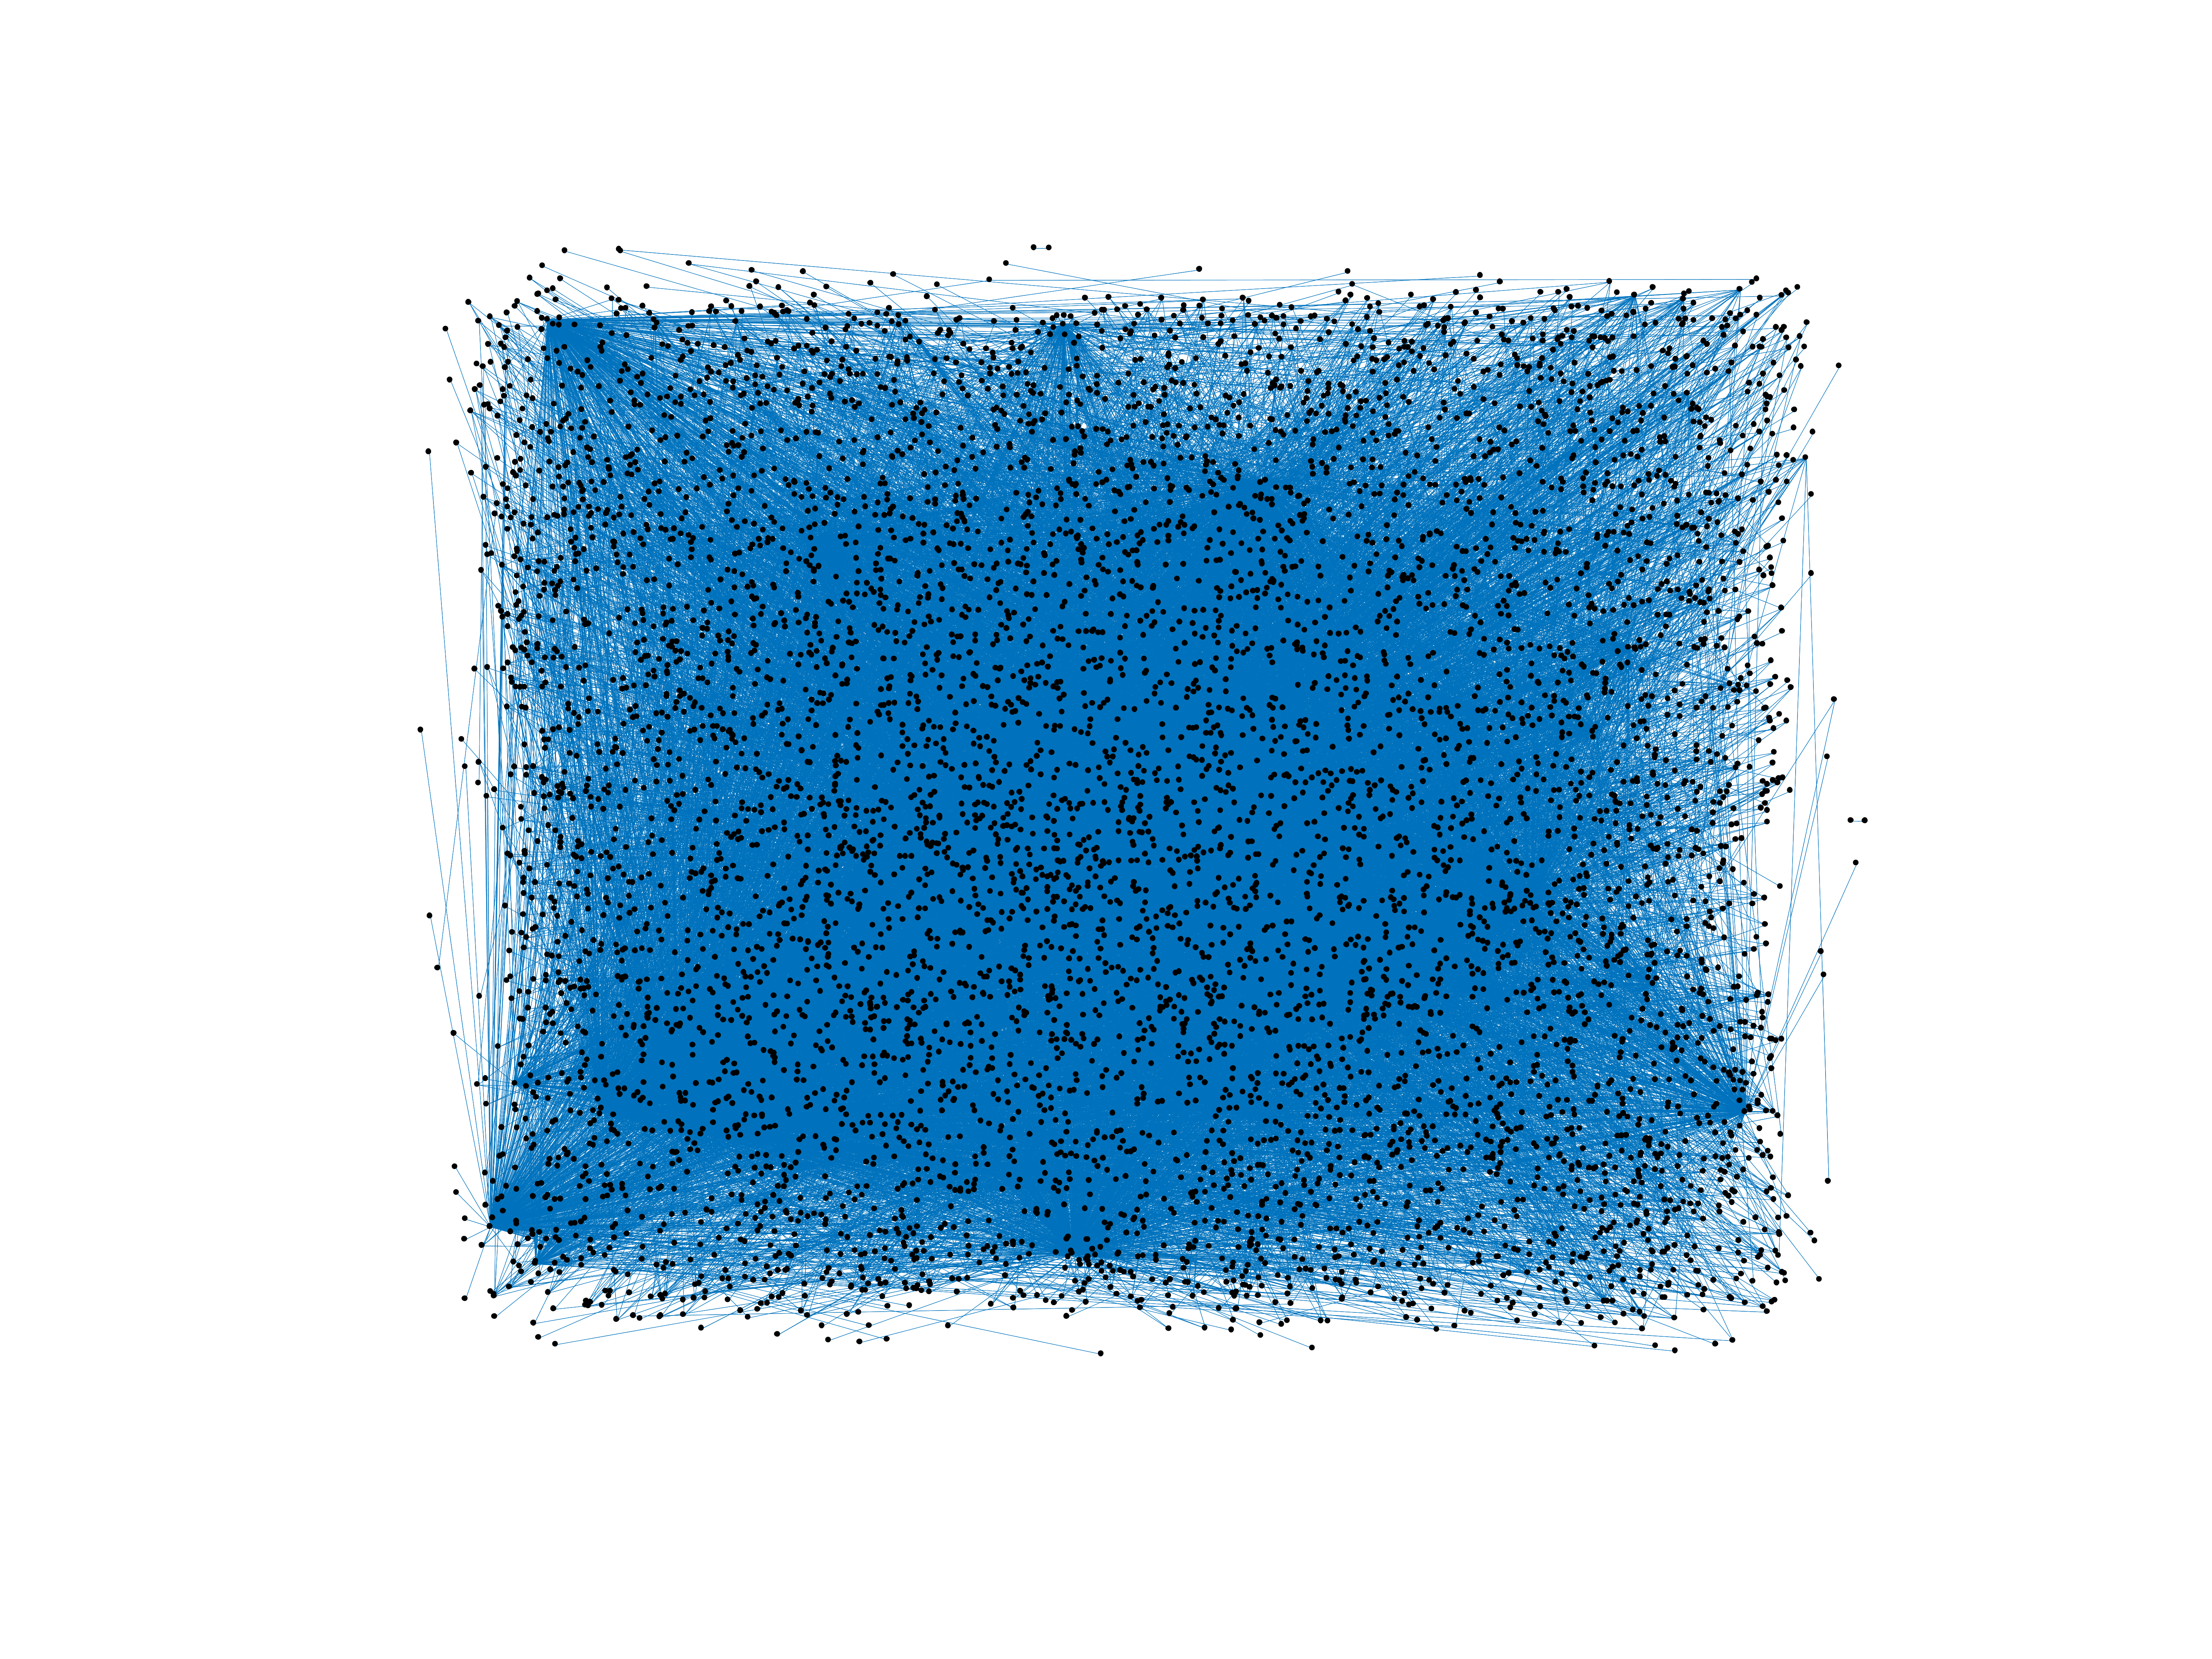
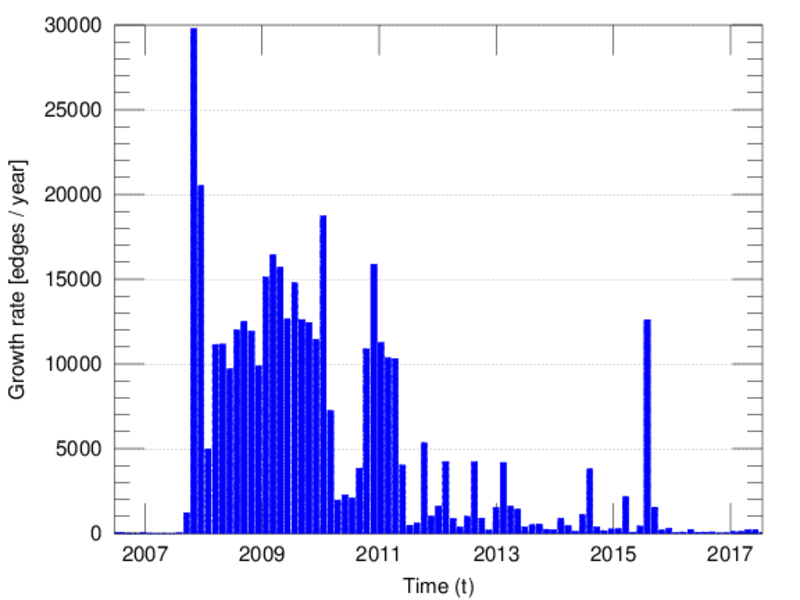
Wikinews edits (fi)
This is the bipartite edit network of the Finnish Wikinews. It contains users
and pages from the Finnish Wikinews, connected by edit events. Each edge
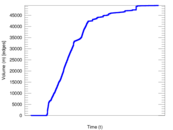
represents an edit. The dataset includes the timestamp of each edit.
Metadata
Statistics
| Size | n = | 6,866
|
| Left size | n1 = | 537
|
| Right size | n2 = | 6,329
|
| Volume | m = | 49,470
|
| Unique edge count | m̿ = | 16,410
|
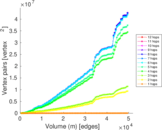
| Wedge count | s = | 6,993,580
|
| Claw count | z = | 3,147,613,907
|
| Cross count | x = | 1,233,083,036,728
|
| Square count | q = | 3,340,536
|
| 4-Tour count | T4 = | 54,739,180
|
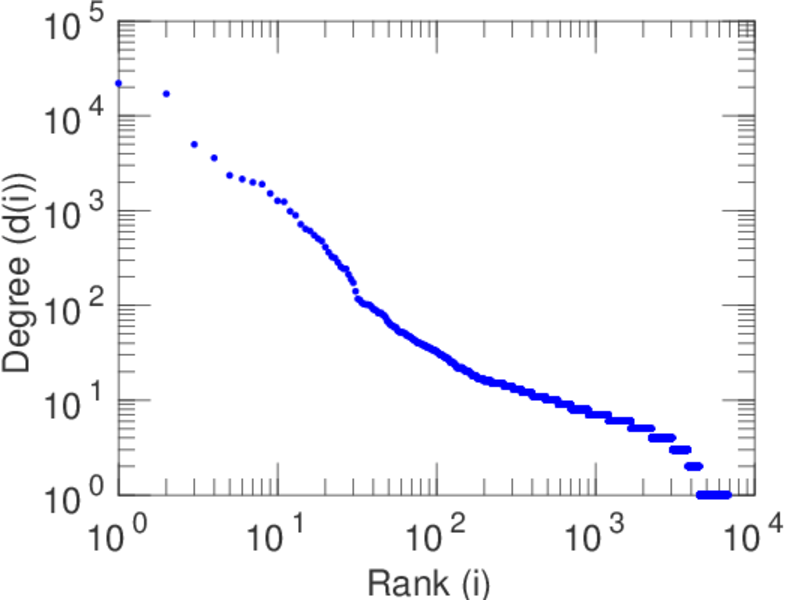
| Maximum degree | dmax = | 22,028
|
| Maximum left degree | d1max = | 17,041
|
| Maximum right degree | d2max = | 22,028
|
| Average degree | d = | 14.410 1
|
| Average left degree | d1 = | 92.122 9
|
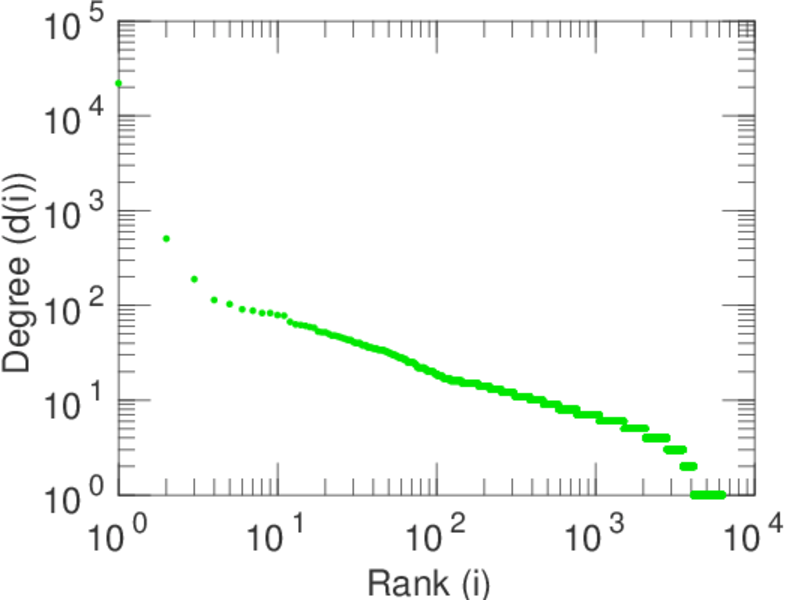
| Average right degree | d2 = | 7.816 40
|
| Fill | p = | 0.004 828 36
|
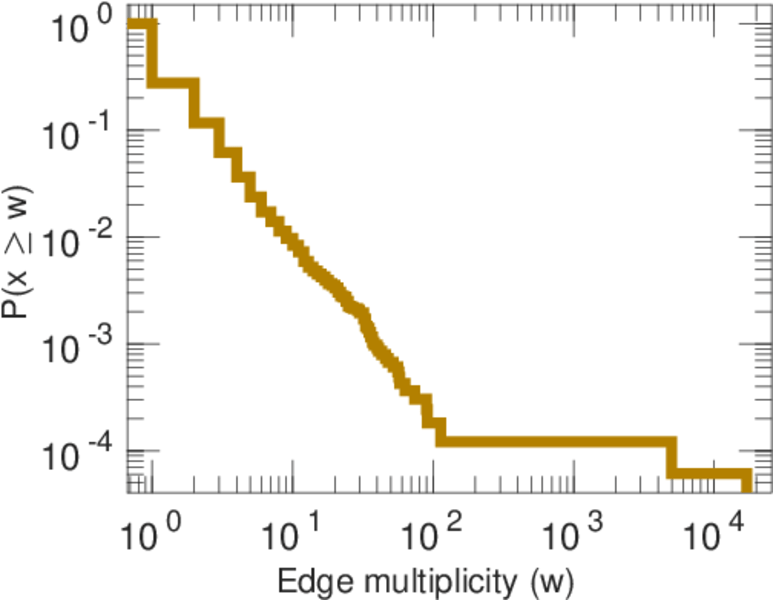
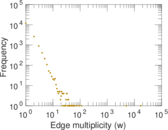
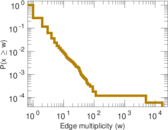
| Average edge multiplicity | m̃ = | 3.014 63
|
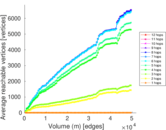
| Size of LCC | N = | 6,528
|
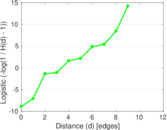
| Diameter | δ = | 12
|
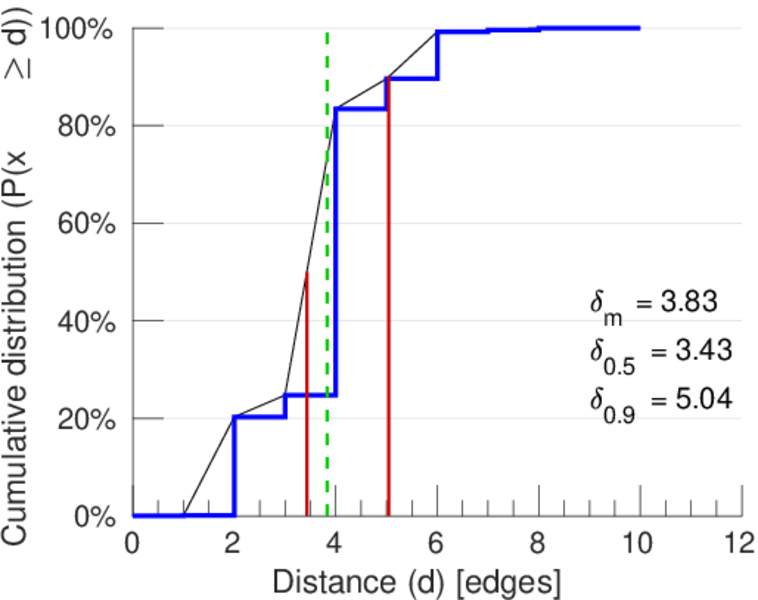
| 50-Percentile effective diameter | δ0.5 = | 3.430 14
|
| 90-Percentile effective diameter | δ0.9 = | 5.042 92
|
| Median distance | δM = | 4
|
| Mean distance | δm = | 3.830 70
|
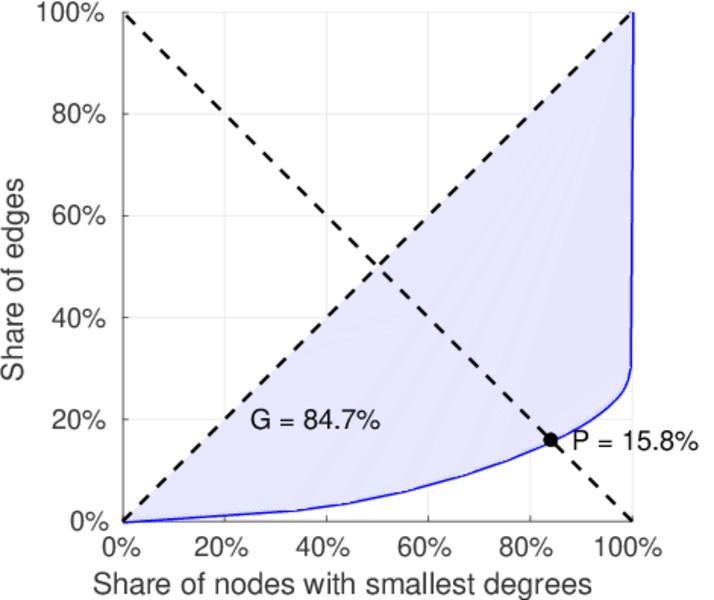
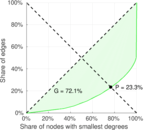
| Gini coefficient | G = | 0.851 176
|
| Balanced inequality ratio | P = | 0.152 961
|
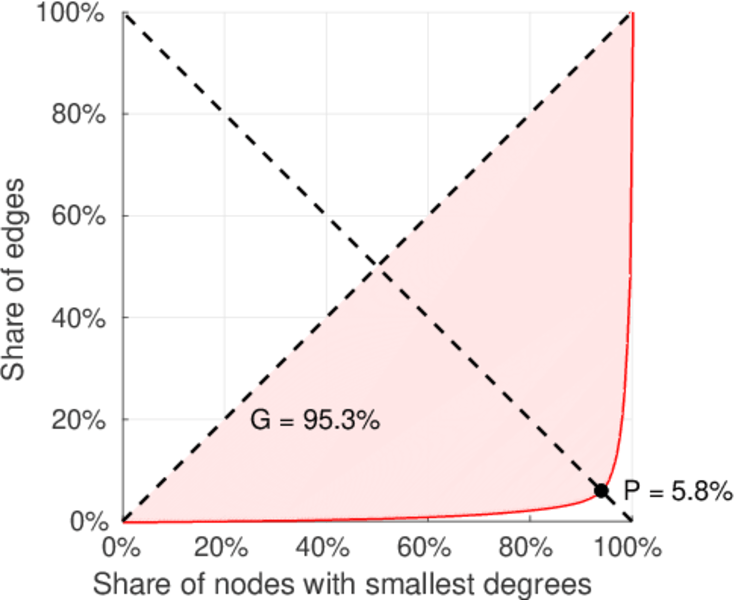
| Left balanced inequality ratio | P1 = | 0.058 479 9
|
| Right balanced inequality ratio | P2 = | 0.232 767
|
| Relative edge distribution entropy | Her = | 0.767 936
|
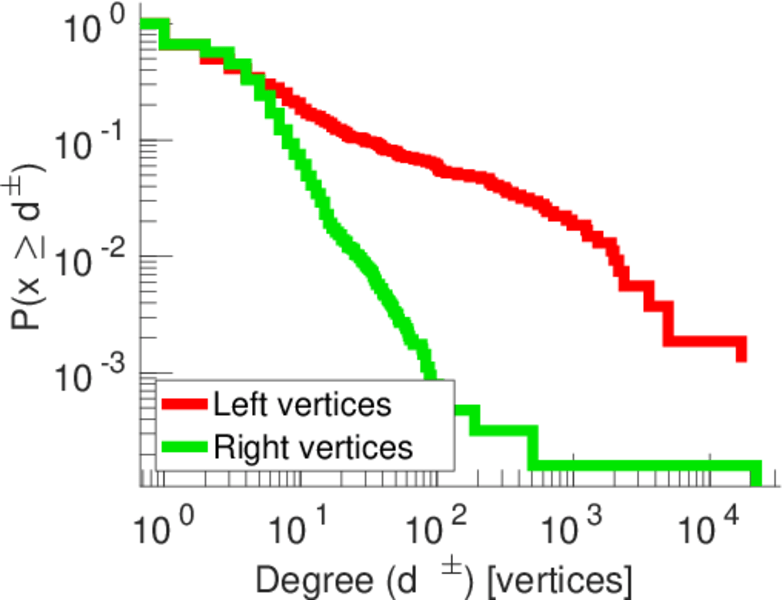
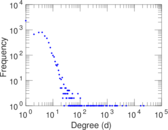
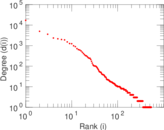
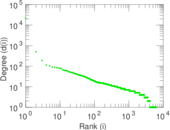
| Power law exponent | γ = | 2.349 74
|
| Tail power law exponent | γt = | 3.241 00
|
| Tail power law exponent with p | γ3 = | 3.241 00
|
| p-value | p = | 0.000 00
|
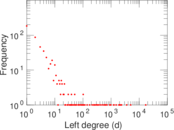
| Left tail power law exponent with p | γ3,1 = | 1.641 00
|
| Left p-value | p1 = | 0.192 000
|
| Right tail power law exponent with p | γ3,2 = | 5.021 00
|
| Right p-value | p2 = | 0.092 000 0
|
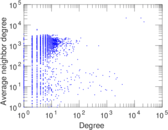
| Degree assortativity | ρ = | −0.159 719
|
| Degree assortativity p-value | pρ = | 3.300 94 × 10−94
|
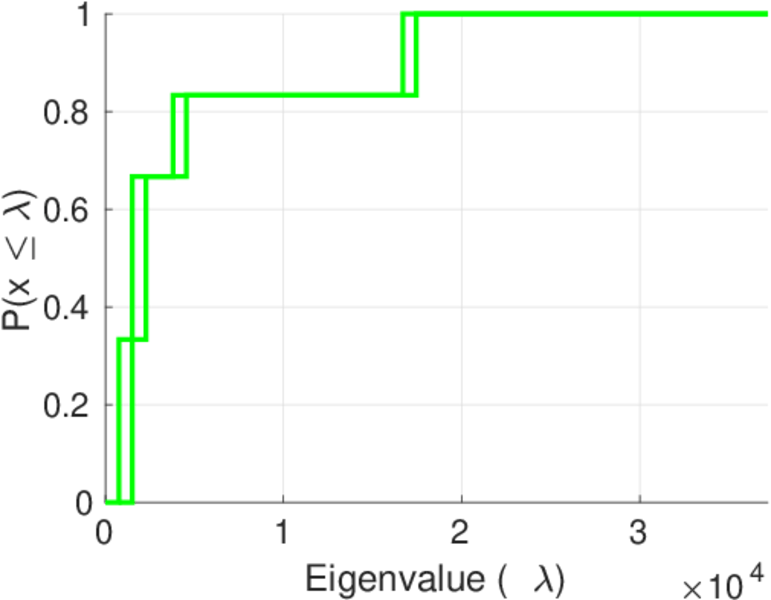
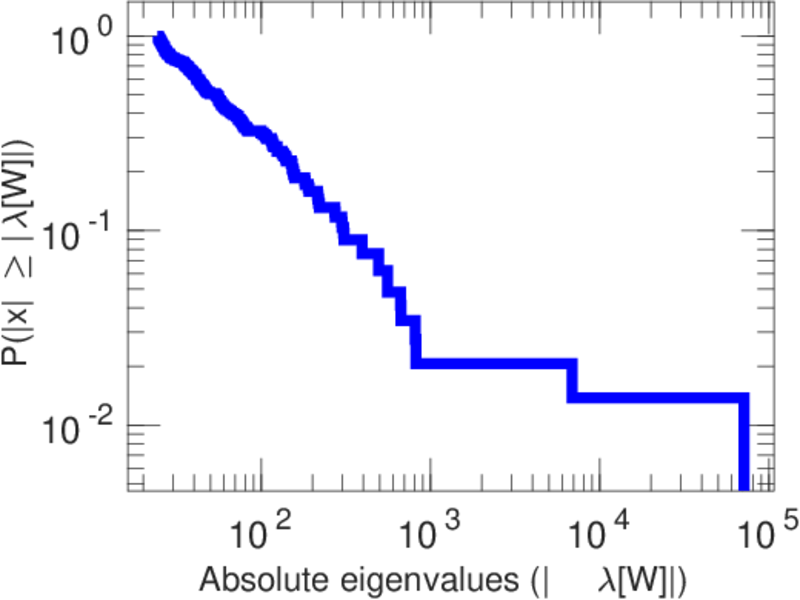
| Spectral norm | α = | 17,752.6
|
| Algebraic connectivity | a = | 0.025 241 5
|
| Spectral separation | |λ1[A] / λ2[A]| = | 84.874 2
|
| Controllability | C = | 5,801
|
| Relative controllability | Cr = | 0.853 967
|
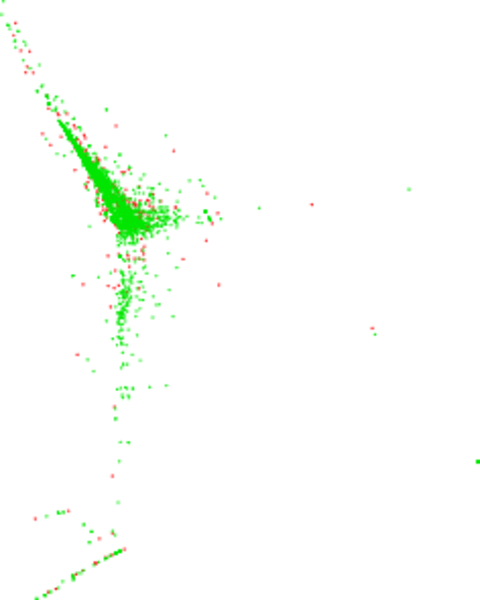
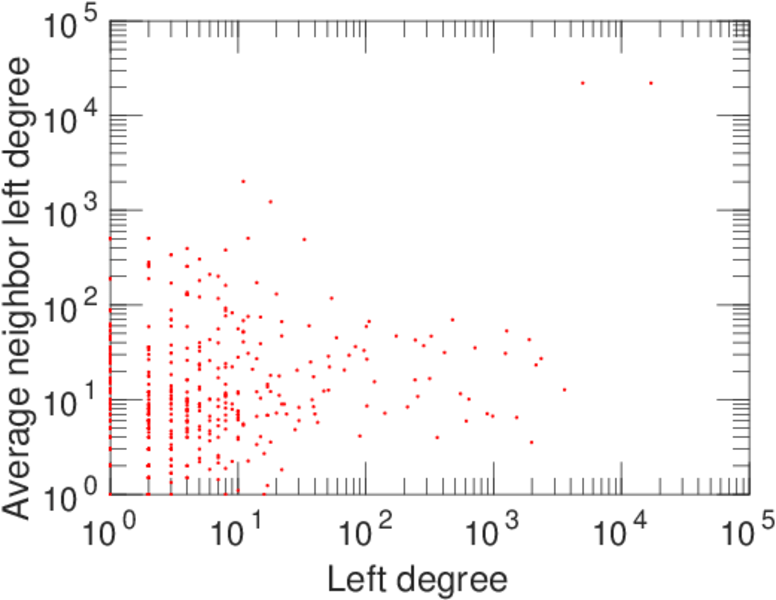
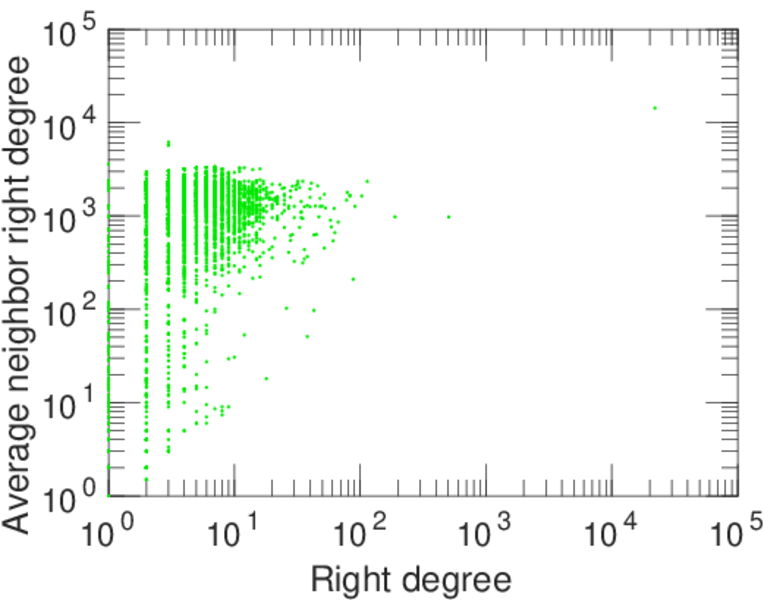
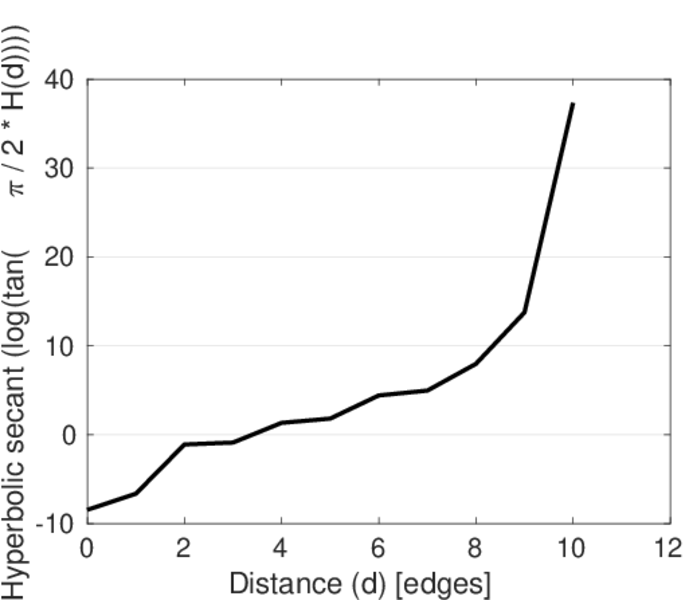
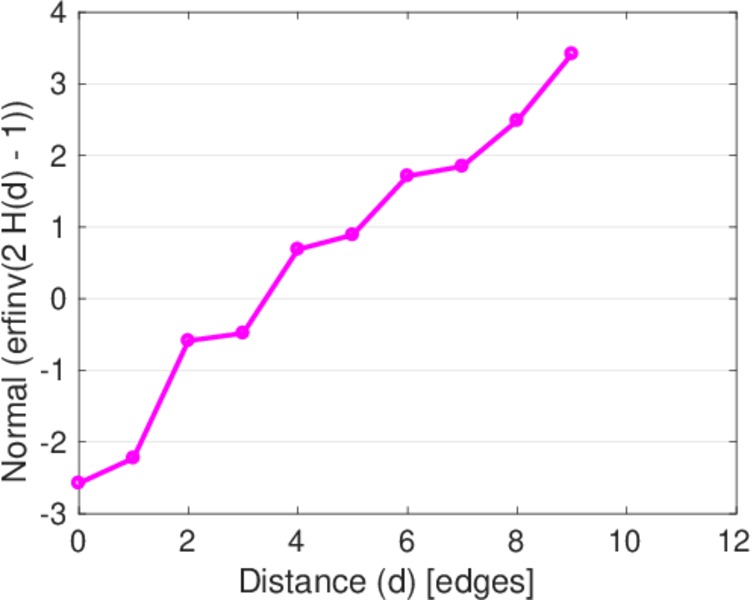
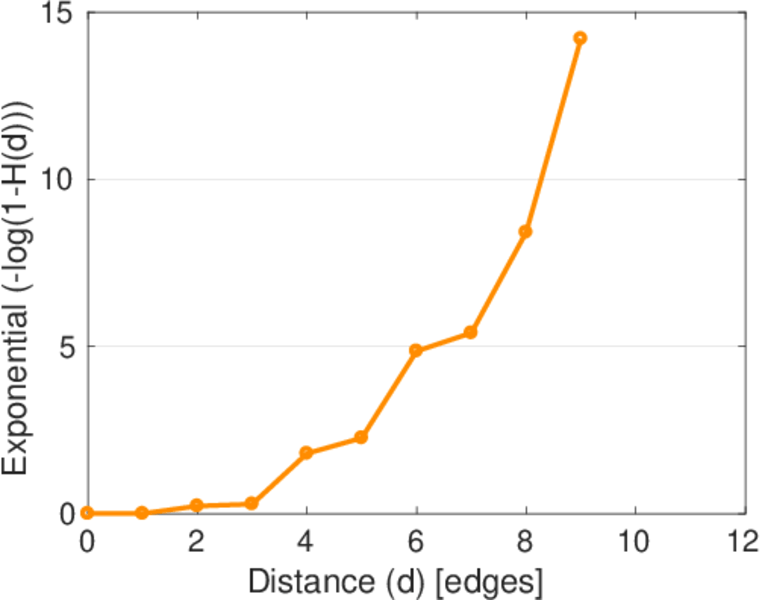
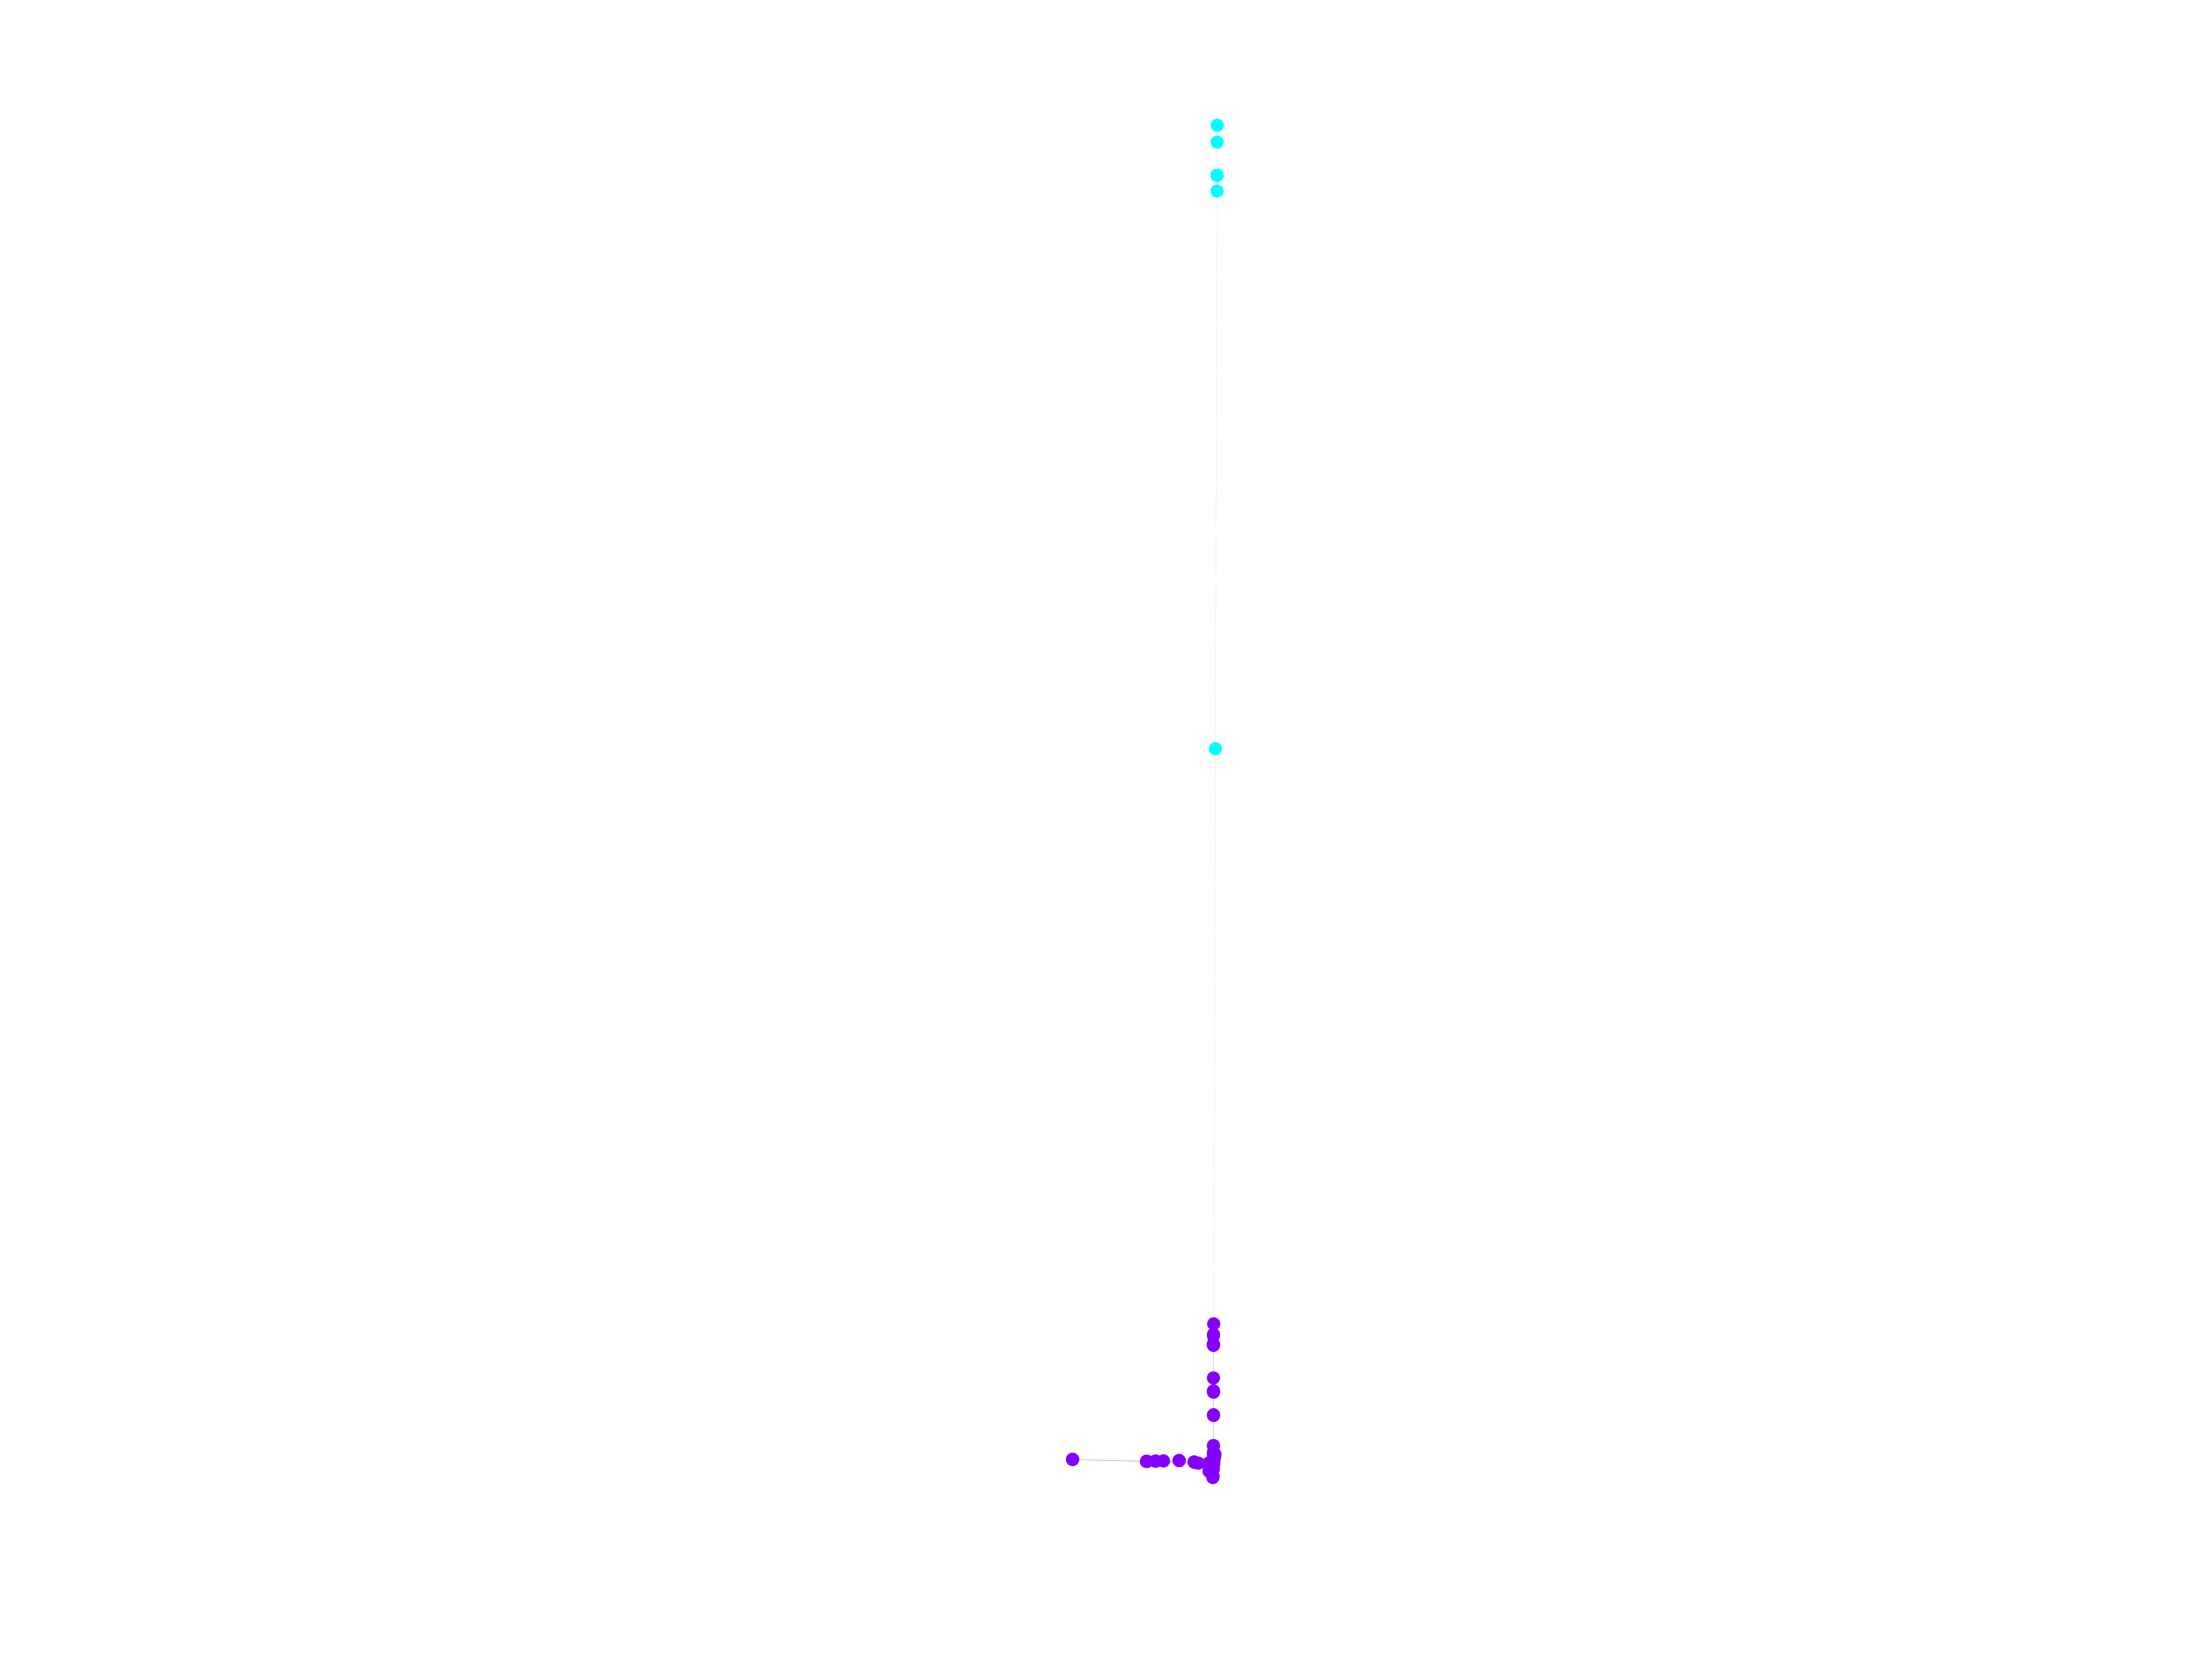
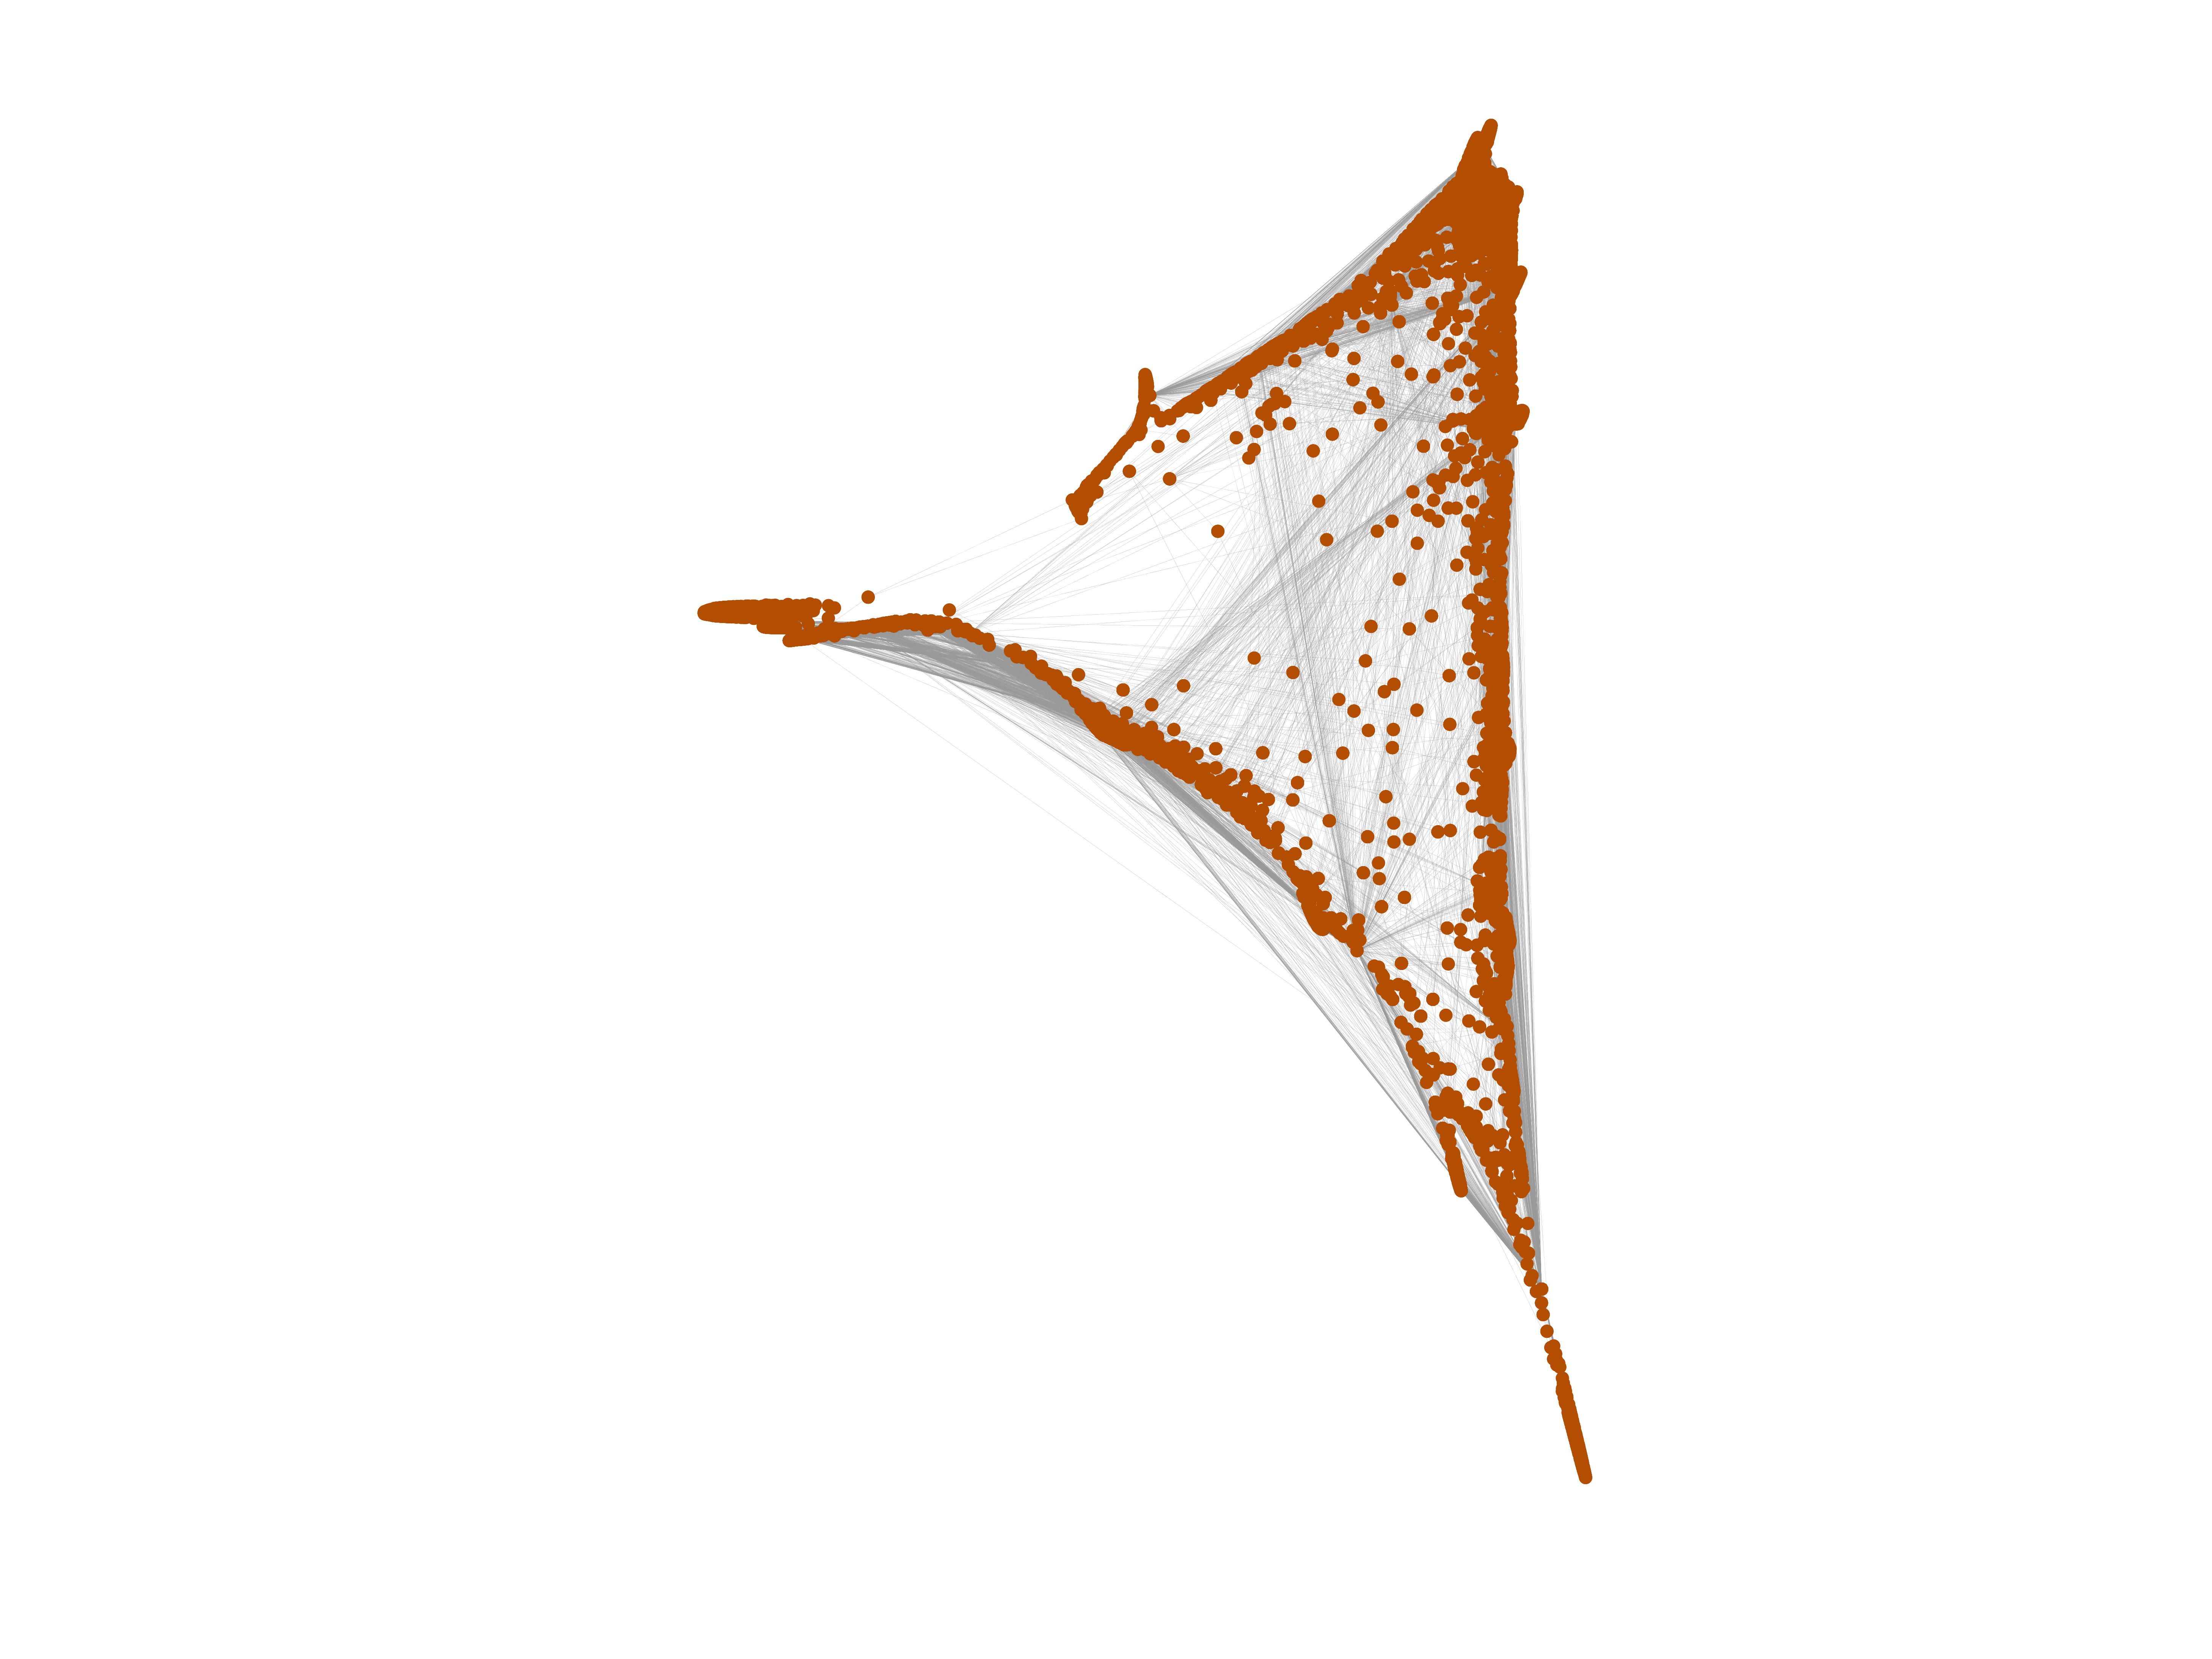
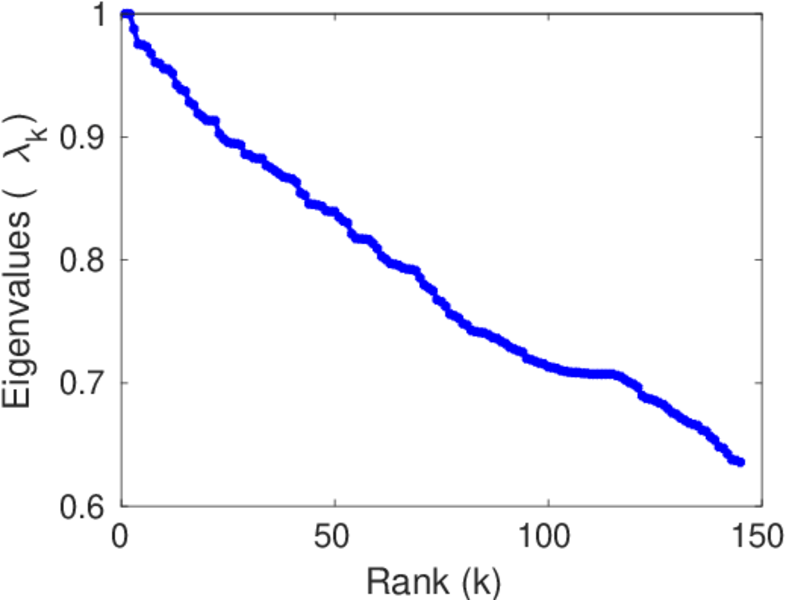
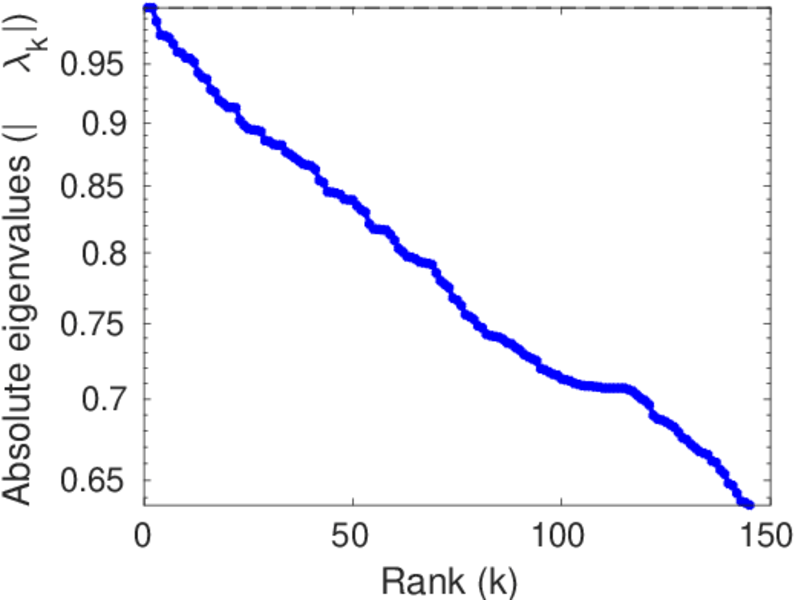
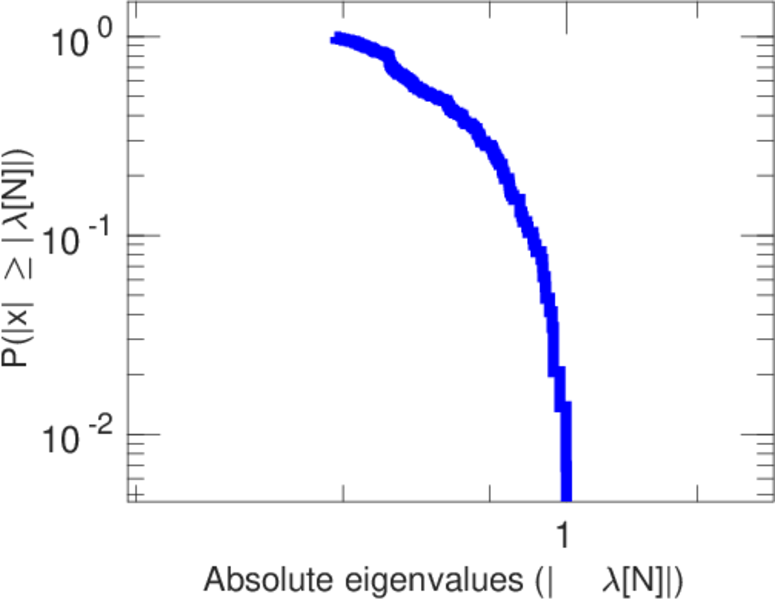
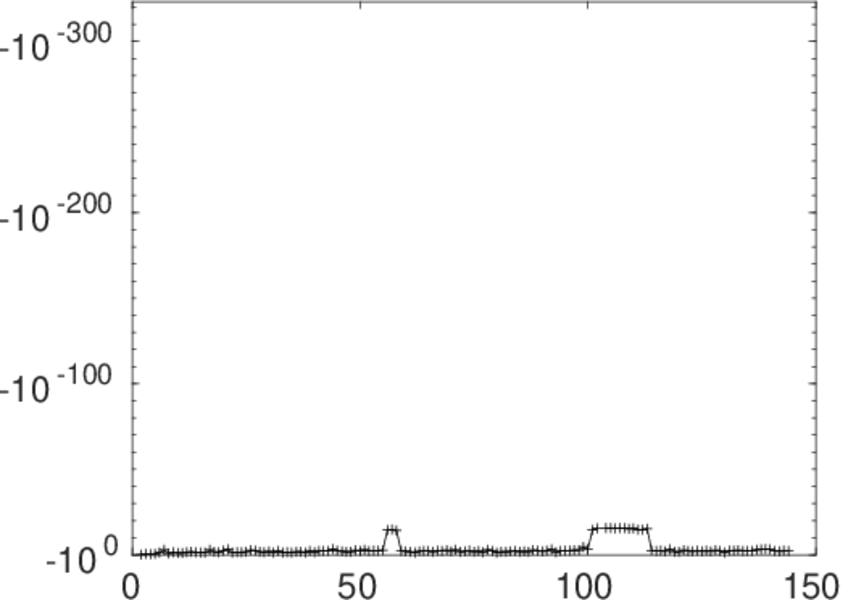
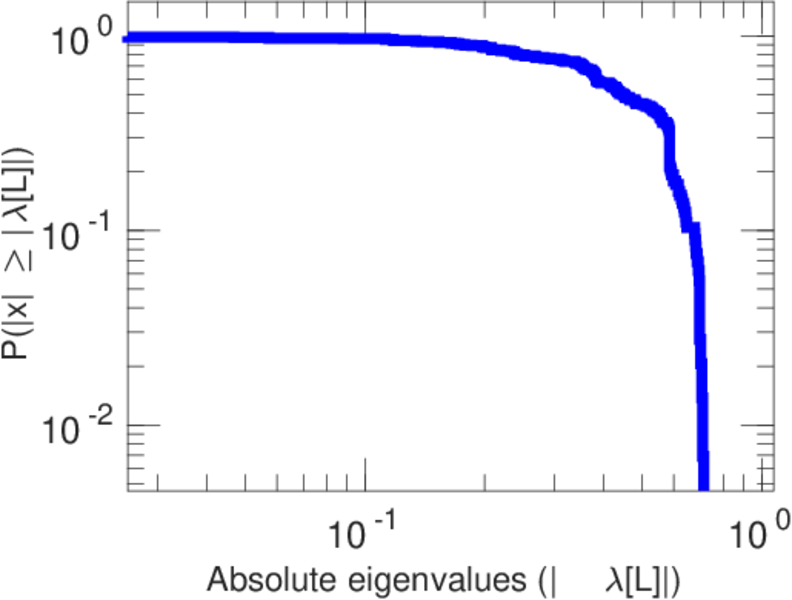
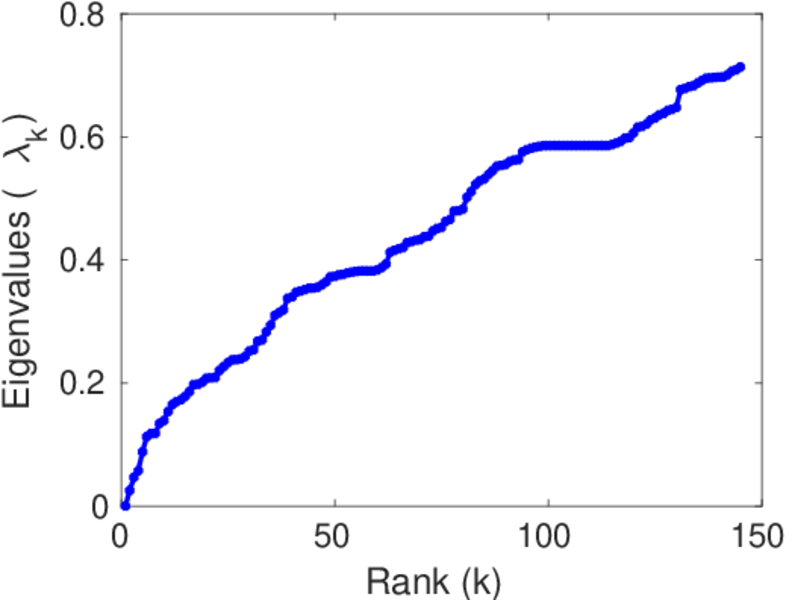
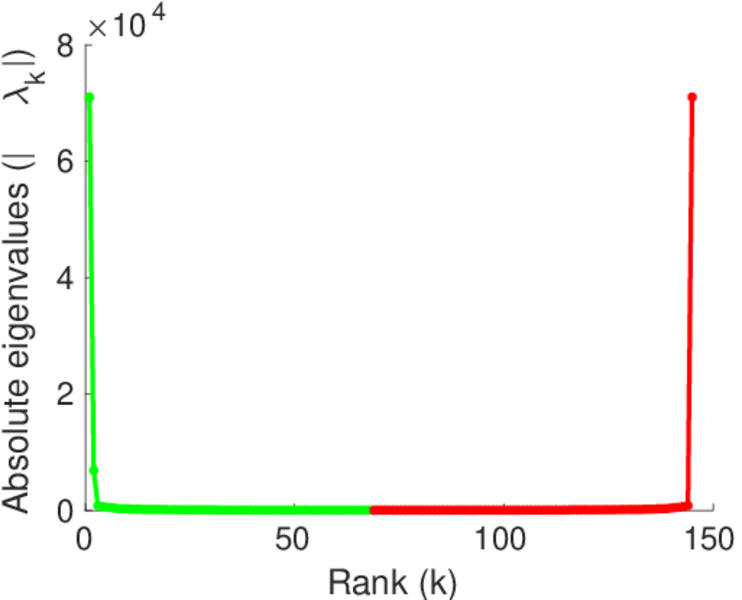
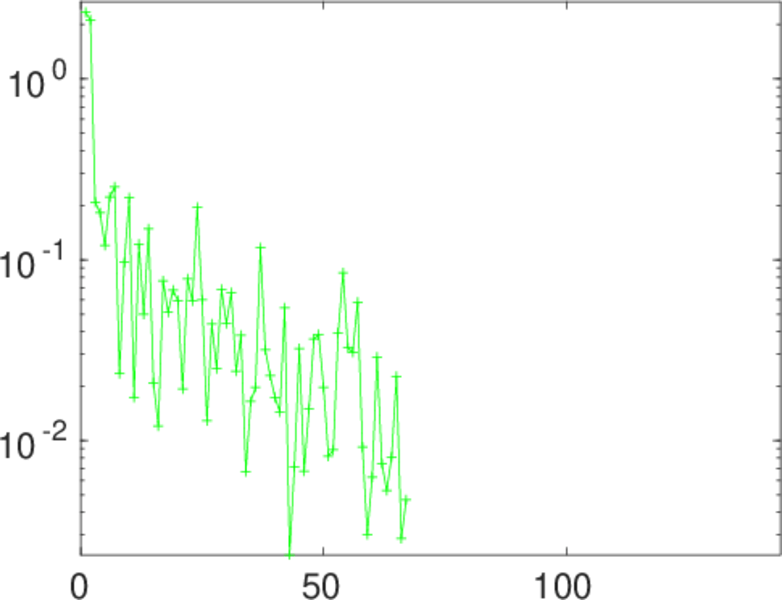
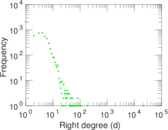
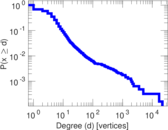
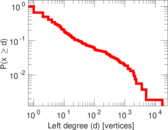
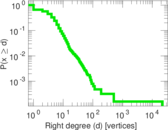
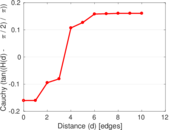
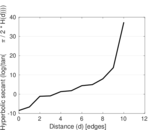
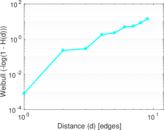
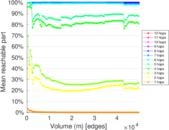
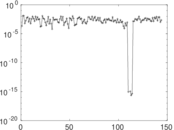
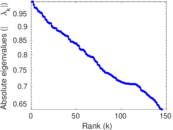
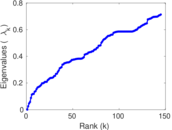
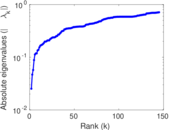
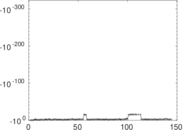
Plots


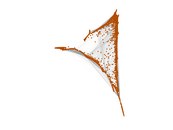


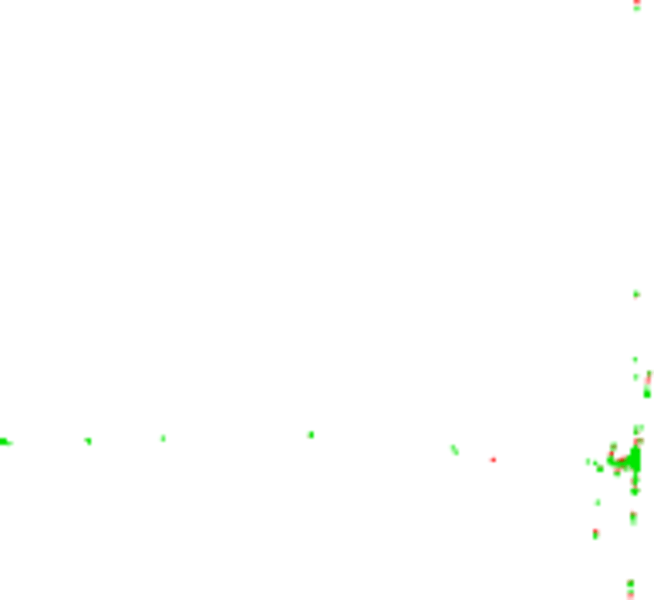
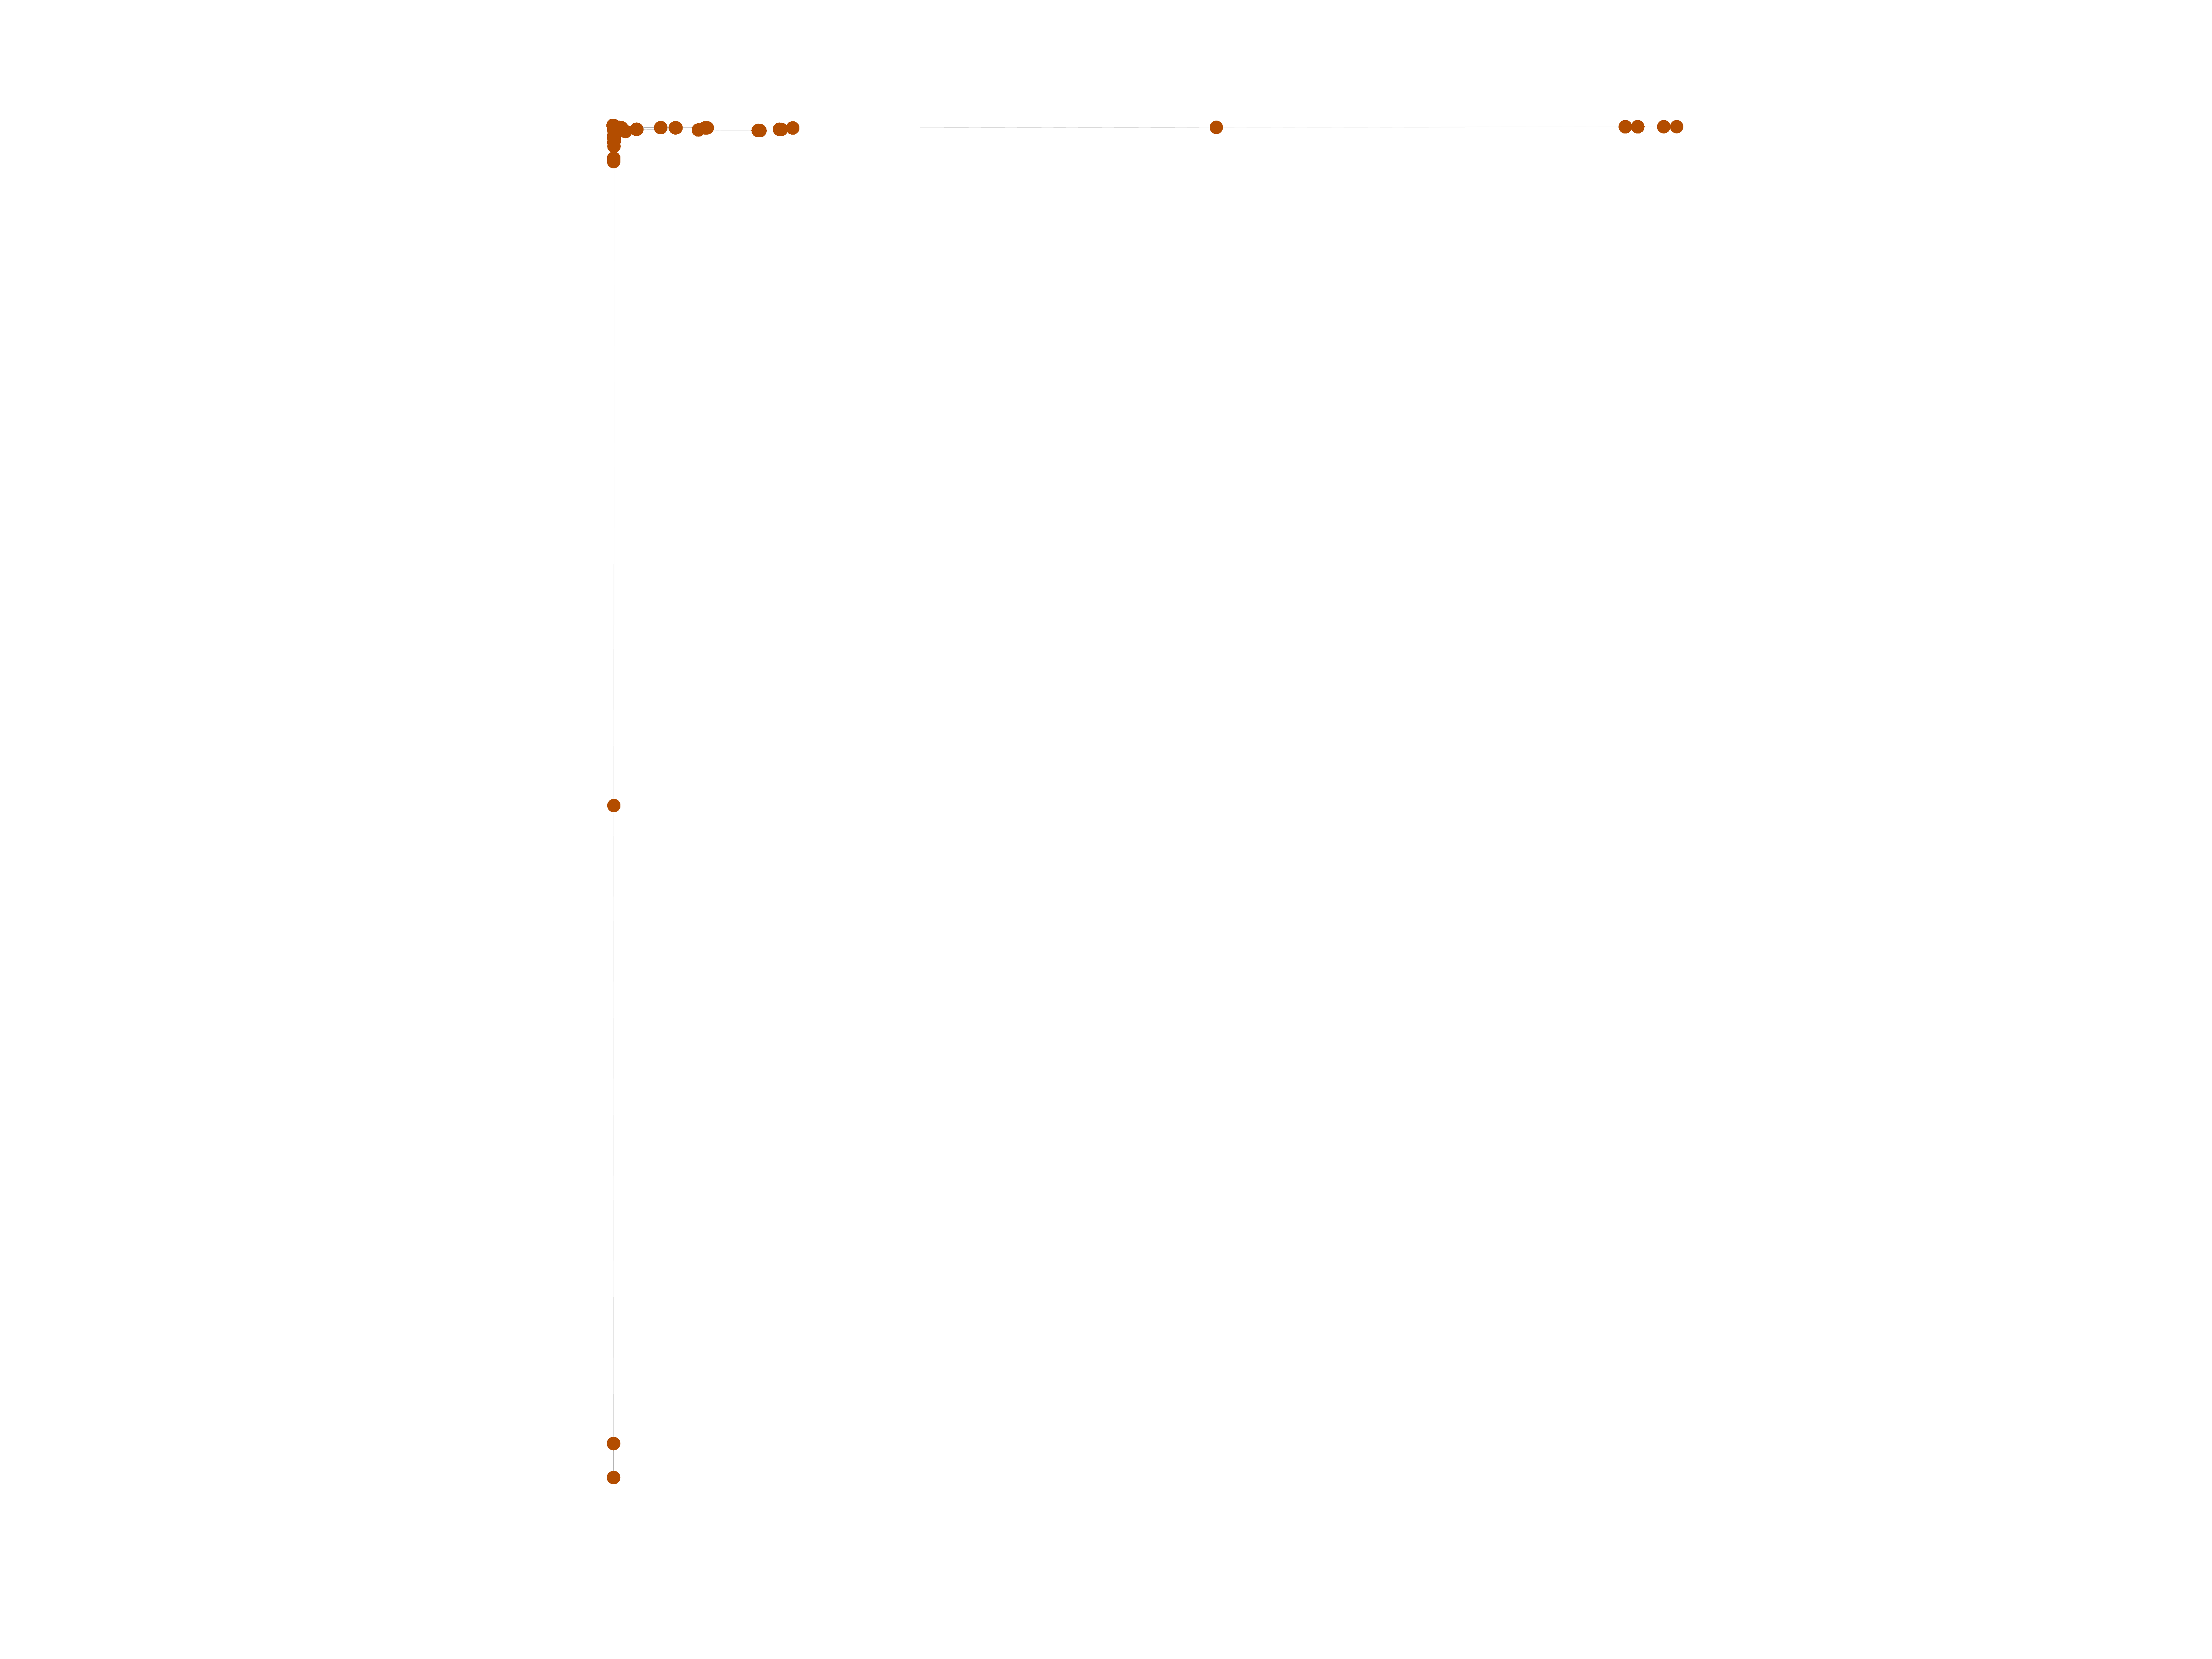
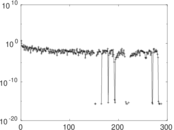
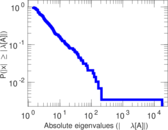
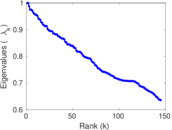
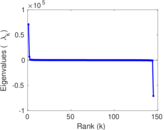
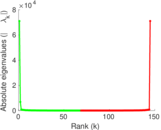
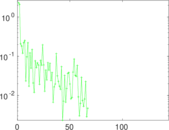
Matrix decompositions plots


Downloads
References
|
[1]
|
Jérôme Kunegis.
KONECT – The Koblenz Network Collection.
In Proc. Int. Conf. on World Wide Web Companion, pages
1343–1350, 2013.
[ http ]
|
|
[2]
|
Wikimedia Foundation.
Wikimedia downloads.
http://dumps.wikimedia.org/, January 2010.
|
 KONECT ‣ Networks ‣
Buy Me a Coffee
KONECT ‣ Networks ‣
Buy Me a Coffee