Wikiversity edits (fi)
This is the bipartite edit network of the Finnish Wikiversity. It contains
users and pages from the Finnish Wikiversity, connected by edit events. Each
edge represents an edit. The dataset includes the timestamp of each edit.
Metadata
Statistics
| Size | n = | 4,396
|
| Left size | n1 = | 1,324
|
| Right size | n2 = | 3,072
|
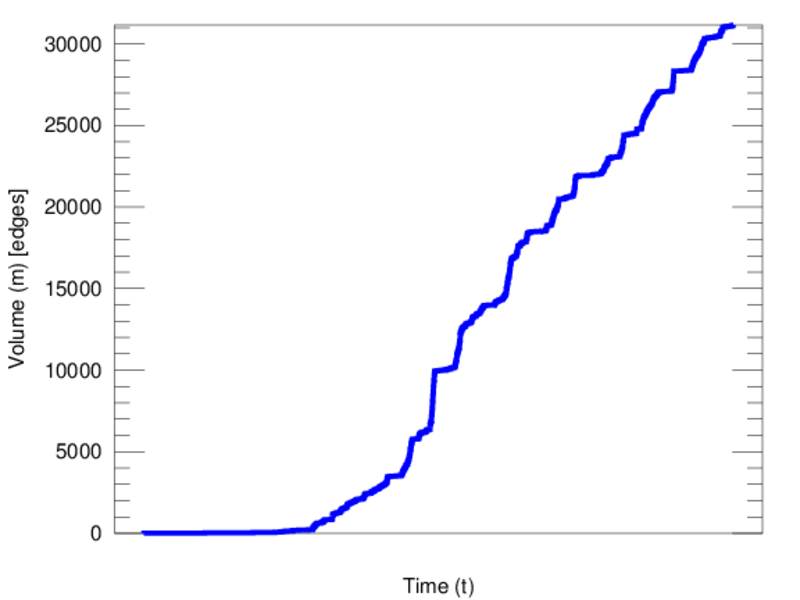
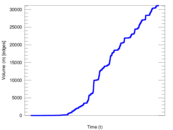
| Volume | m = | 31,157
|
| Unique edge count | m̿ = | 6,844
|
| Wedge count | s = | 175,984
|
| Claw count | z = | 6,830,790
|
| Cross count | x = | 264,700,624
|
| Square count | q = | 42,943
|
| 4-Tour count | T4 = | 1,062,032
|
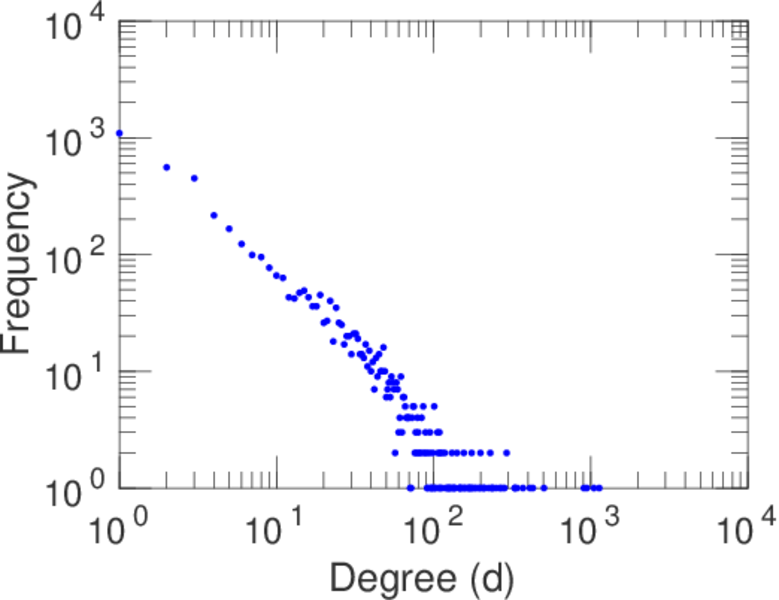
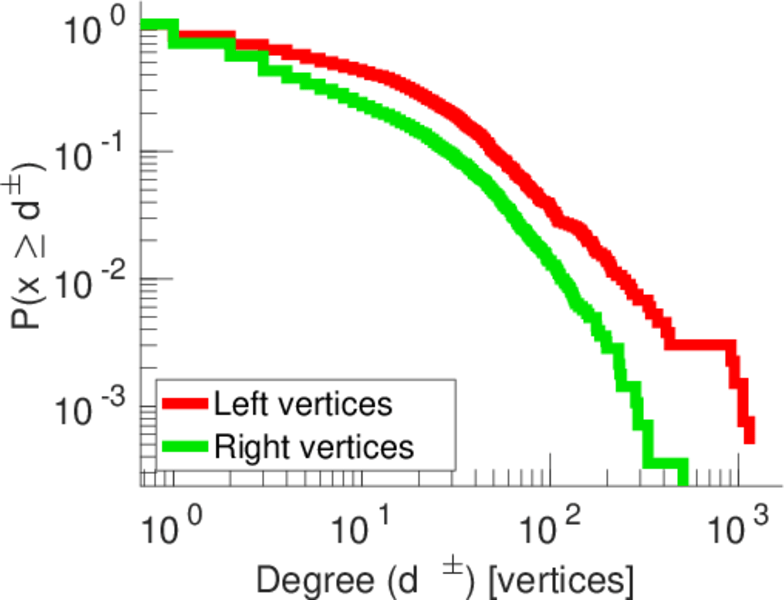
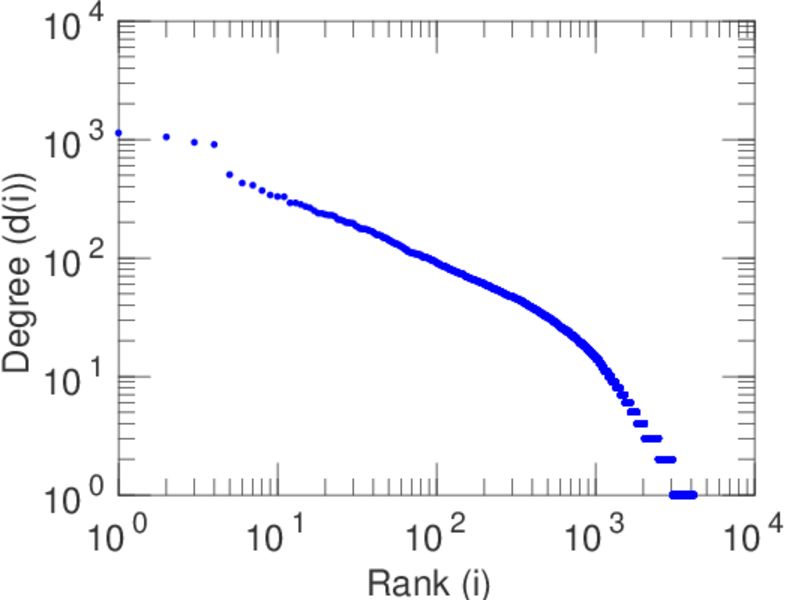
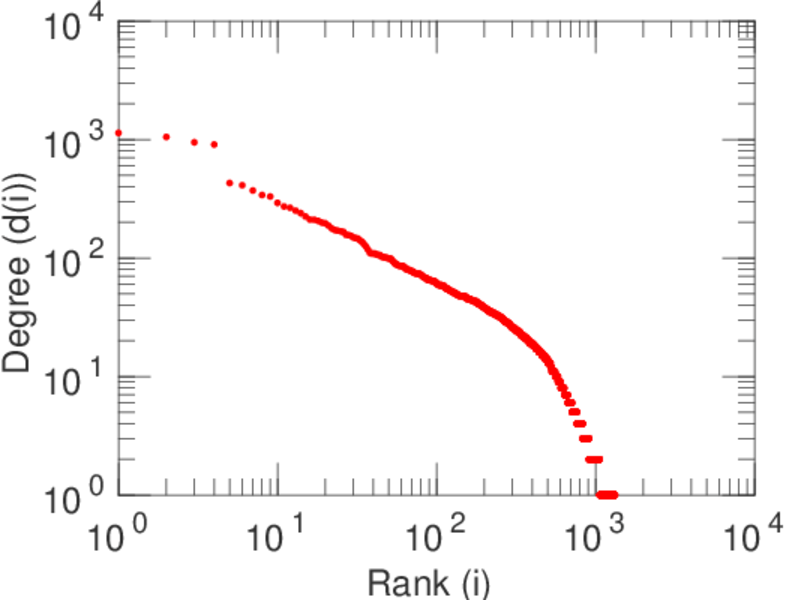
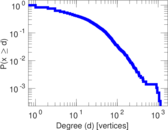
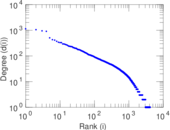
| Maximum degree | dmax = | 1,136
|
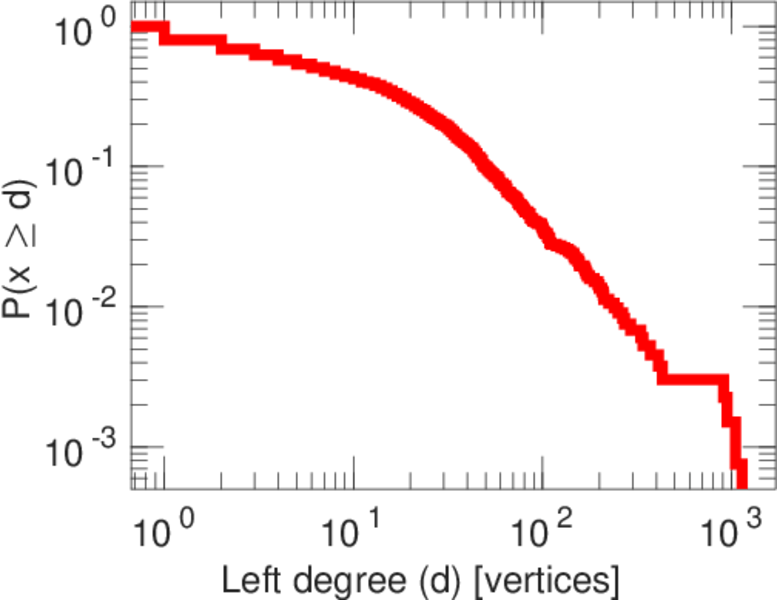
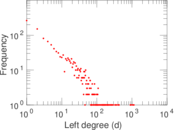
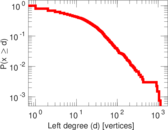
| Maximum left degree | d1max = | 1,136
|
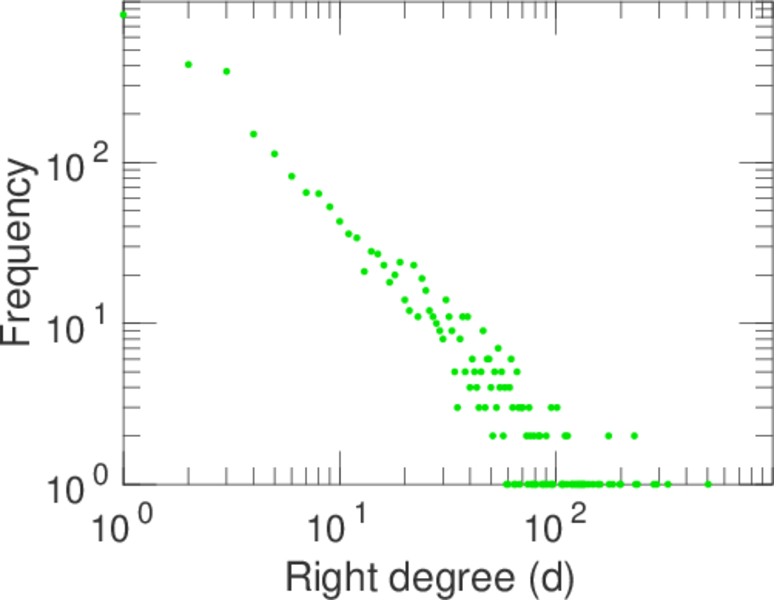
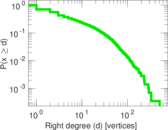
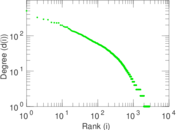
| Maximum right degree | d2max = | 505
|
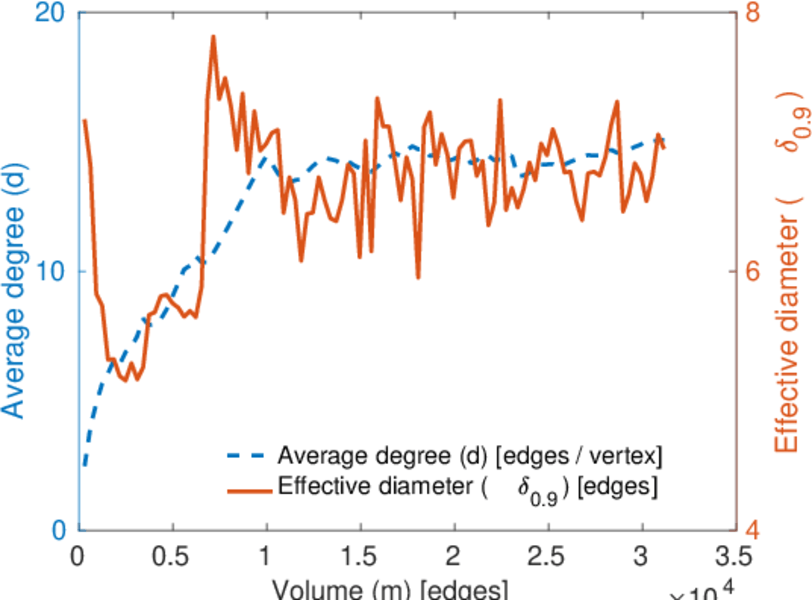
| Average degree | d = | 14.175 2
|
| Average left degree | d1 = | 23.532 5
|
| Average right degree | d2 = | 10.142 3
|
| Fill | p = | 0.001 682 68
|
| Average edge multiplicity | m̃ = | 4.552 45
|
| Size of LCC | N = | 3,732
|
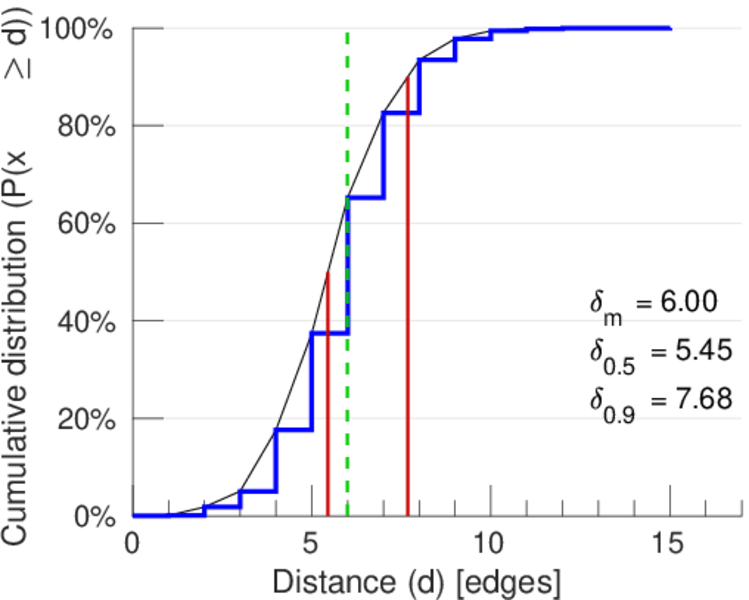
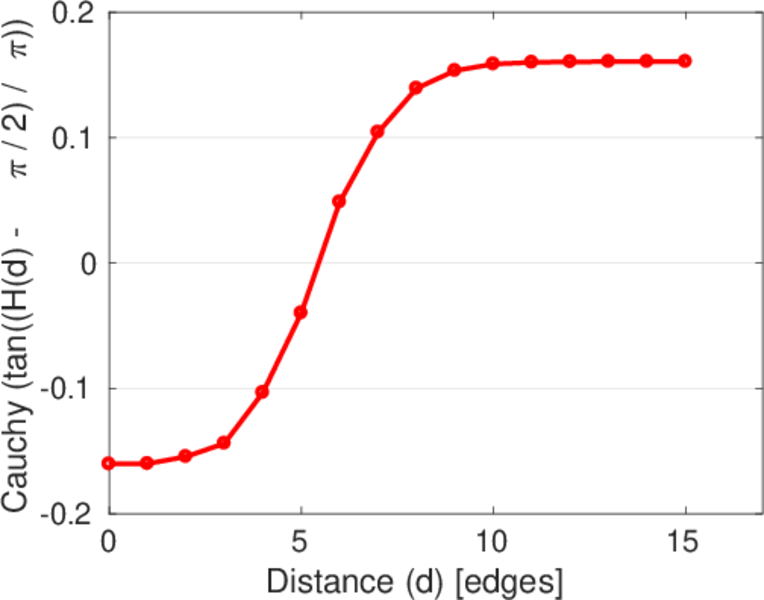
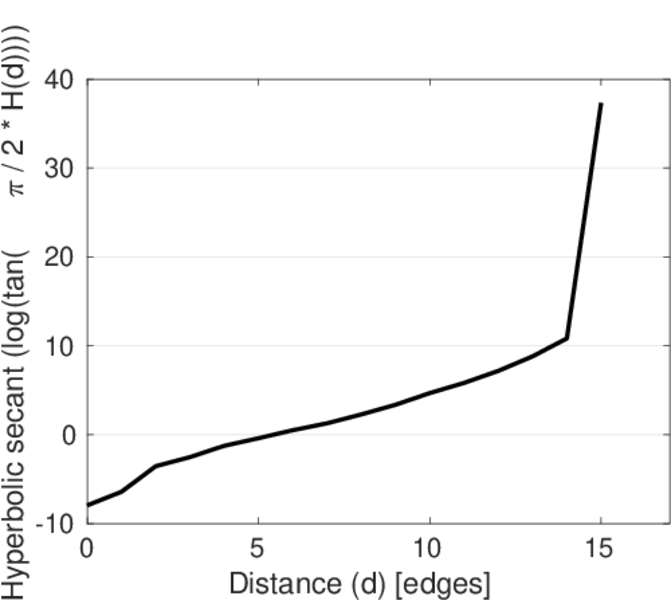
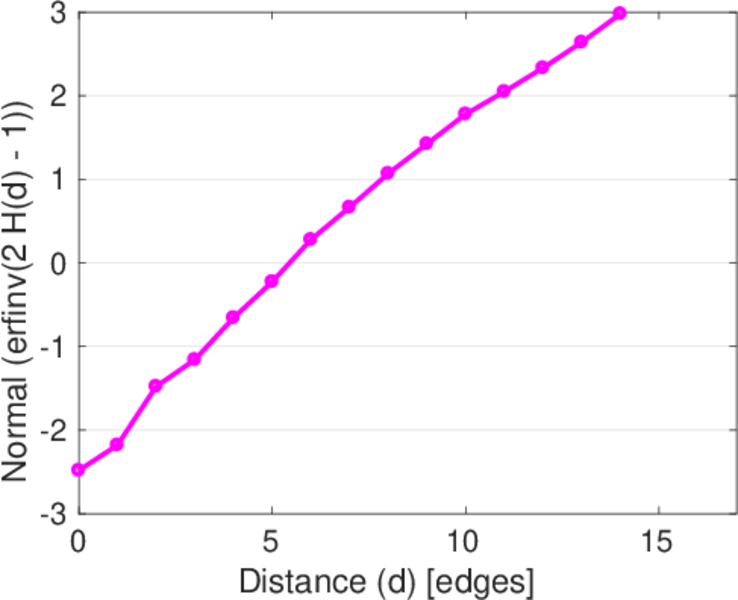
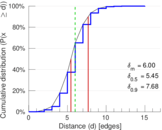
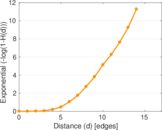
| Diameter | δ = | 17
|
| 50-Percentile effective diameter | δ0.5 = | 5.452 53
|
| 90-Percentile effective diameter | δ0.9 = | 7.681 38
|
| Median distance | δM = | 6
|
| Mean distance | δm = | 5.997 39
|
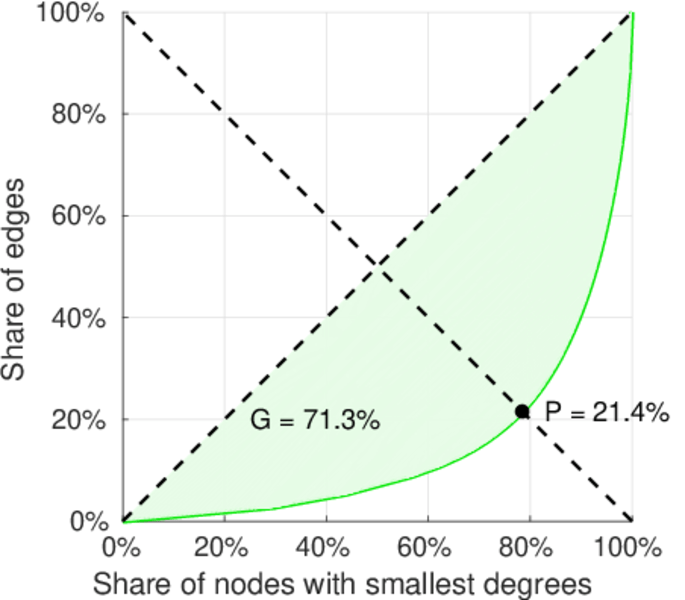
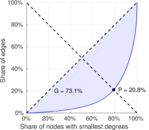
| Gini coefficient | G = | 0.696 457
|
| Balanced inequality ratio | P = | 0.230 975
|
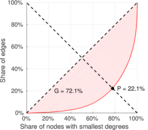
| Left balanced inequality ratio | P1 = | 0.220 753
|
| Right balanced inequality ratio | P2 = | 0.214 109
|
| Relative edge distribution entropy | Her = | 0.900 464
|
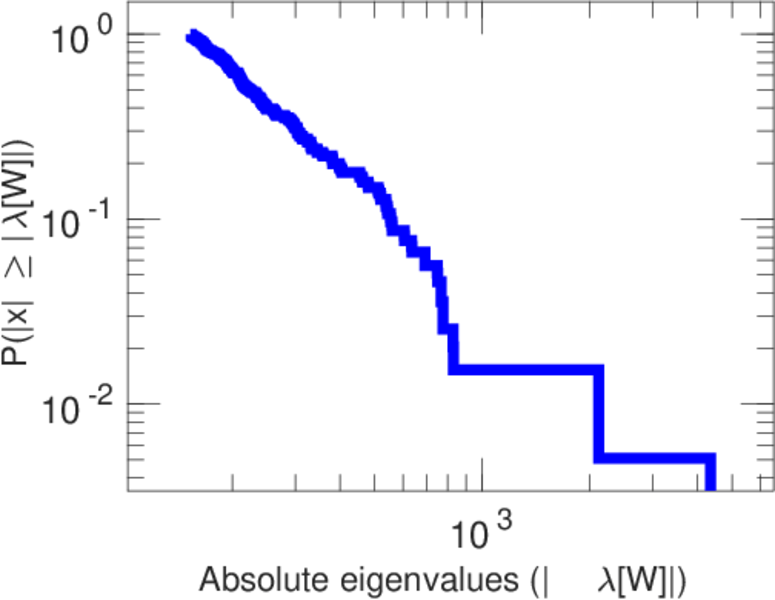
| Power law exponent | γ = | 2.515 24
|
| Tail power law exponent | γt = | 2.451 00
|
| Tail power law exponent with p | γ3 = | 2.451 00
|
| p-value | p = | 0.110 000
|
| Left tail power law exponent with p | γ3,1 = | 2.331 00
|
| Left p-value | p1 = | 0.046 000 0
|
| Right tail power law exponent with p | γ3,2 = | 2.581 00
|
| Right p-value | p2 = | 0.000 00
|
| Degree assortativity | ρ = | −0.236 808
|
| Degree assortativity p-value | pρ = | 7.336 63 × 10−88
|
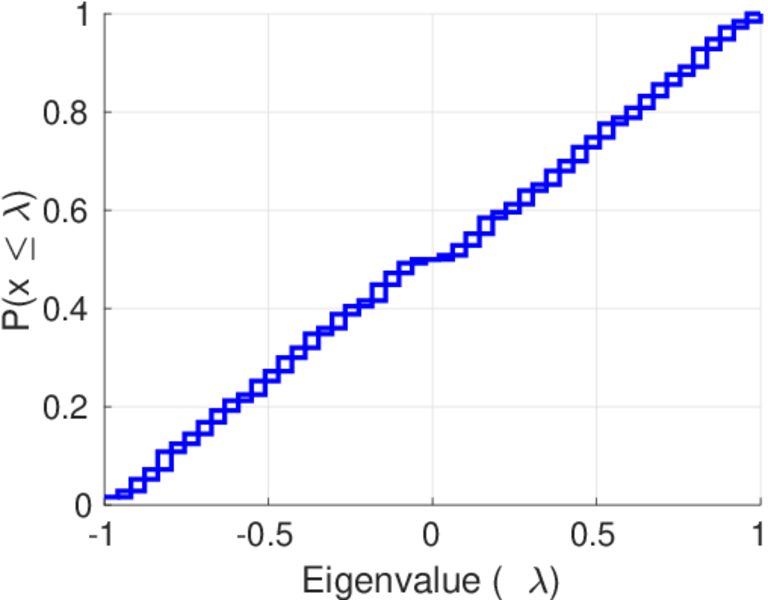
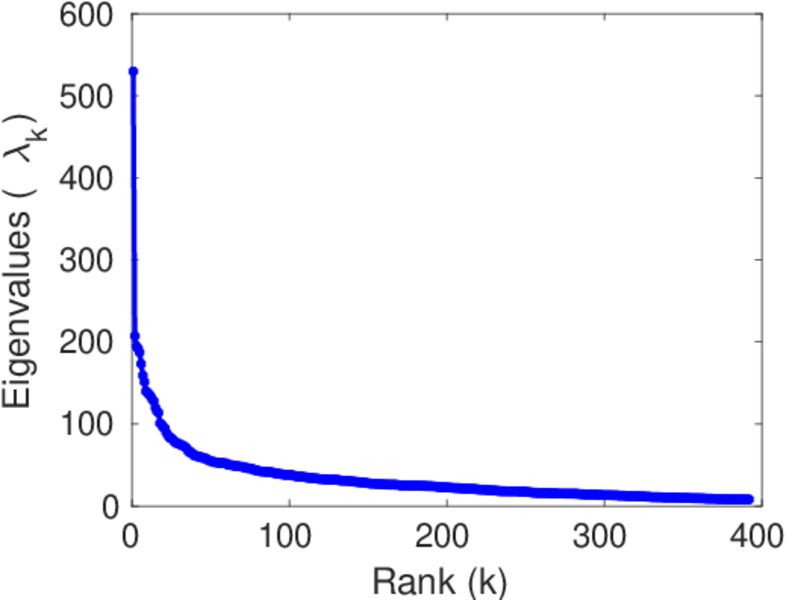
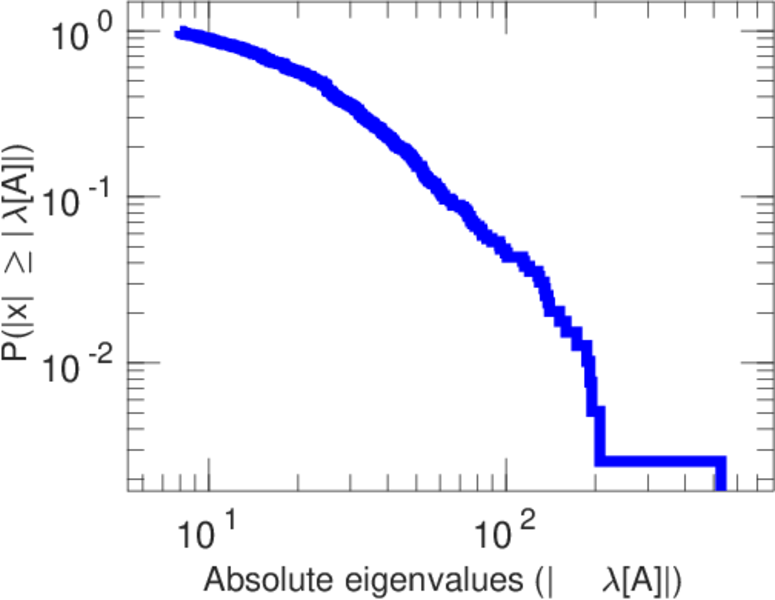
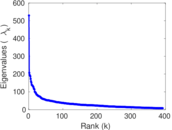
| Spectral norm | α = | 529.576
|
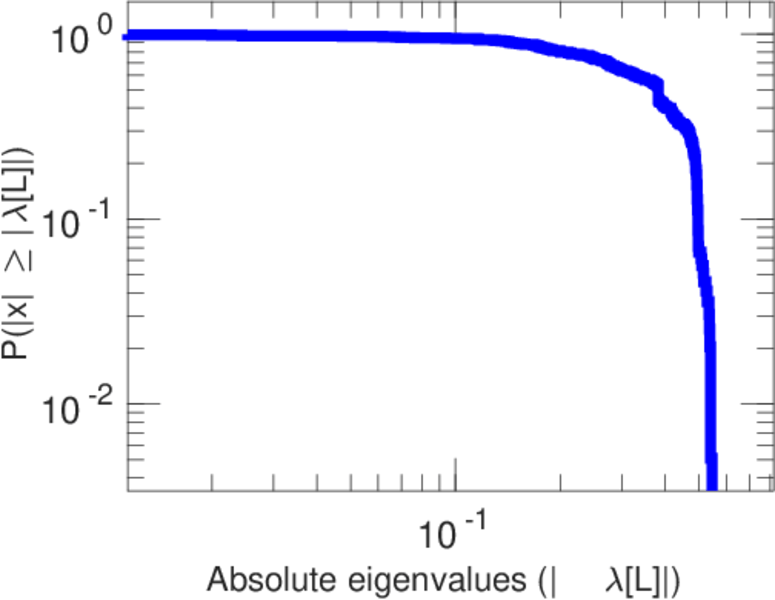
| Algebraic connectivity | a = | 0.011 452 8
|
| Spectral separation | |λ1[A] / λ2[A]| = | 2.555 67
|
| Controllability | C = | 2,117
|
| Relative controllability | Cr = | 0.511 723
|
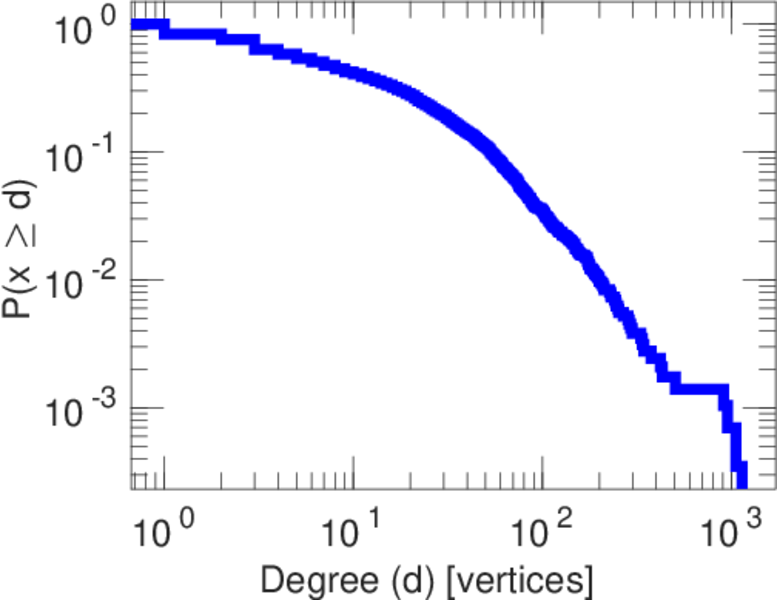
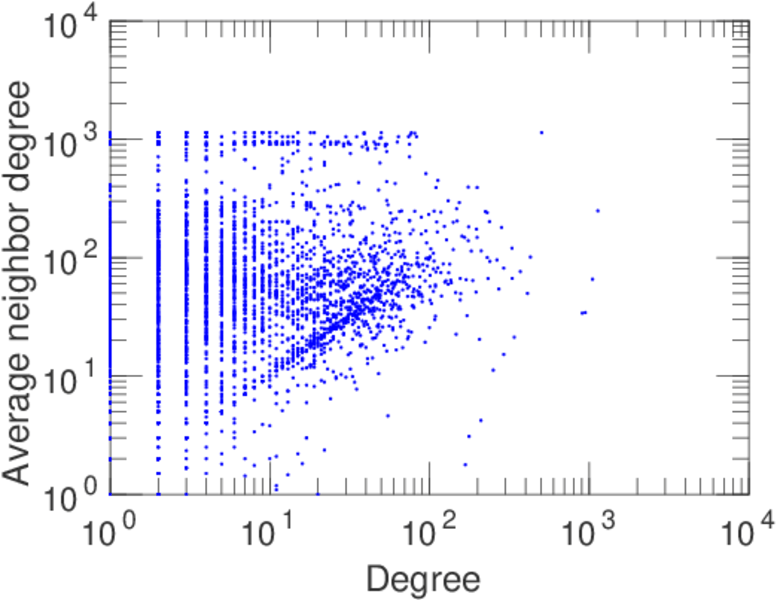
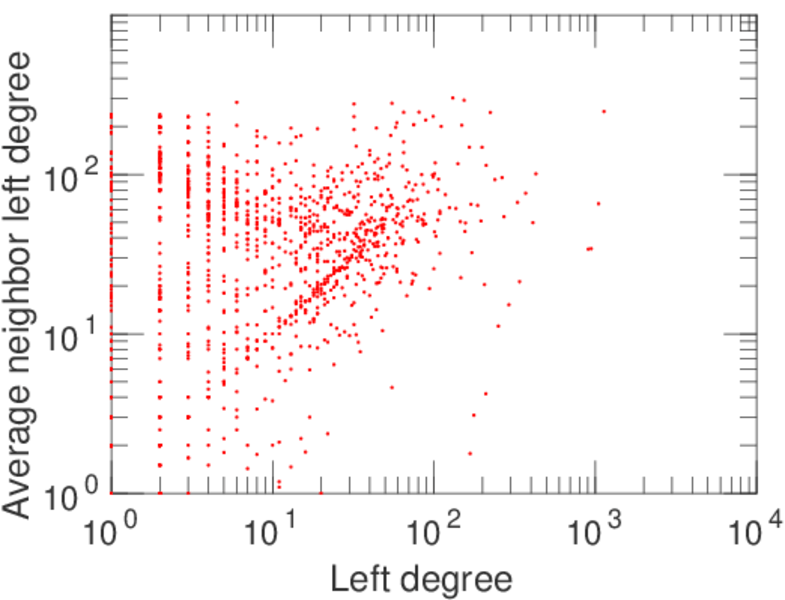
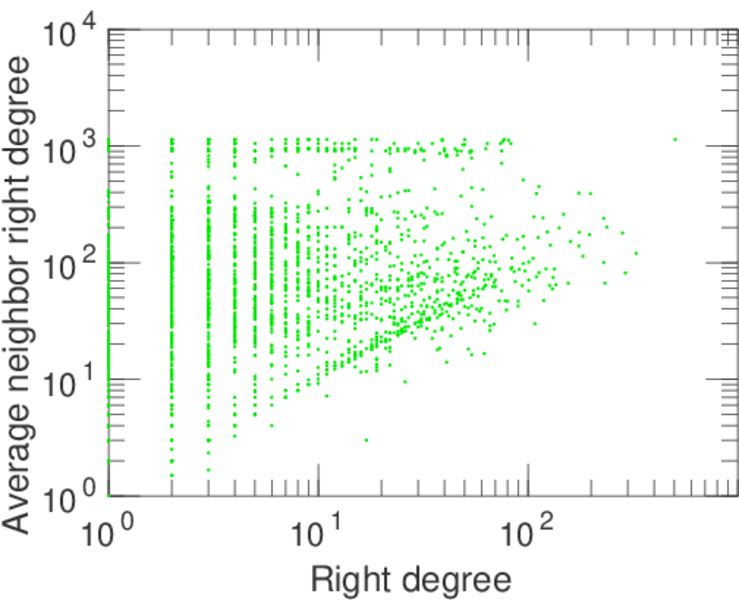
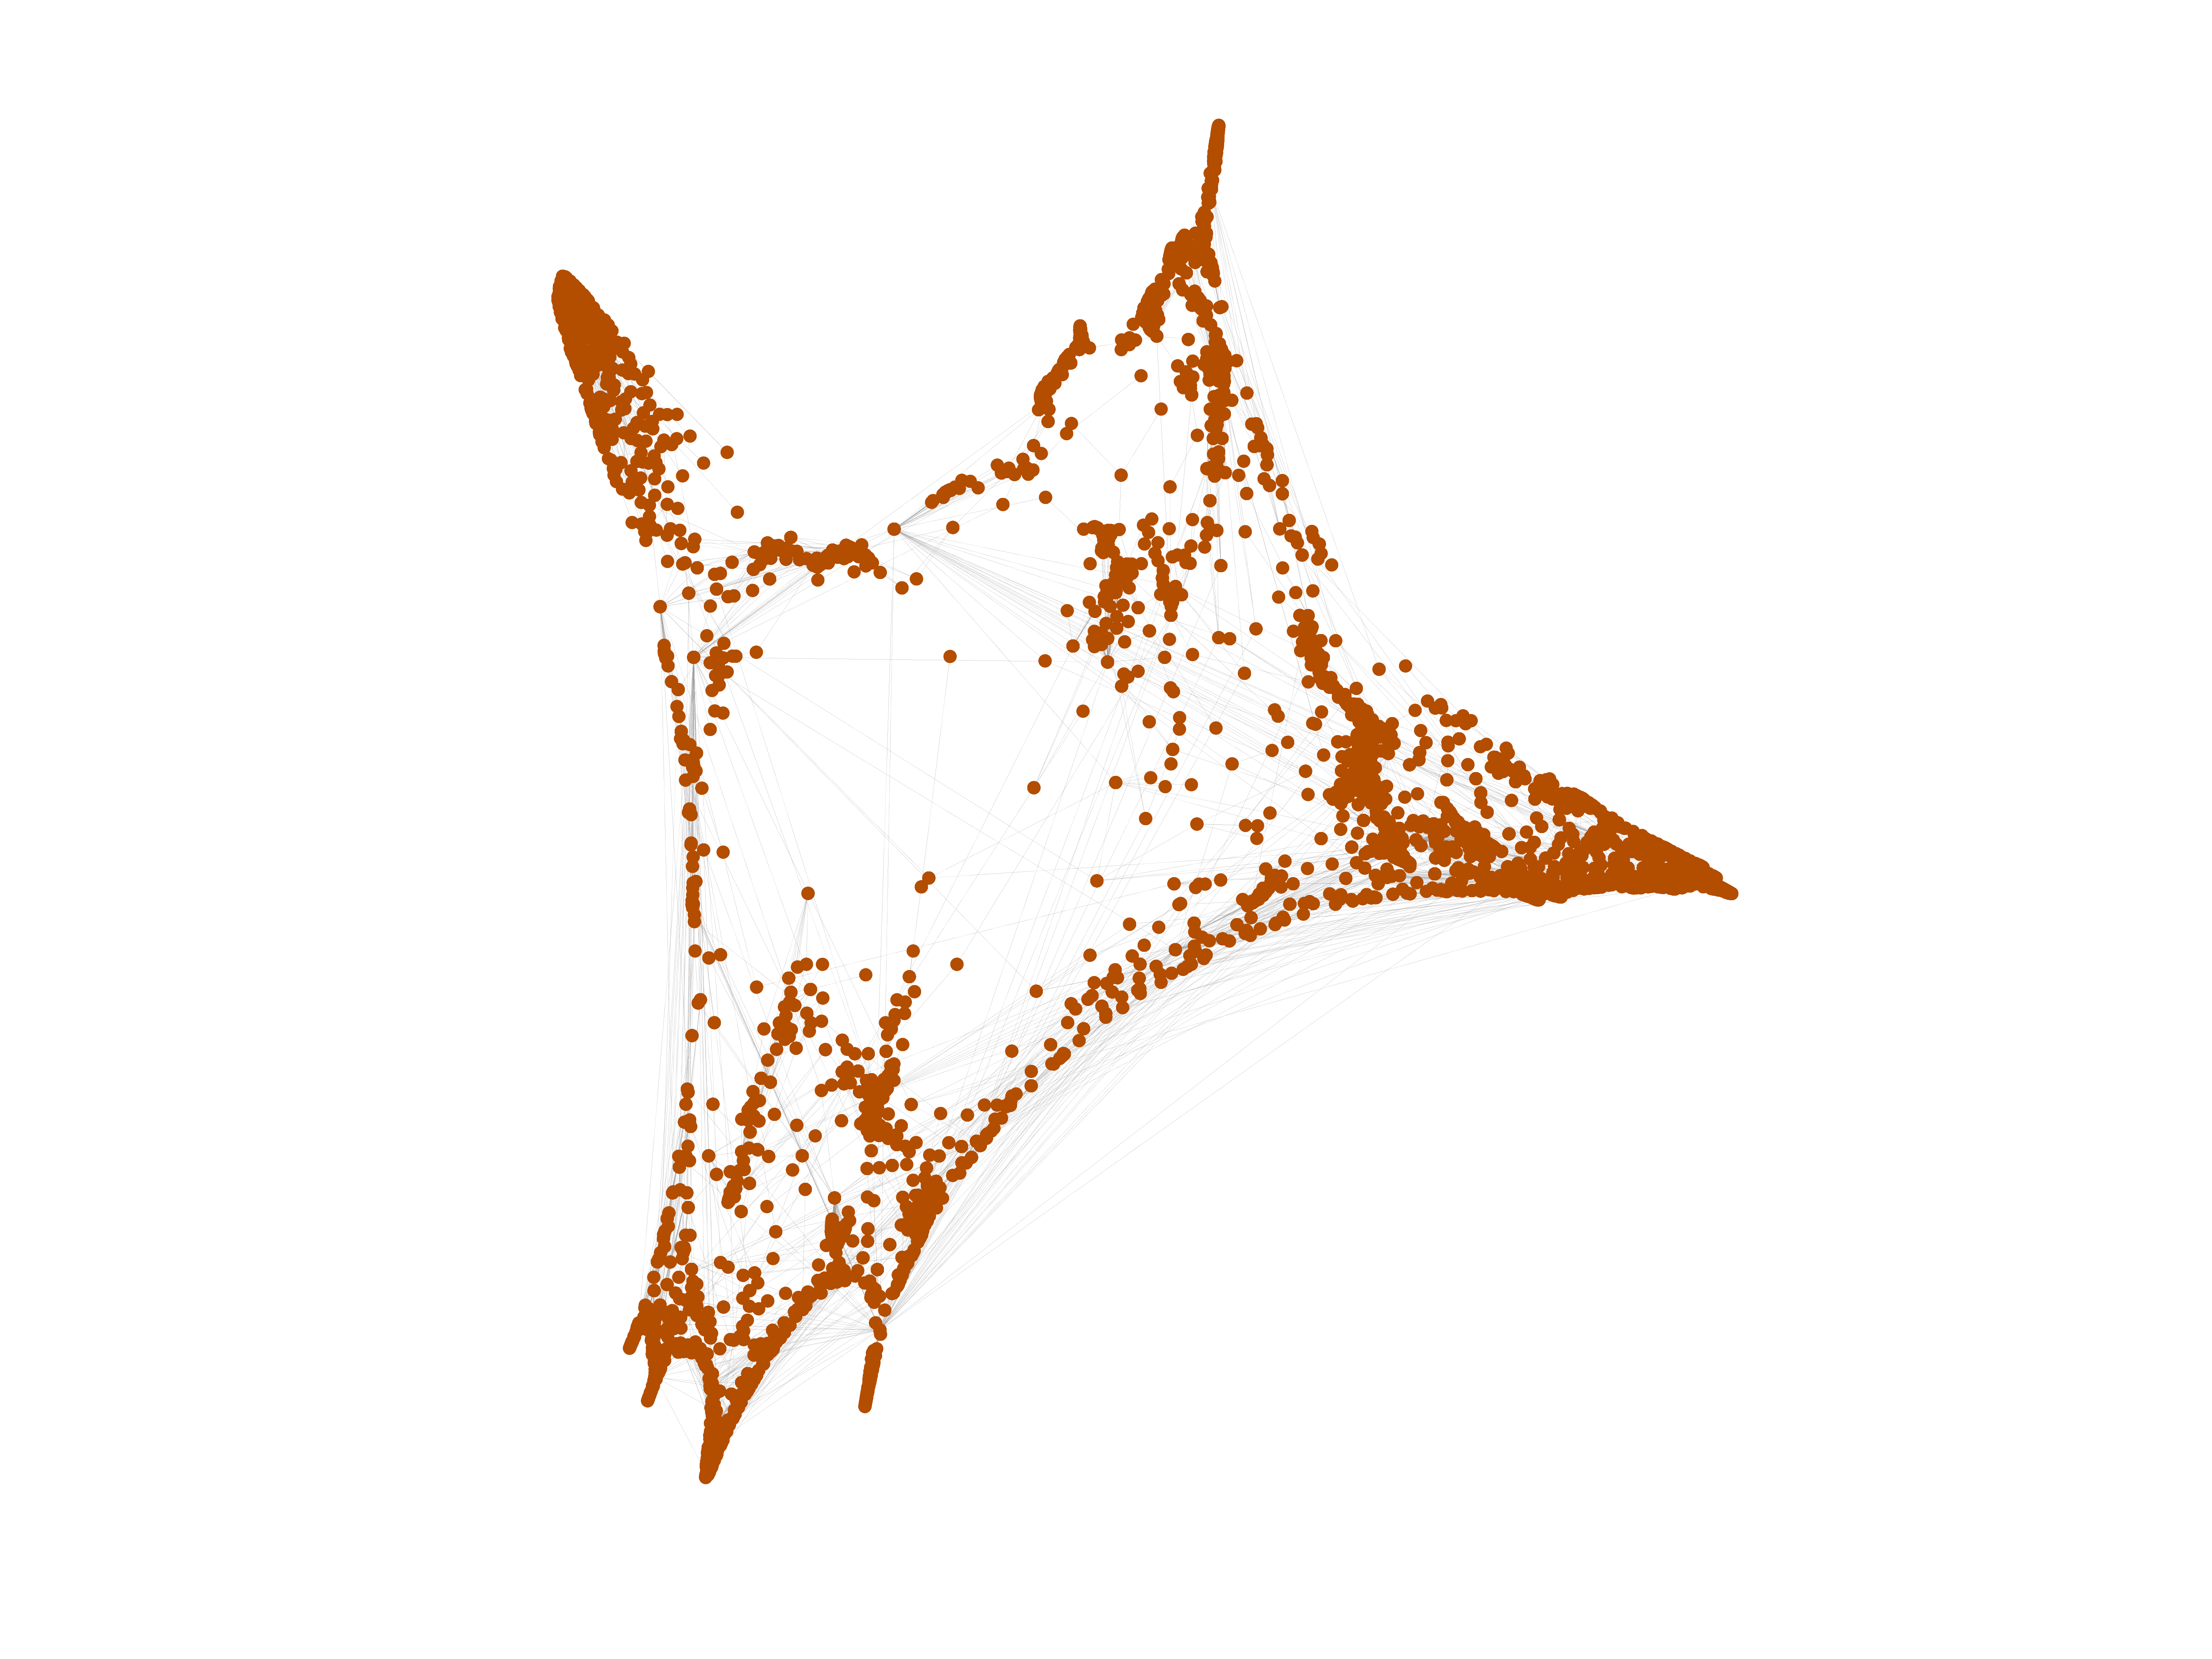
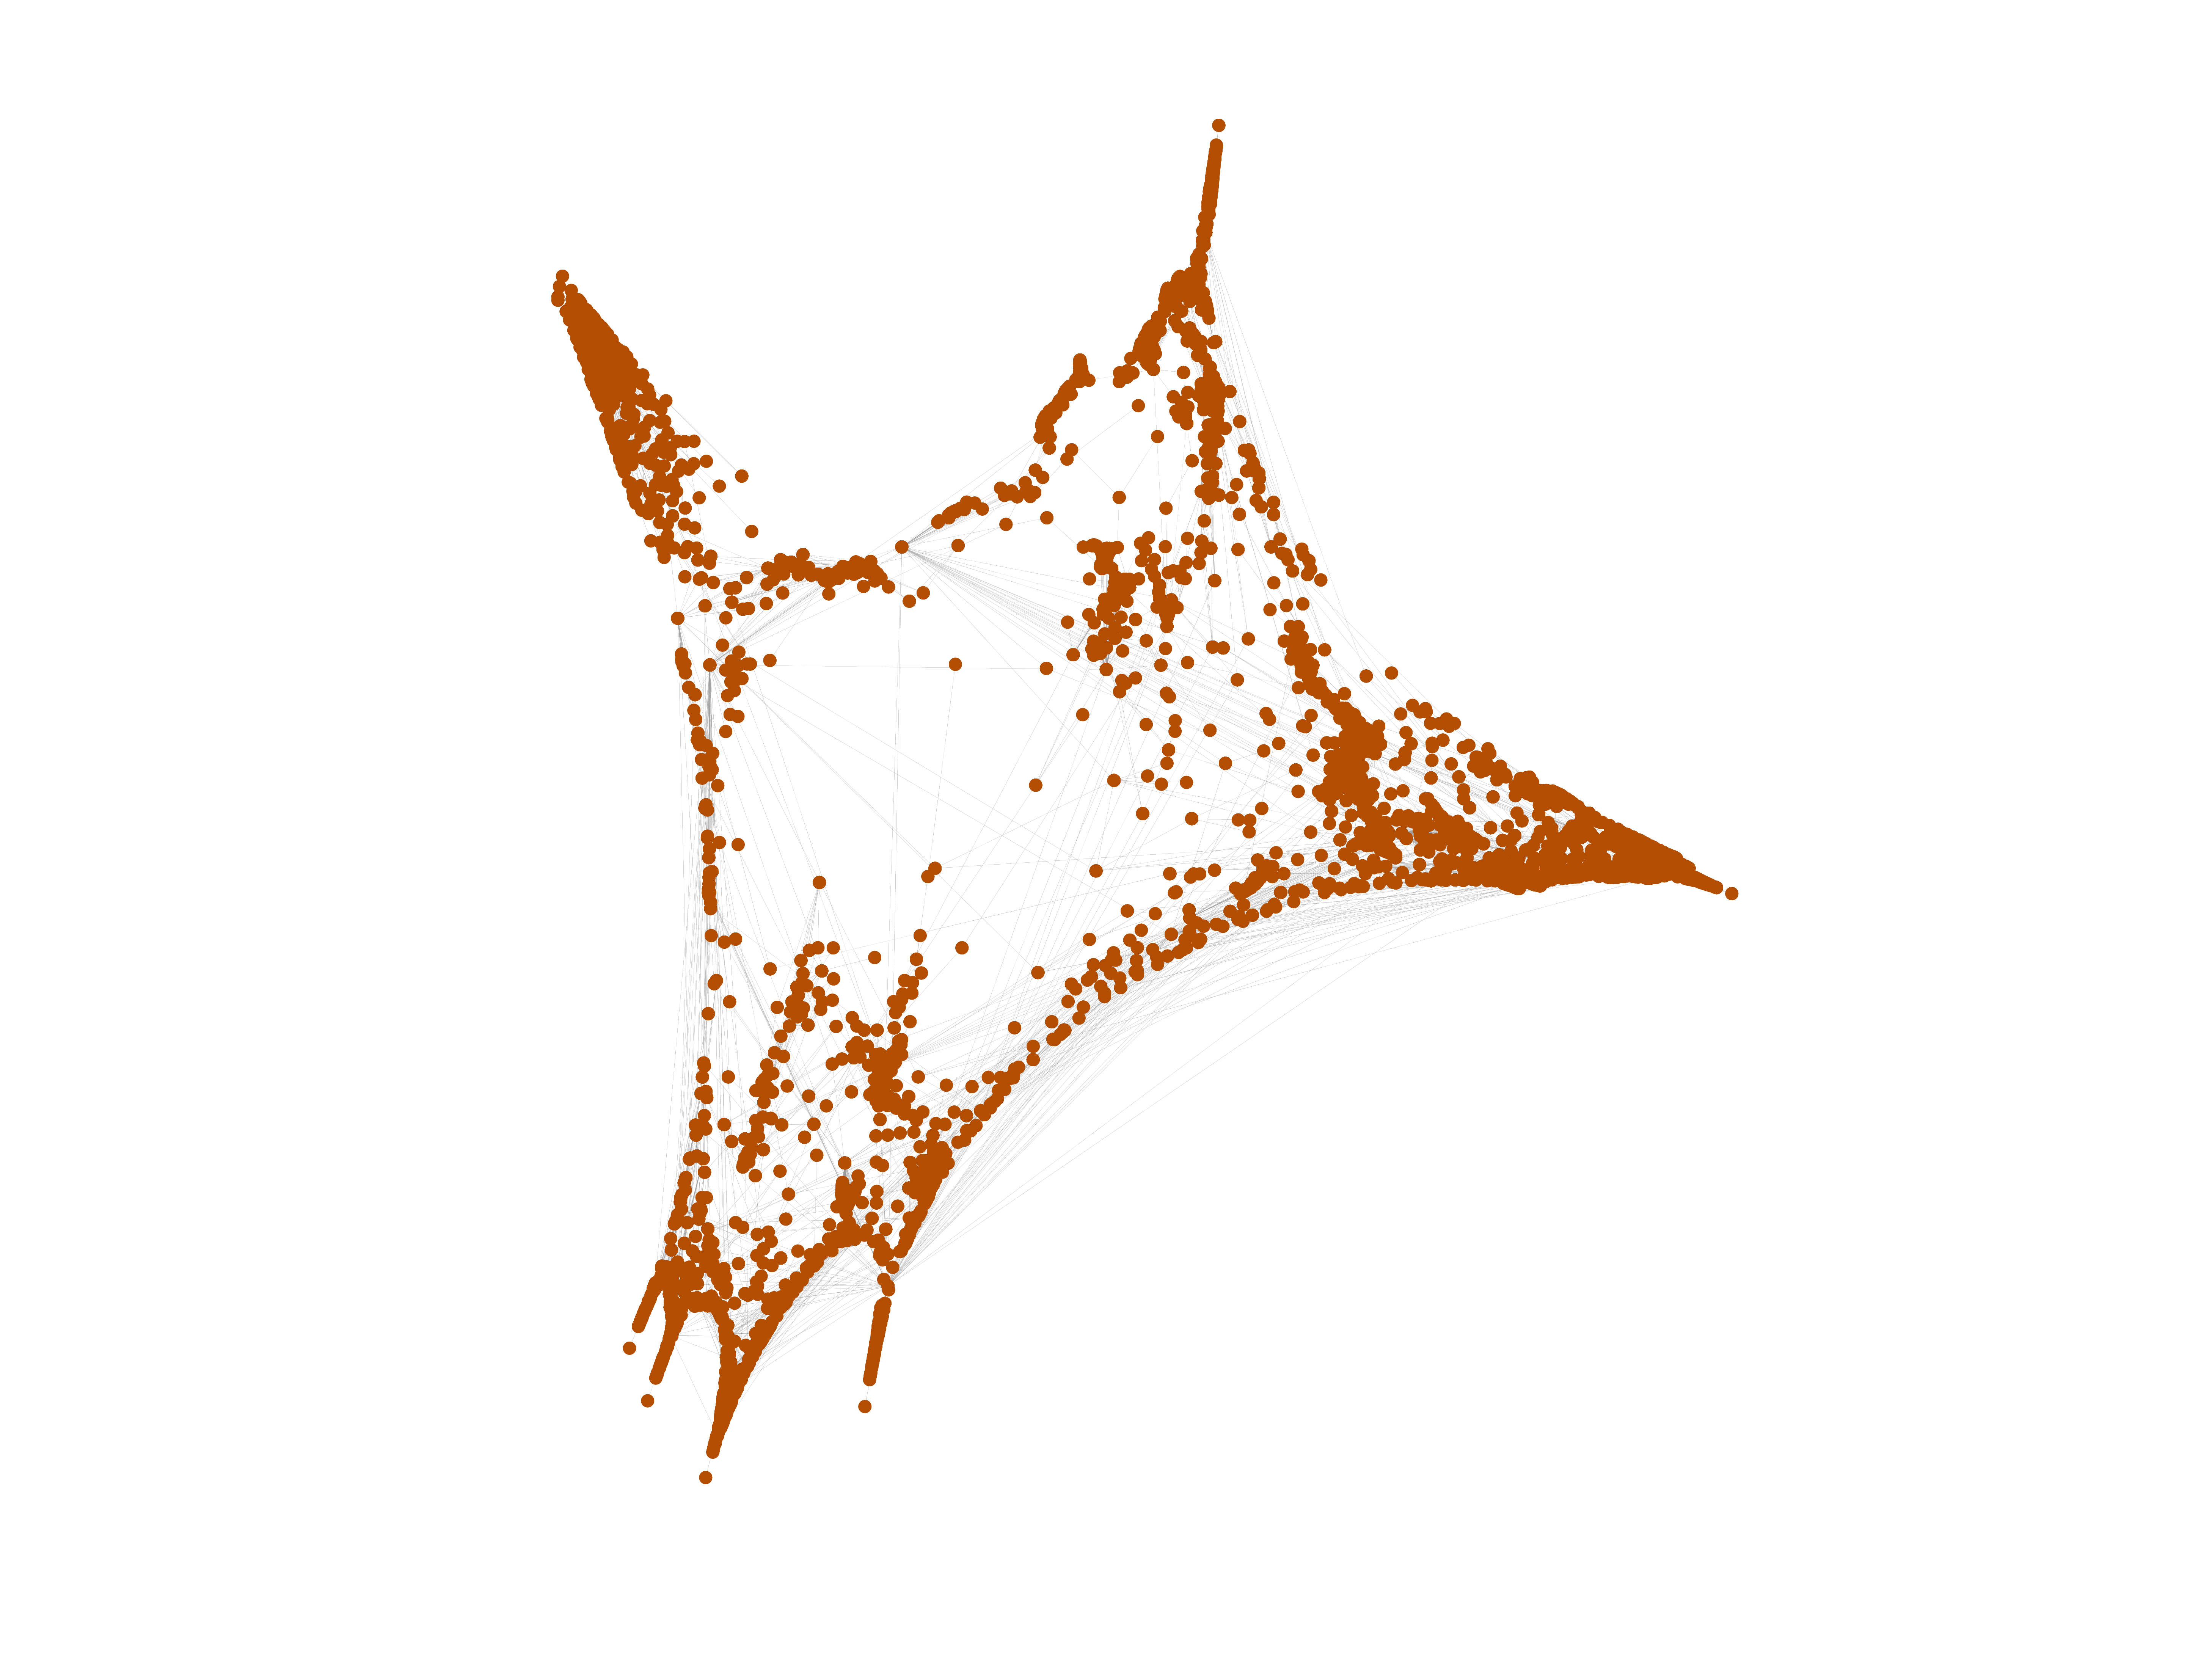
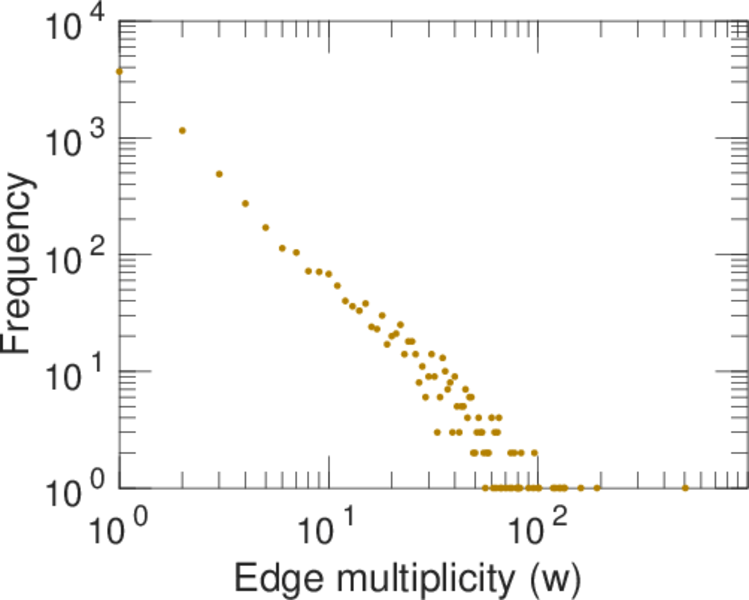
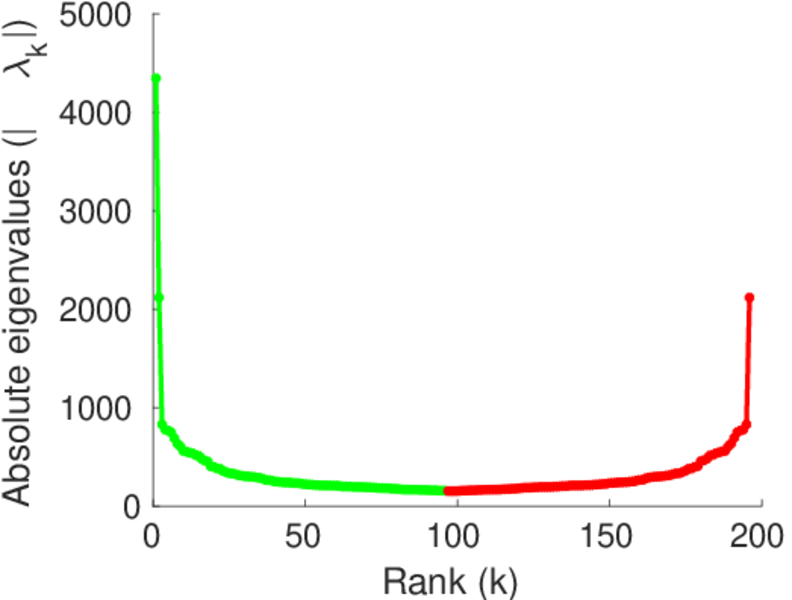
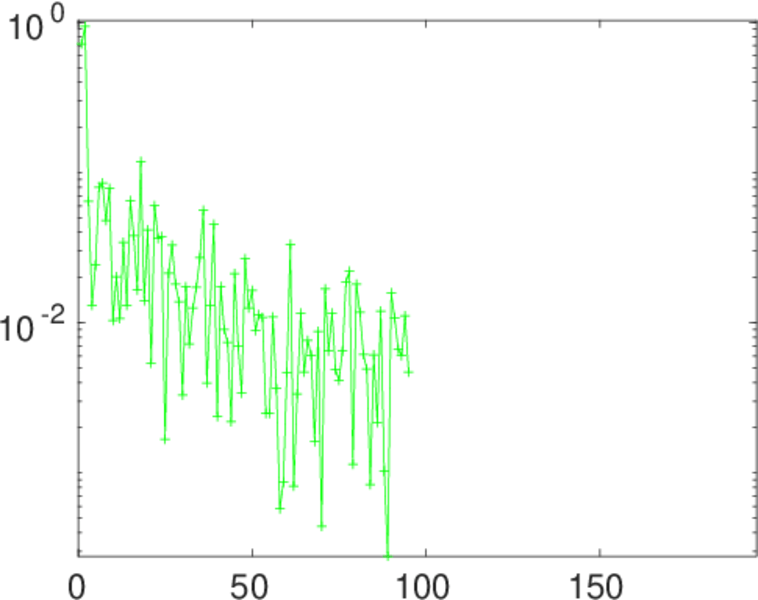
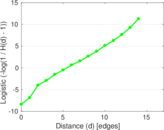
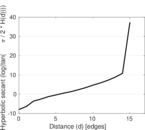
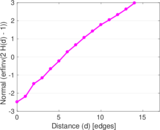
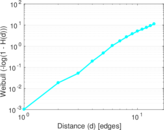
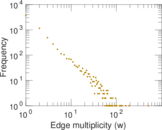
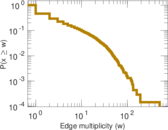
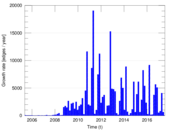
Plots


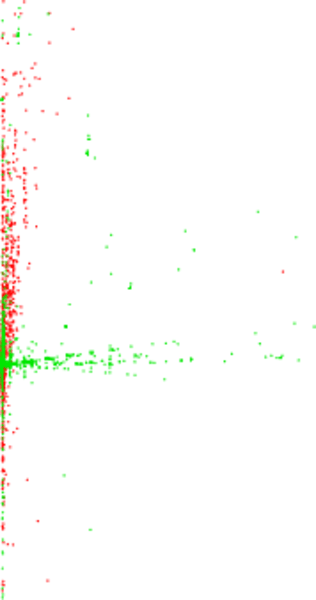
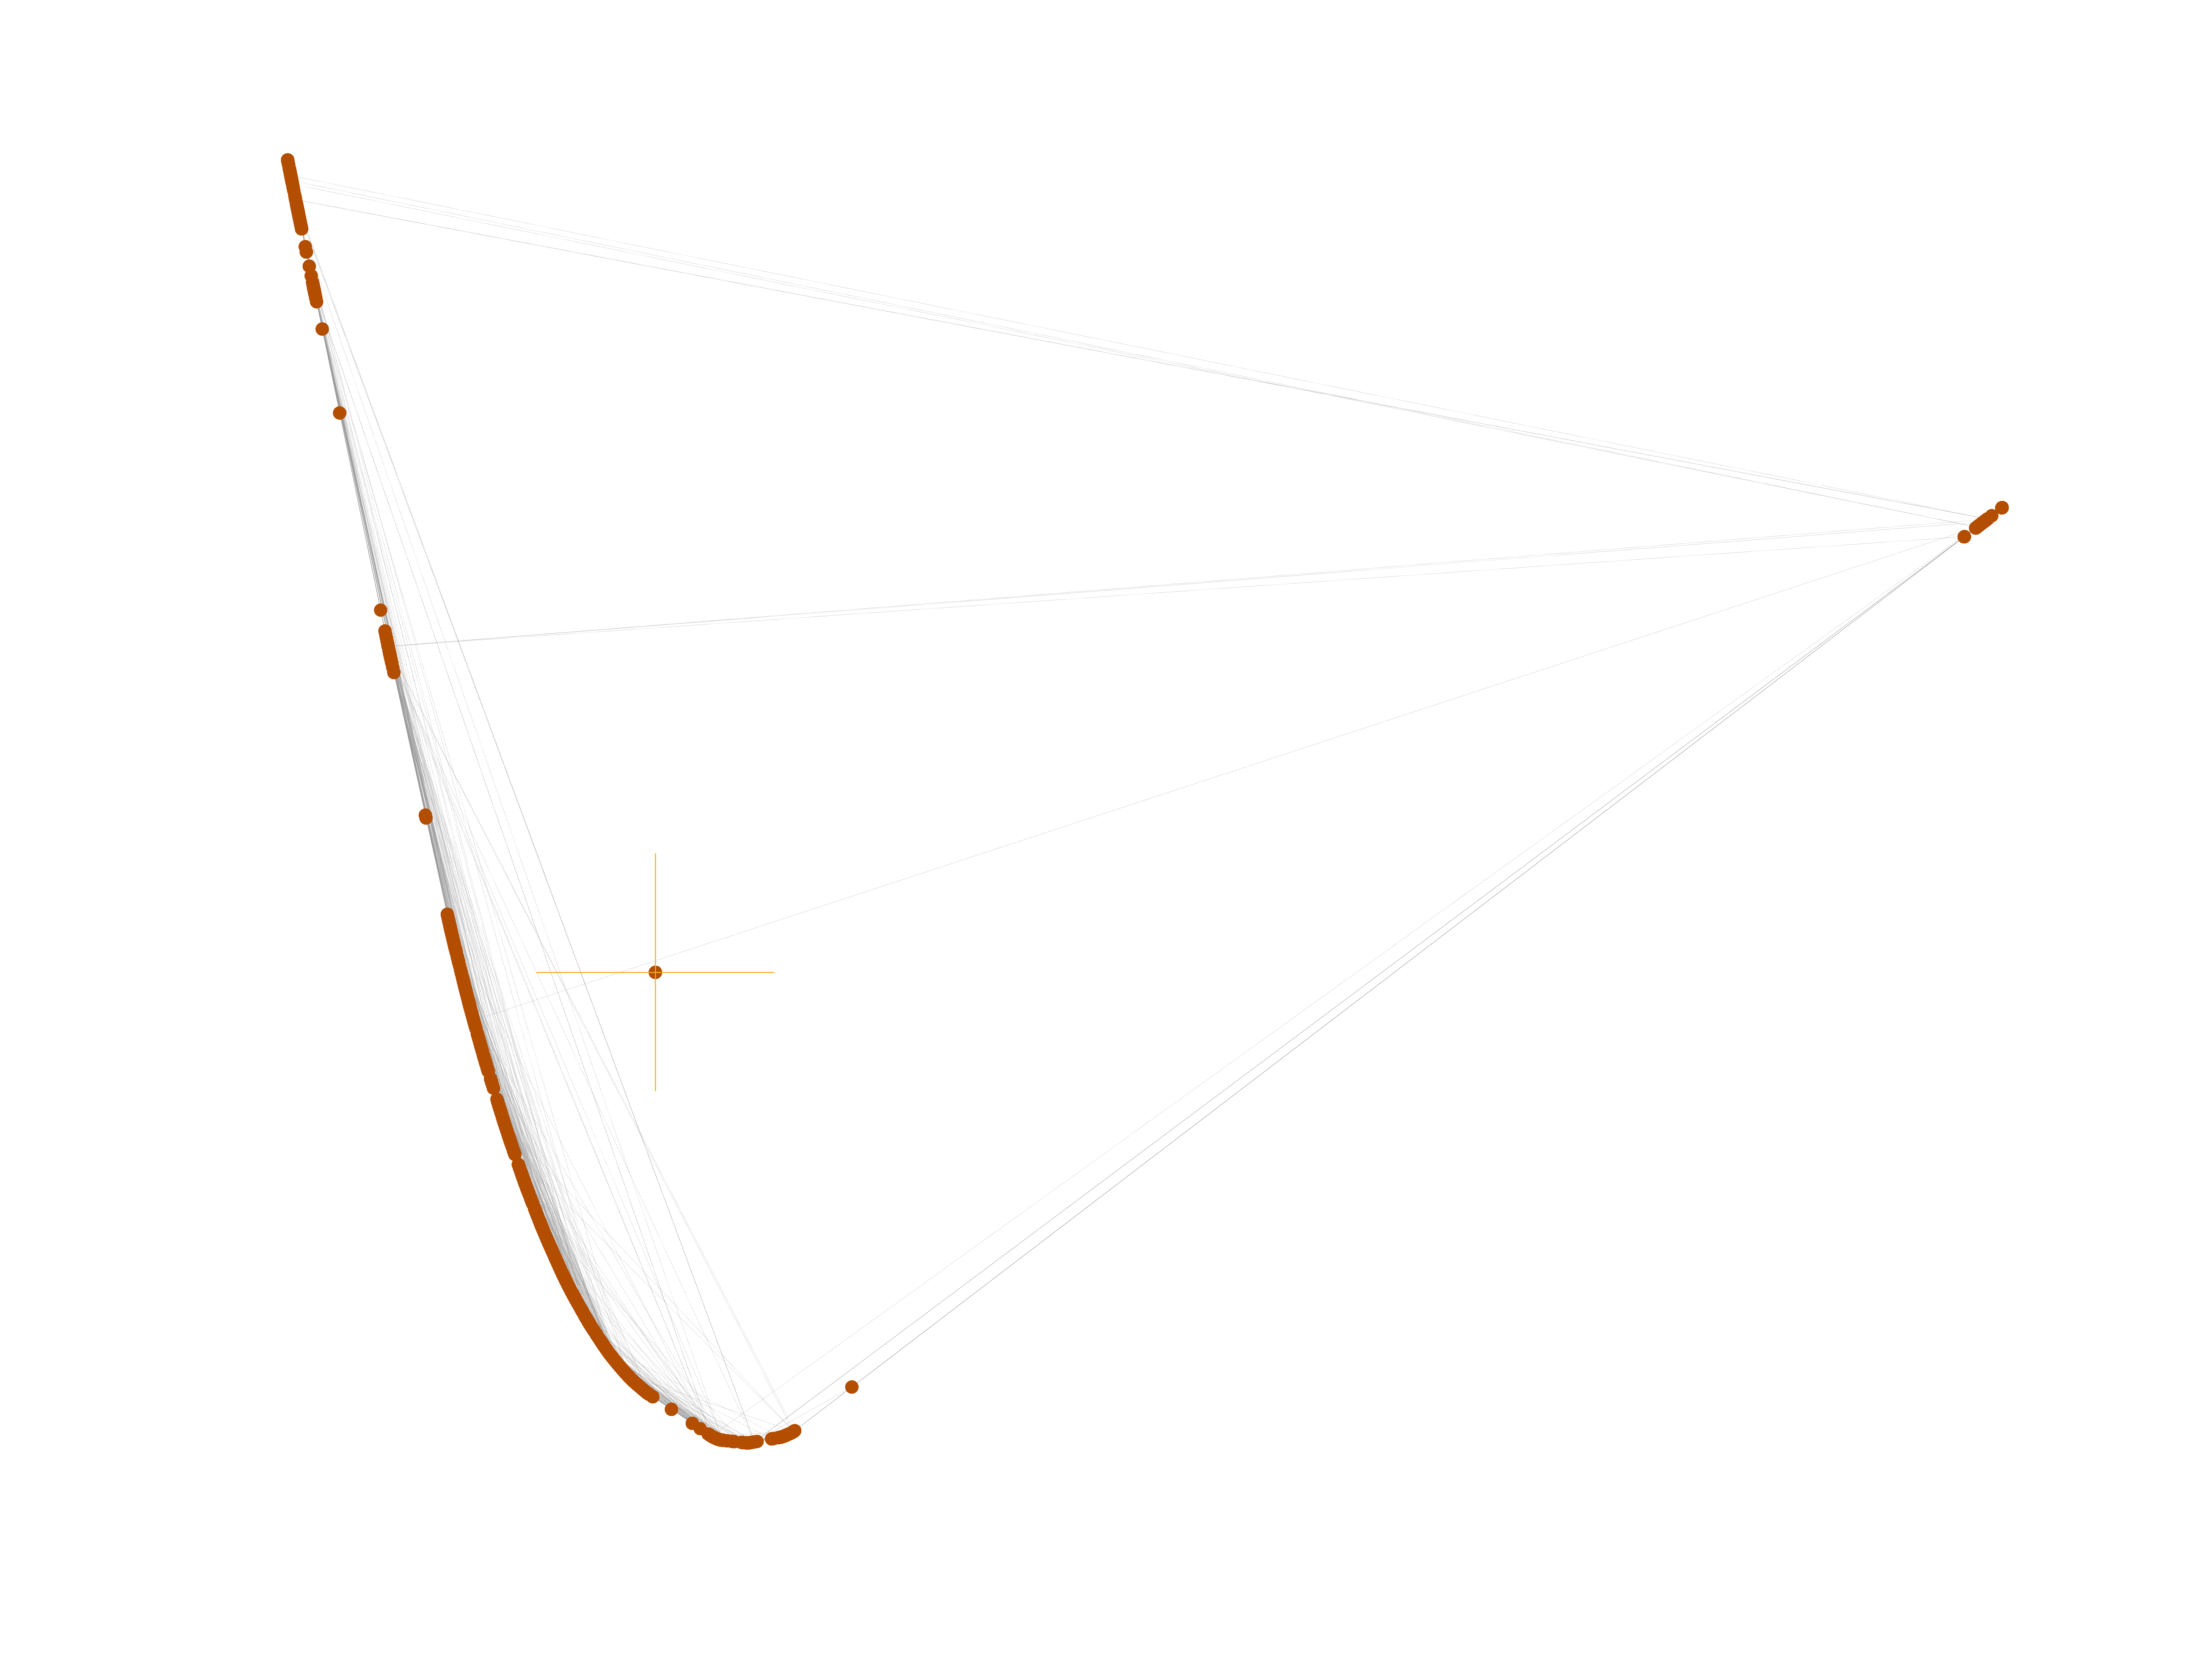
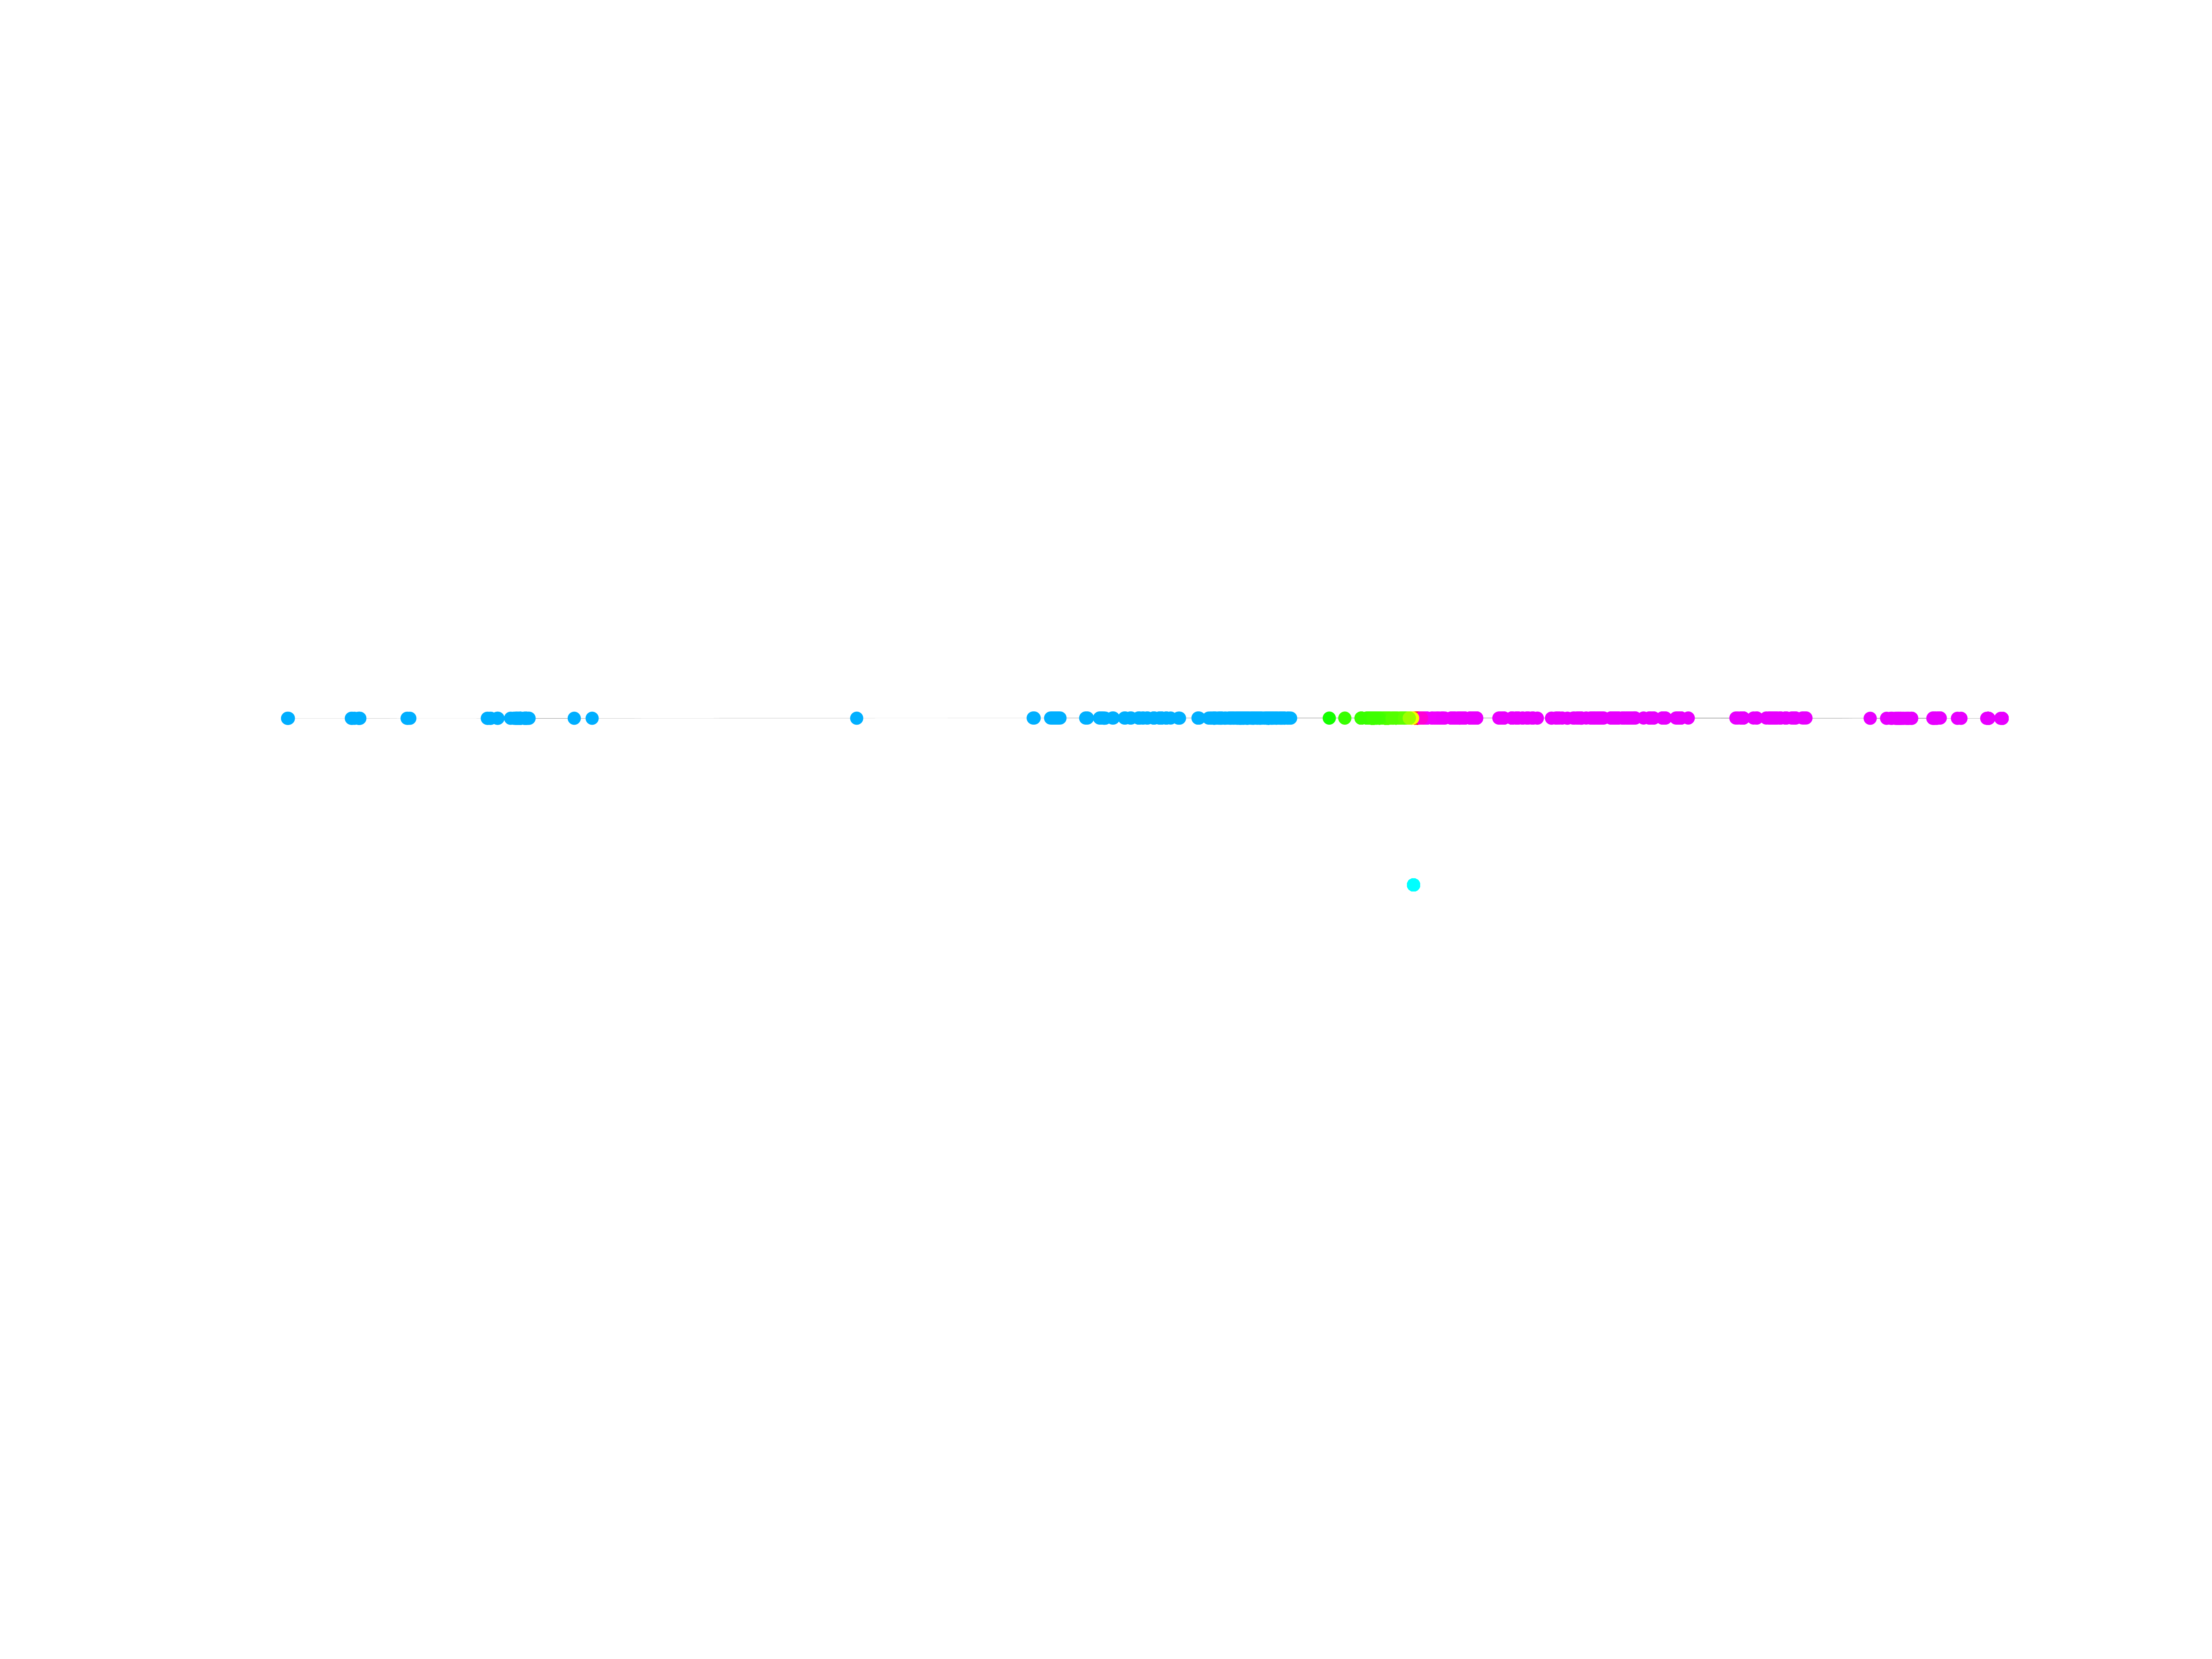
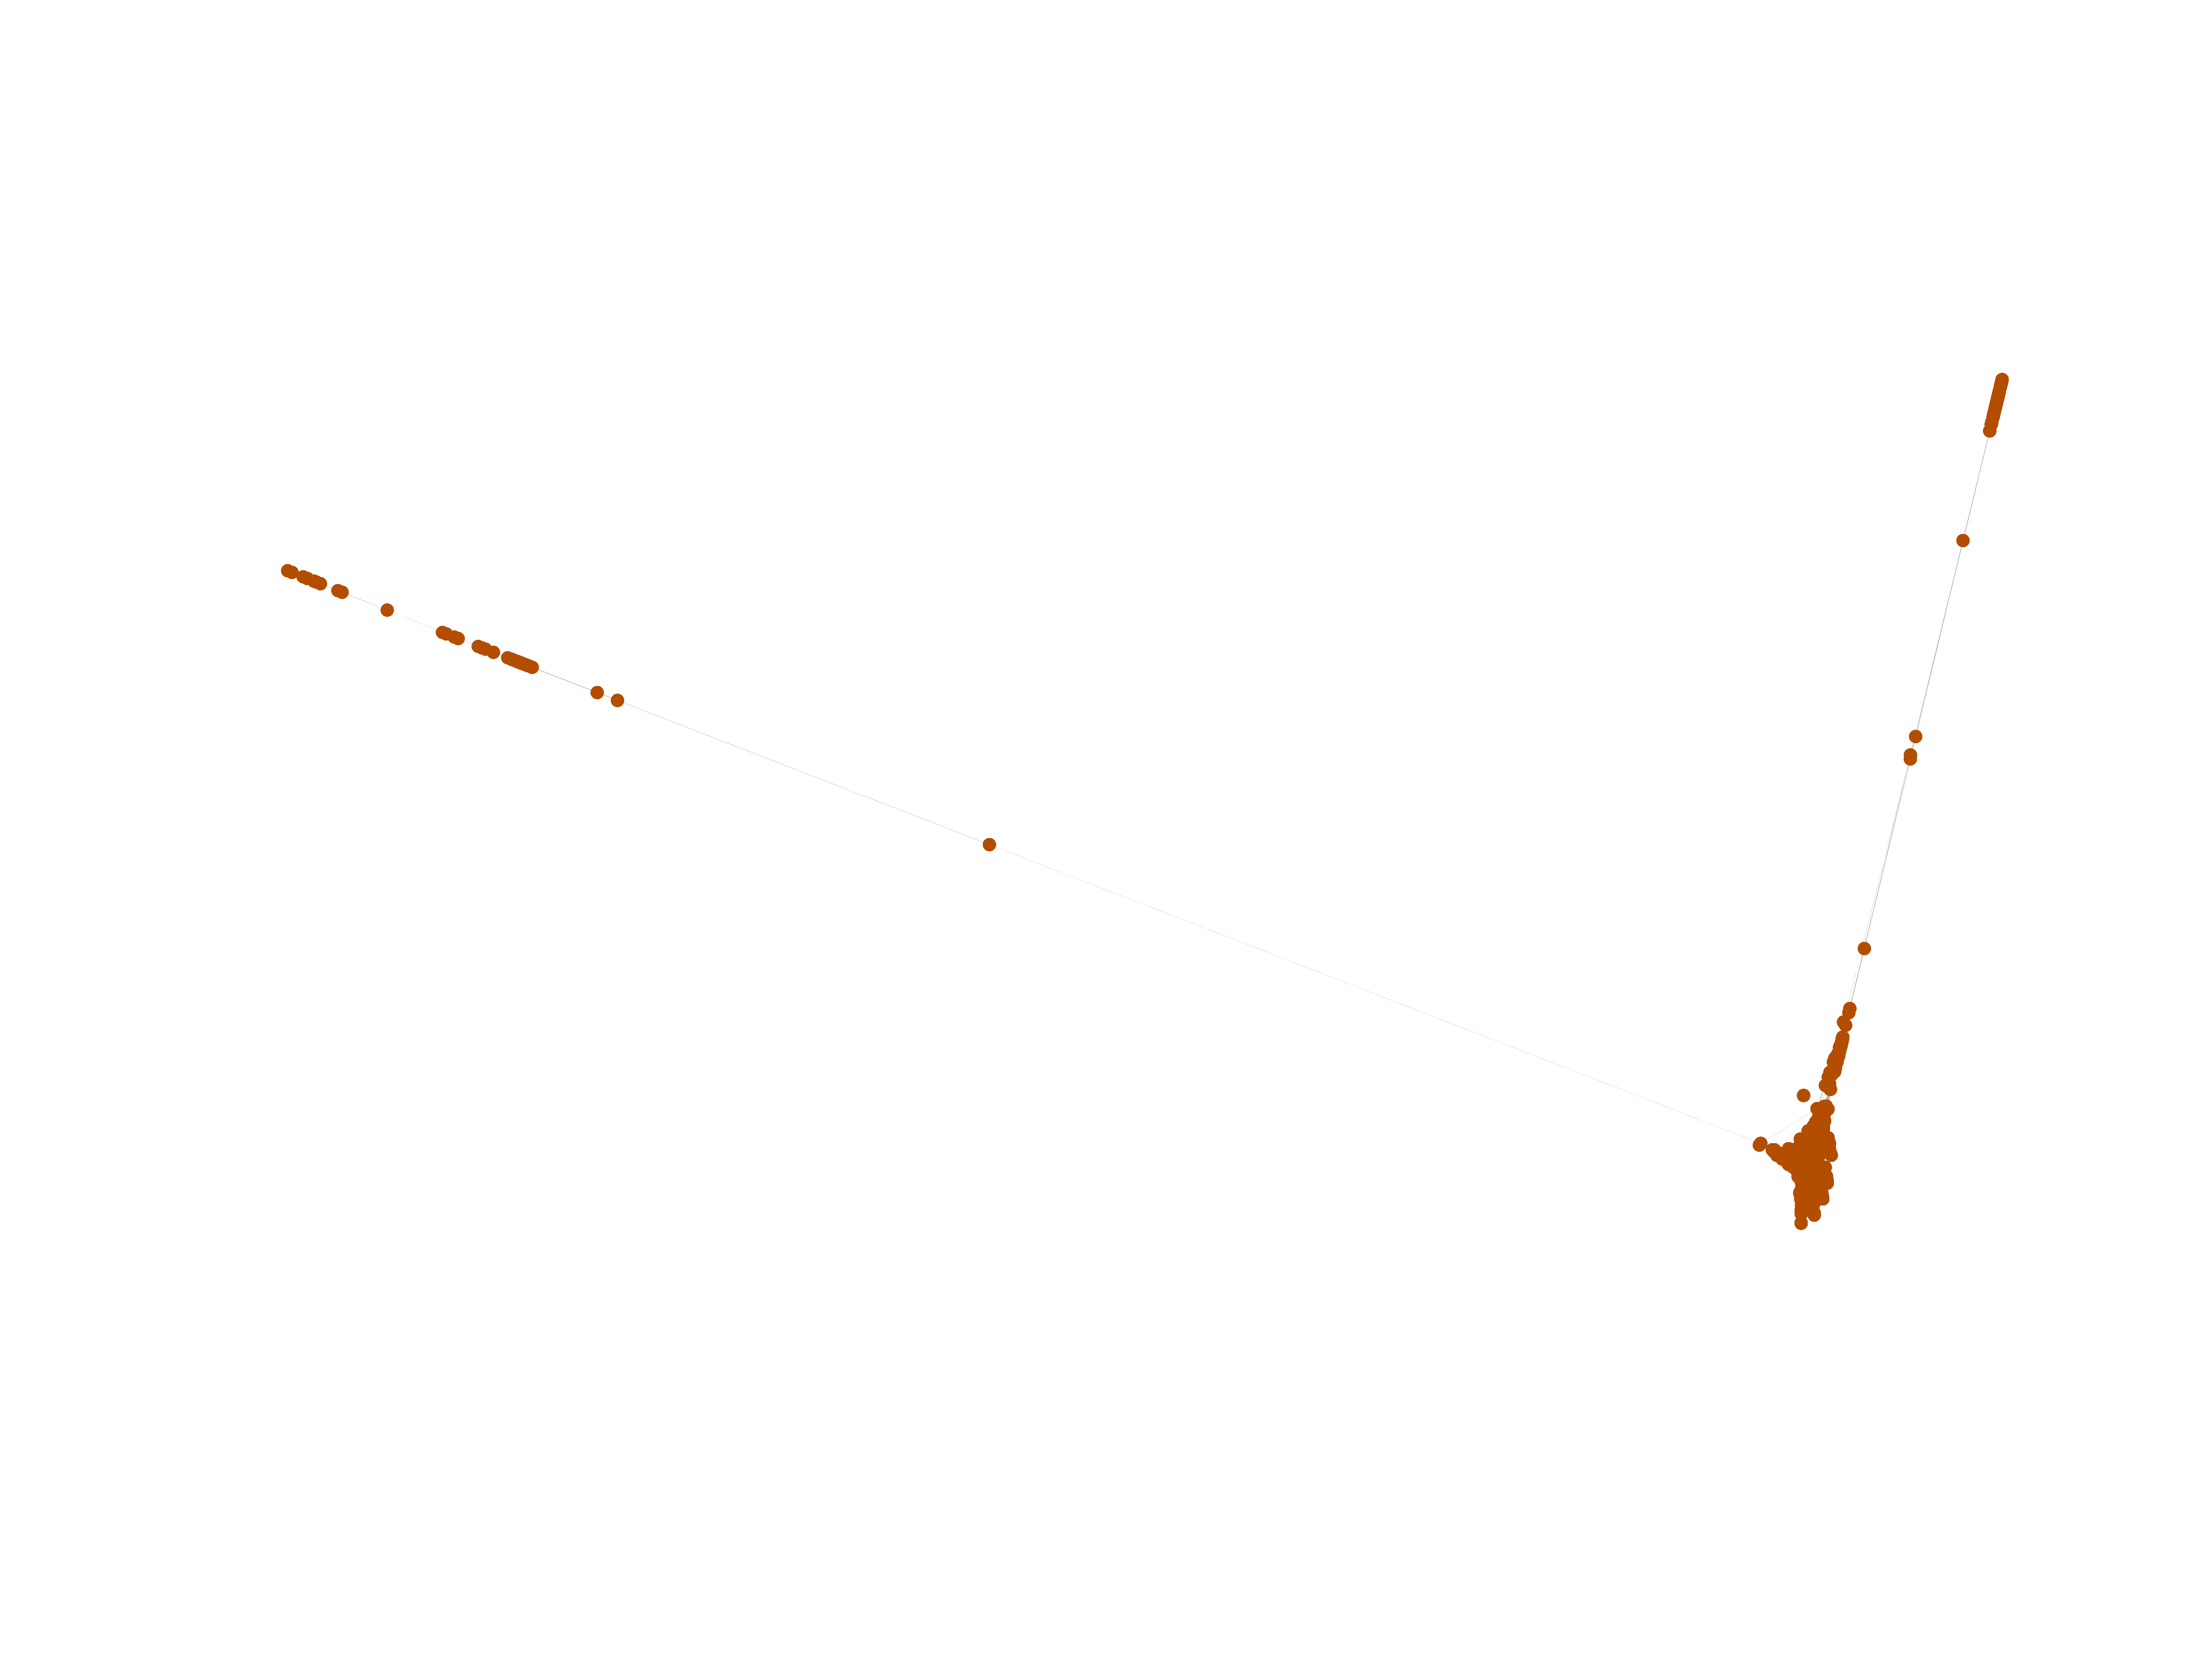
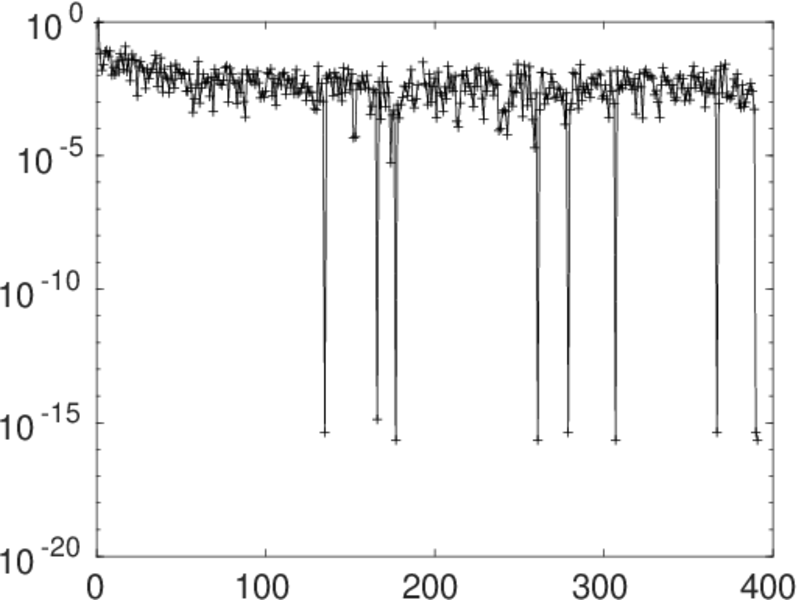
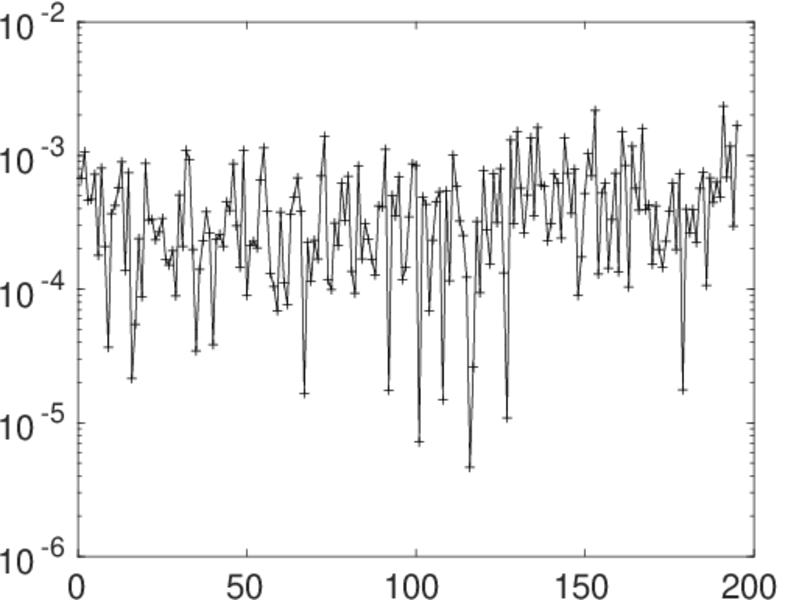
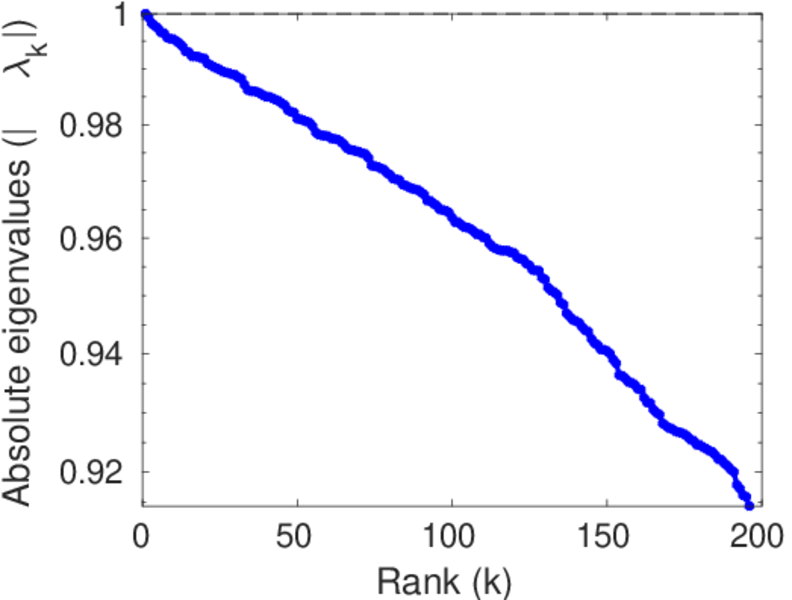
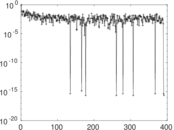
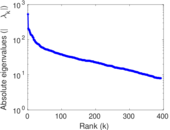
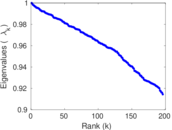
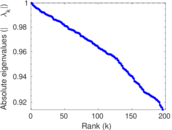
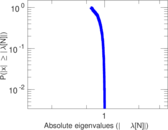
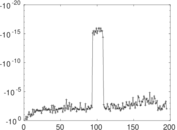
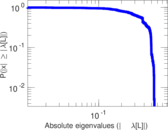
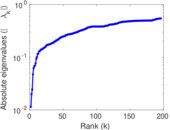
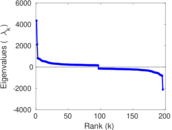
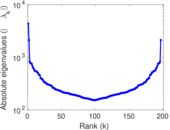
Matrix decompositions plots


Downloads
References
|
[1]
|
Jérôme Kunegis.
KONECT – The Koblenz Network Collection.
In Proc. Int. Conf. on World Wide Web Companion, pages
1343–1350, 2013.
[ http ]
|
|
[2]
|
Wikimedia Foundation.
Wikimedia downloads.
http://dumps.wikimedia.org/, January 2010.
|
 KONECT ‣ Networks ‣
Buy Me a Coffee
KONECT ‣ Networks ‣
Buy Me a Coffee