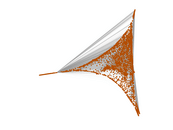
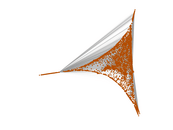
Wikivoyage edits (fi)
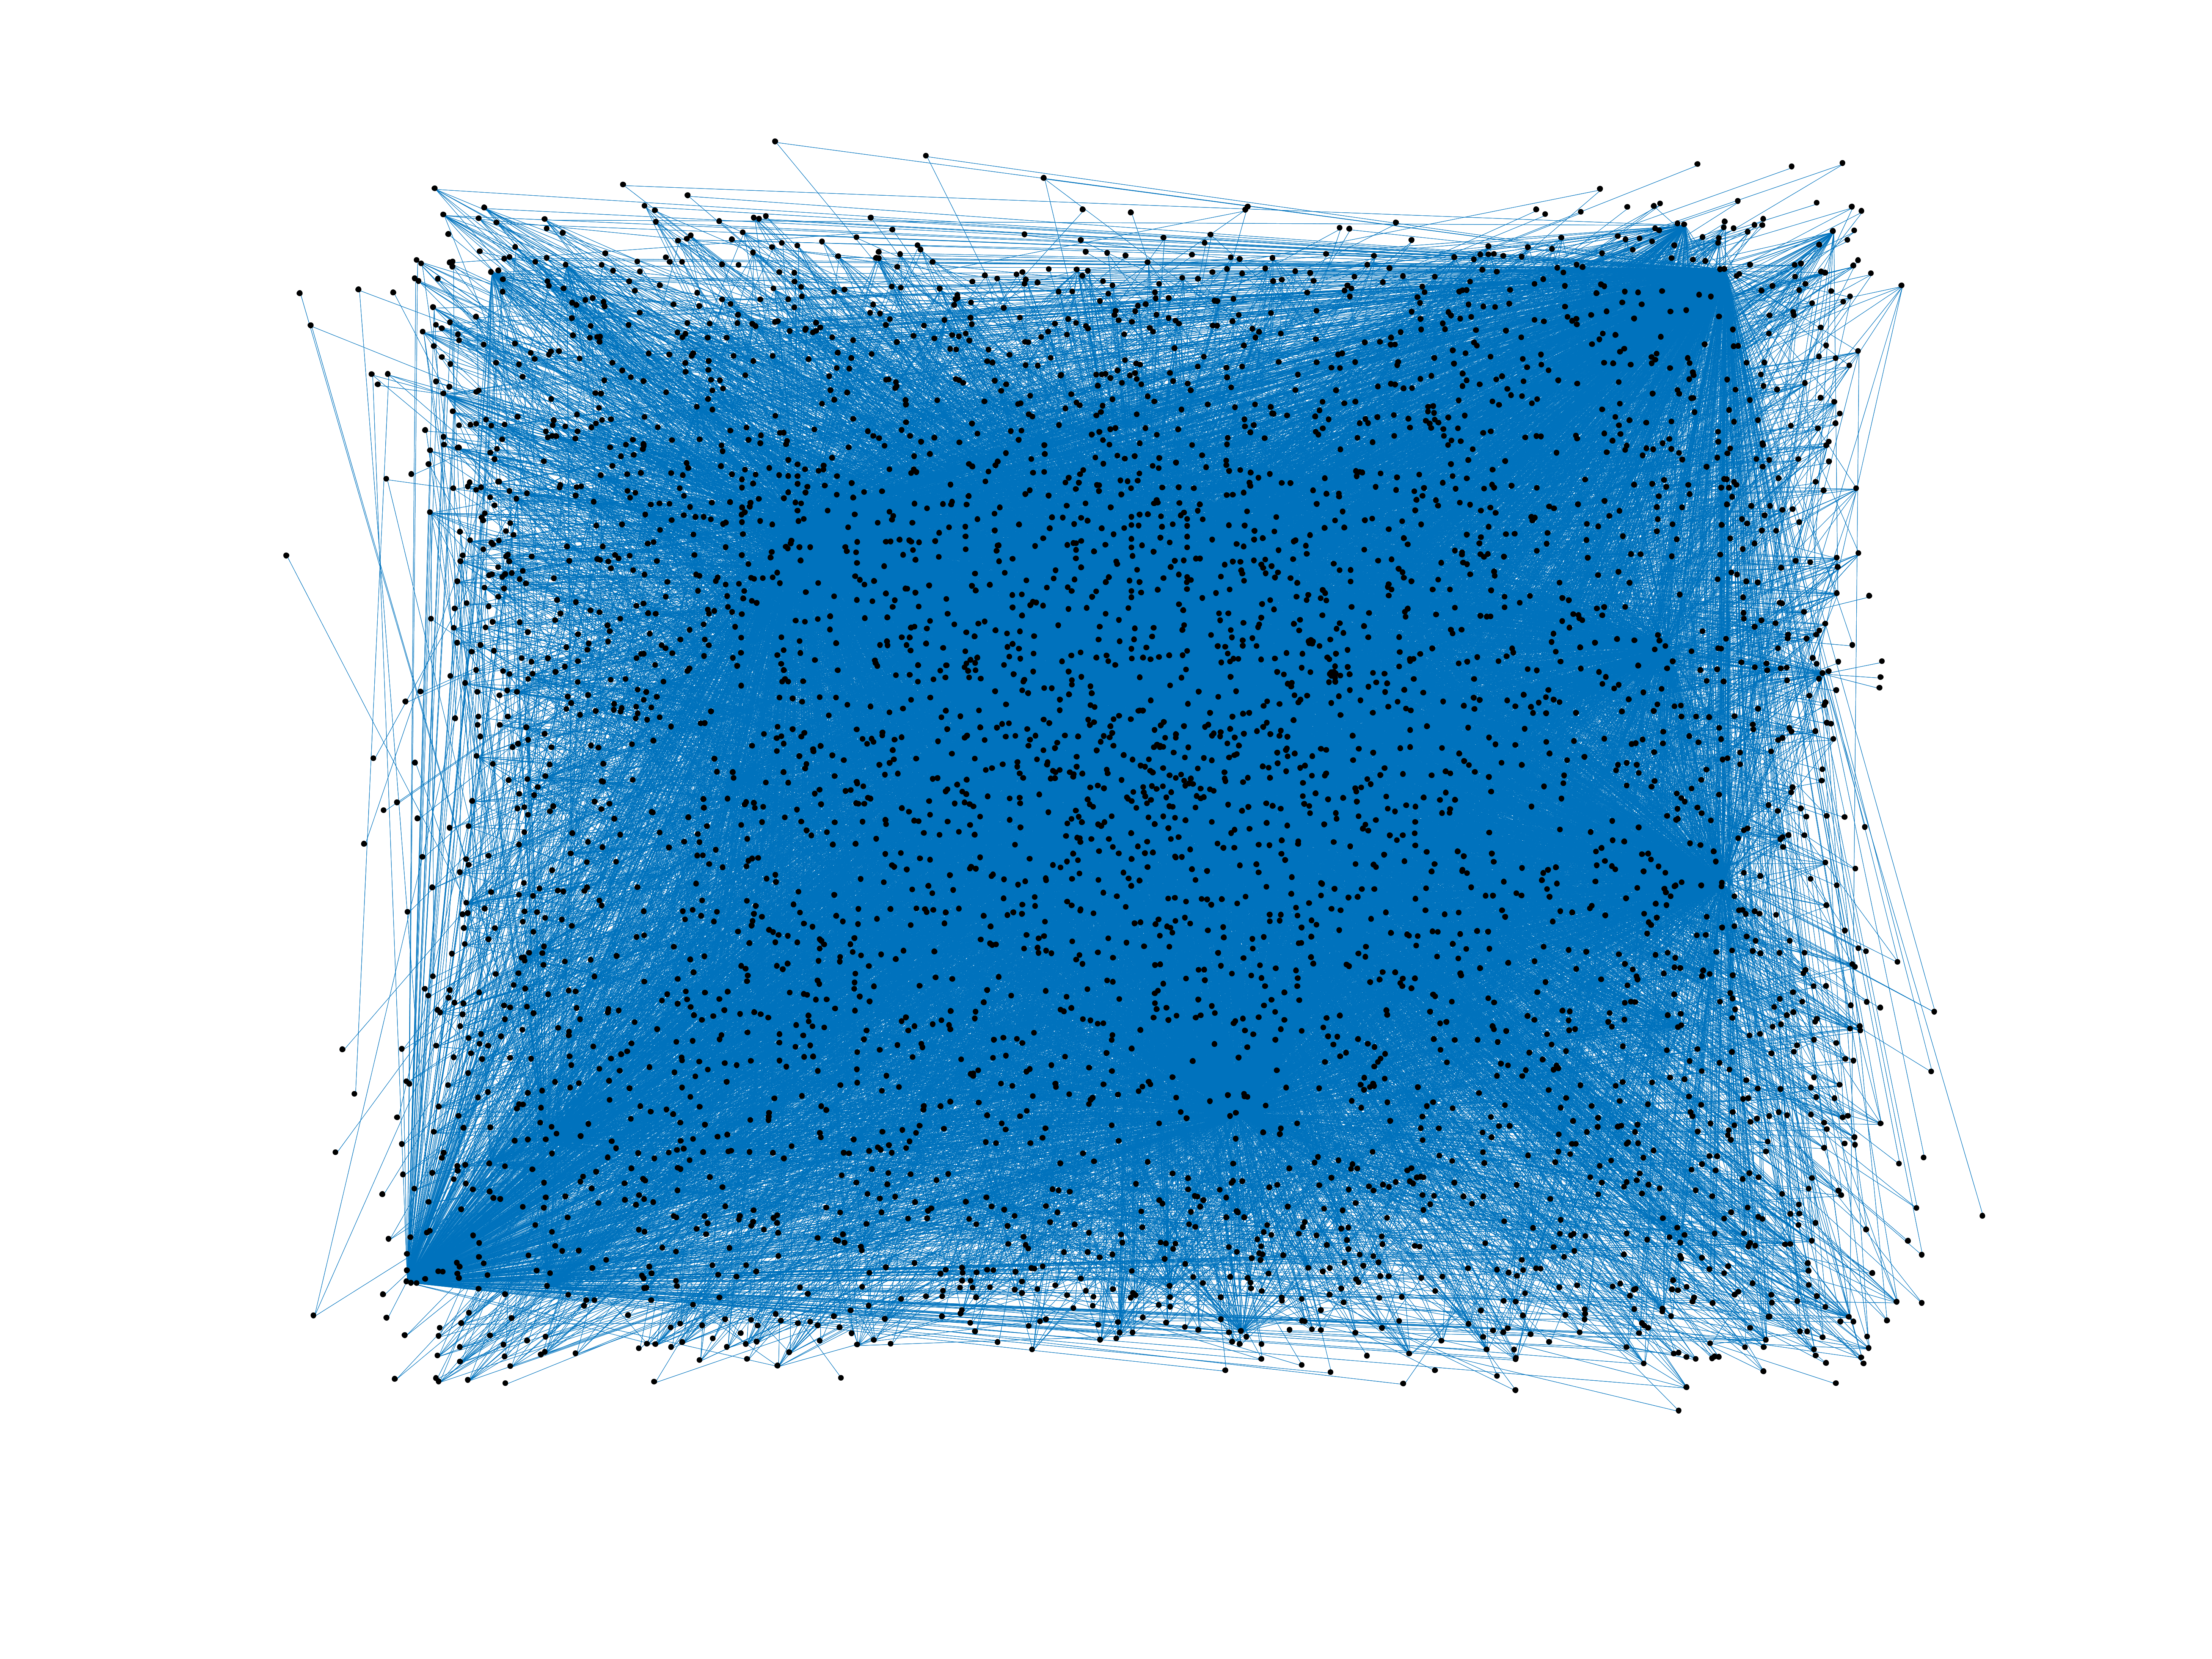
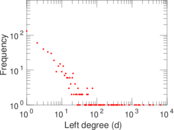
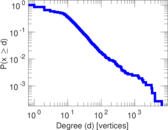
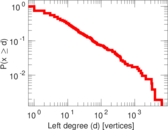
This is the bipartite edit network of the Finnish Wikivoyage. It contains users
and pages from the Finnish Wikivoyage, connected by edit events. Each edge
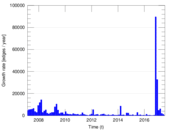
represents an edit. The dataset includes the timestamp of each edit.
Metadata
Statistics
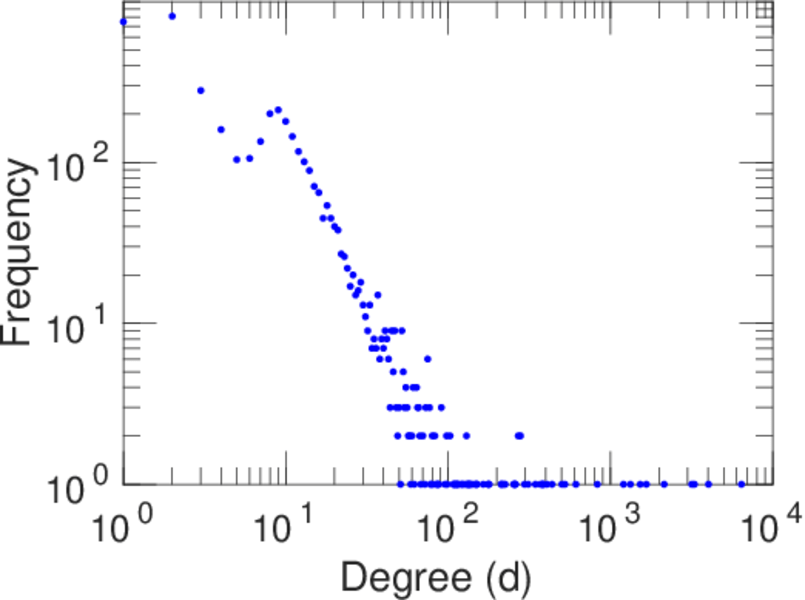
| Size | n = | 4,216
|
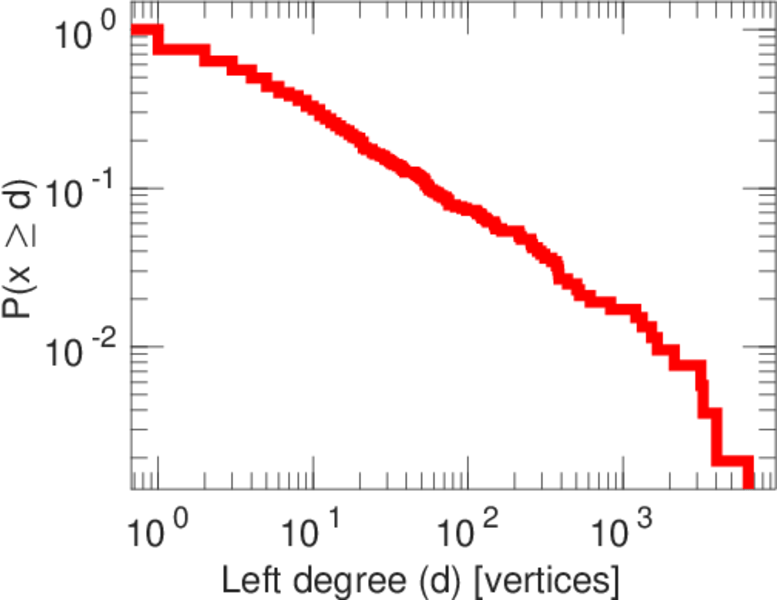
| Left size | n1 = | 523
|
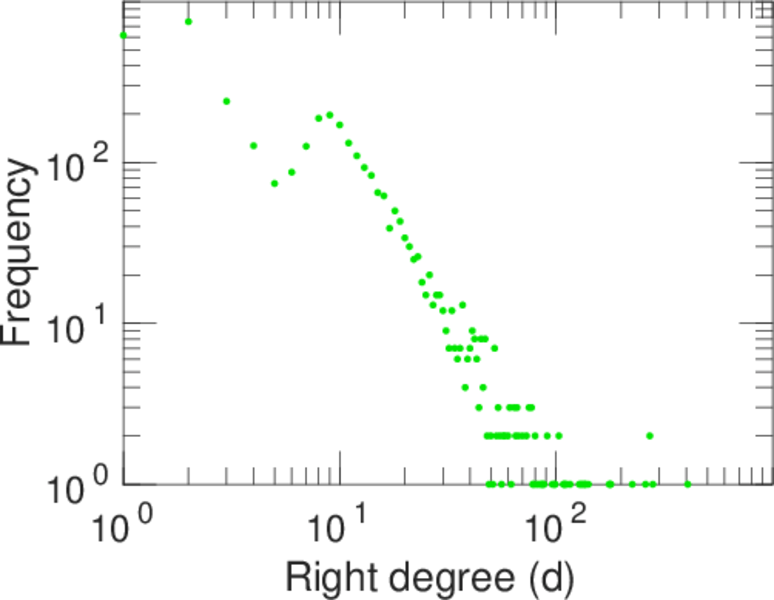
| Right size | n2 = | 3,693
|
| Volume | m = | 38,039
|
| Unique edge count | m̿ = | 18,531
|
| Wedge count | s = | 13,007,736
|
| Claw count | z = | 9,770,216,175
|
| Cross count | x = | 6,323,672,150,951
|
| Square count | q = | 16,676,910
|
| 4-Tour count | T4 = | 185,515,058
|
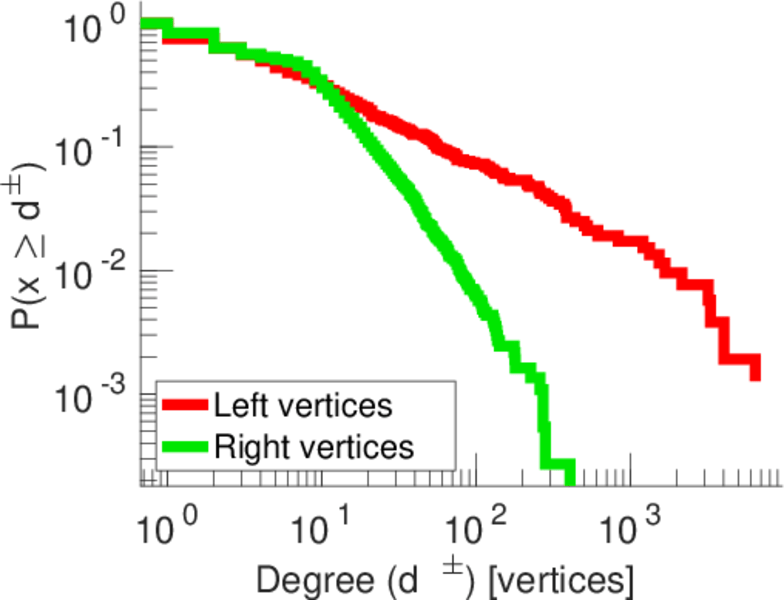
| Maximum degree | dmax = | 6,432
|
| Maximum left degree | d1max = | 6,432
|
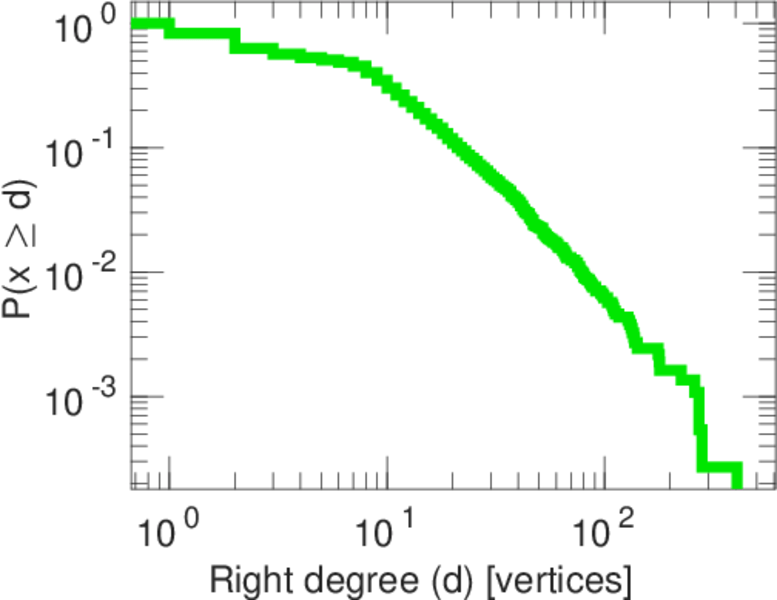
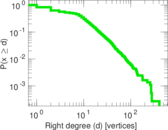
| Maximum right degree | d2max = | 406
|
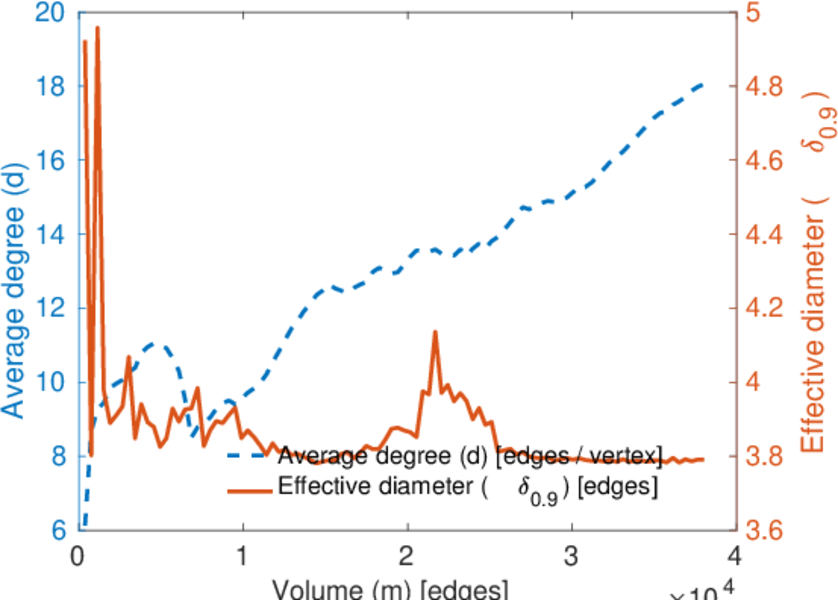
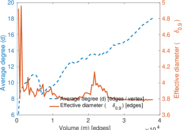
| Average degree | d = | 18.045 1
|
| Average left degree | d1 = | 72.732 3
|
| Average right degree | d2 = | 10.300 3
|
| Fill | p = | 0.009 594 40
|
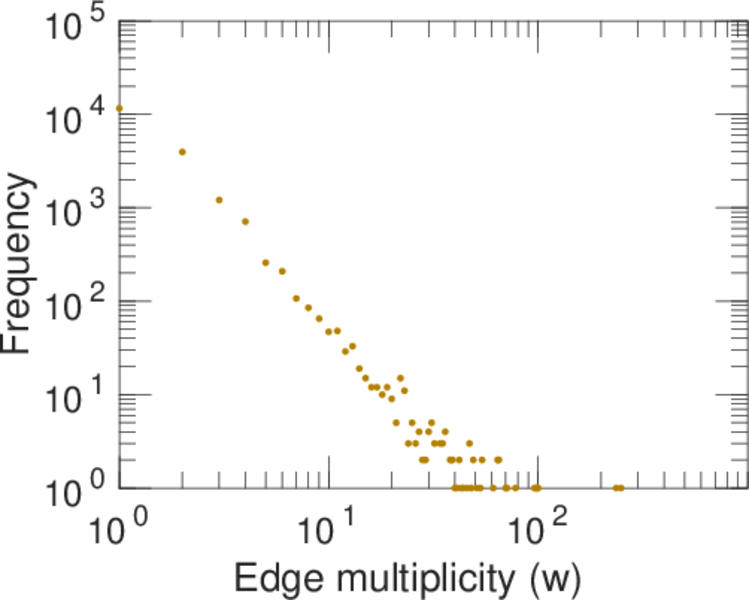
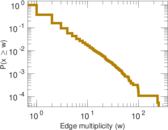
| Average edge multiplicity | m̃ = | 2.052 72
|
| Size of LCC | N = | 4,201
|
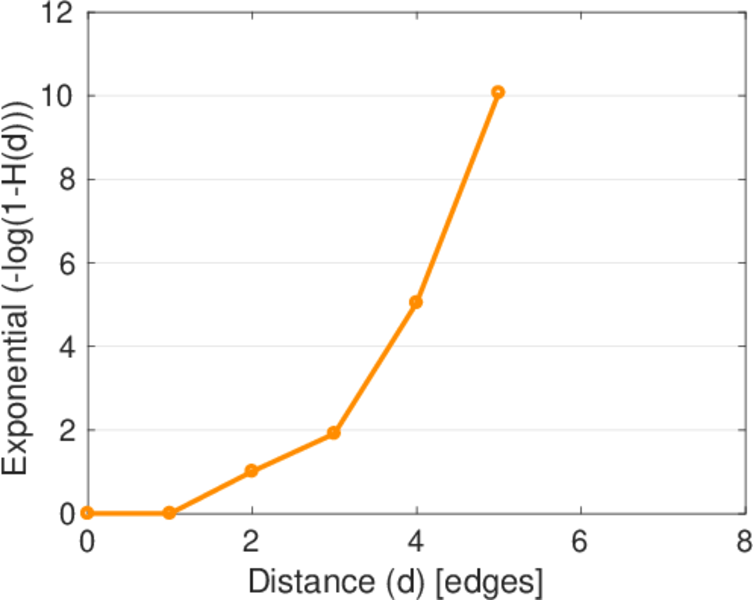
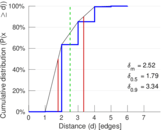
| Diameter | δ = | 7
|
| 50-Percentile effective diameter | δ0.5 = | 1.786 32
|
| 90-Percentile effective diameter | δ0.9 = | 3.337 55
|
| Median distance | δM = | 2
|
| Mean distance | δm = | 2.516 68
|
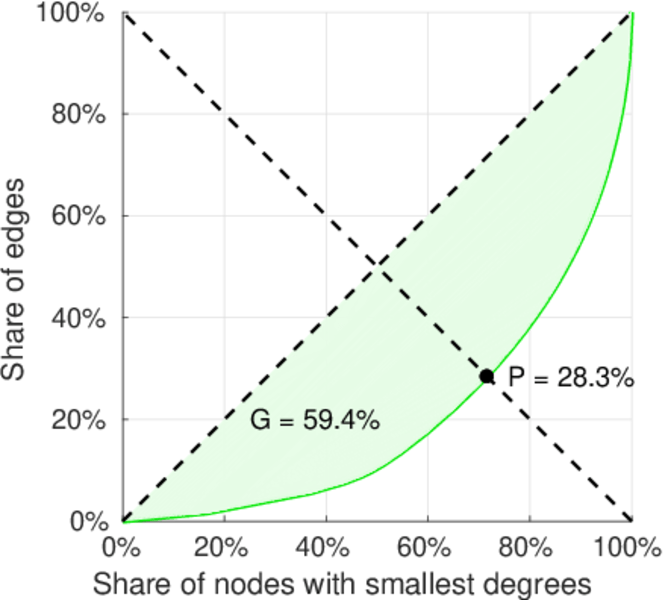
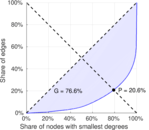
| Gini coefficient | G = | 0.768 501
|
| Balanced inequality ratio | P = | 0.206 091
|
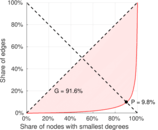
| Left balanced inequality ratio | P1 = | 0.097 715 5
|
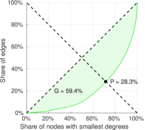
| Right balanced inequality ratio | P2 = | 0.283 314
|
| Relative edge distribution entropy | Her = | 0.758 549
|
| Power law exponent | γ = | 1.812 79
|
| Tail power law exponent | γt = | 3.031 00
|
| Tail power law exponent with p | γ3 = | 3.031 00
|
| p-value | p = | 0.000 00
|
| Left tail power law exponent with p | γ3,1 = | 1.661 00
|
| Left p-value | p1 = | 0.058 000 0
|
| Right tail power law exponent with p | γ3,2 = | 3.491 00
|
| Right p-value | p2 = | 0.049 000 0
|
| Degree assortativity | ρ = | −0.358 877
|
| Degree assortativity p-value | pρ = | 0.000 00
|
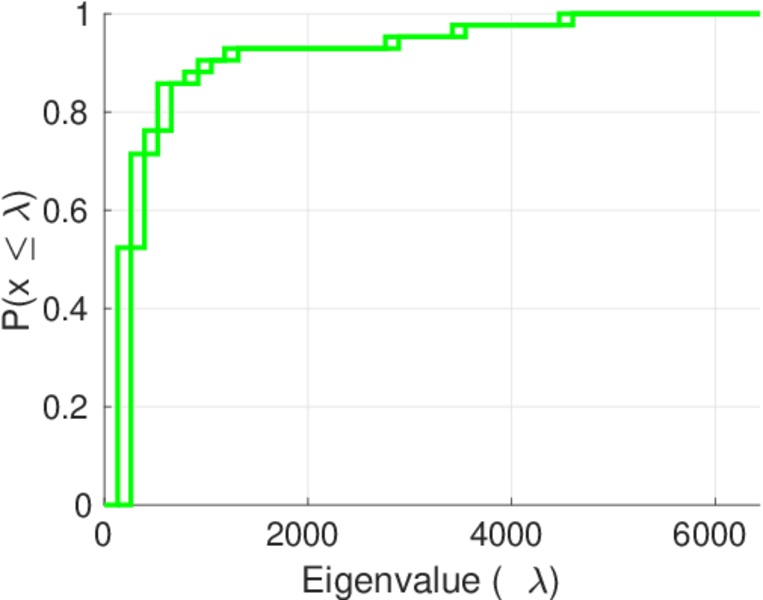
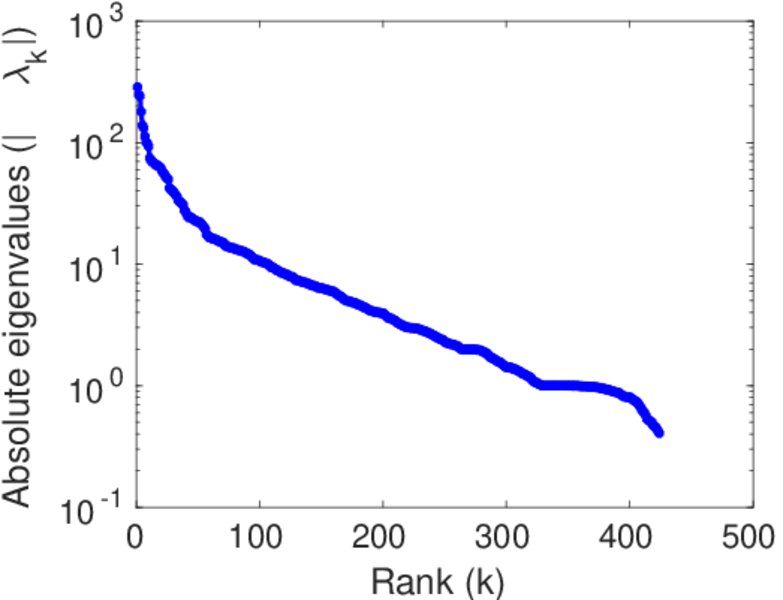
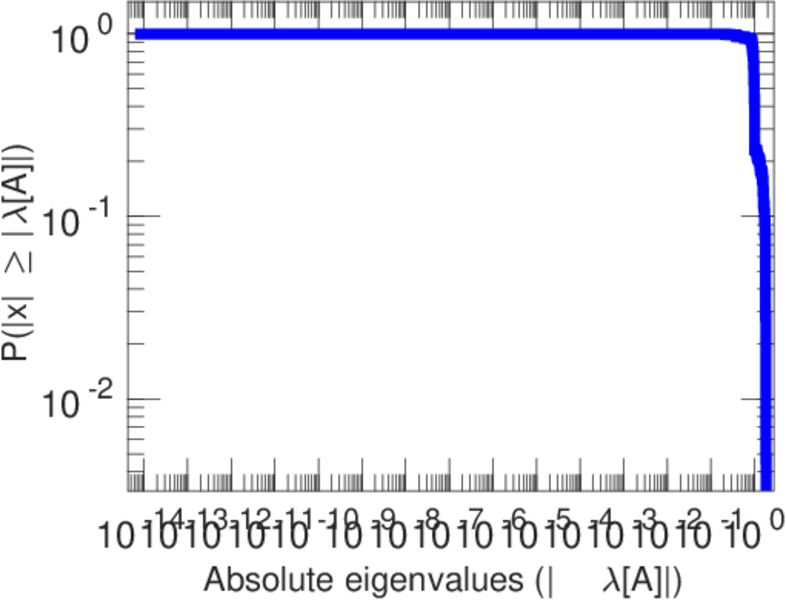
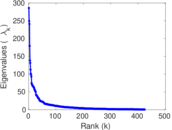
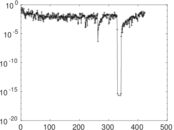
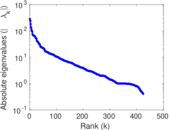
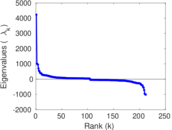
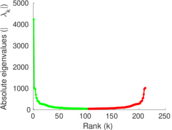
| Spectral norm | α = | 285.887
|
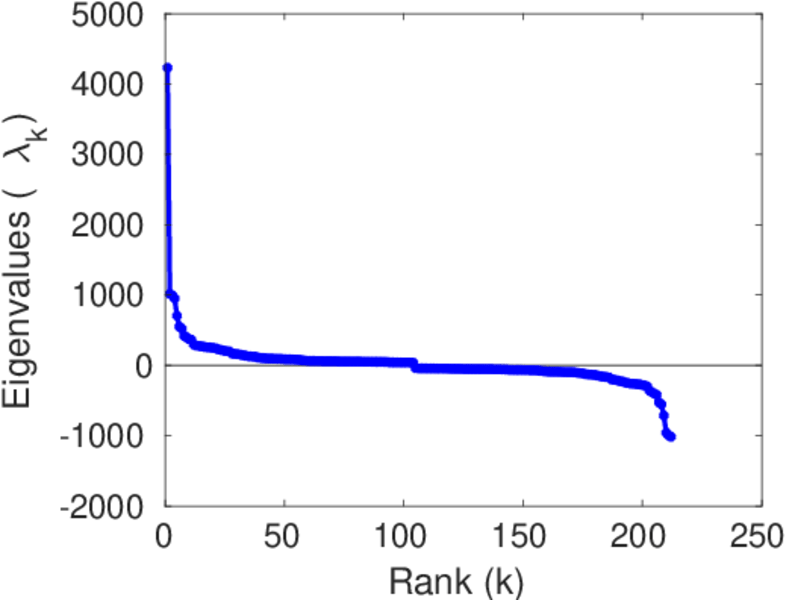
| Algebraic connectivity | a = | 0.216 321
|
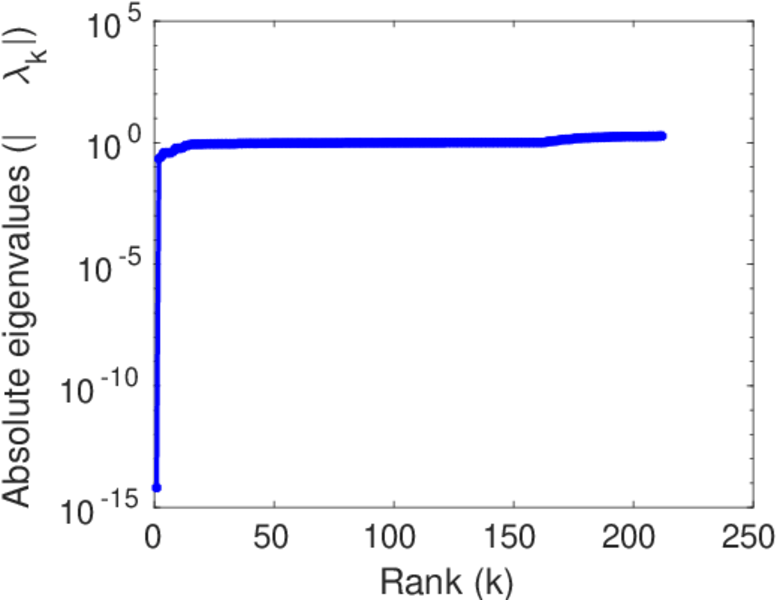
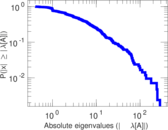
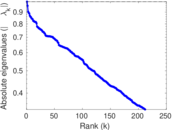
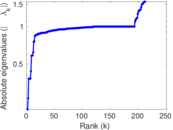
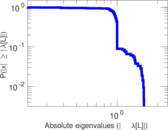
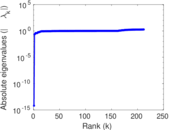
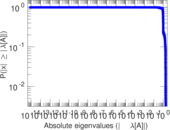
| Spectral separation | |λ1[A] / λ2[A]| = | 1.146 77
|
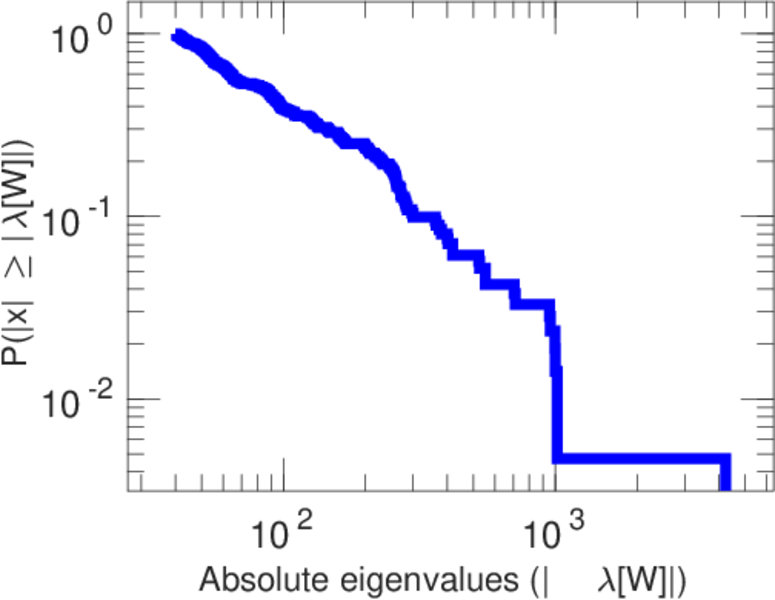
| Controllability | C = | 3,330
|
| Relative controllability | Cr = | 0.790 411
|
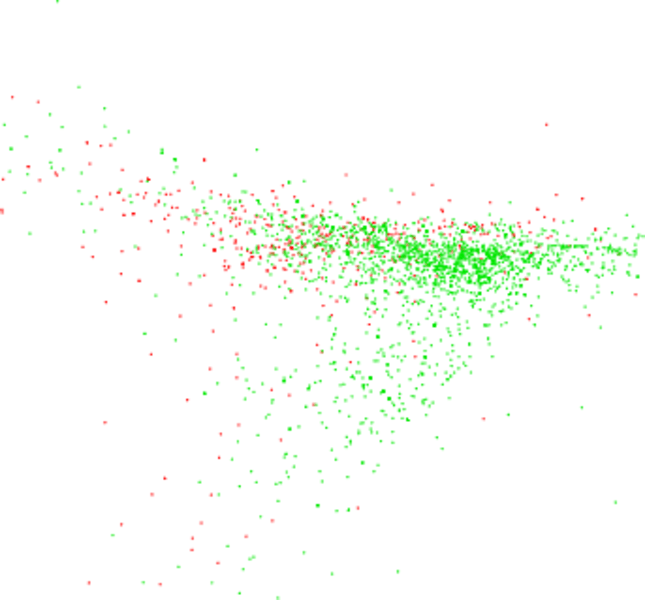
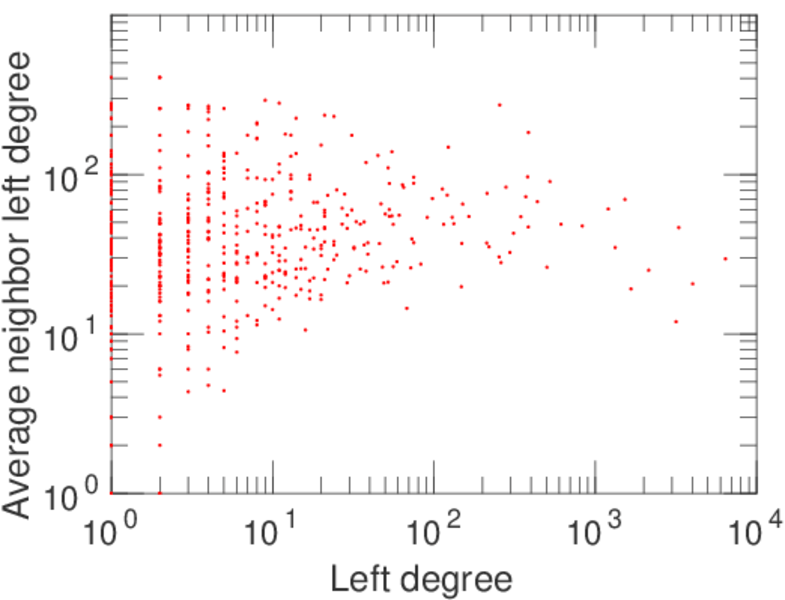
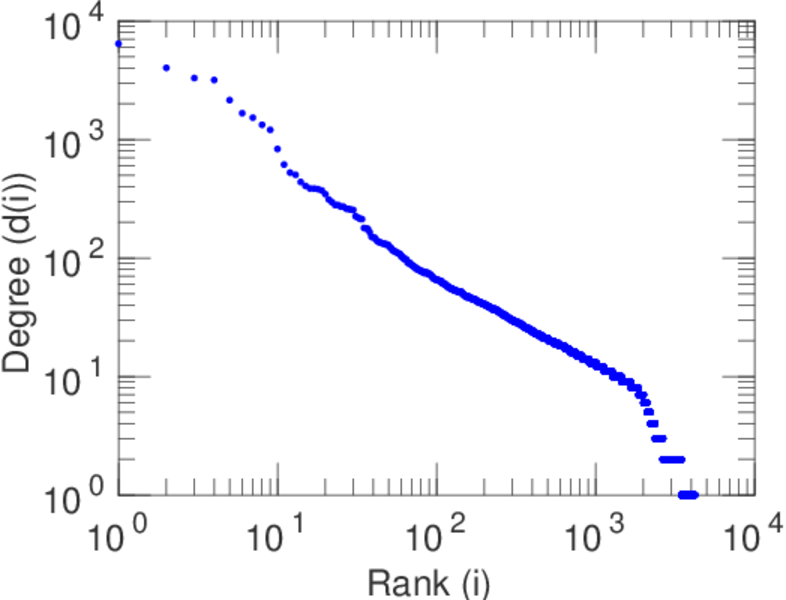
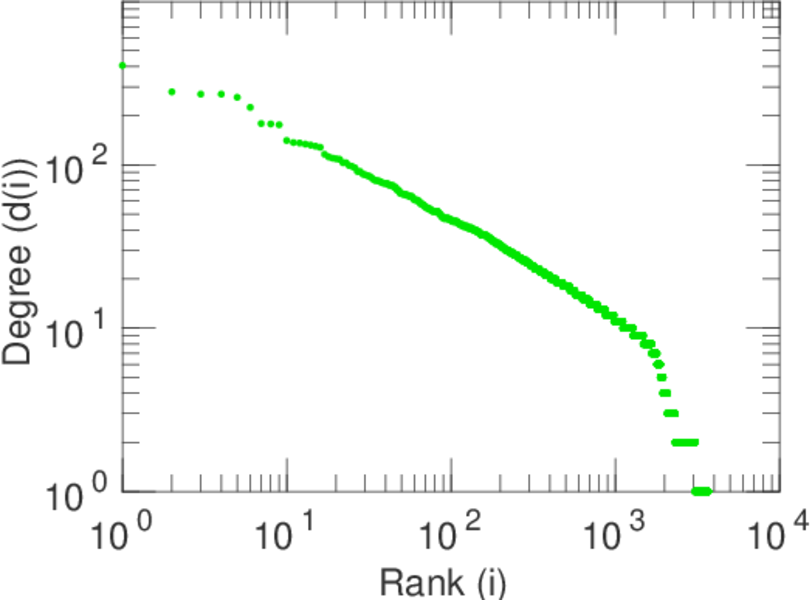
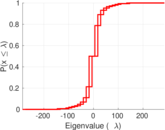
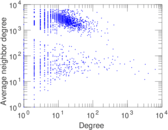
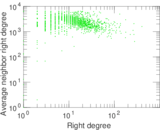
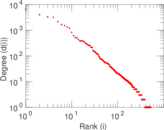
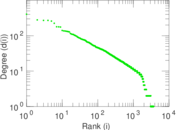
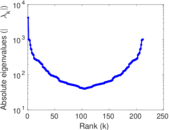
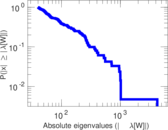
Plots


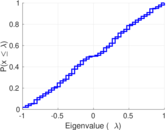


Matrix decompositions plots


Downloads
References
|
[1]
|
Jérôme Kunegis.
KONECT – The Koblenz Network Collection.
In Proc. Int. Conf. on World Wide Web Companion, pages
1343–1350, 2013.
[ http ]
|
|
[2]
|
Wikimedia Foundation.
Wikimedia downloads.
http://dumps.wikimedia.org/, January 2010.
|
 KONECT ‣ Networks ‣
Buy Me a Coffee
KONECT ‣ Networks ‣
Buy Me a Coffee