Wiktionary edits (fi)
This is the bipartite edit network of the Finnish Wiktionary. It contains users
and pages from the Finnish Wiktionary, connected by edit events. Each edge
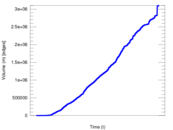
represents an edit. The dataset includes the timestamp of each edit.
Metadata
Statistics
| Size | n = | 442,268
|
| Left size | n1 = | 2,061
|
| Right size | n2 = | 440,207
|
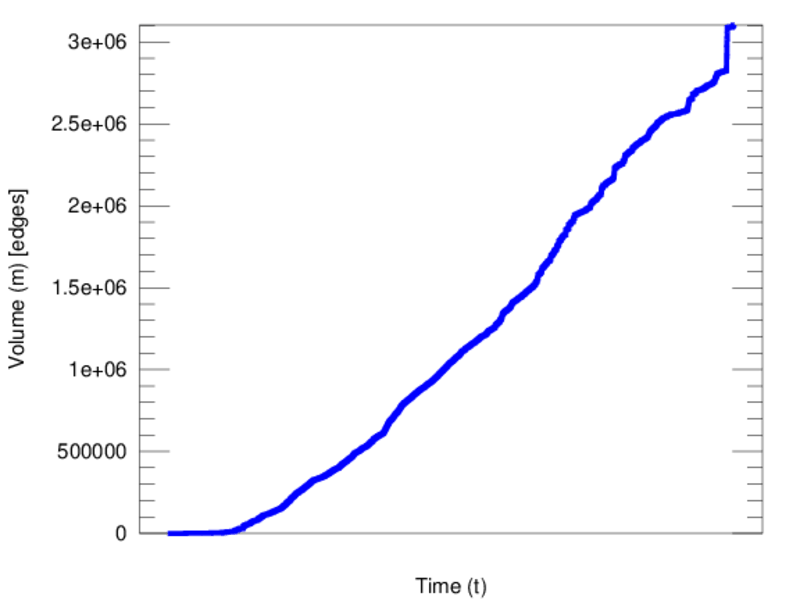
| Volume | m = | 3,103,726
|
| Unique edge count | m̿ = | 1,732,365
|
| Wedge count | s = | 88,262,258,202
|
| Claw count | z = | 4,835,420,998,475,333
|
| Cross count | x = | 2.431 47 × 1020
|
| Square count | q = | 73,029,735,213
|
| 4-Tour count | T4 = | 937,291,396,238
|
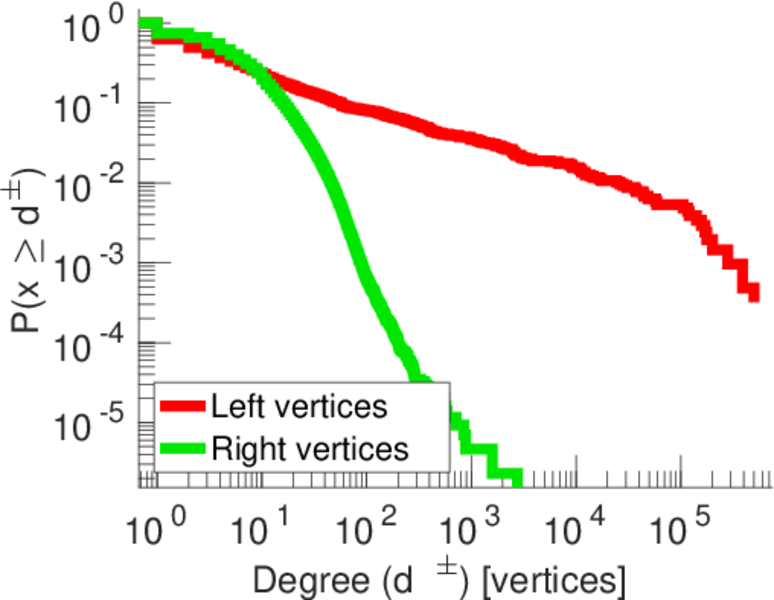
| Maximum degree | dmax = | 501,453
|
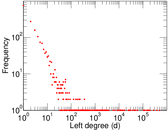
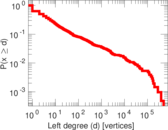
| Maximum left degree | d1max = | 501,453
|
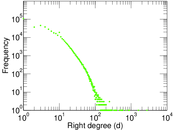
| Maximum right degree | d2max = | 2,765
|
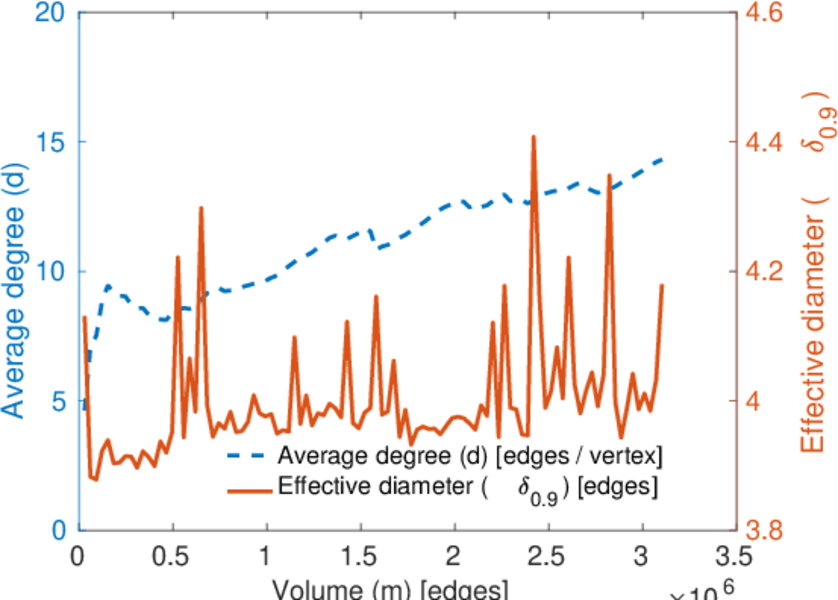
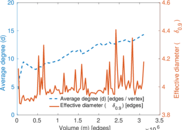
| Average degree | d = | 14.035 5
|
| Average left degree | d1 = | 1,505.93
|
| Average right degree | d2 = | 7.050 61
|
| Fill | p = | 0.001 909 43
|
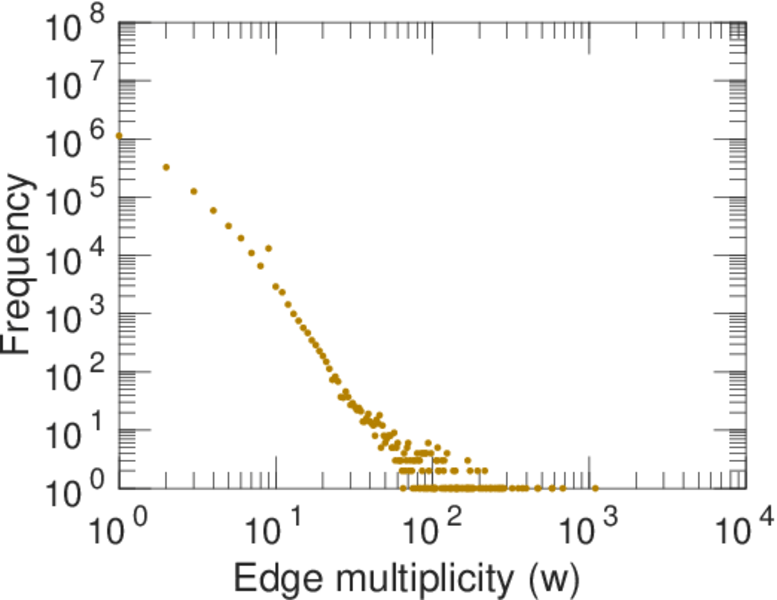
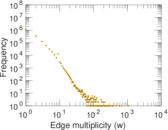
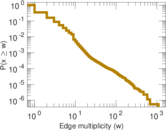
| Average edge multiplicity | m̃ = | 1.791 61
|
| Size of LCC | N = | 433,487
|
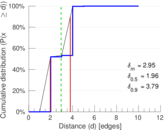
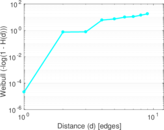
| Diameter | δ = | 12
|
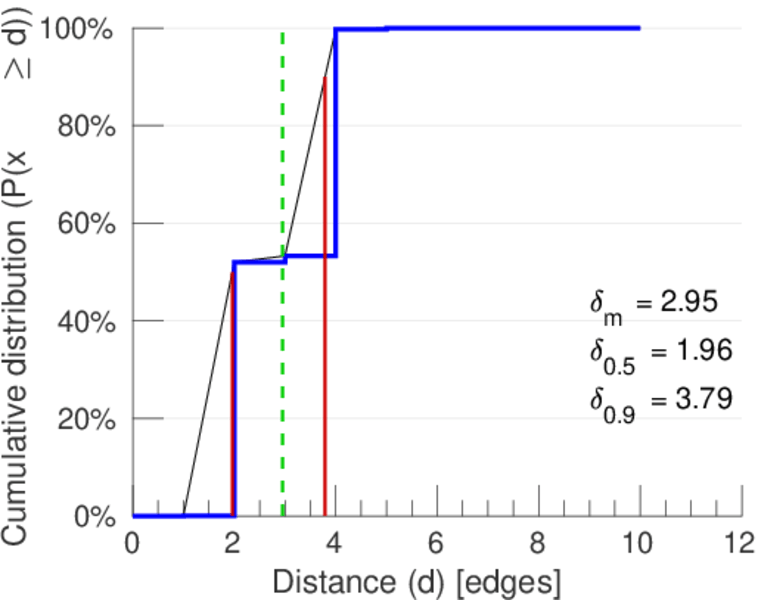
| 50-Percentile effective diameter | δ0.5 = | 1.961 36
|
| 90-Percentile effective diameter | δ0.9 = | 3.790 43
|
| Median distance | δM = | 2
|
| Mean distance | δm = | 2.950 52
|
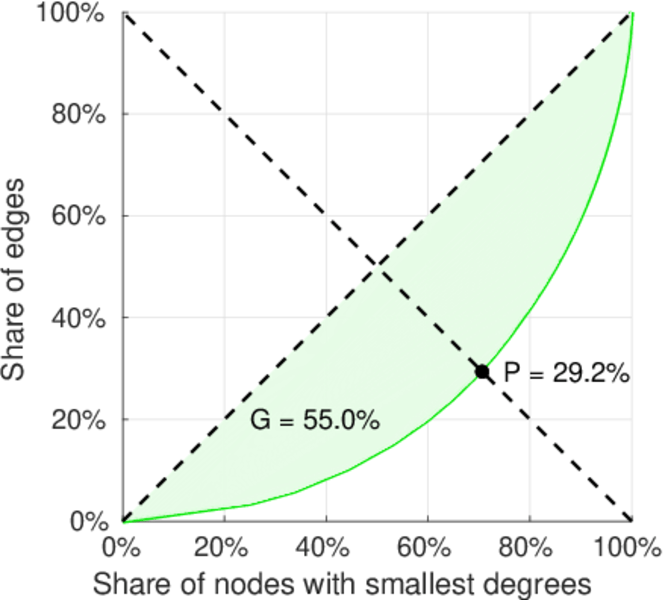
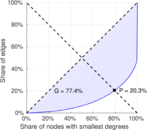
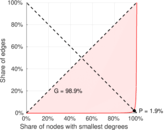
| Gini coefficient | G = | 0.774 705
|
| Balanced inequality ratio | P = | 0.202 802
|
| Left balanced inequality ratio | P1 = | 0.018 620 2
|
| Right balanced inequality ratio | P2 = | 0.292 124
|
| Relative edge distribution entropy | Her = | 0.671 018
|
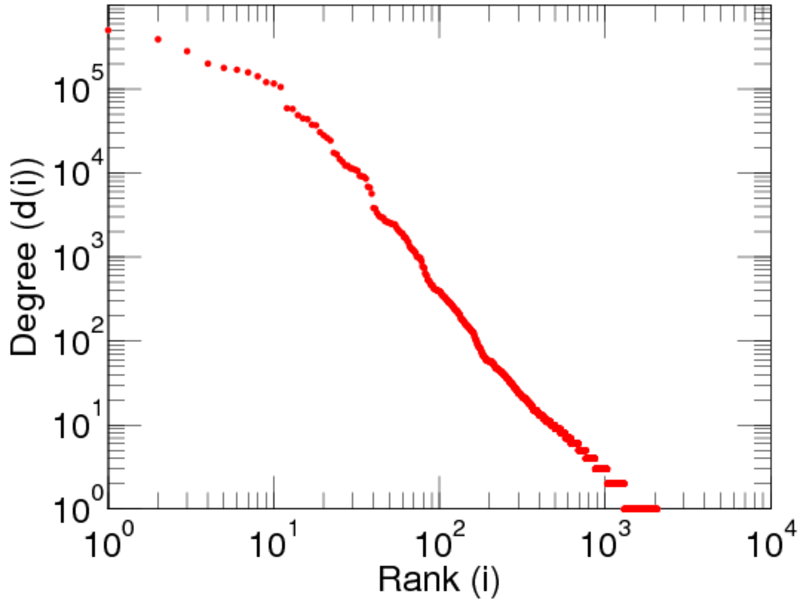
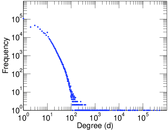
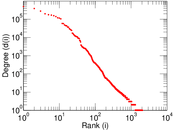
| Power law exponent | γ = | 1.965 68
|
| Degree assortativity | ρ = | −0.216 863
|
| Degree assortativity p-value | pρ = | 0.000 00
|
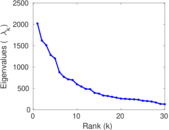
| Spectral norm | α = | 2,018.03
|
| Algebraic connectivity | a = | 0.056 975 5
|
| Controllability | C = | 429,947
|
| Relative controllability | Cr = | 0.991 081
|
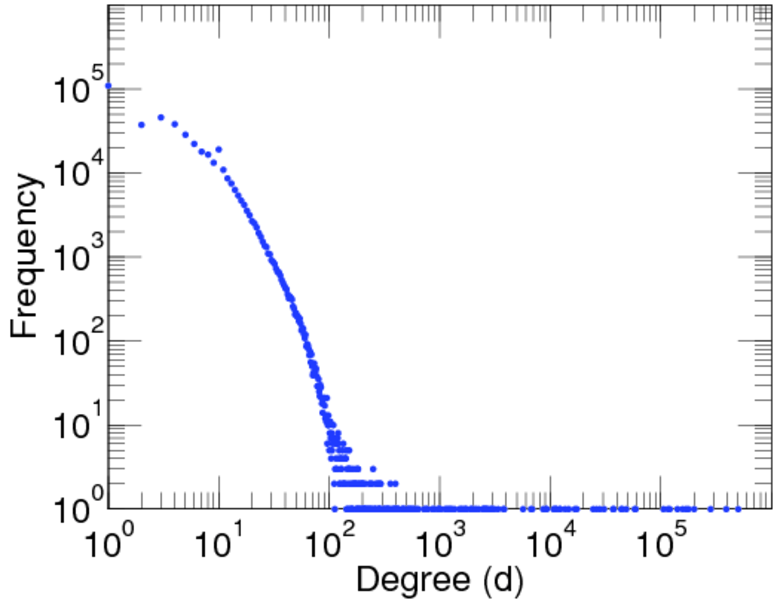
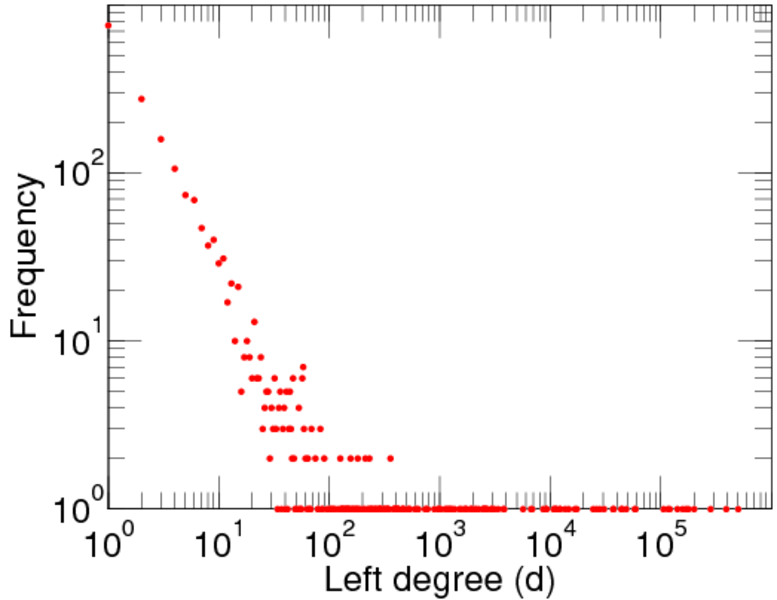
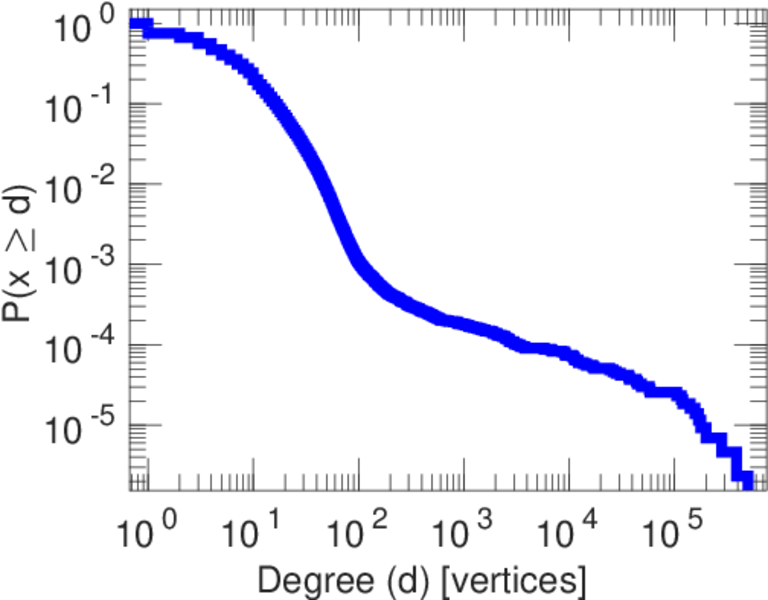
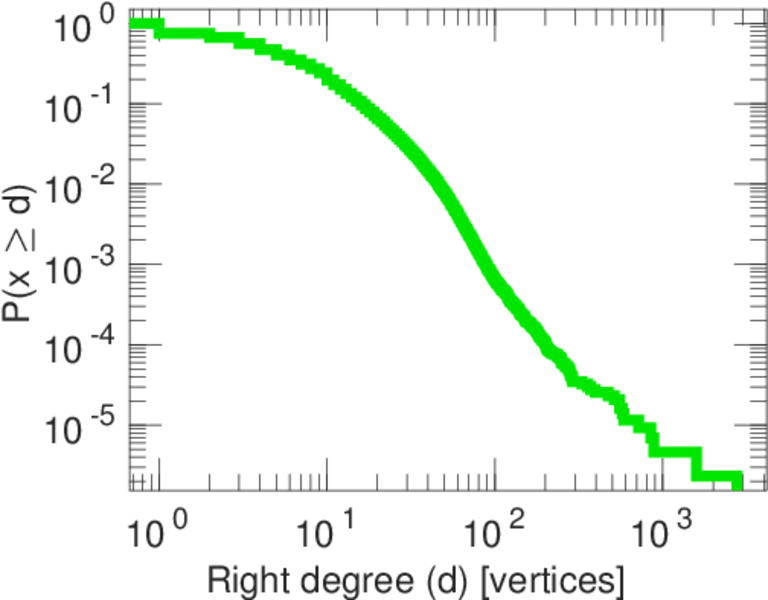
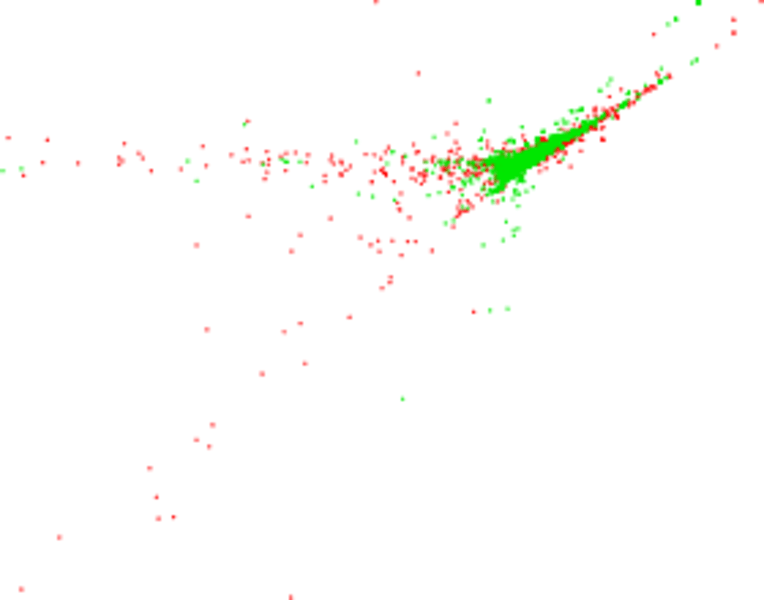
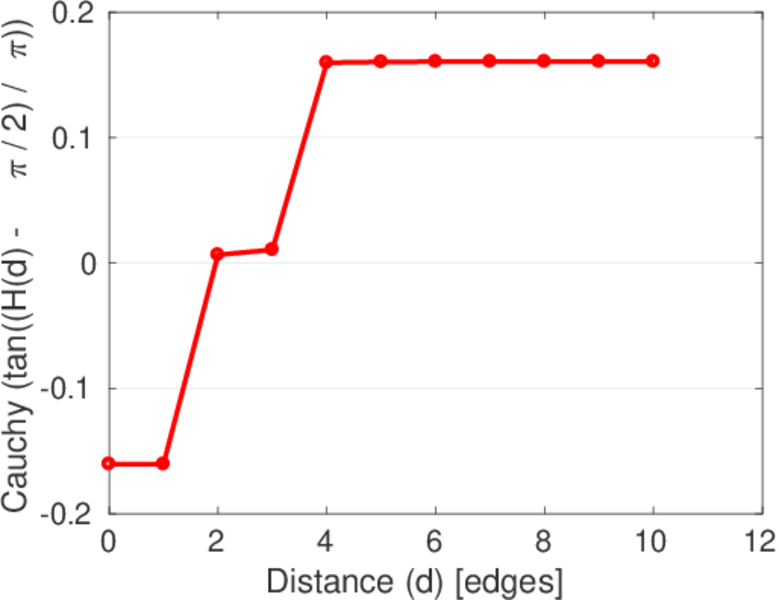
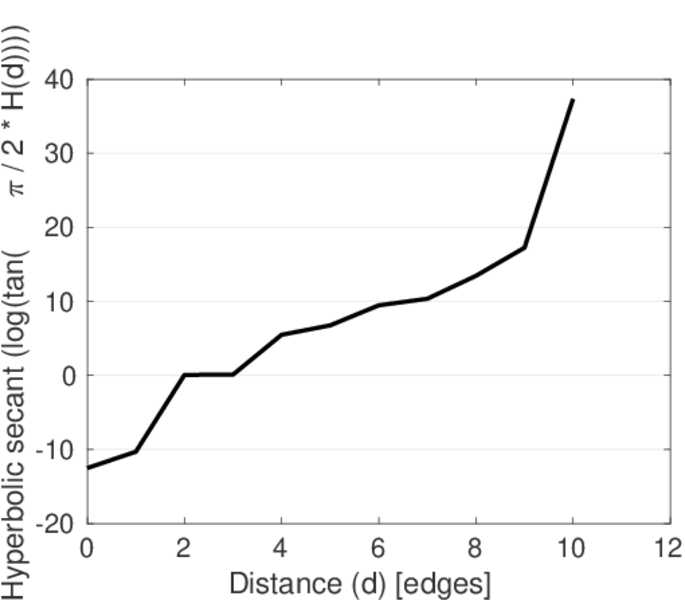
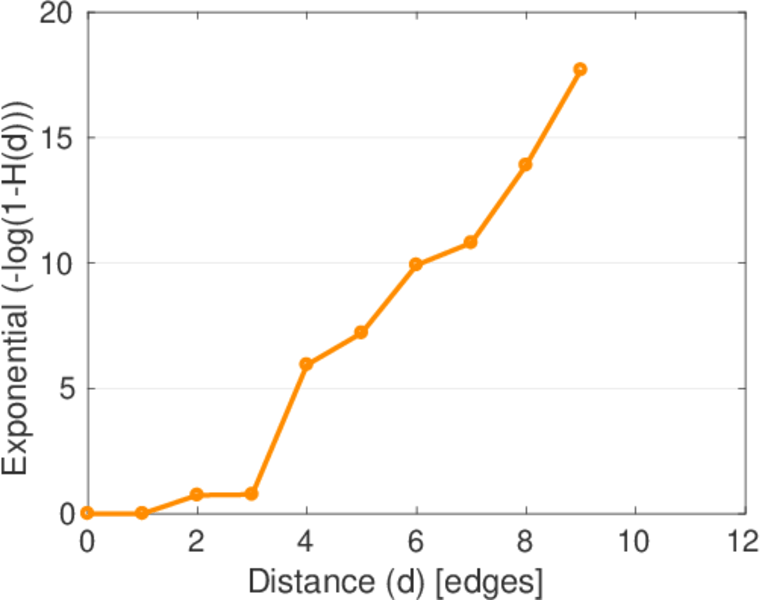
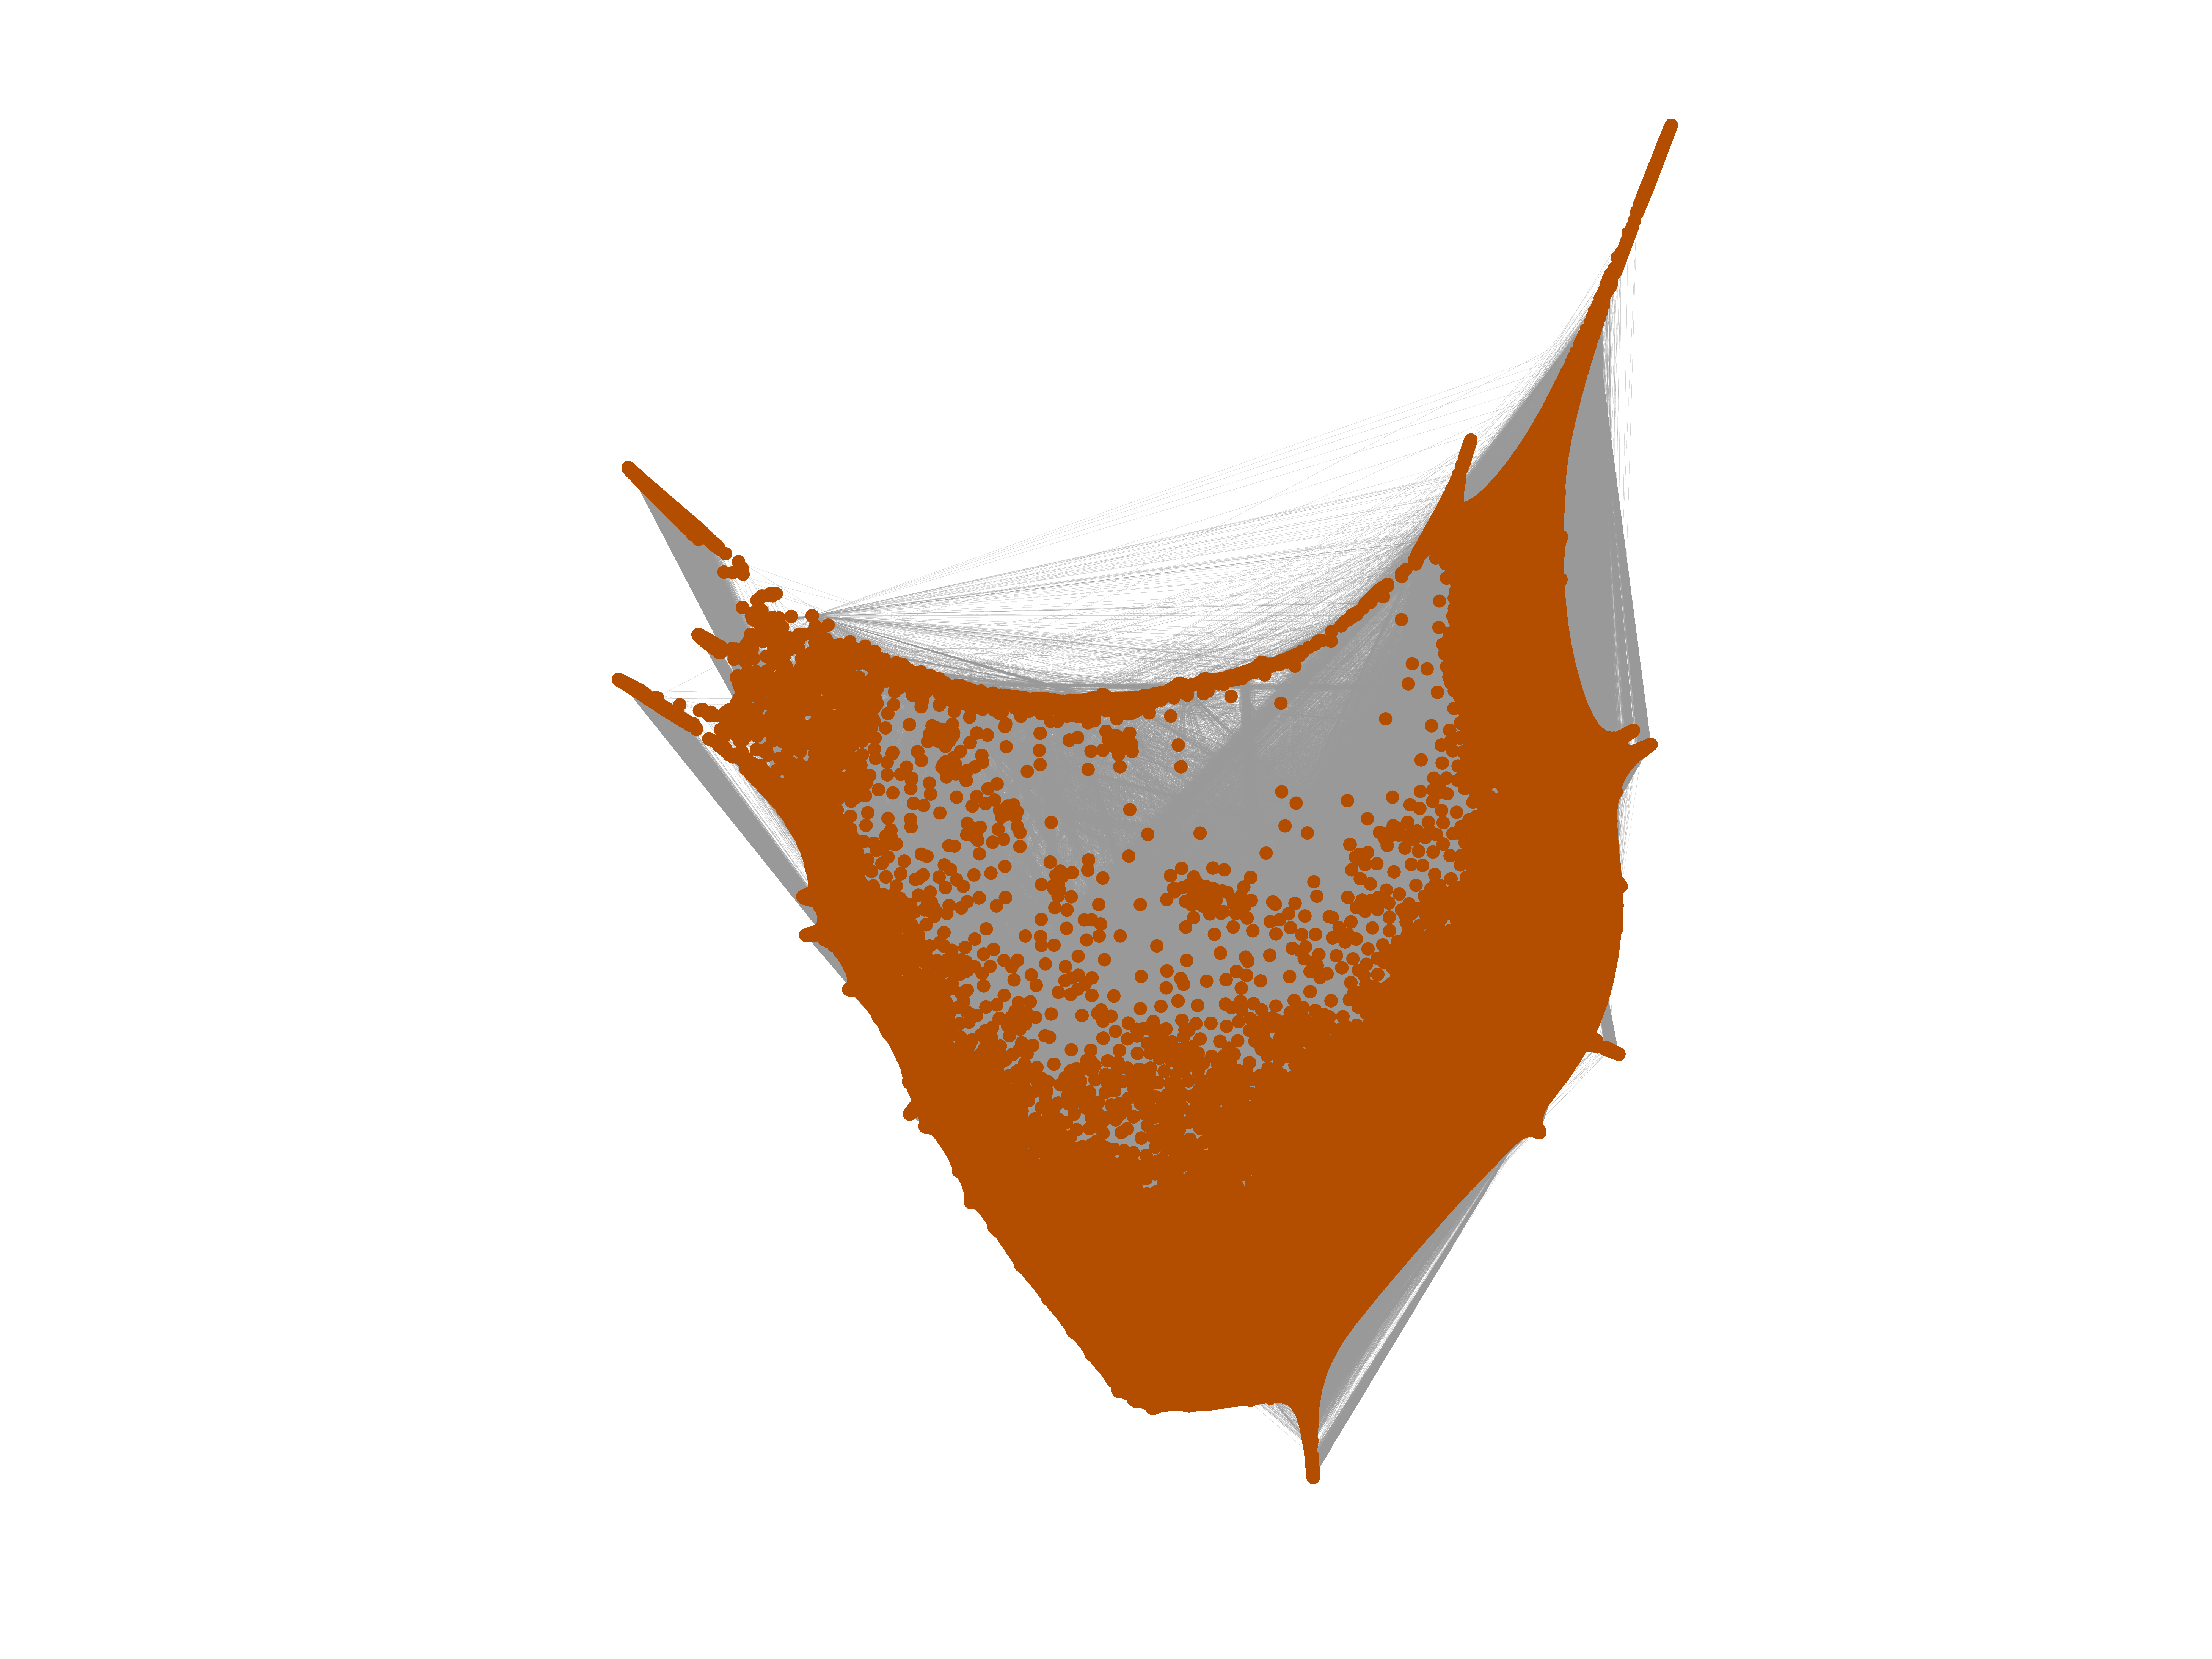
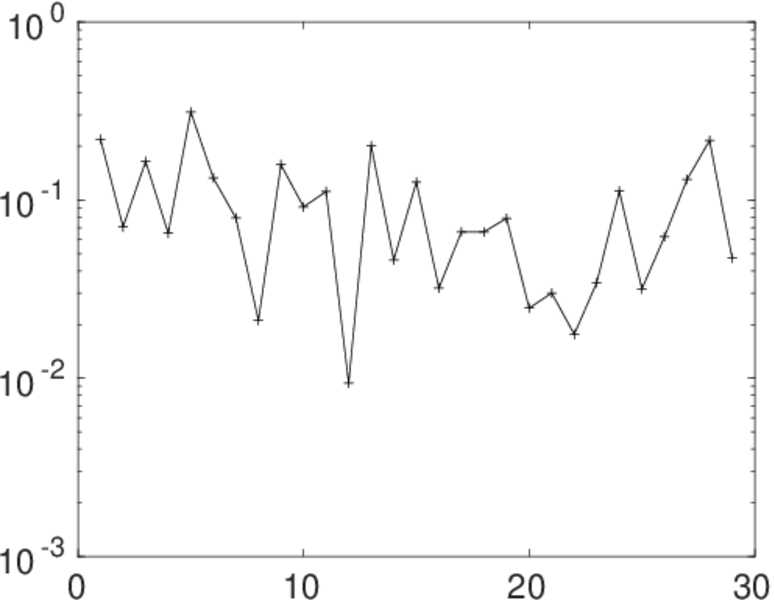
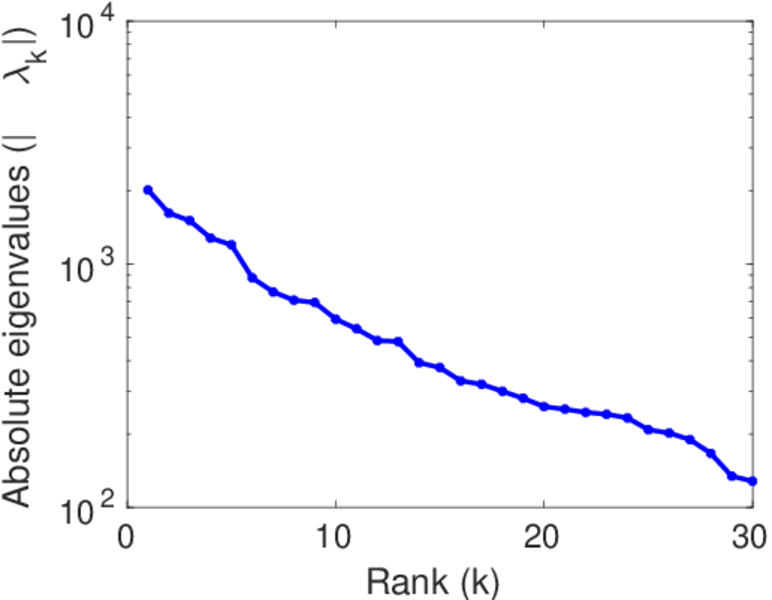
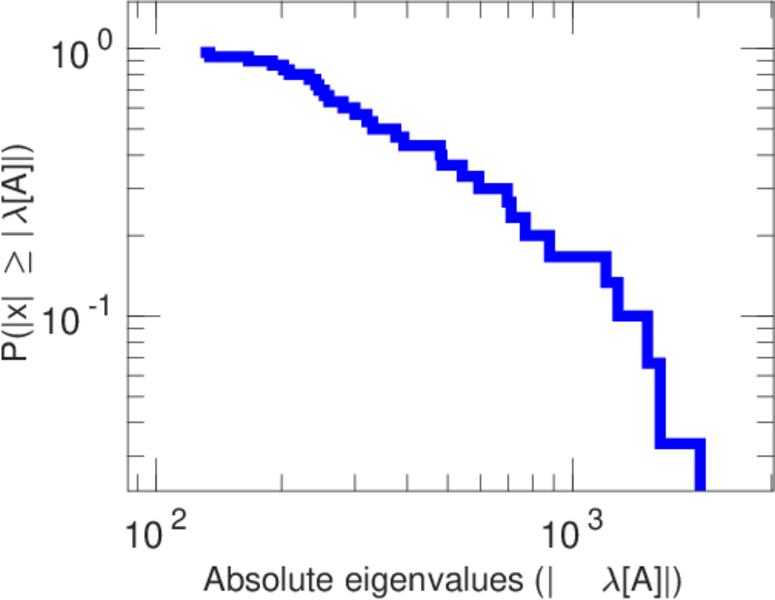
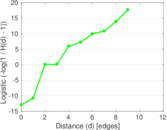
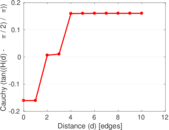
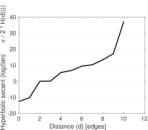
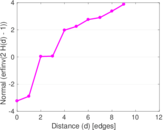
Plots


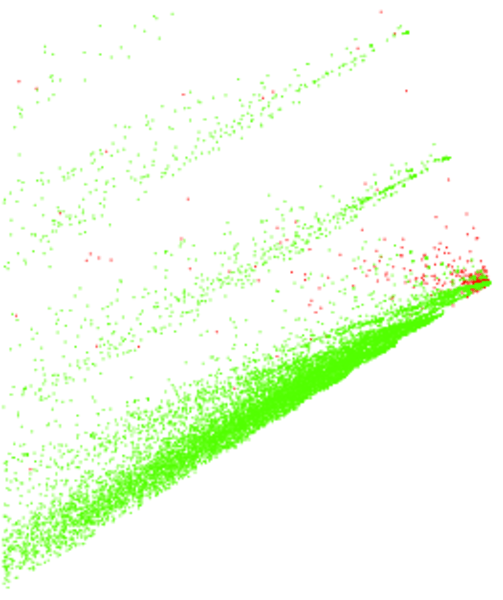
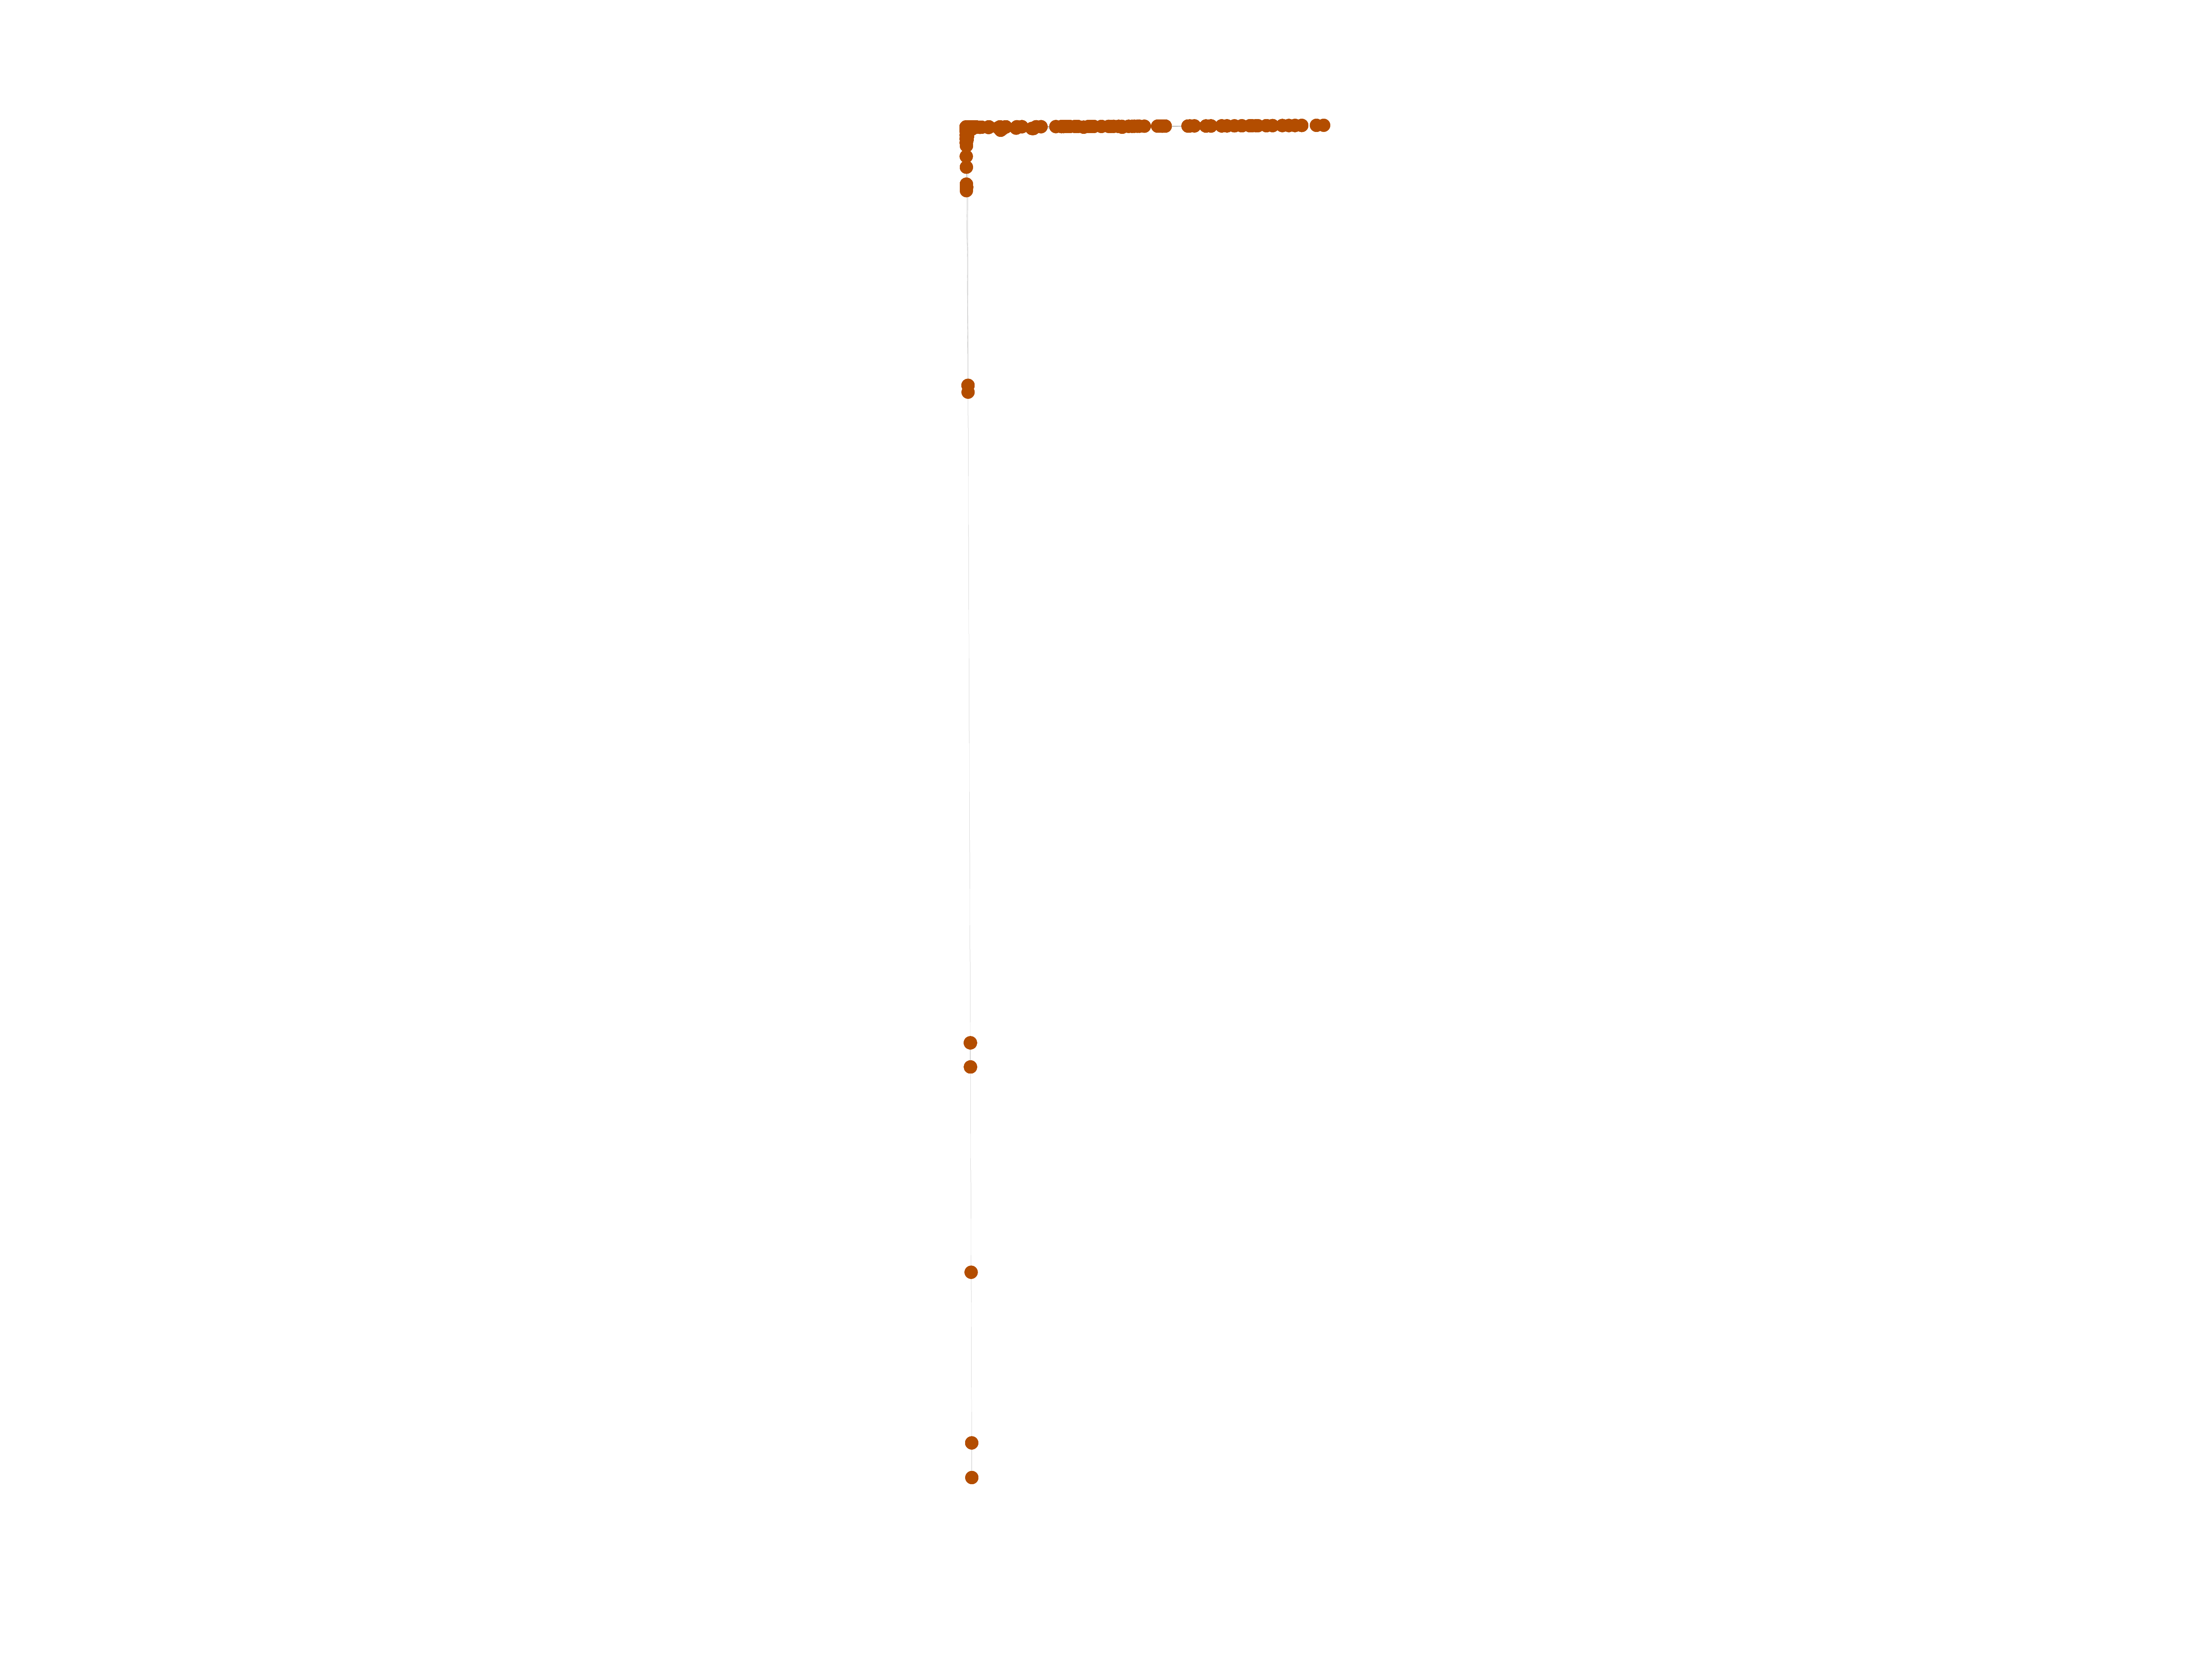
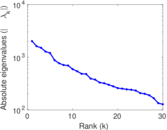
Matrix decompositions plots

Downloads
References
|
[1]
|
Jérôme Kunegis.
KONECT – The Koblenz Network Collection.
In Proc. Int. Conf. on World Wide Web Companion, pages
1343–1350, 2013.
[ http ]
|
|
[2]
|
Wikimedia Foundation.
Wikimedia downloads.
http://dumps.wikimedia.org/, January 2010.
|
 KONECT ‣ Networks ‣
Buy Me a Coffee
KONECT ‣ Networks ‣
Buy Me a Coffee