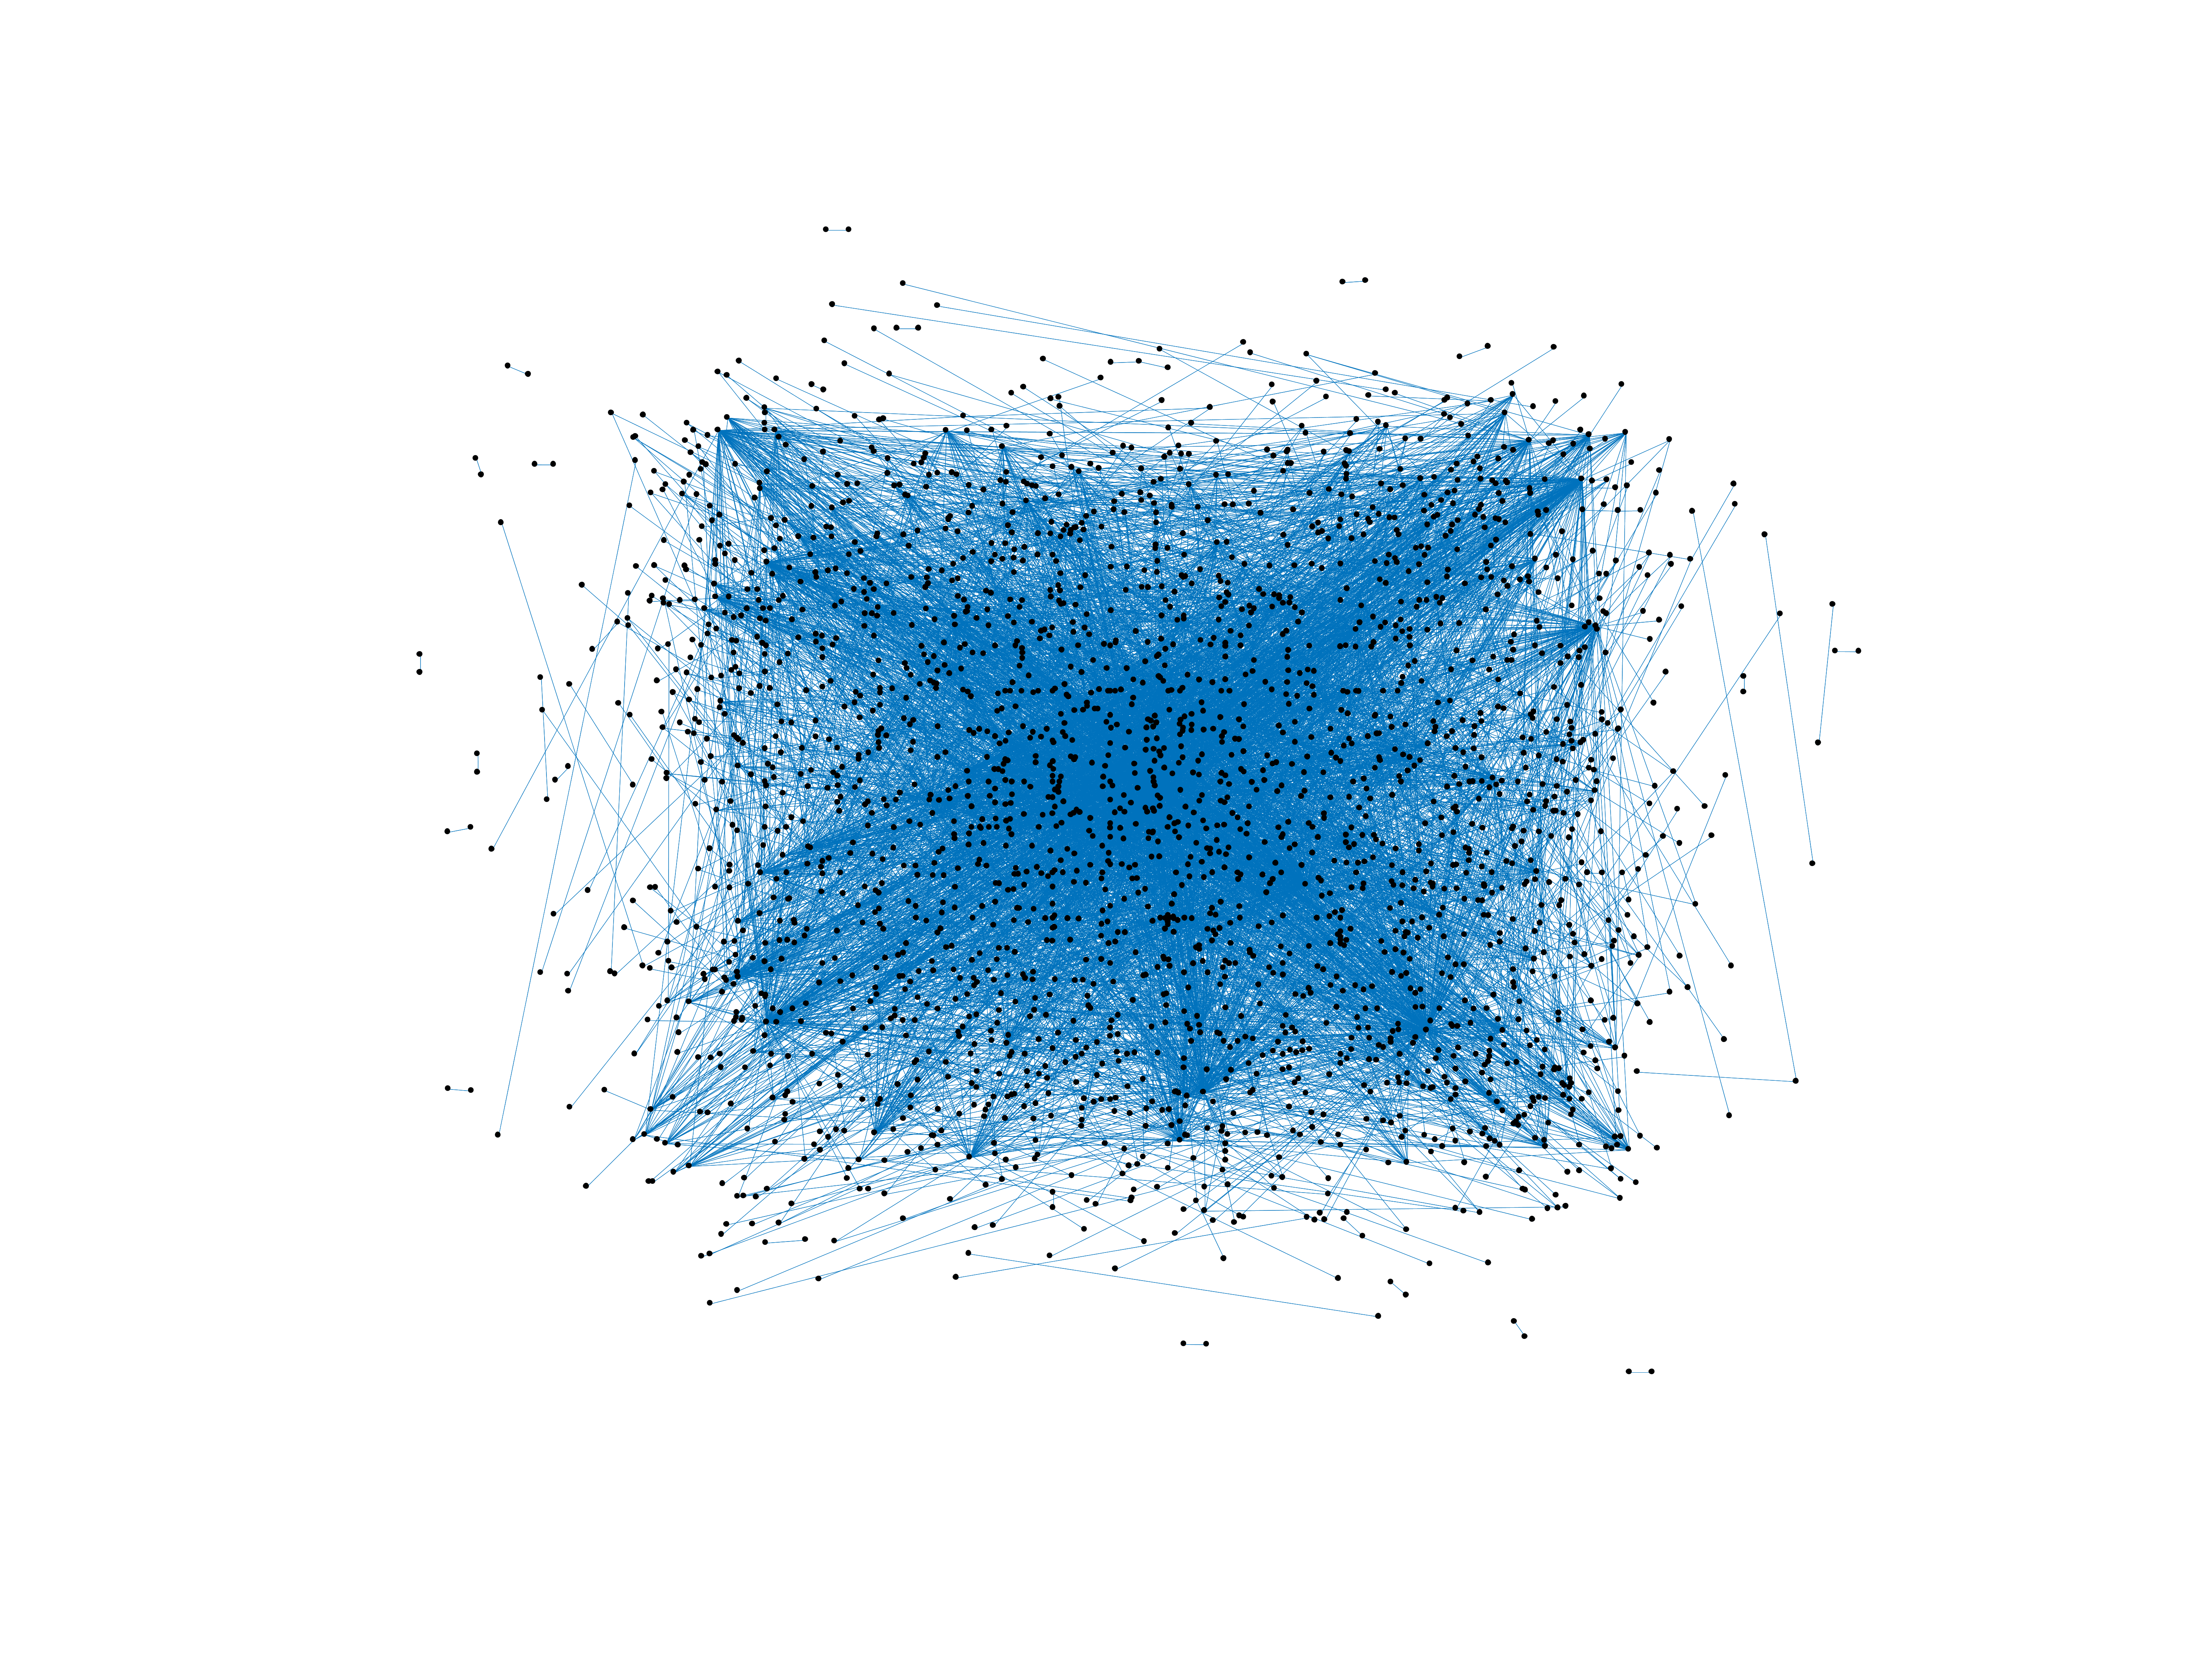
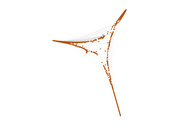
Wikipedia edits (fj)
This is the bipartite edit network of the Fijian Wikipedia. It contains users
and pages from the Fijian Wikipedia, connected by edit events. Each edge
represents an edit. The dataset includes the timestamp of each edit.
Metadata
Statistics
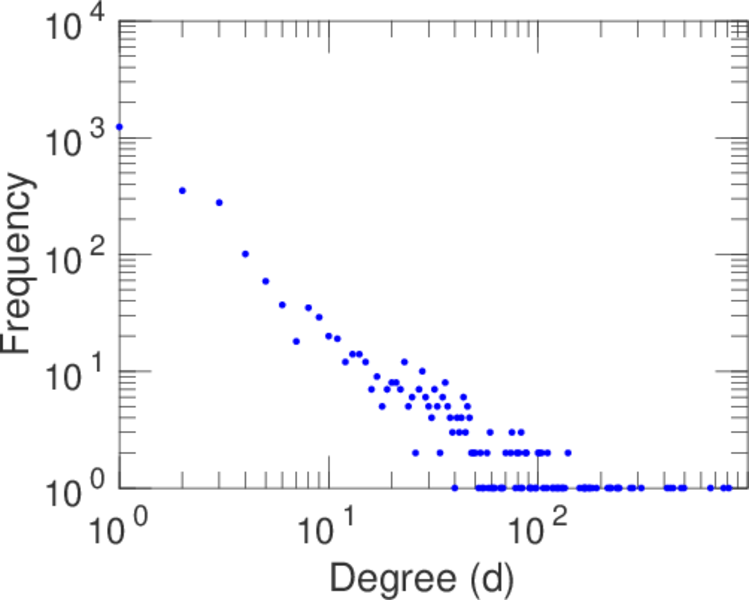
| Size | n = | 2,534
|
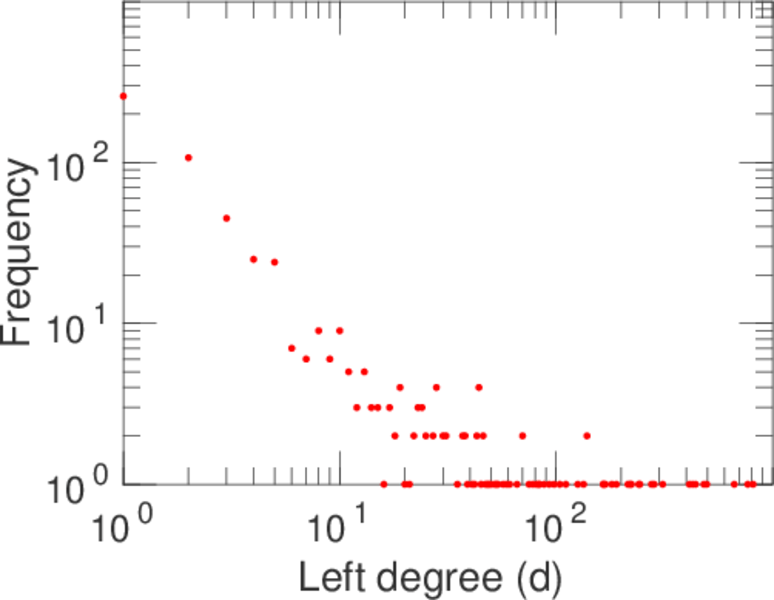
| Left size | n1 = | 612
|
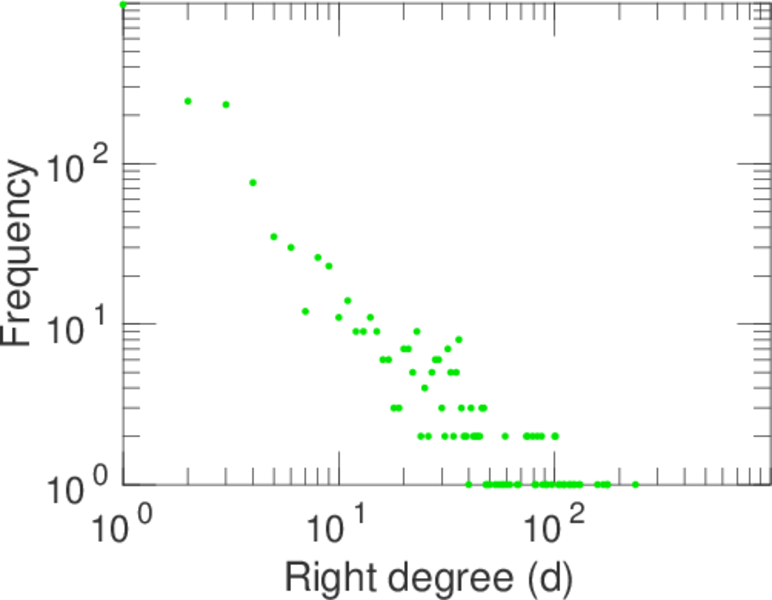
| Right size | n2 = | 1,922
|
| Volume | m = | 12,382
|
| Unique edge count | m̿ = | 5,959
|
| Wedge count | s = | 326,558
|
| Claw count | z = | 19,132,073
|
| Cross count | x = | 1,192,757,178
|
| Square count | q = | 471,089
|
| 4-Tour count | T4 = | 5,089,466
|
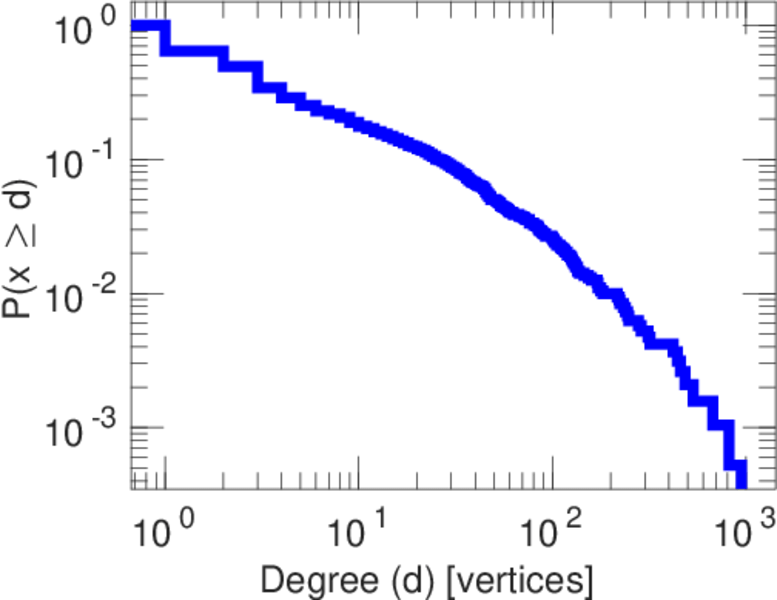
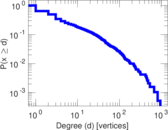
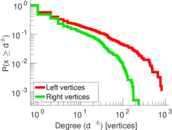
| Maximum degree | dmax = | 814
|
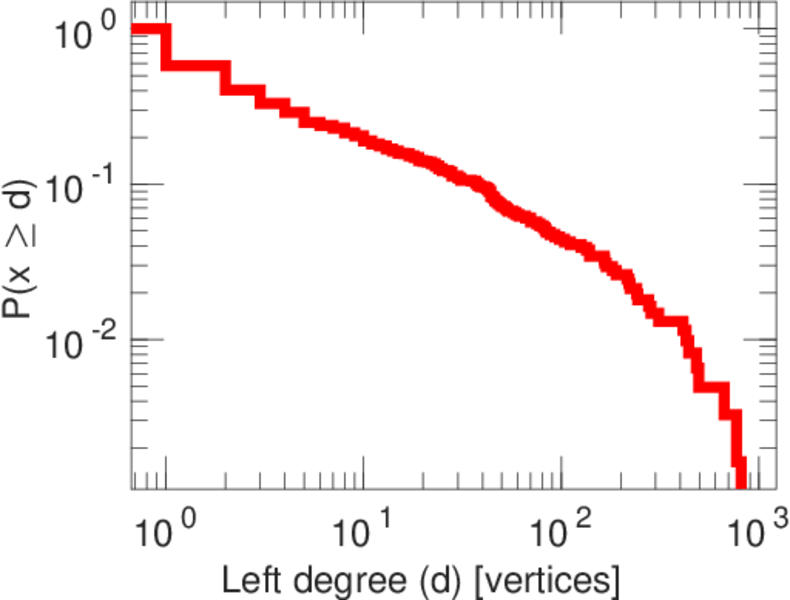
| Maximum left degree | d1max = | 814
|
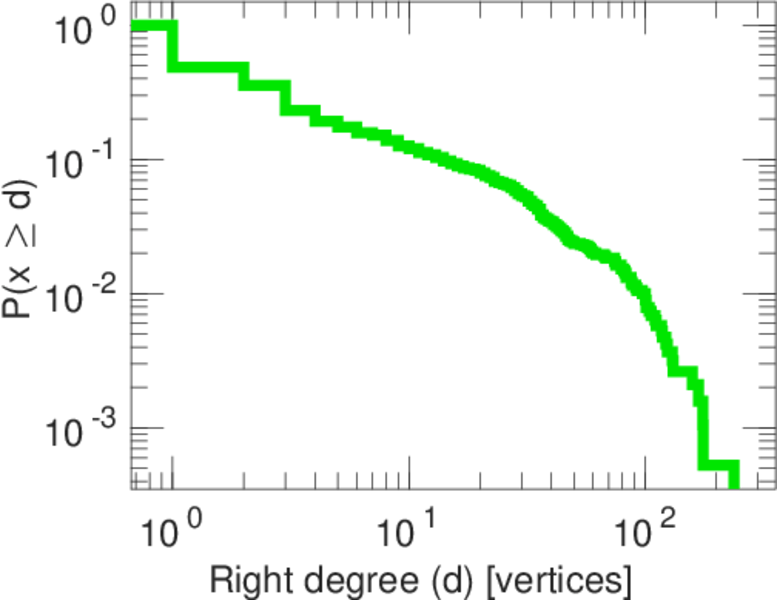
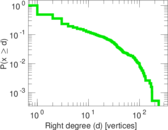
| Maximum right degree | d2max = | 237
|
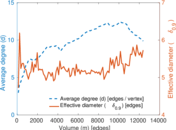
| Average degree | d = | 9.772 69
|
| Average left degree | d1 = | 20.232 0
|
| Average right degree | d2 = | 6.442 25
|
| Fill | p = | 0.005 066 04
|
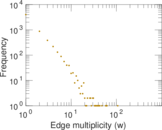
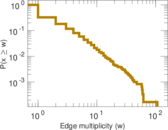
| Average edge multiplicity | m̃ = | 2.077 87
|
| Size of LCC | N = | 1,929
|
| Diameter | δ = | 13
|
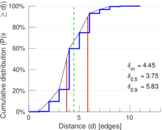
| 50-Percentile effective diameter | δ0.5 = | 3.746 87
|
| 90-Percentile effective diameter | δ0.9 = | 5.828 28
|
| Median distance | δM = | 4
|
| Mean distance | δm = | 4.448 14
|
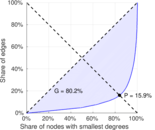
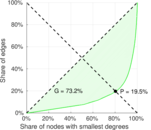
| Gini coefficient | G = | 0.798 153
|
| Balanced inequality ratio | P = | 0.166 815
|
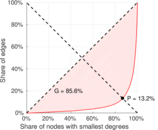
| Left balanced inequality ratio | P1 = | 0.131 966
|
| Right balanced inequality ratio | P2 = | 0.194 799
|
| Relative edge distribution entropy | Her = | 0.831 959
|
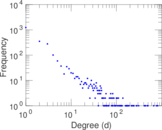
| Power law exponent | γ = | 2.601 94
|
| Tail power law exponent | γt = | 1.941 00
|
| Tail power law exponent with p | γ3 = | 1.941 00
|
| p-value | p = | 0.000 00
|
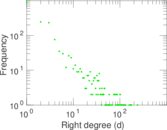
| Left tail power law exponent with p | γ3,1 = | 1.731 00
|
| Left p-value | p1 = | 0.001 000 00
|
| Right tail power law exponent with p | γ3,2 = | 2.041 00
|
| Right p-value | p2 = | 0.000 00
|
| Degree assortativity | ρ = | −0.148 505
|
| Degree assortativity p-value | pρ = | 9.829 22 × 10−31
|
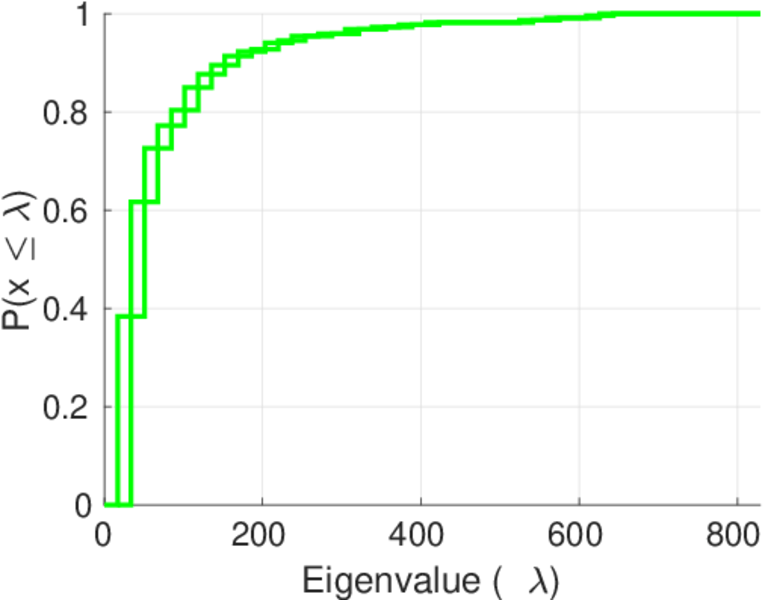
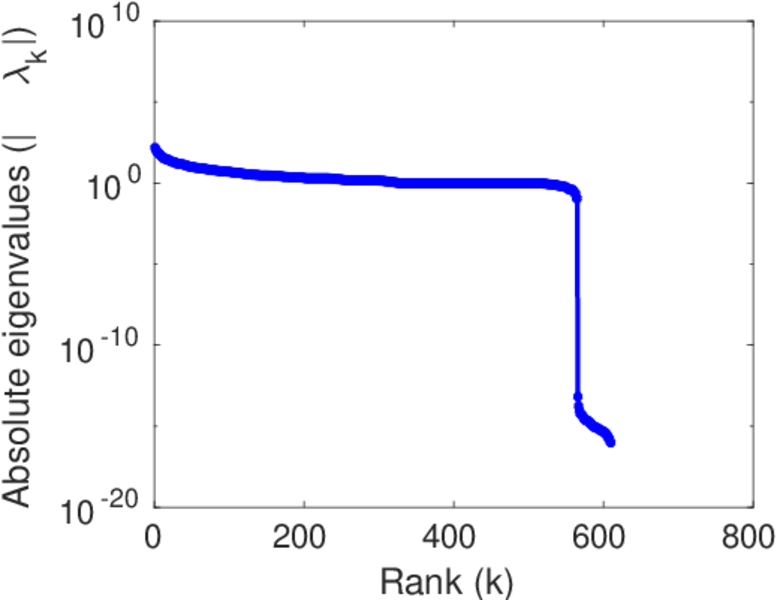
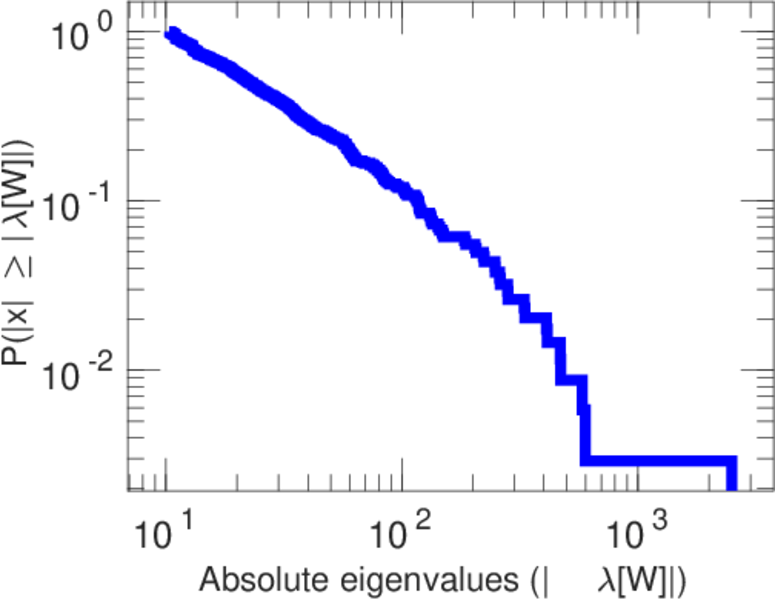
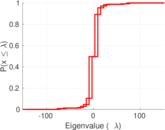
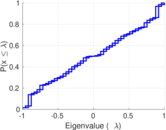
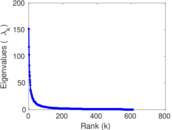
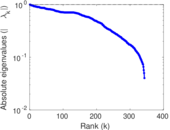
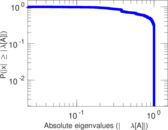
| Spectral norm | α = | 151.435
|
| Algebraic connectivity | a = | 0.023 183 0
|
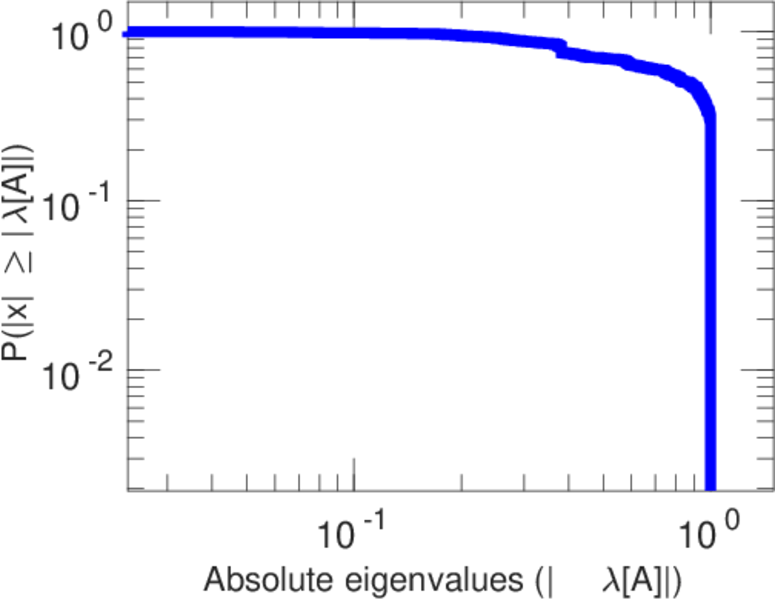
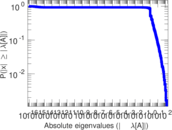
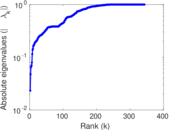
| Spectral separation | |λ1[A] / λ2[A]| = | 1.287 32
|
| Controllability | C = | 1,380
|
| Relative controllability | Cr = | 0.549 801
|
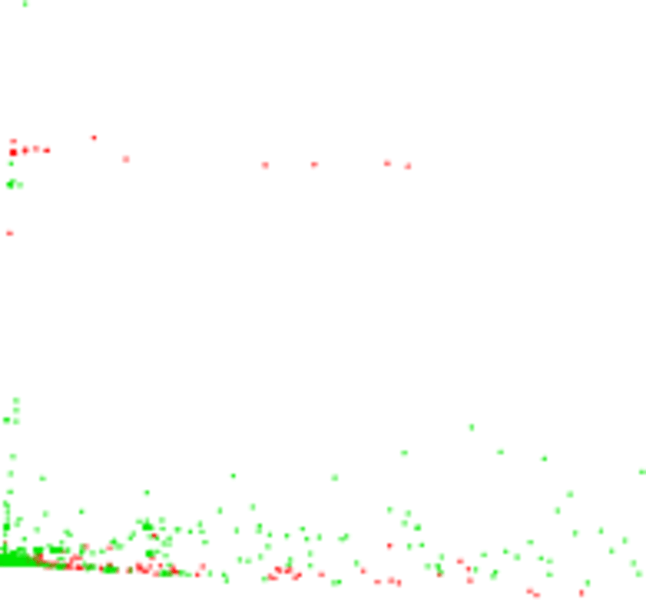
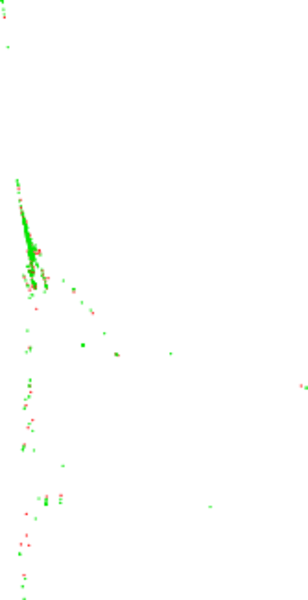
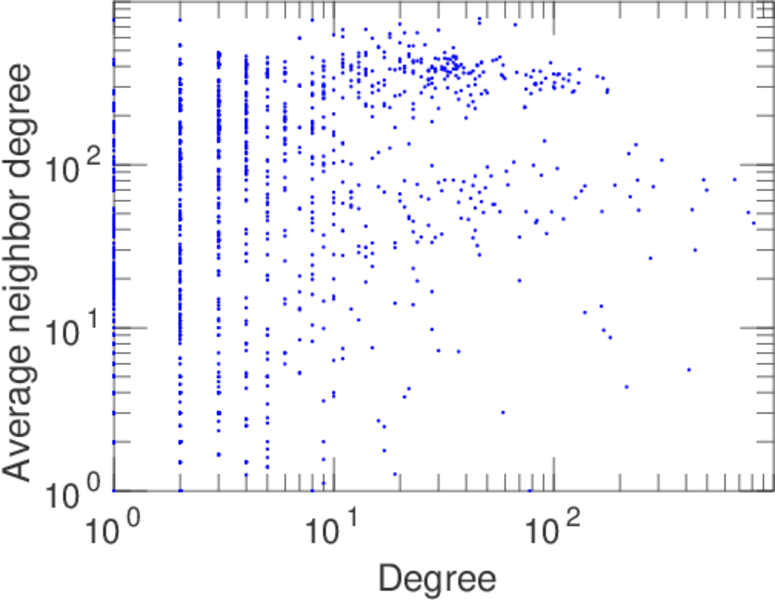
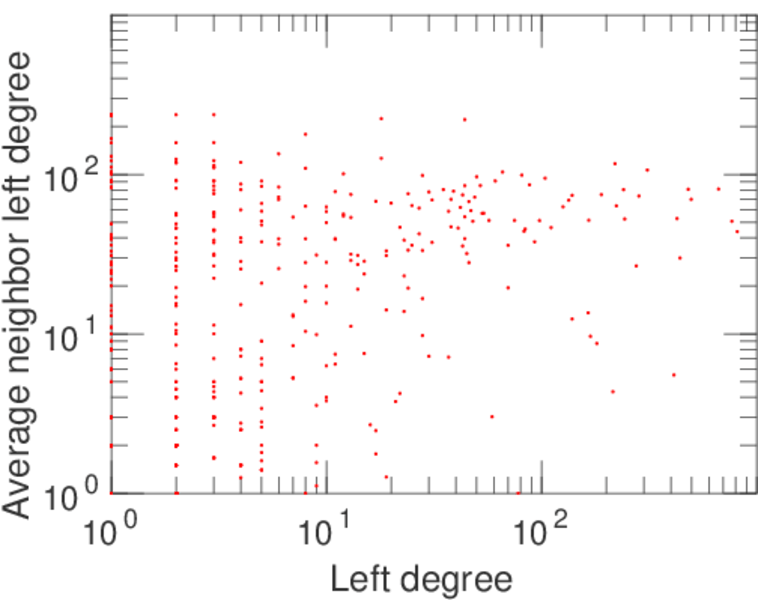
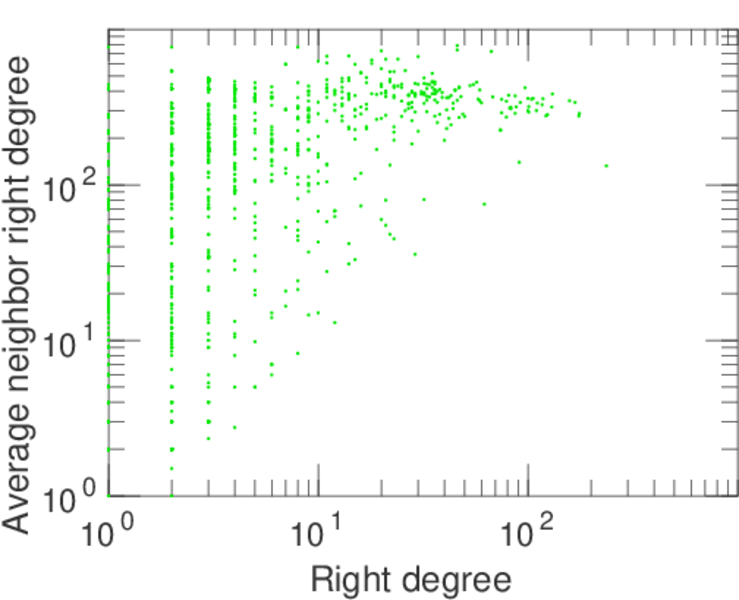
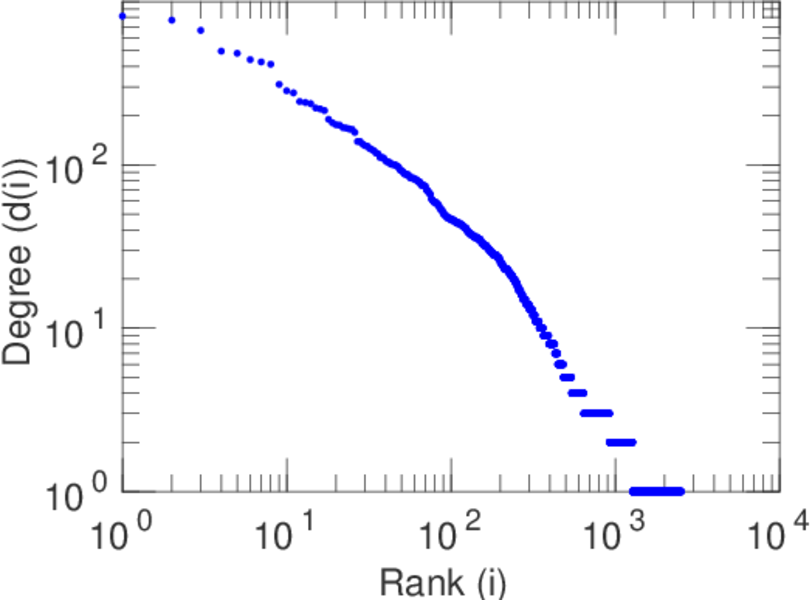
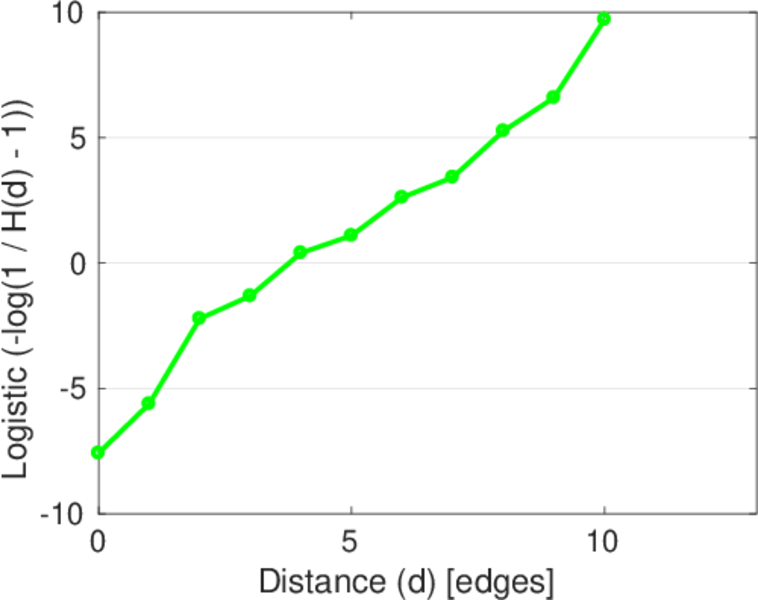
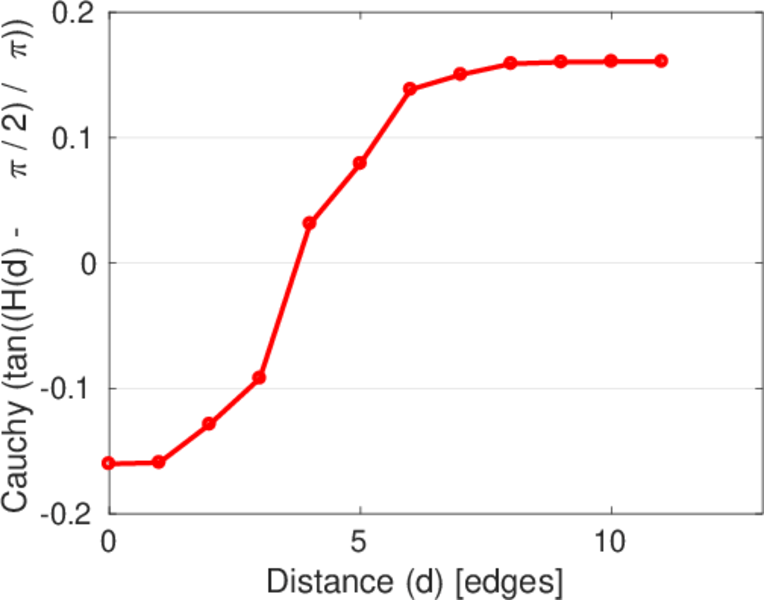
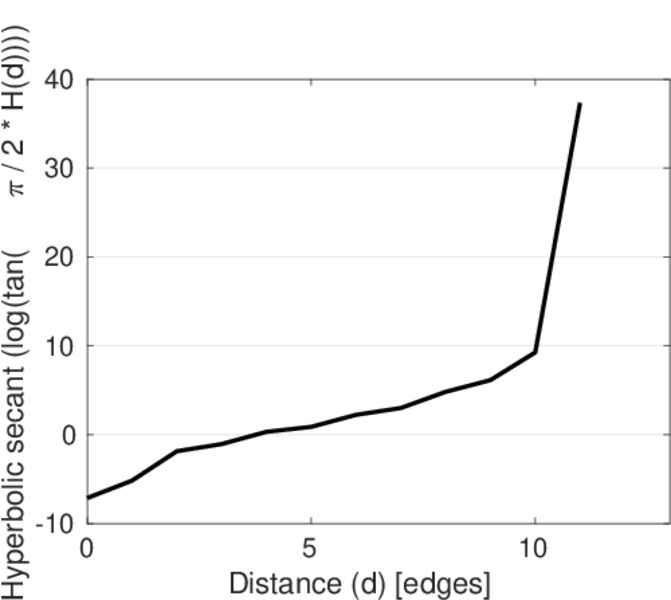
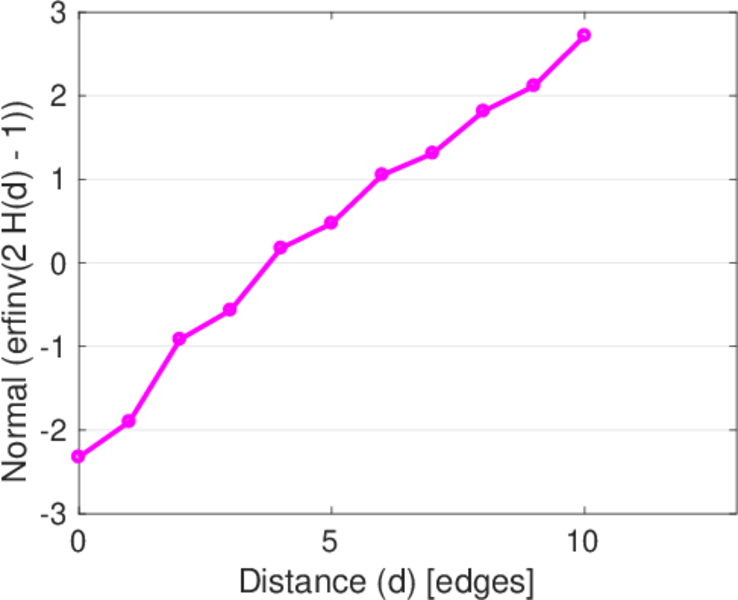
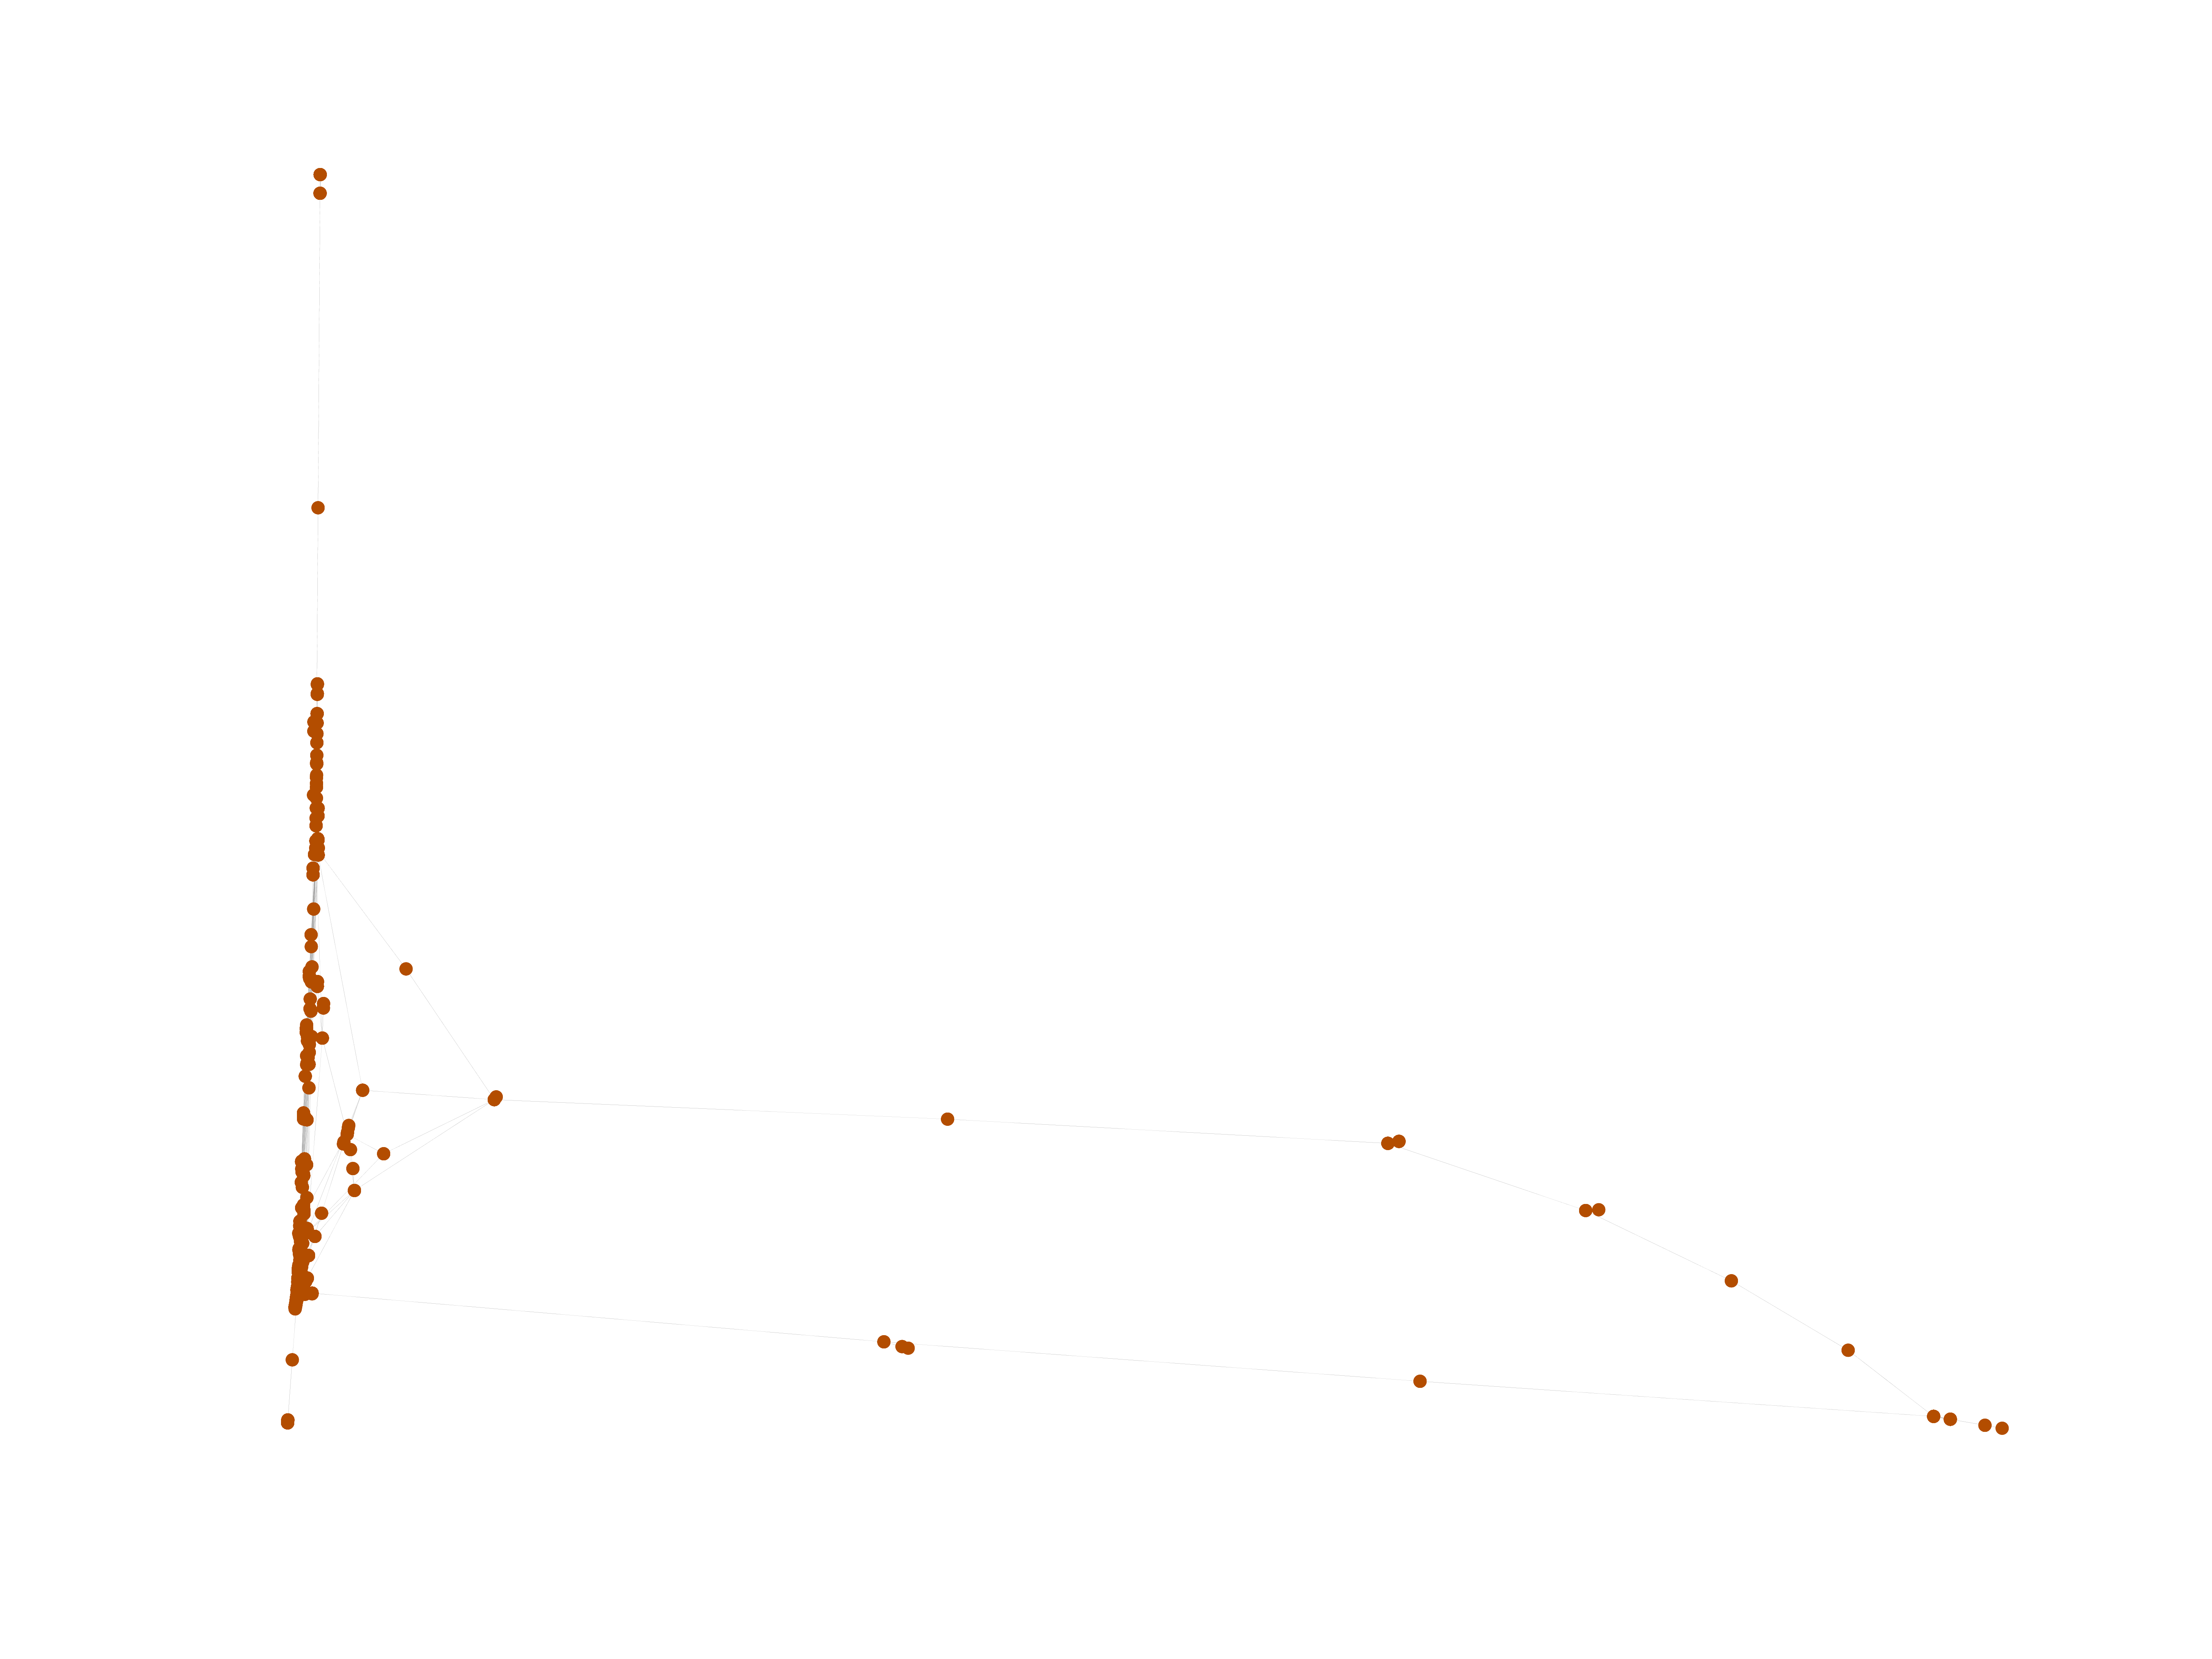
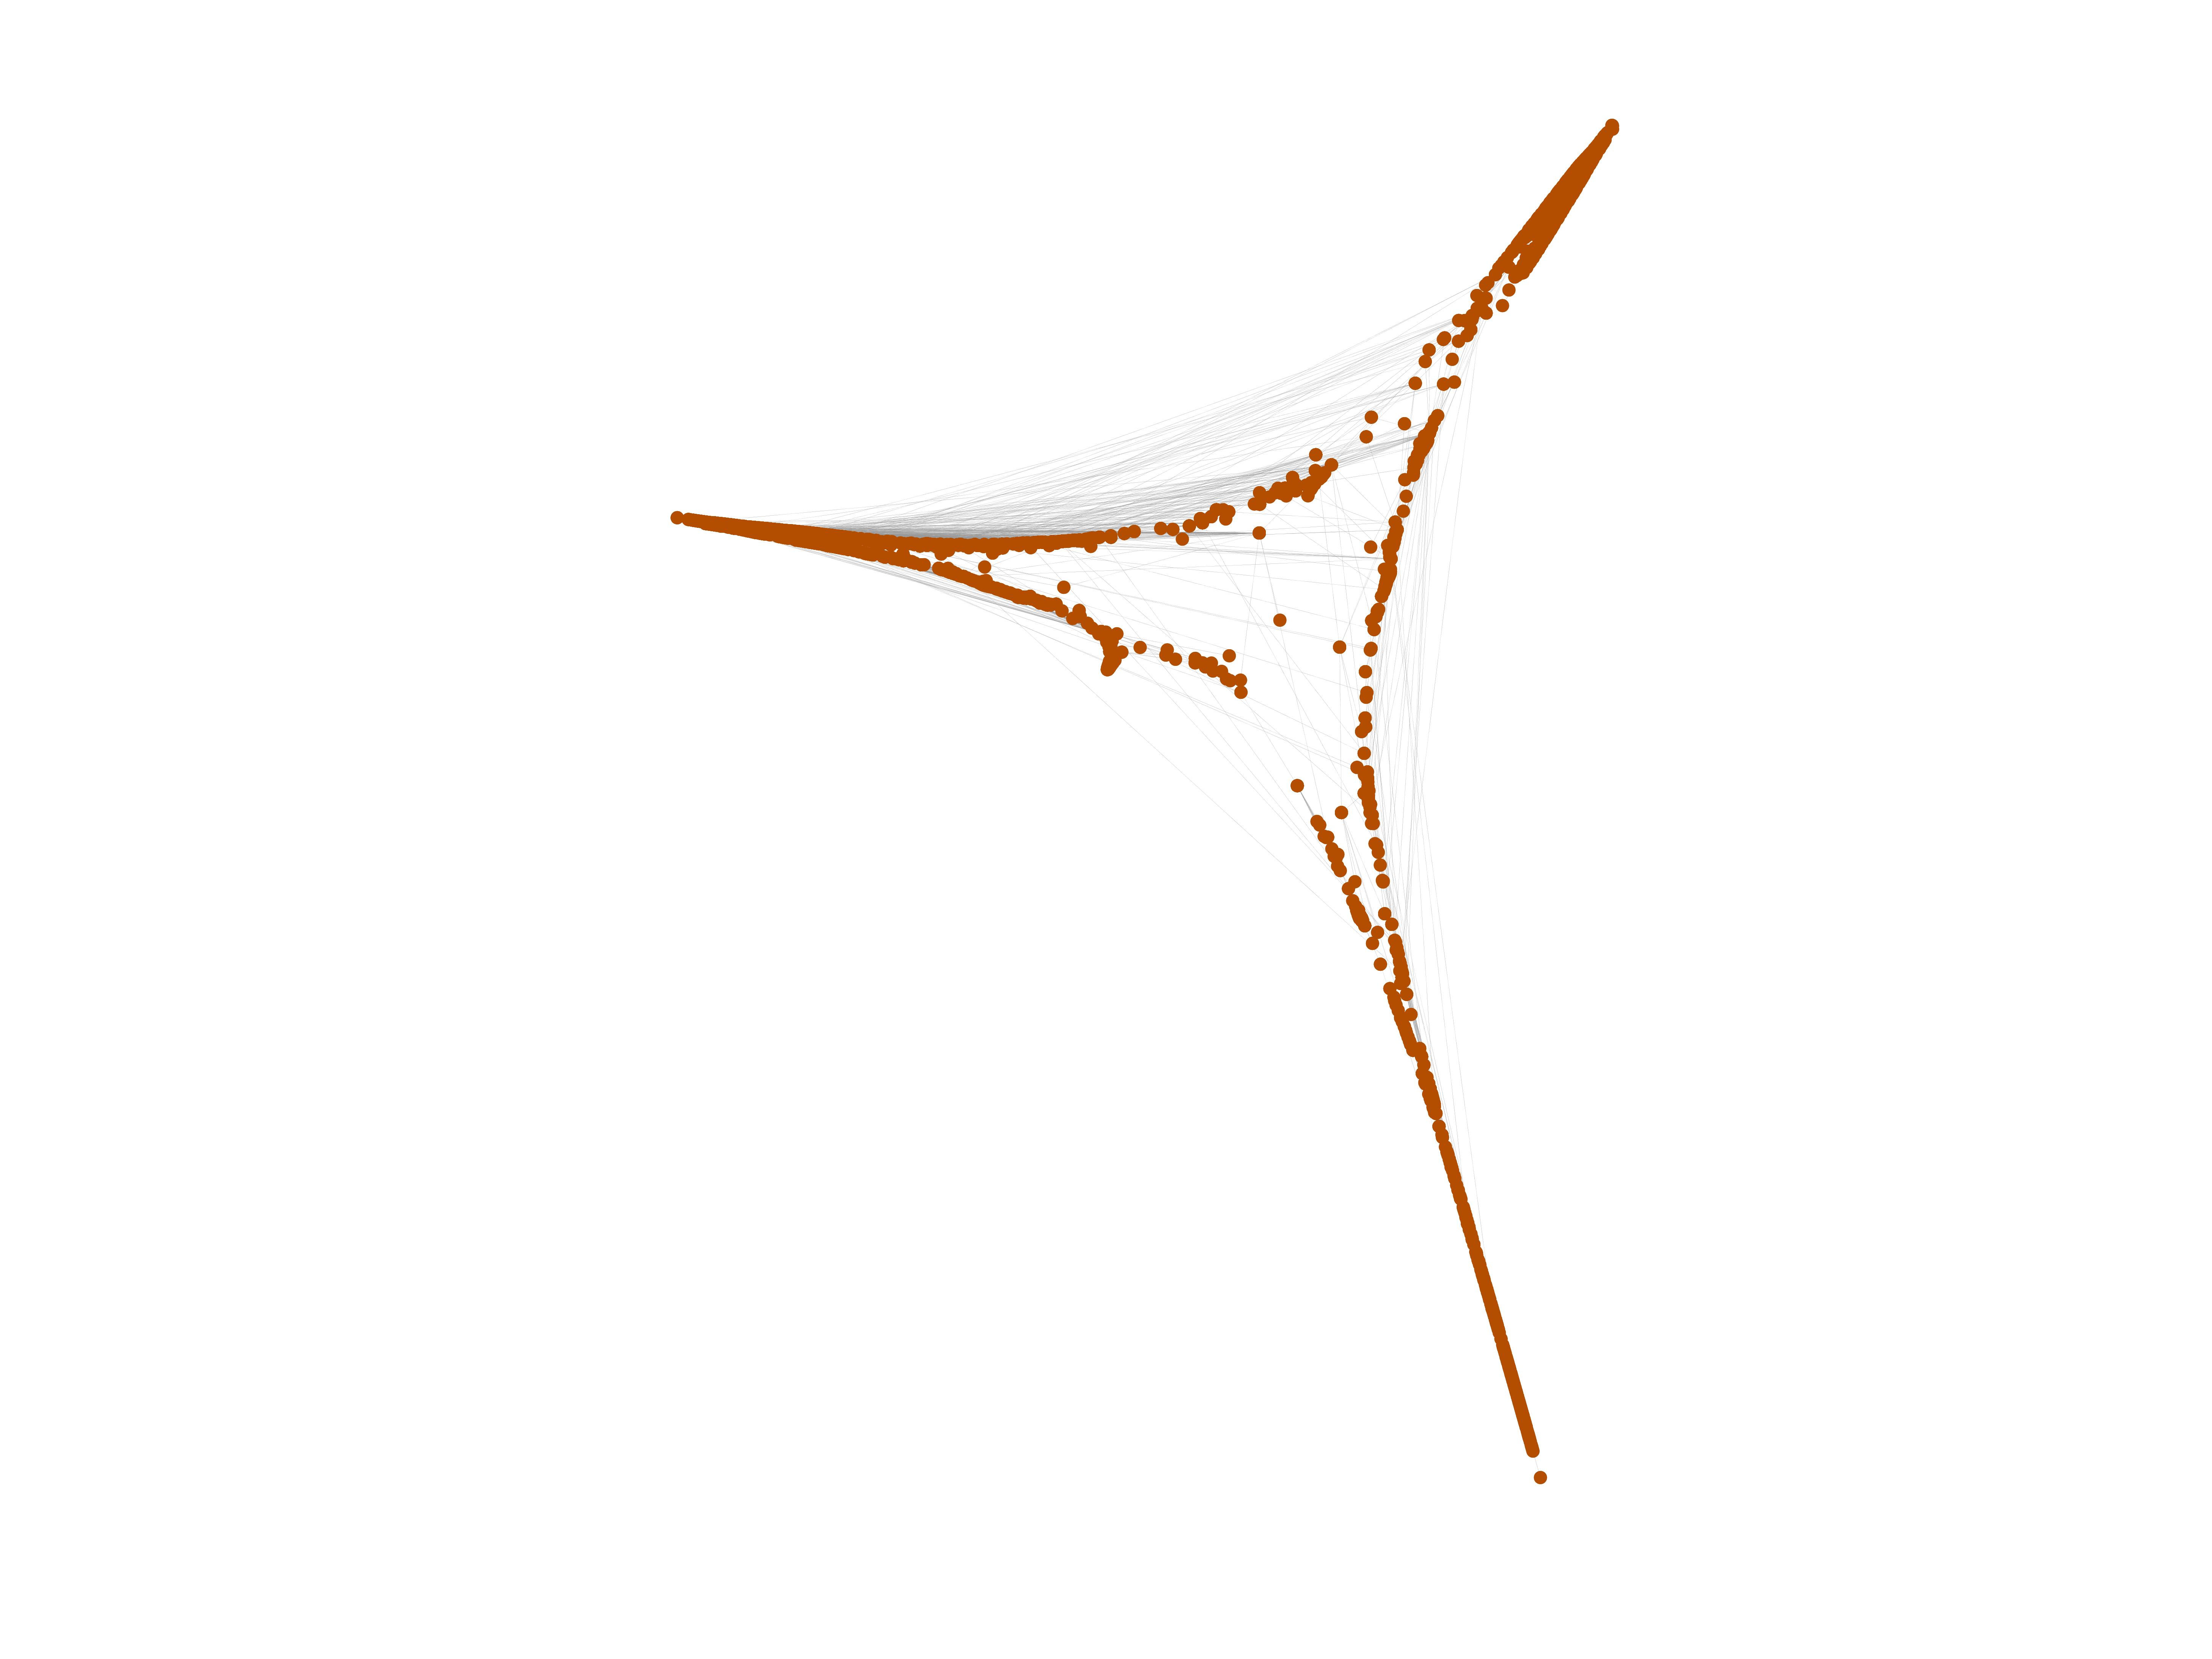
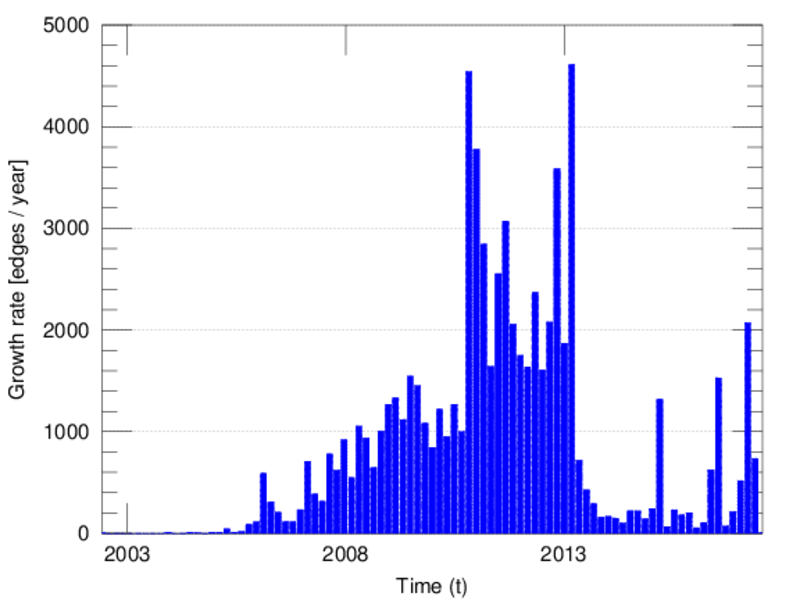
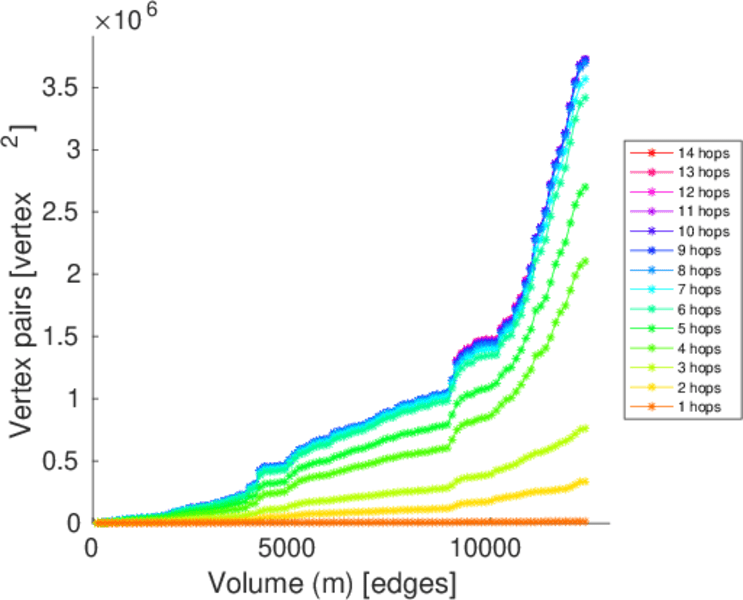
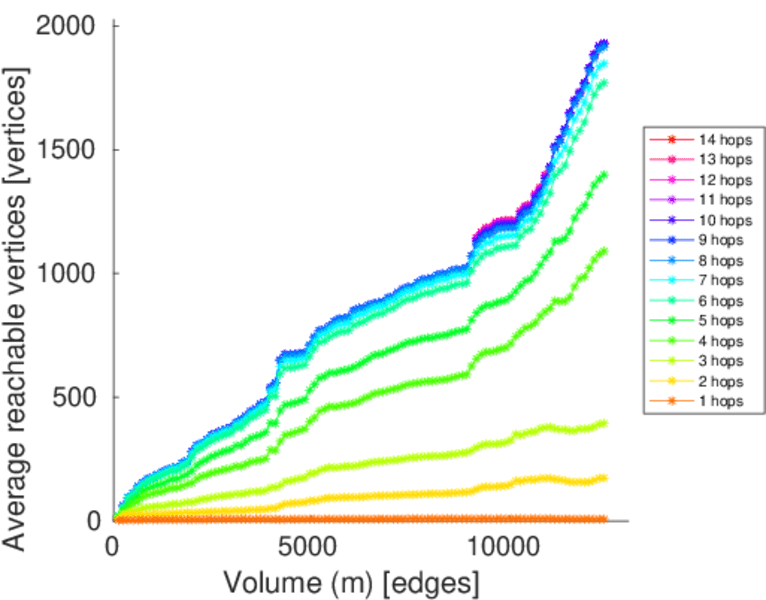
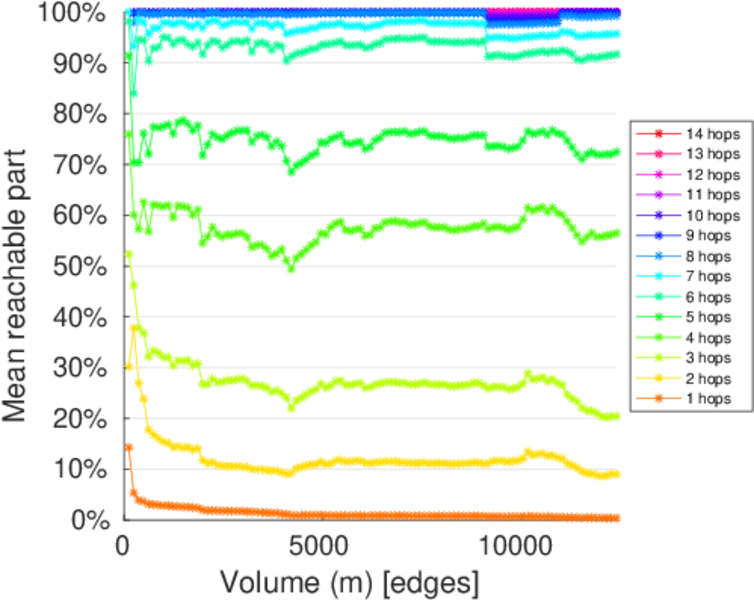
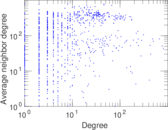
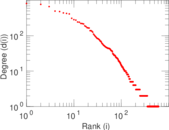
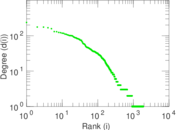
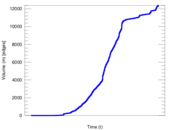
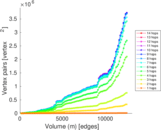
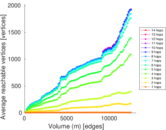
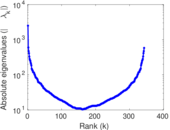
Plots


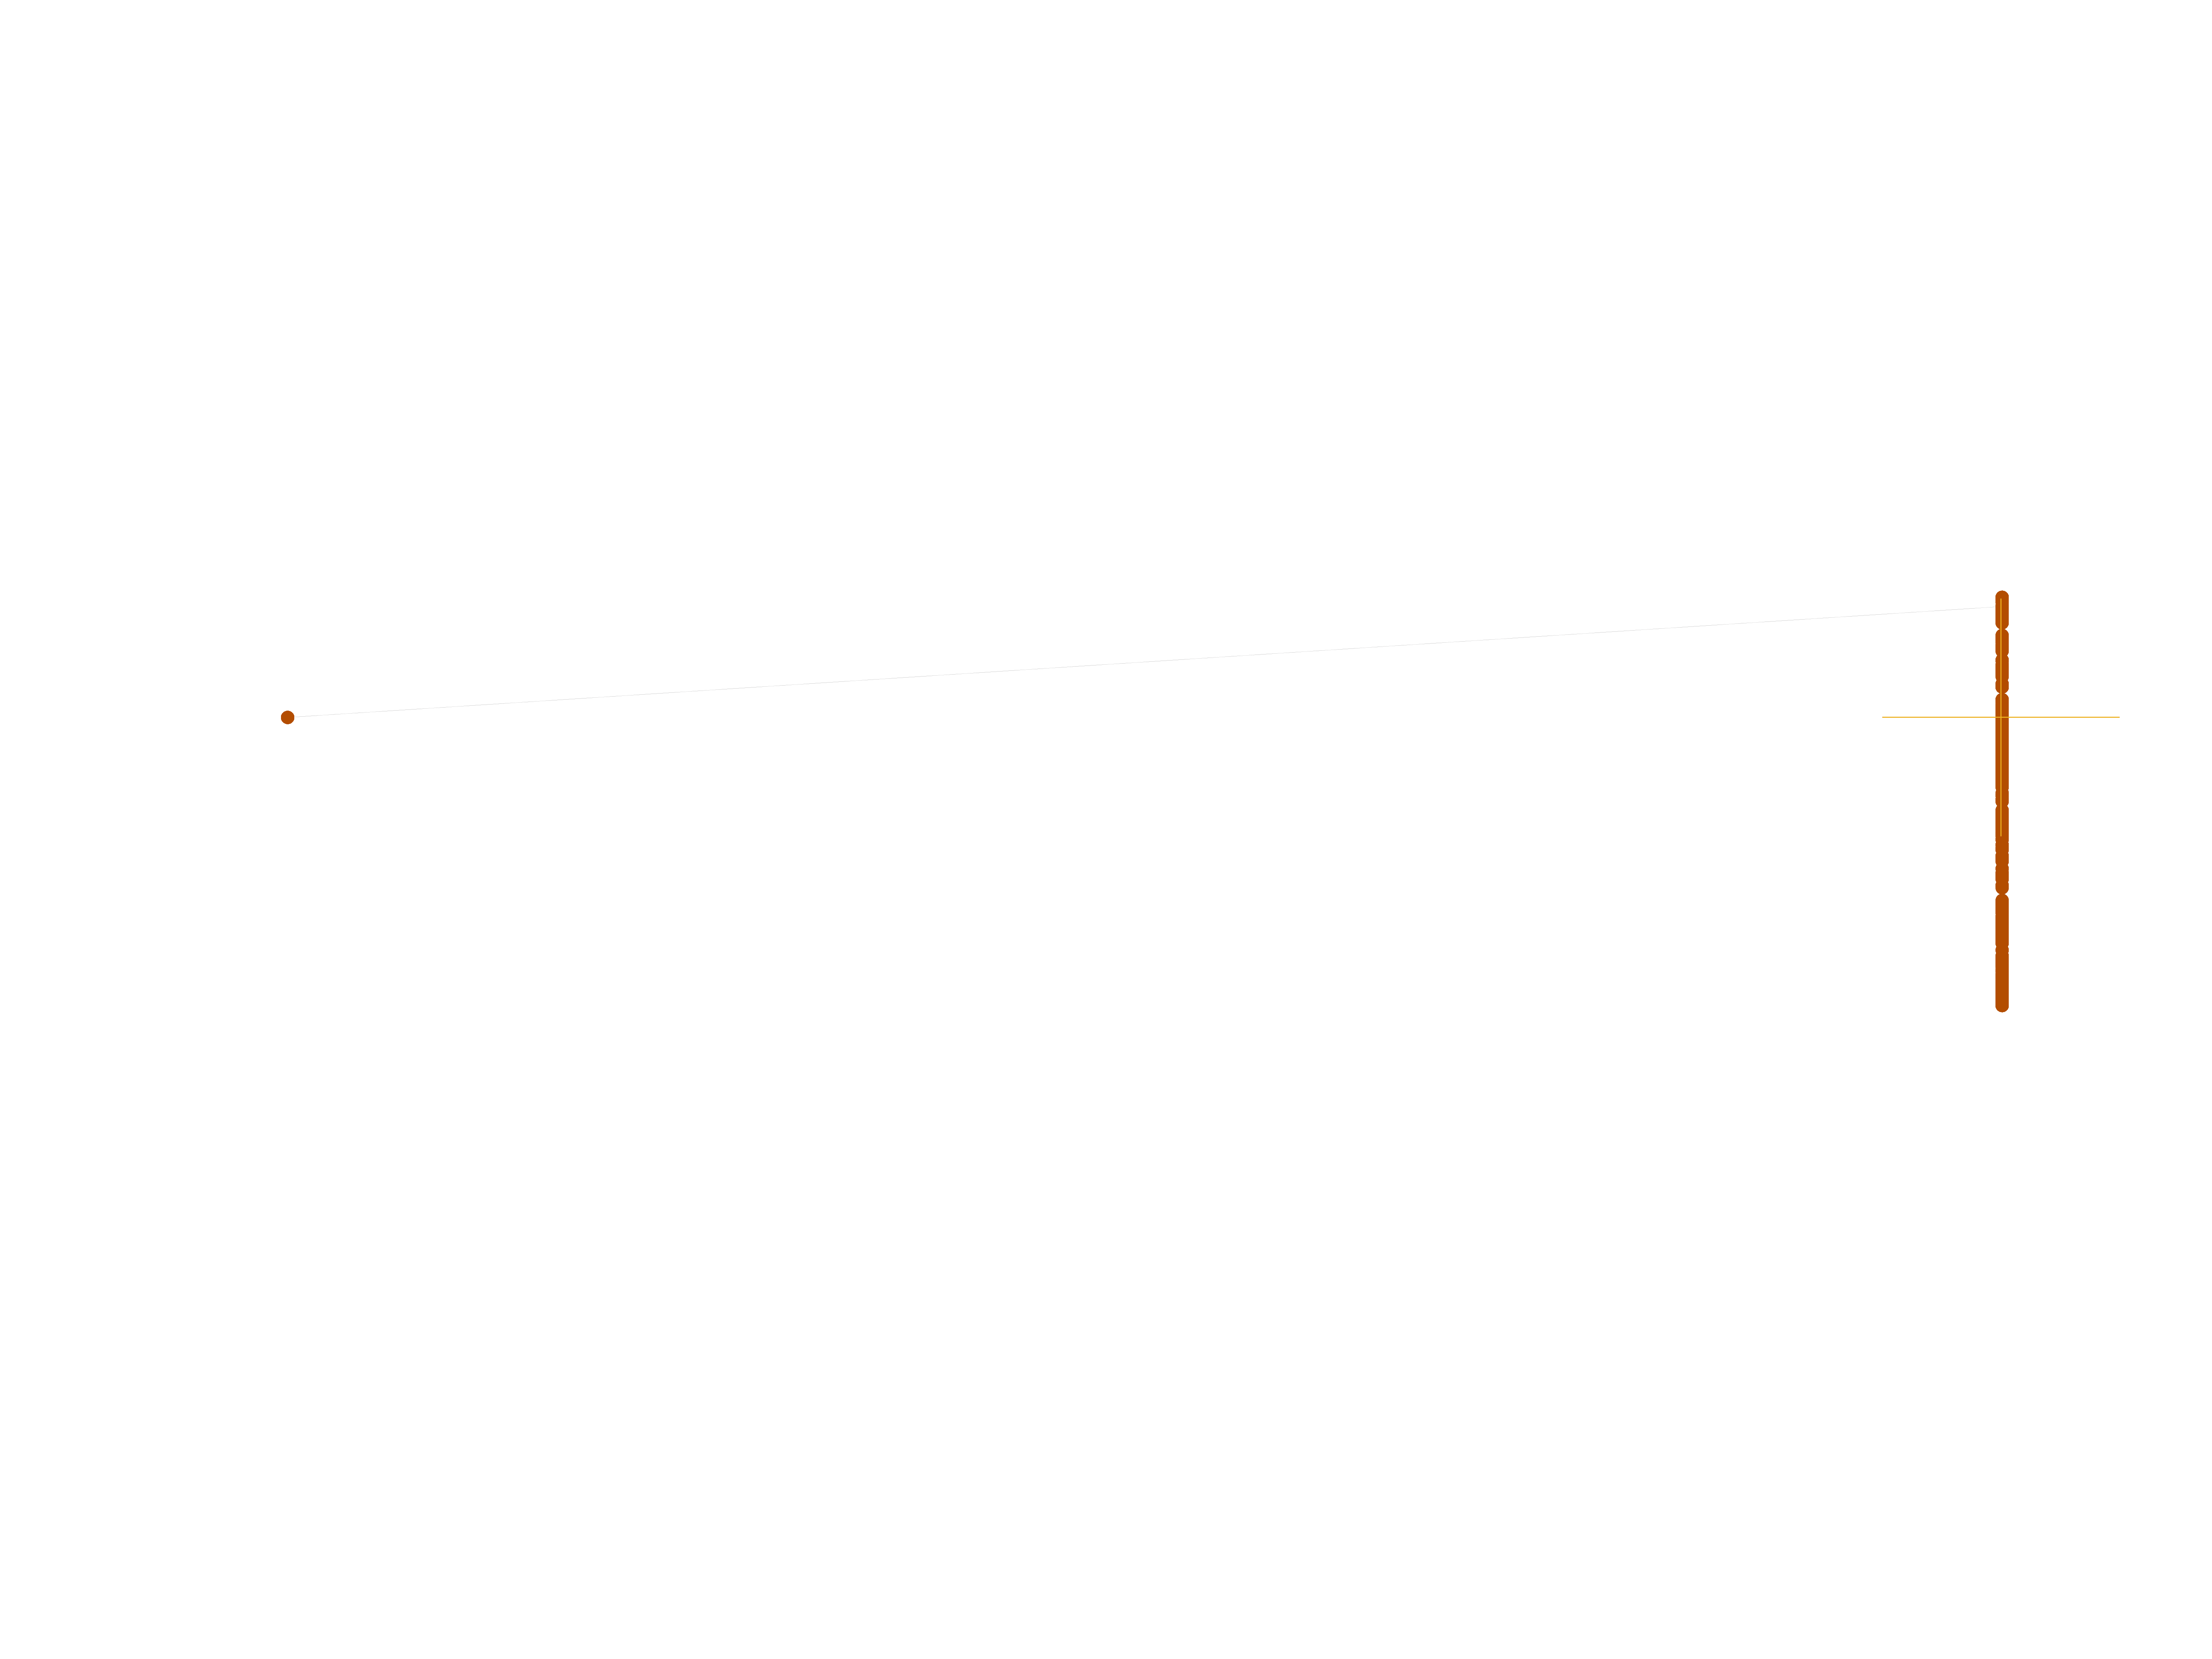
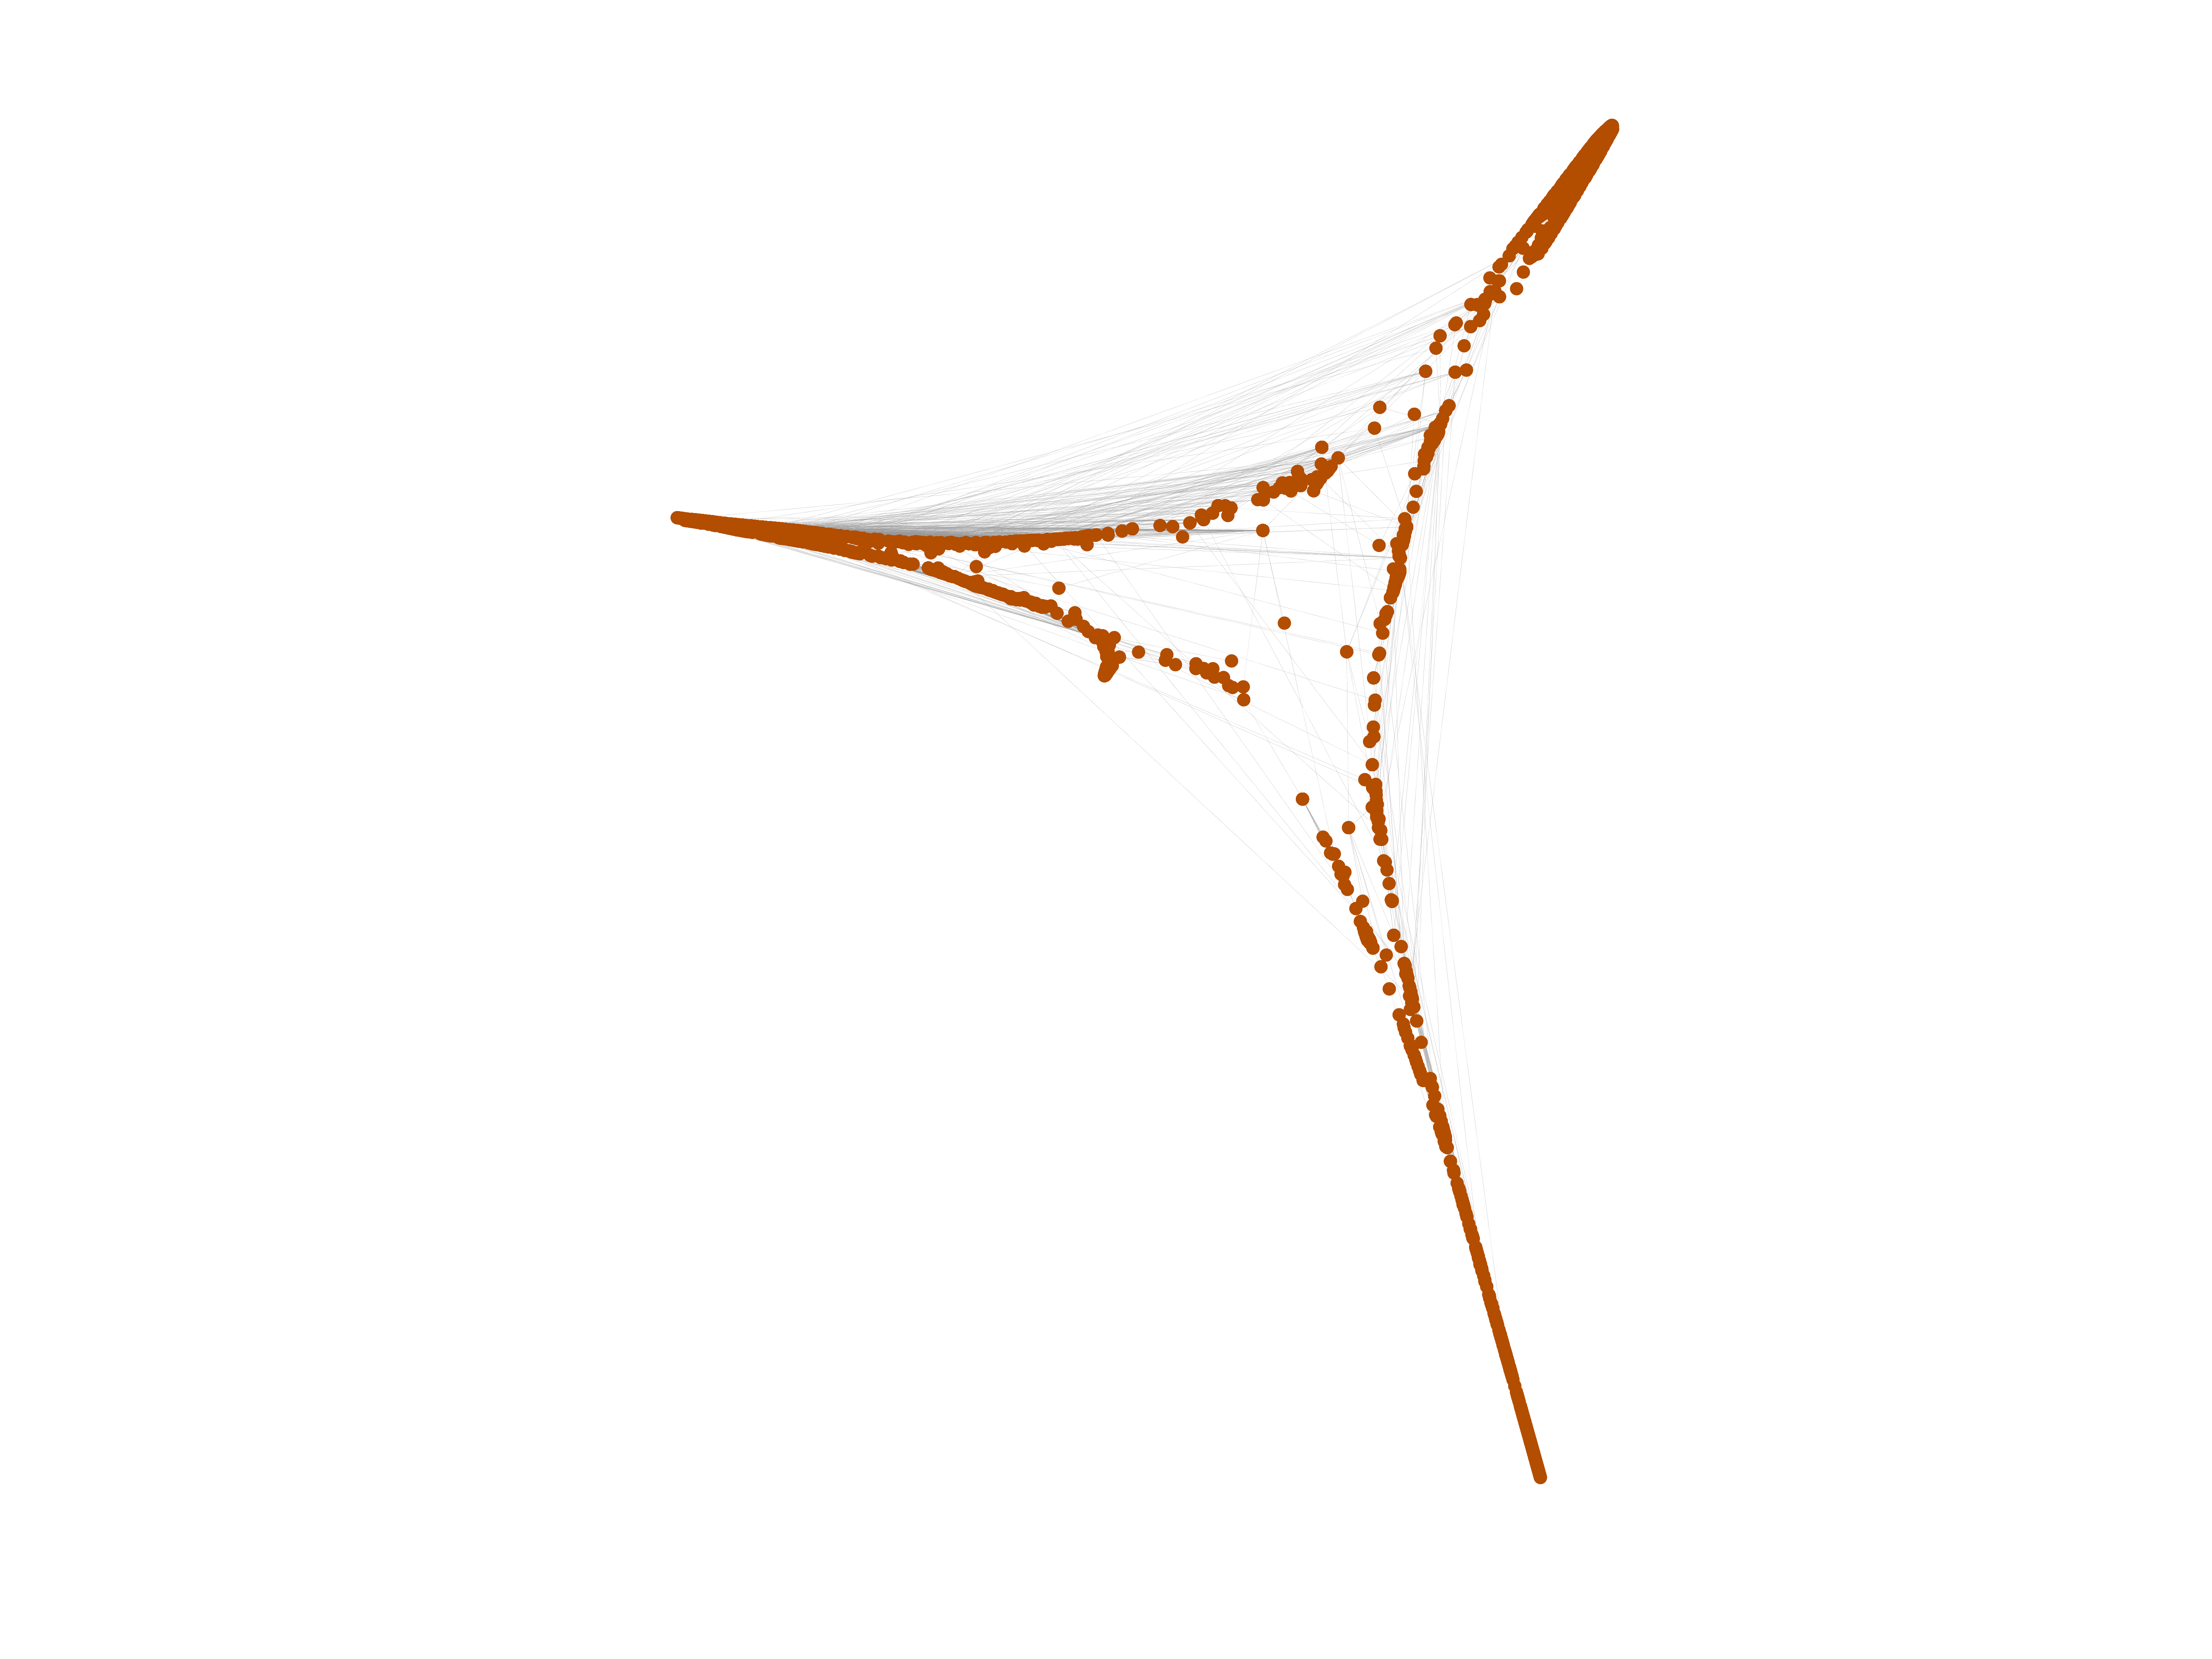
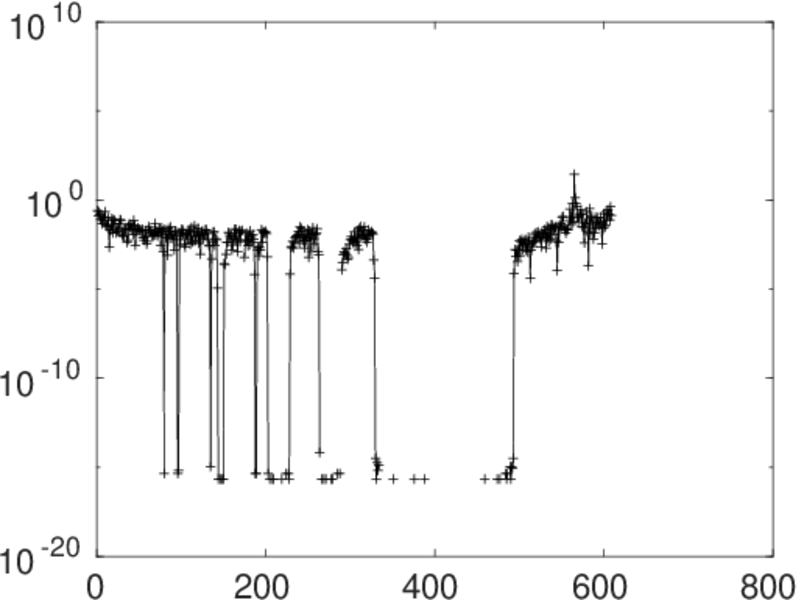
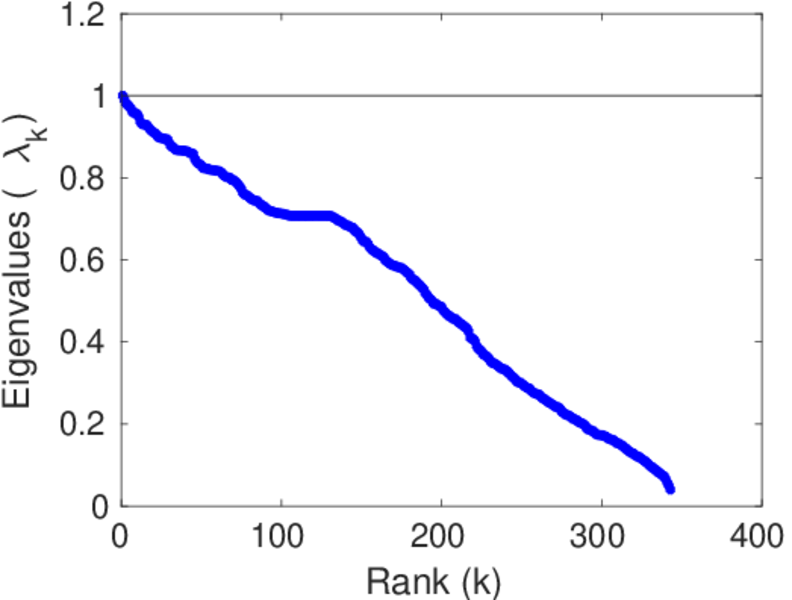
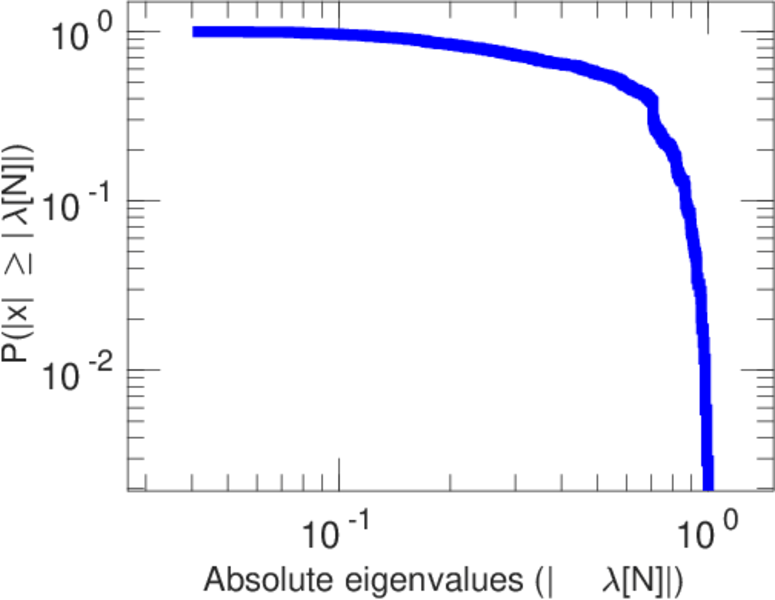
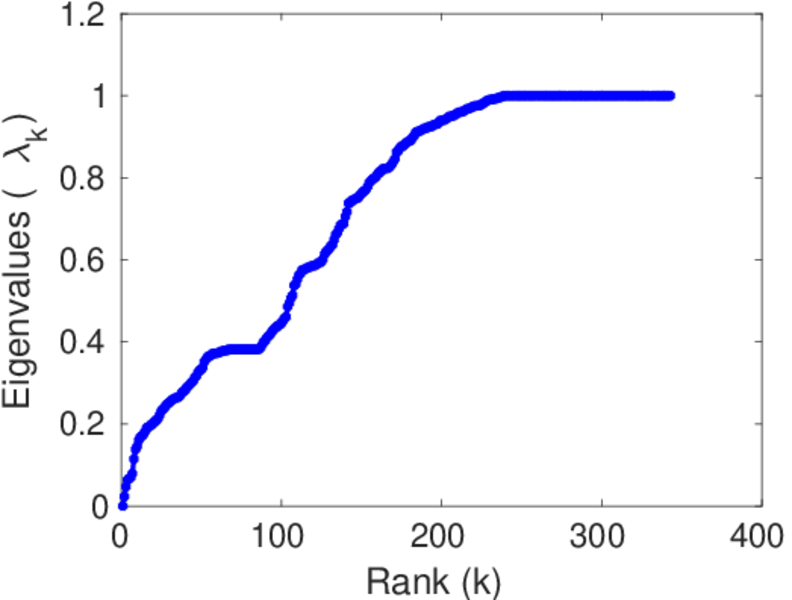
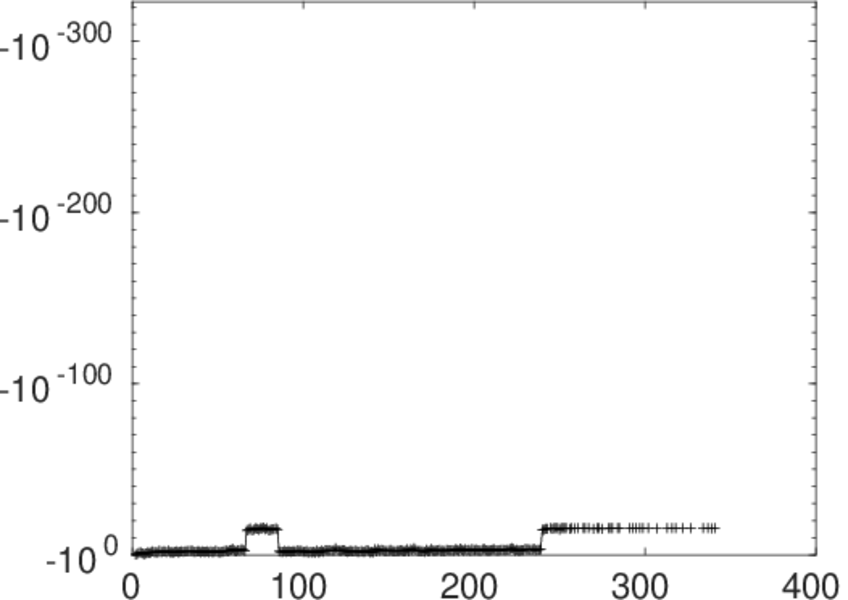
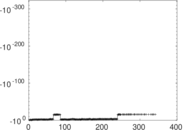
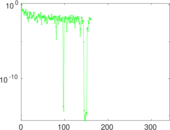
Matrix decompositions plots


Downloads
References
|
[1]
|
Jérôme Kunegis.
KONECT – The Koblenz Network Collection.
In Proc. Int. Conf. on World Wide Web Companion, pages
1343–1350, 2013.
[ http ]
|
|
[2]
|
Wikimedia Foundation.
Wikimedia downloads.
http://dumps.wikimedia.org/, January 2010.
|
 KONECT ‣ Networks ‣
Buy Me a Coffee
KONECT ‣ Networks ‣
Buy Me a Coffee