Wikipedia edits (fo)
This is the bipartite edit network of the Faroese Wikipedia. It contains users
and pages from the Faroese Wikipedia, connected by edit events. Each edge
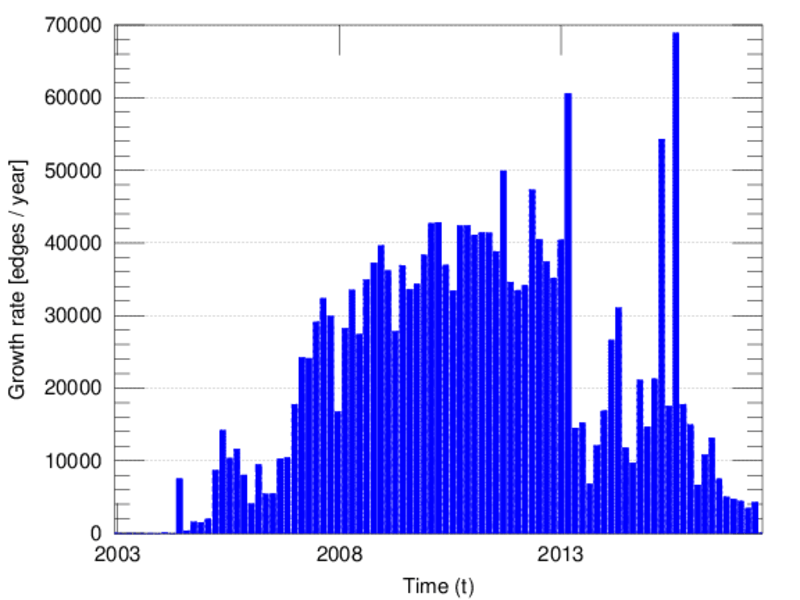
represents an edit. The dataset includes the timestamp of each edit.
Metadata
Statistics
| Size | n = | 39,779
|
| Left size | n1 = | 2,212
|
| Right size | n2 = | 37,567
|
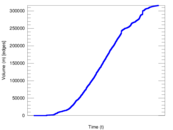
| Volume | m = | 315,895
|
| Unique edge count | m̿ = | 156,422
|
| Wedge count | s = | 414,380,853
|
| Claw count | z = | 2,013,427,957,713
|
| Cross count | x = | 9,717,891,439,616,014
|
| Square count | q = | 492,814,267
|
| 4-Tour count | T4 = | 5,600,366,156
|
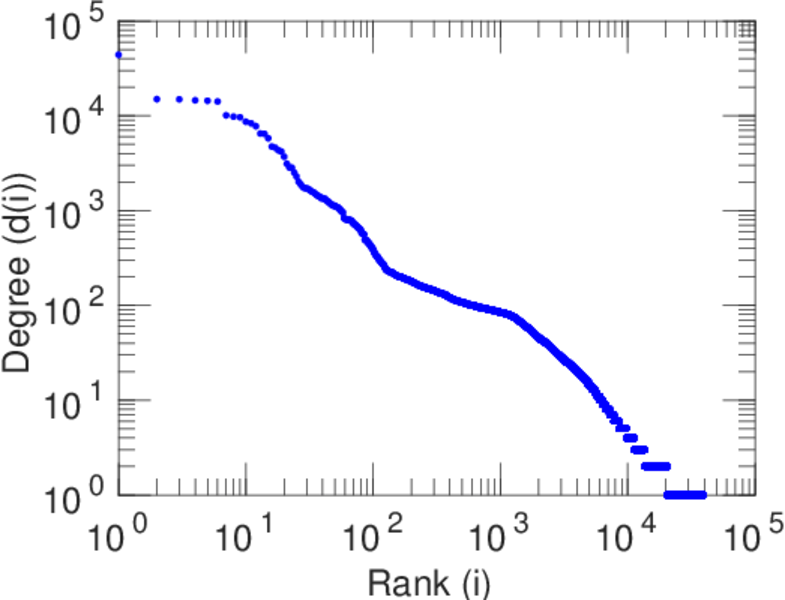
| Maximum degree | dmax = | 44,010
|
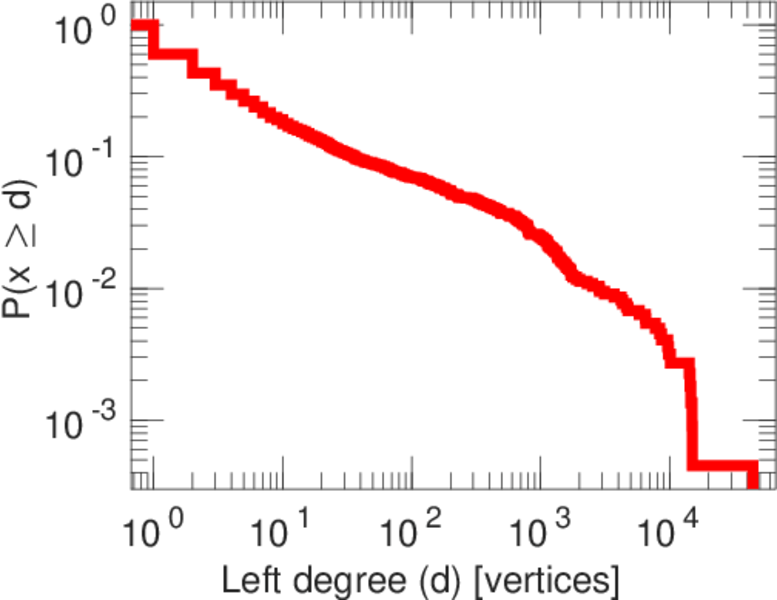
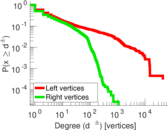
| Maximum left degree | d1max = | 44,010
|
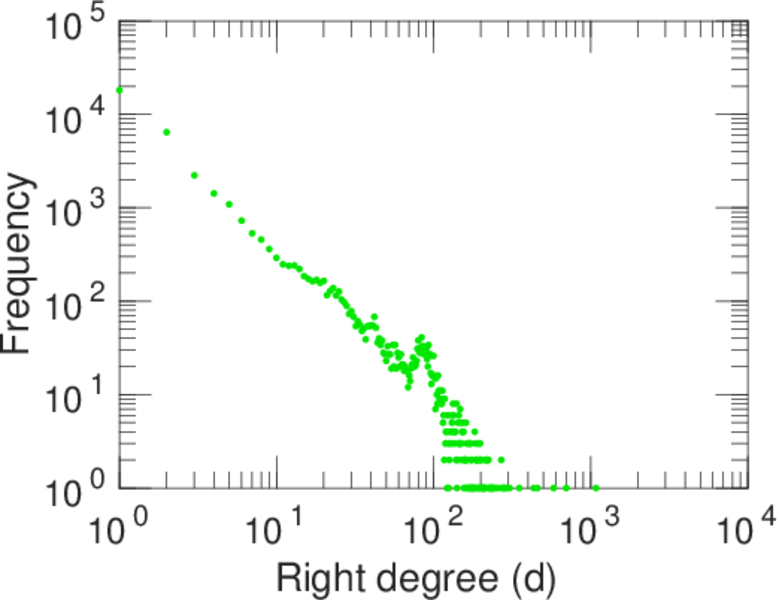
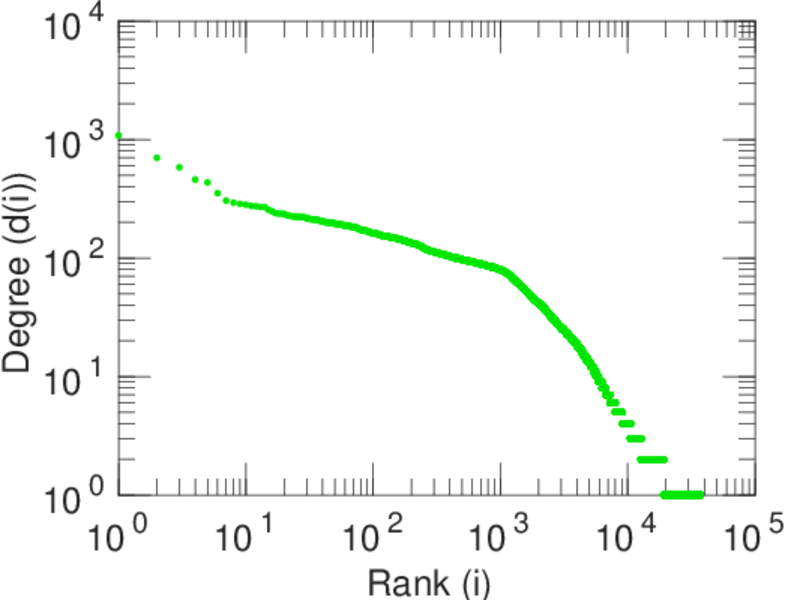
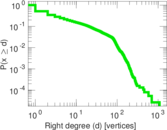
| Maximum right degree | d2max = | 1,082
|
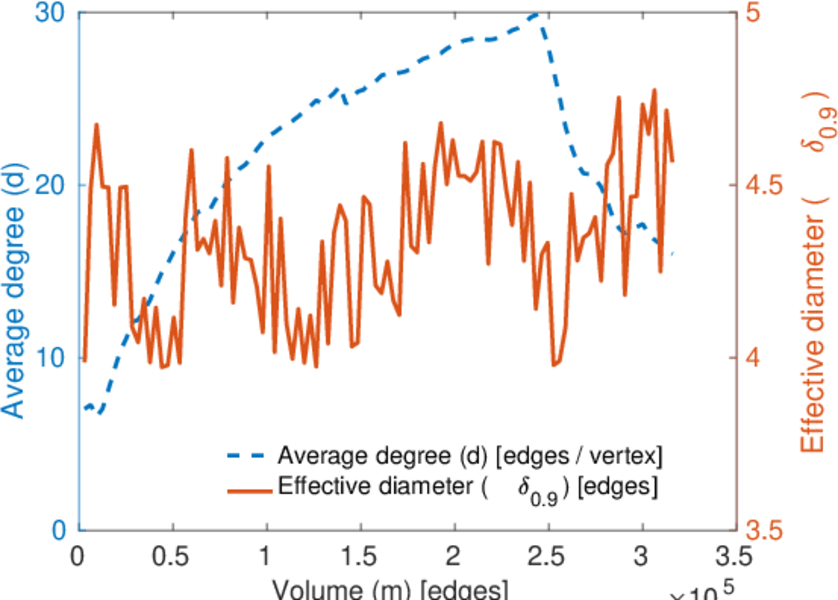
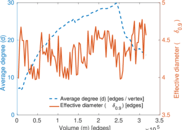
| Average degree | d = | 15.882 5
|
| Average left degree | d1 = | 142.810
|
| Average right degree | d2 = | 8.408 84
|
| Fill | p = | 0.001 882 38
|
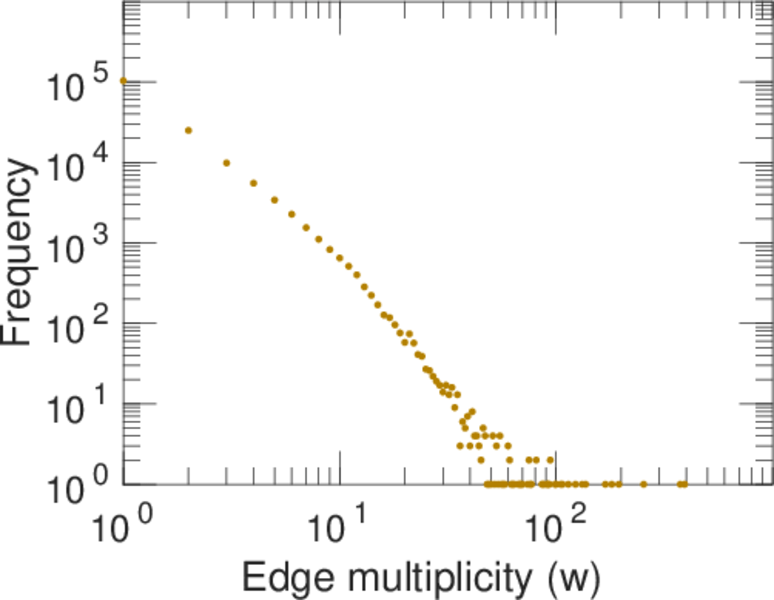
| Average edge multiplicity | m̃ = | 2.019 50
|
| Size of LCC | N = | 38,895
|
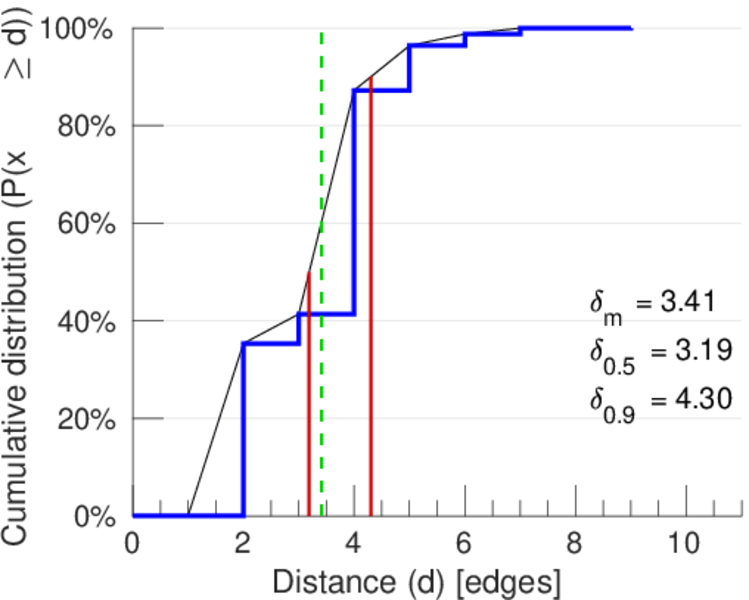
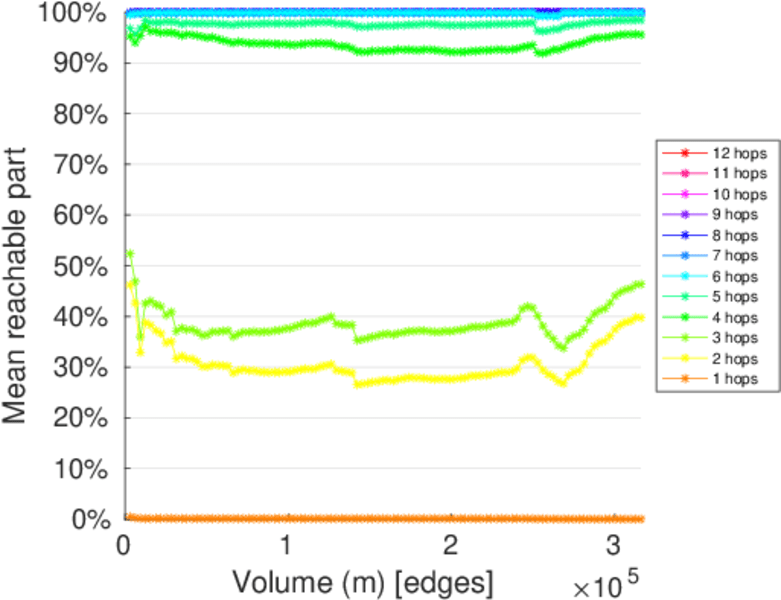
| Diameter | δ = | 10
|
| 50-Percentile effective diameter | δ0.5 = | 3.188 11
|
| 90-Percentile effective diameter | δ0.9 = | 4.303 31
|
| Median distance | δM = | 4
|
| Mean distance | δm = | 3.409 57
|
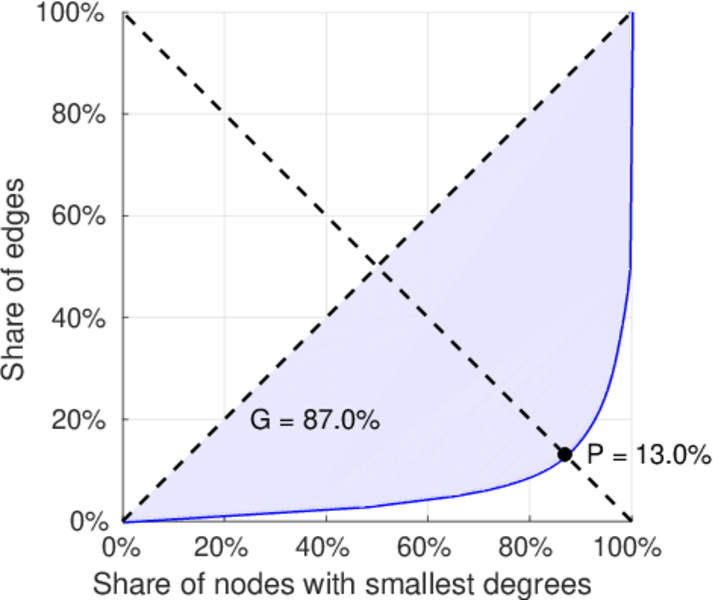
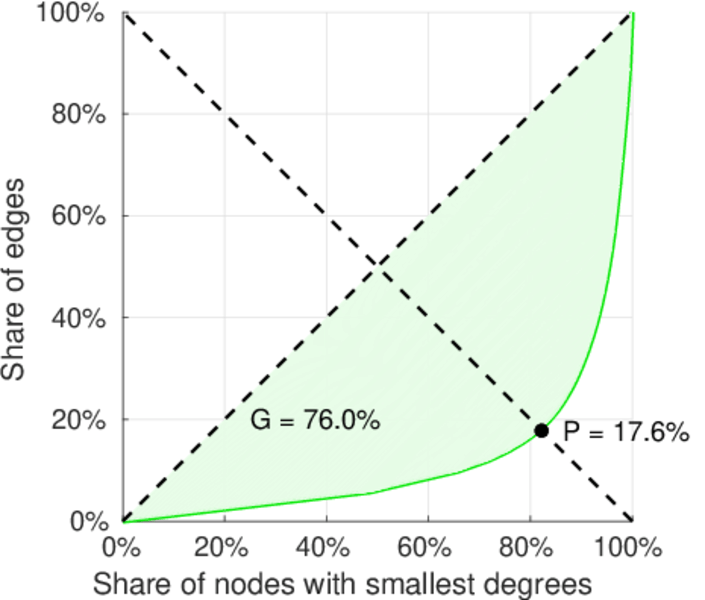
| Gini coefficient | G = | 0.873 088
|
| Balanced inequality ratio | P = | 0.127 648
|
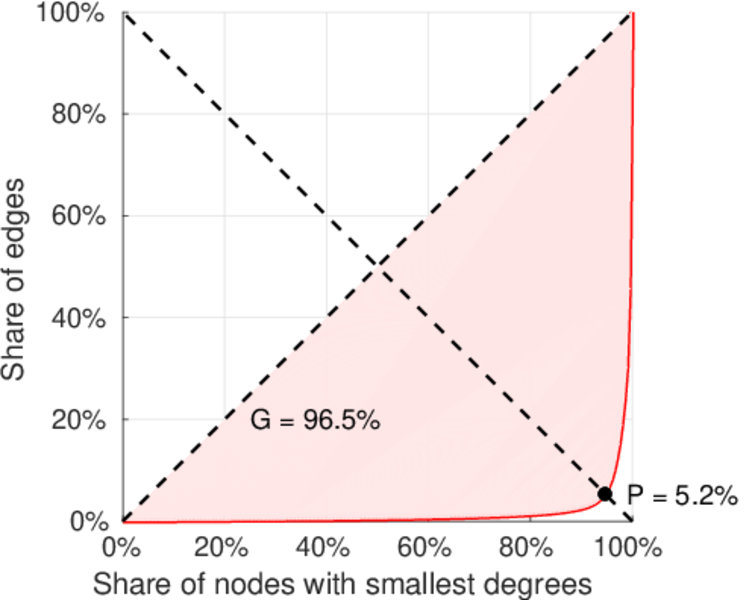
| Left balanced inequality ratio | P1 = | 0.051 995 1
|
| Right balanced inequality ratio | P2 = | 0.176 423
|
| Relative edge distribution entropy | Her = | 0.729 133
|
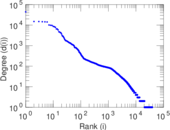
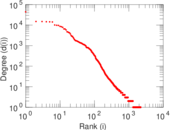
| Power law exponent | γ = | 2.472 34
|
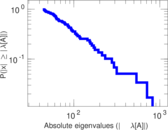
| Tail power law exponent | γt = | 1.891 00
|
| Tail power law exponent with p | γ3 = | 1.891 00
|
| p-value | p = | 0.000 00
|
| Left tail power law exponent with p | γ3,1 = | 1.671 00
|
| Left p-value | p1 = | 0.000 00
|
| Right tail power law exponent with p | γ3,2 = | 1.911 00
|
| Right p-value | p2 = | 0.000 00
|
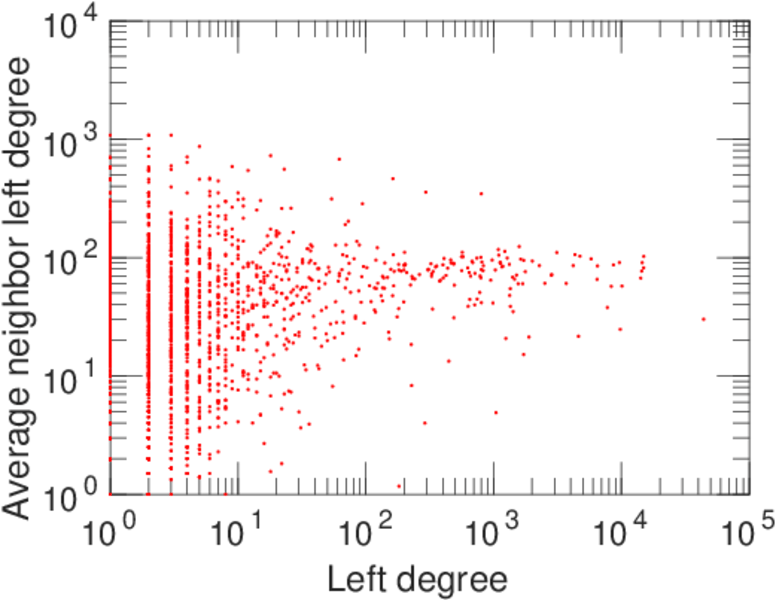
| Degree assortativity | ρ = | −0.440 310
|
| Degree assortativity p-value | pρ = | 0.000 00
|
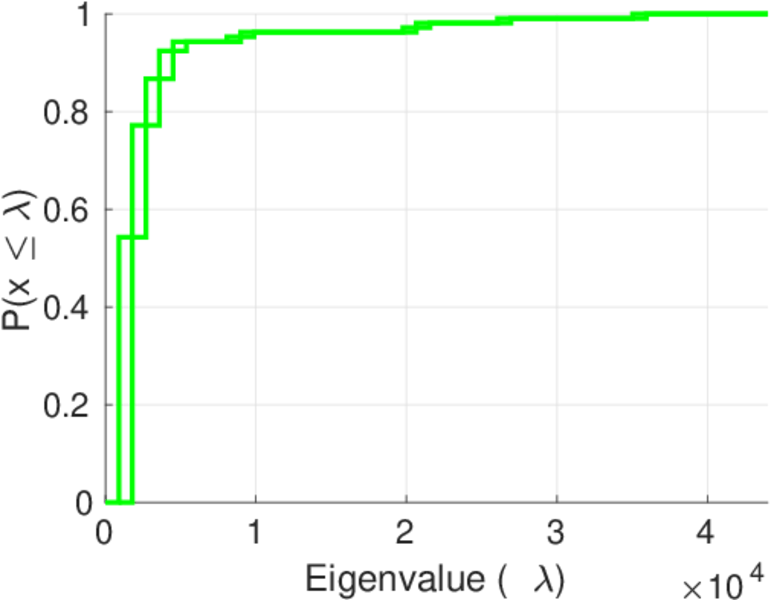
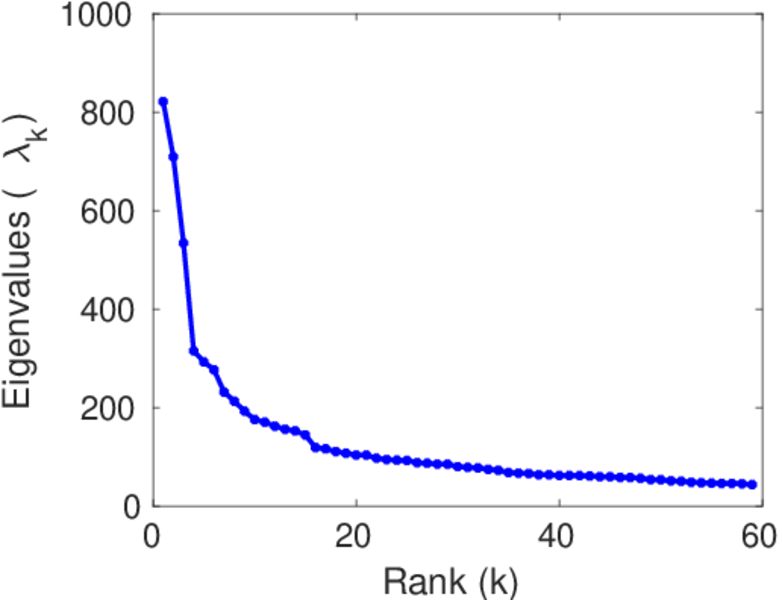
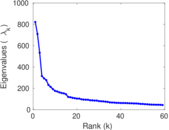
| Spectral norm | α = | 821.470
|
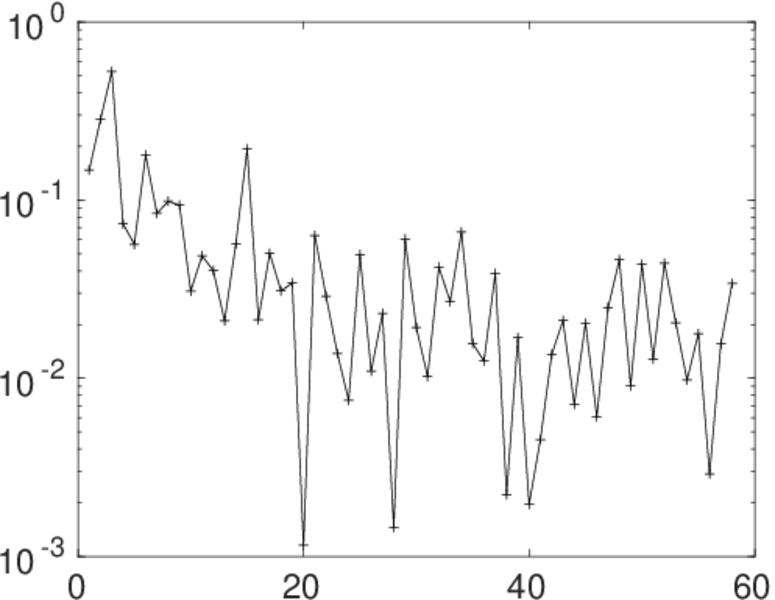
| Algebraic connectivity | a = | 0.077 407 2
|
| Spectral separation | |λ1[A] / λ2[A]| = | 1.158 65
|
| Controllability | C = | 35,372
|
| Relative controllability | Cr = | 0.896 152
|
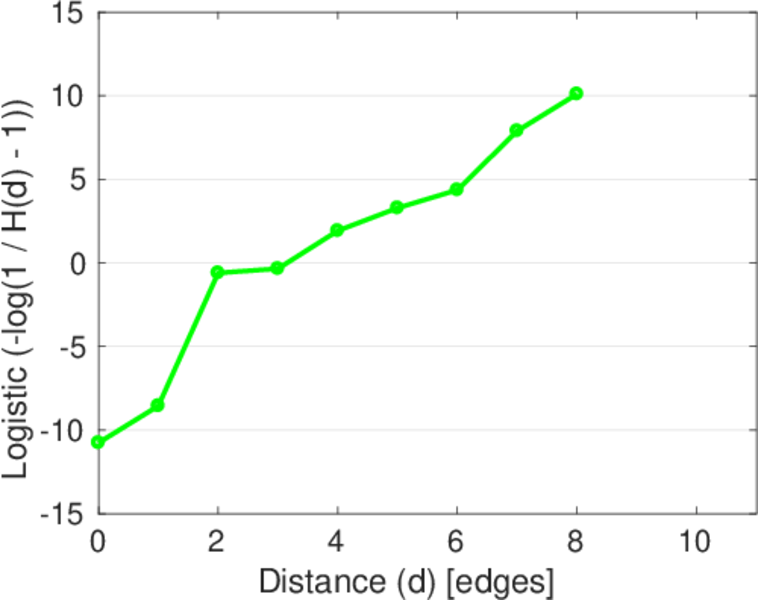
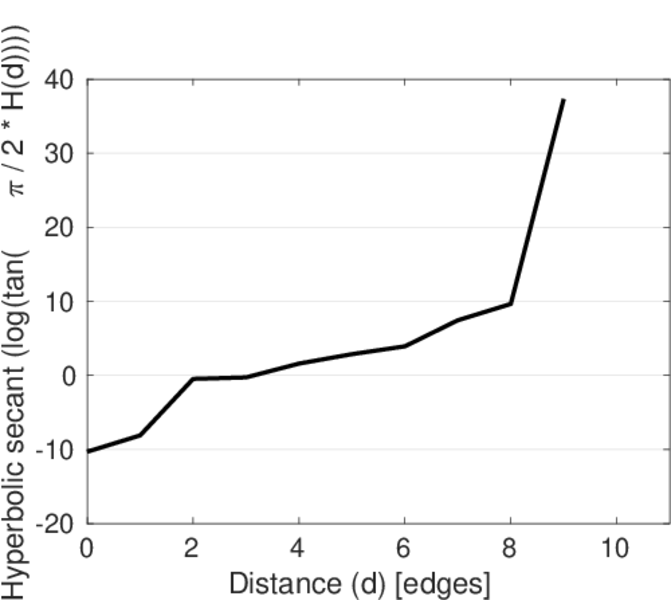
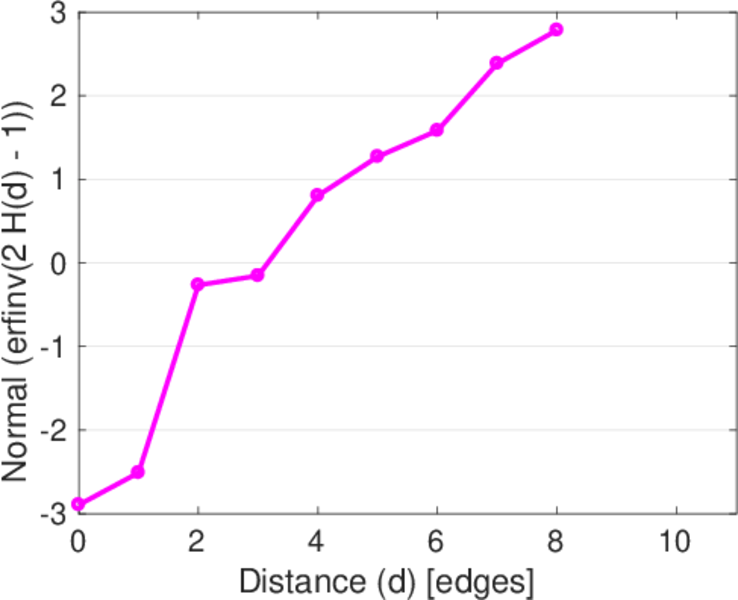
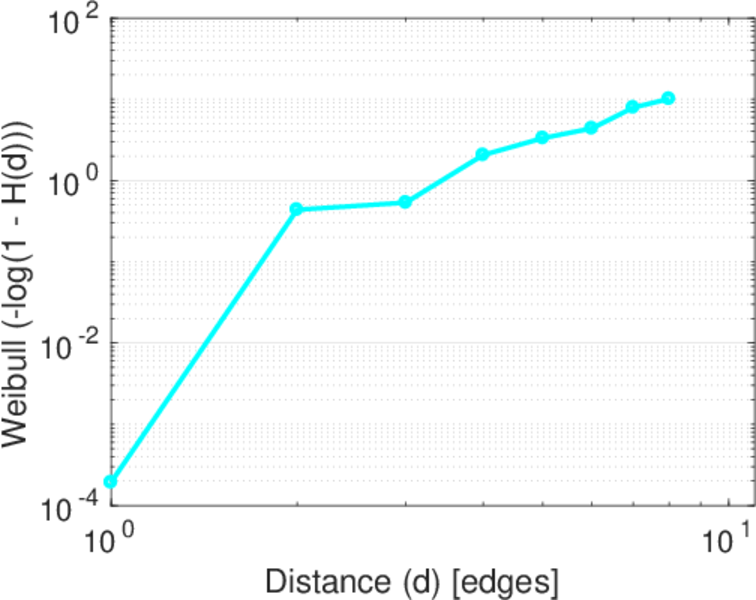
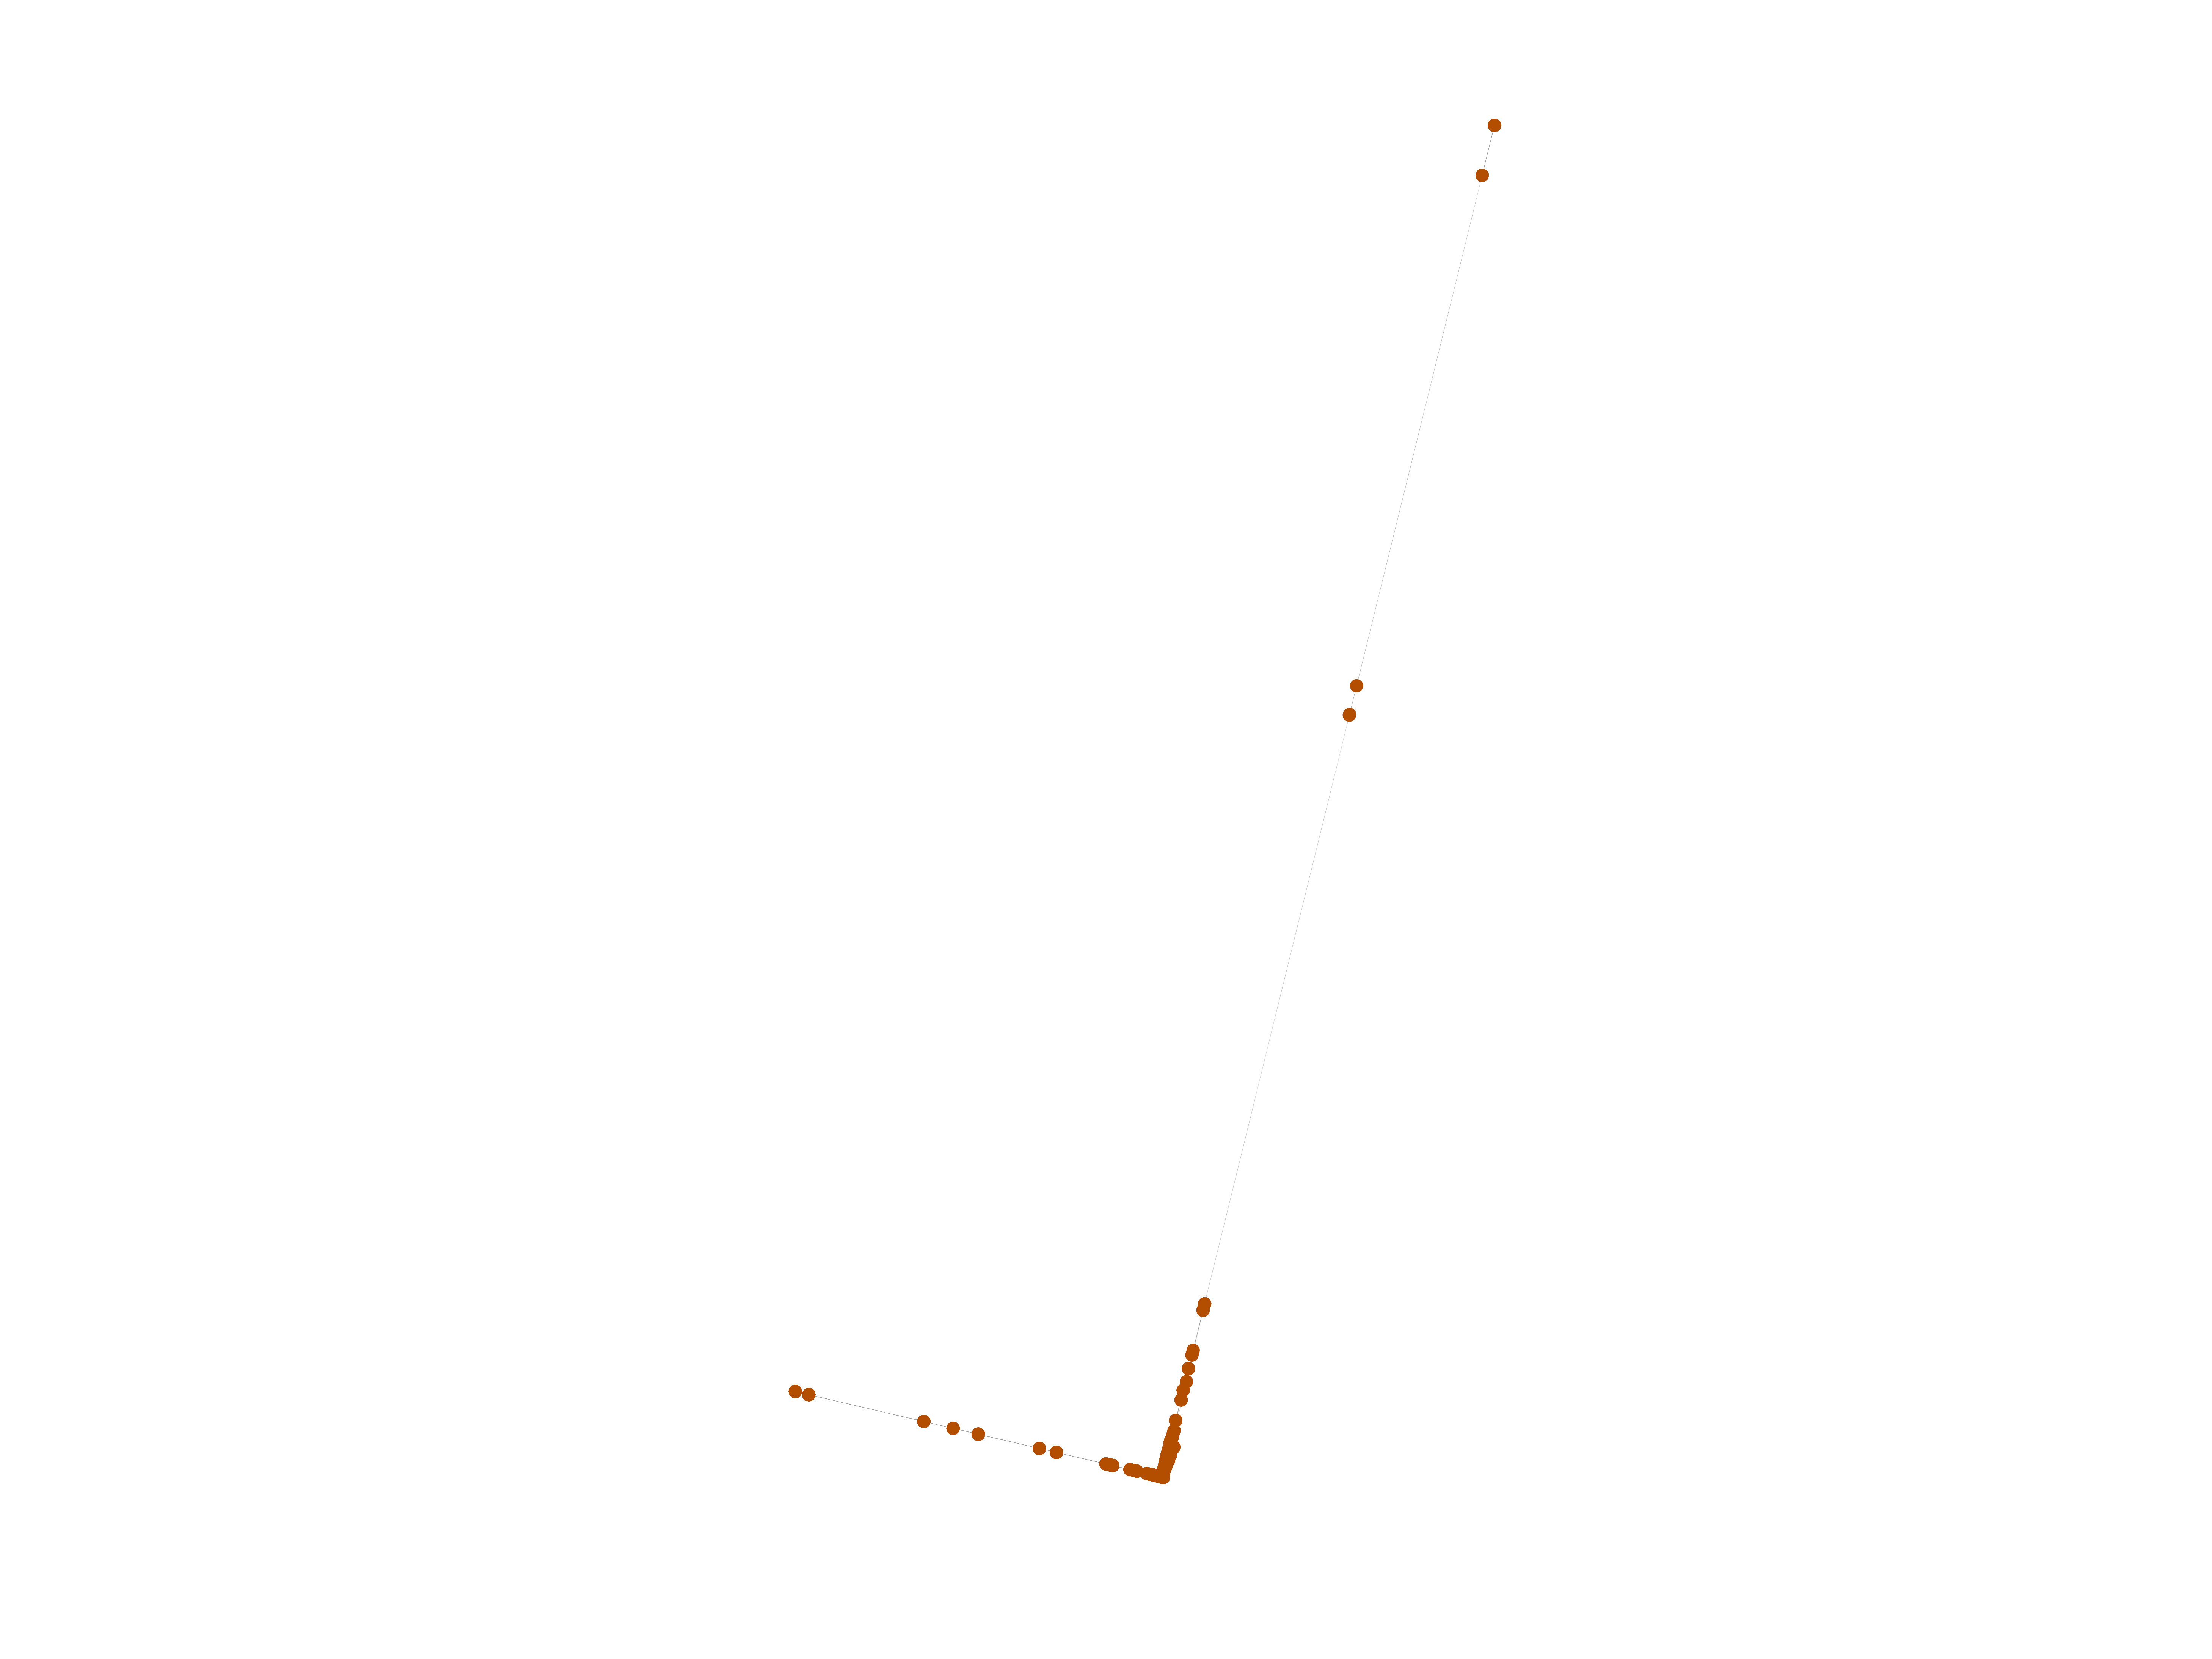
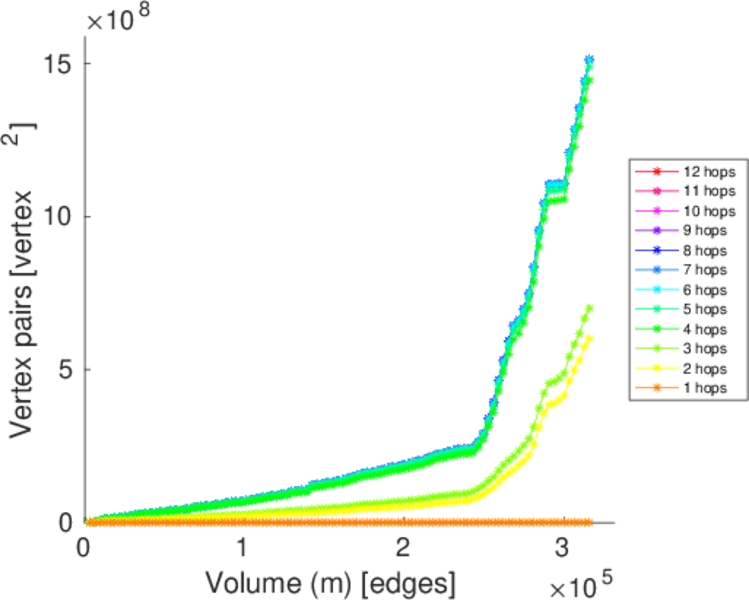
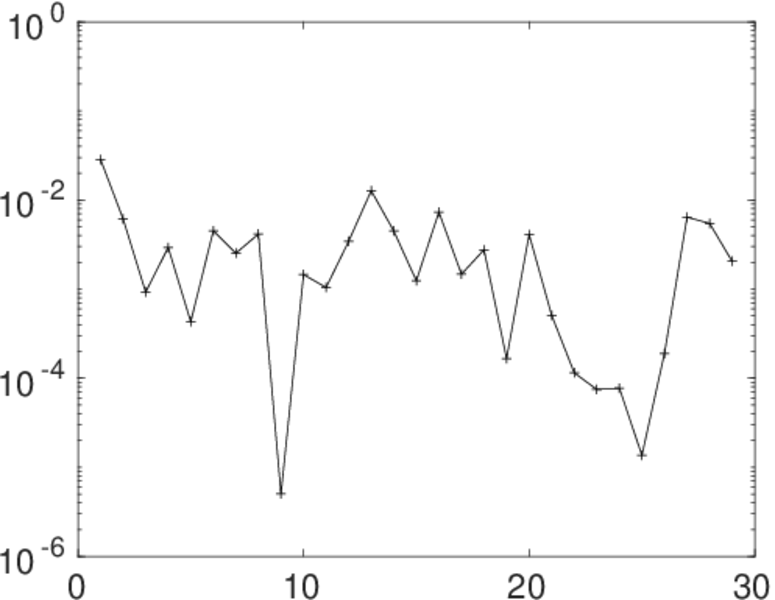
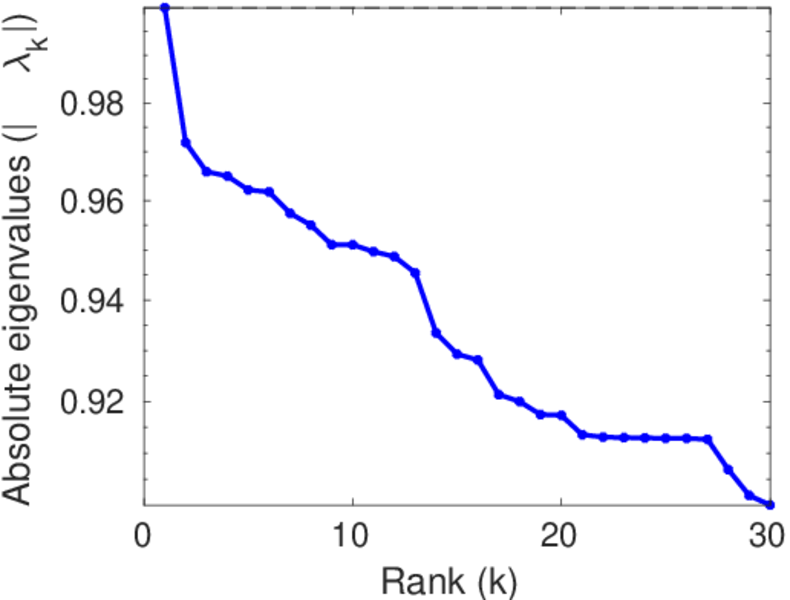
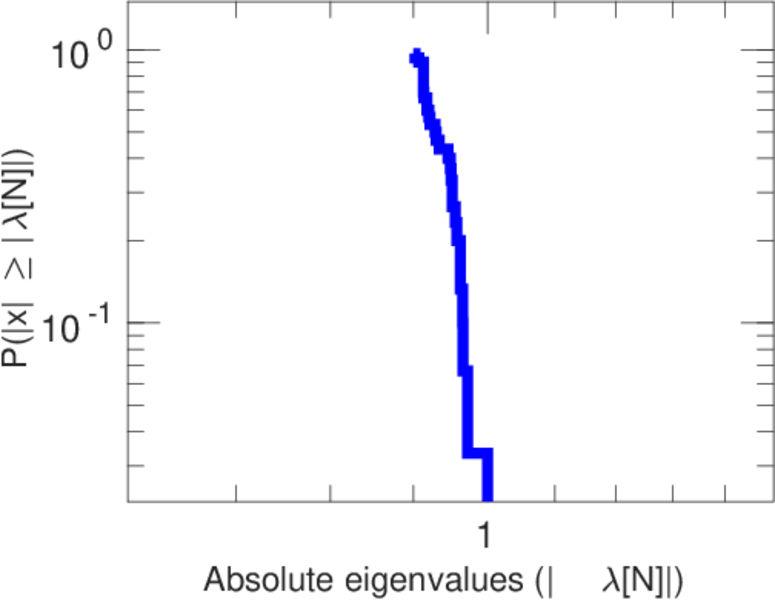
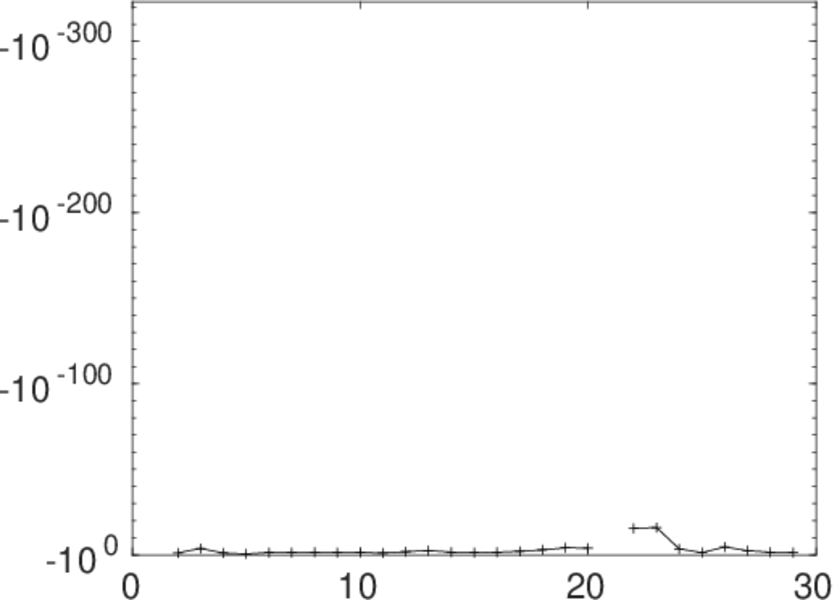
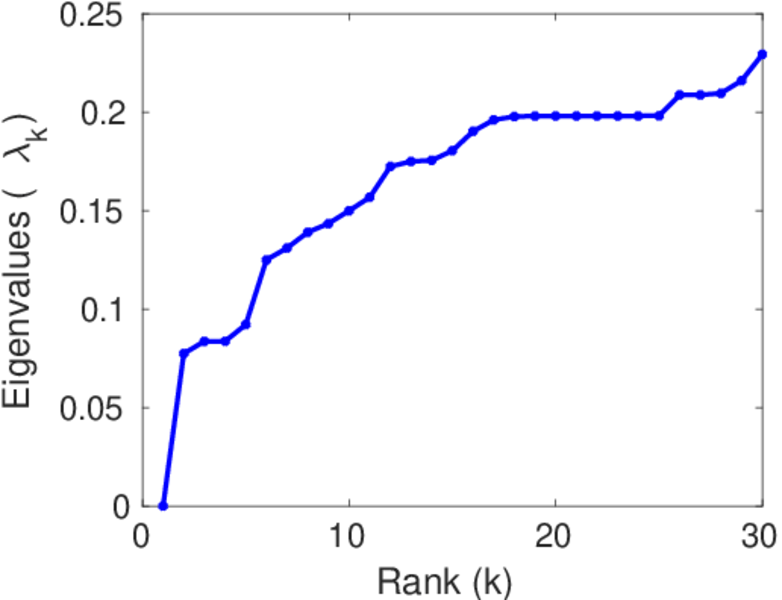
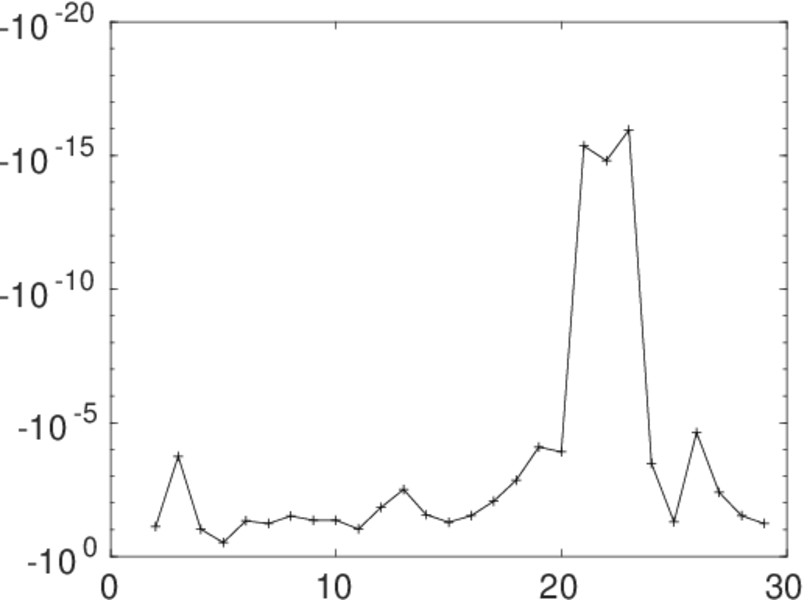
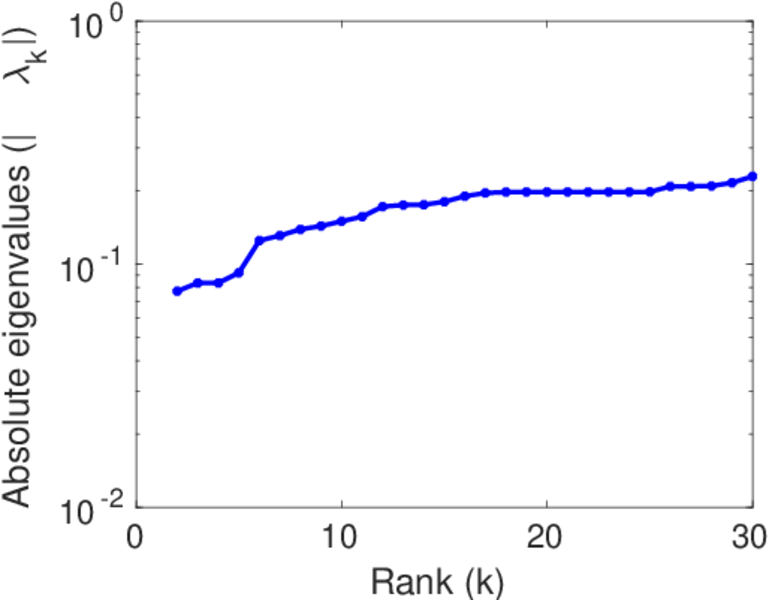
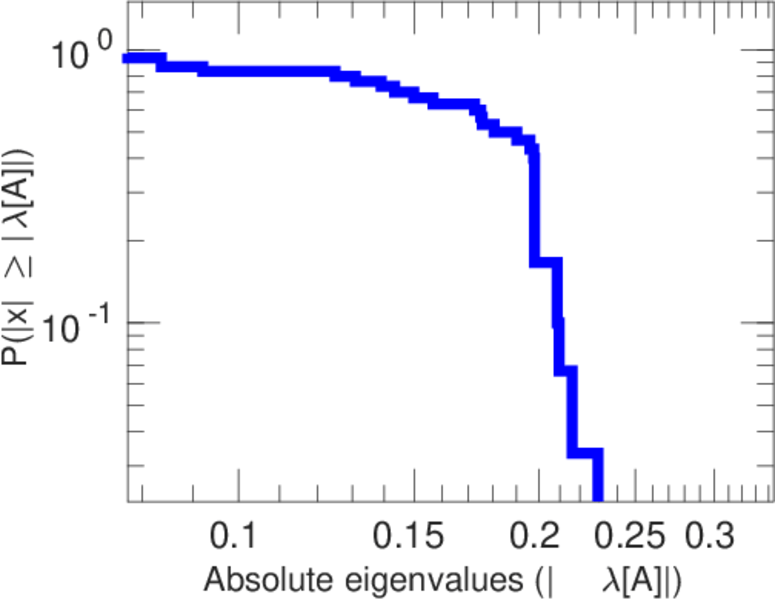
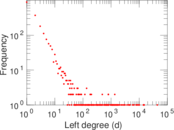
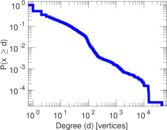
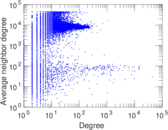
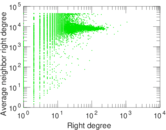
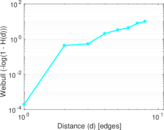
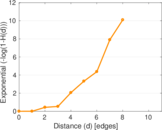
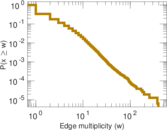
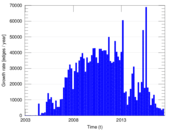
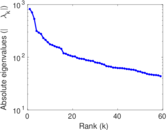
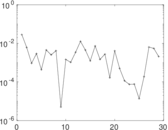
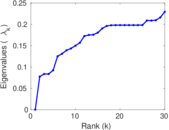
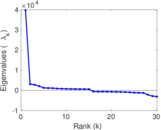
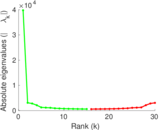
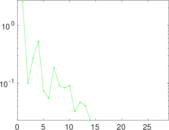
Plots


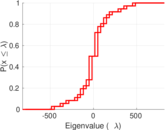
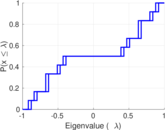

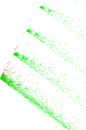

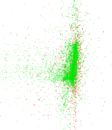


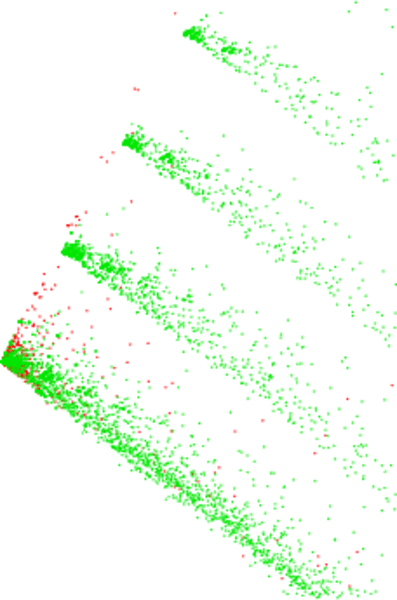
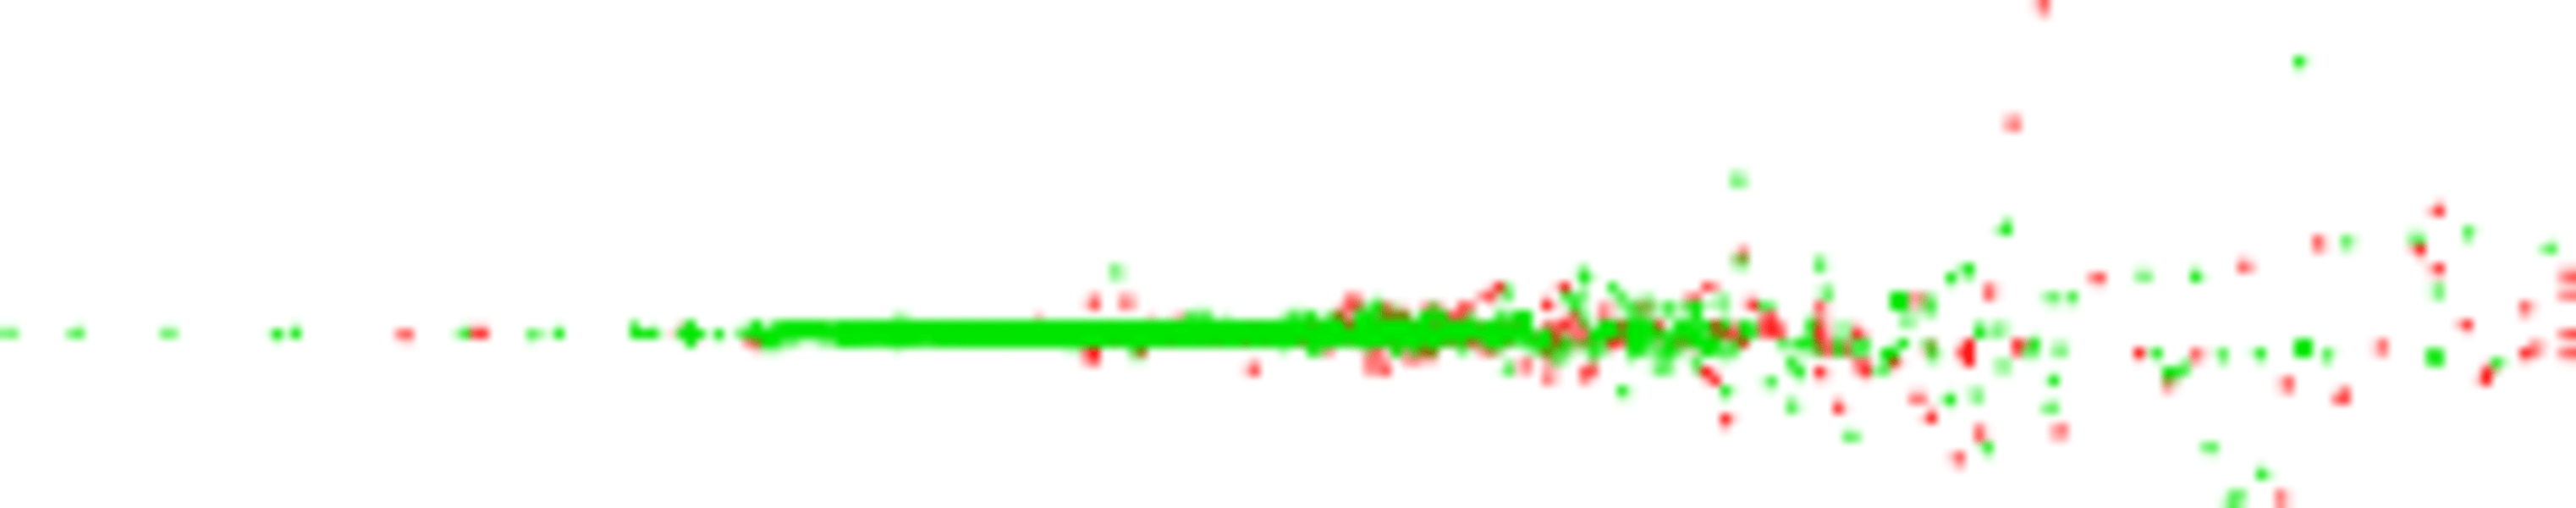
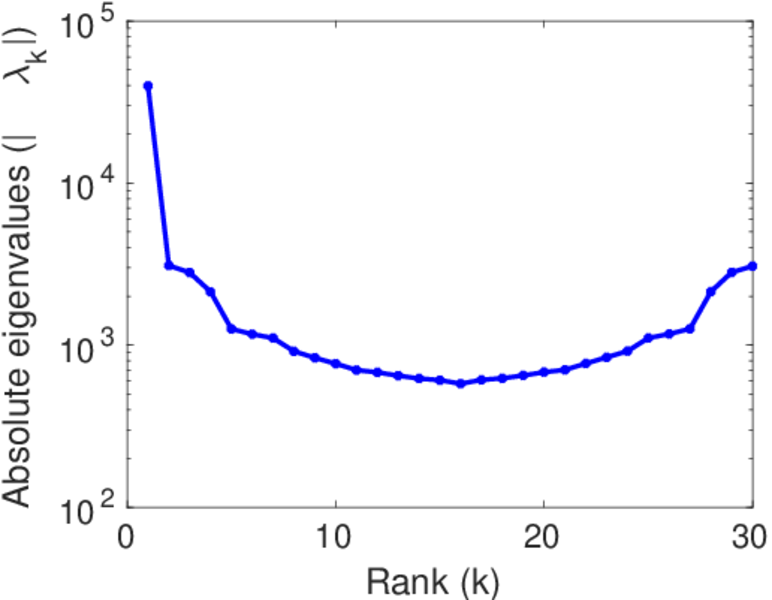
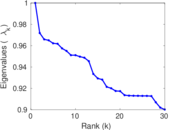
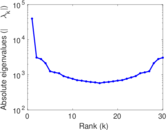
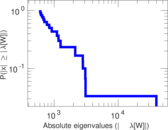
Matrix decompositions plots


Downloads
References
|
[1]
|
Jérôme Kunegis.
KONECT – The Koblenz Network Collection.
In Proc. Int. Conf. on World Wide Web Companion, pages
1343–1350, 2013.
[ http ]
|
|
[2]
|
Wikimedia Foundation.
Wikimedia downloads.
http://dumps.wikimedia.org/, January 2010.
|
 KONECT ‣ Networks ‣
Buy Me a Coffee
KONECT ‣ Networks ‣
Buy Me a Coffee