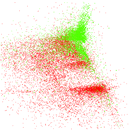
Wiktionary edits (fr)
This is the bipartite edit network of the French Wiktionary. It contains users
and pages from the French Wiktionary, connected by edit events. Each edge
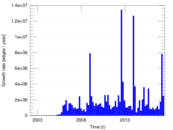
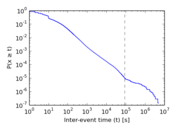
represents an edit. The dataset includes the timestamp of each edit.
Metadata
Statistics
| Size | n = | 3,433,145
|
| Left size | n1 = | 16,874
|
| Right size | n2 = | 3,416,271
|
| Volume | m = | 23,443,737
|
| Unique edge count | m̿ = | 13,427,910
|
| Wedge count | s = | 7,915,083,810,088
|
| Claw count | z = | 5,255,166,833,019,876,352
|
| Cross count | x = | 2.857 51 × 1024
|
| Square count | q = | 586,810,603,830
|
| 4-Tour count | T4 = | 11,347,652,685,920
|
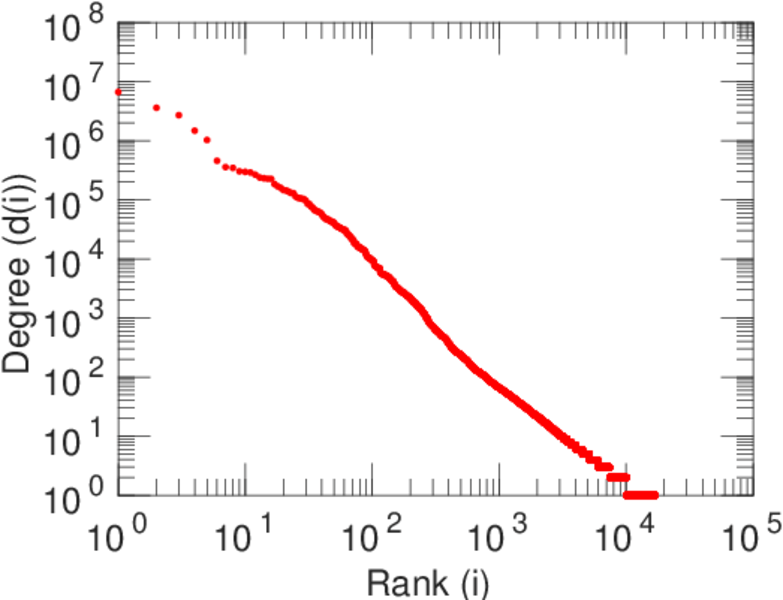
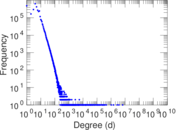
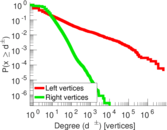
| Maximum degree | dmax = | 6,651,016
|
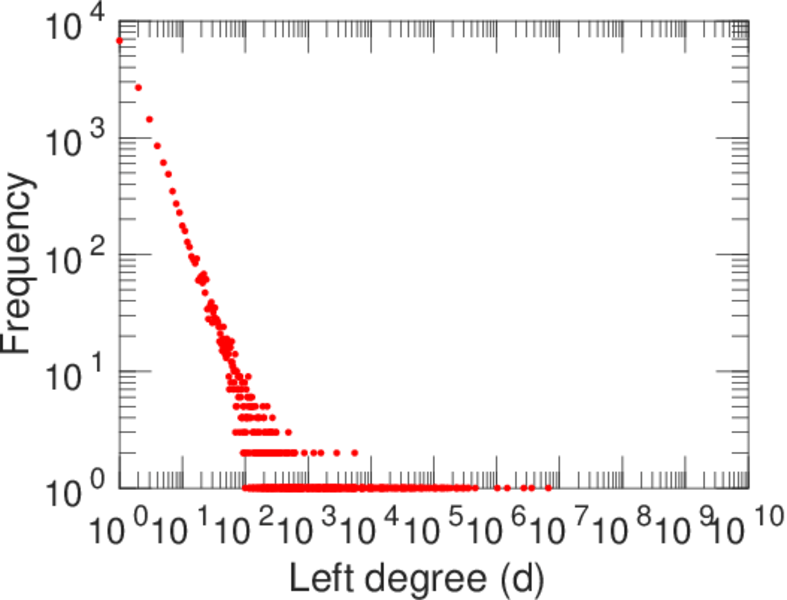
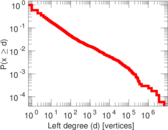
| Maximum left degree | d1max = | 6,651,016
|
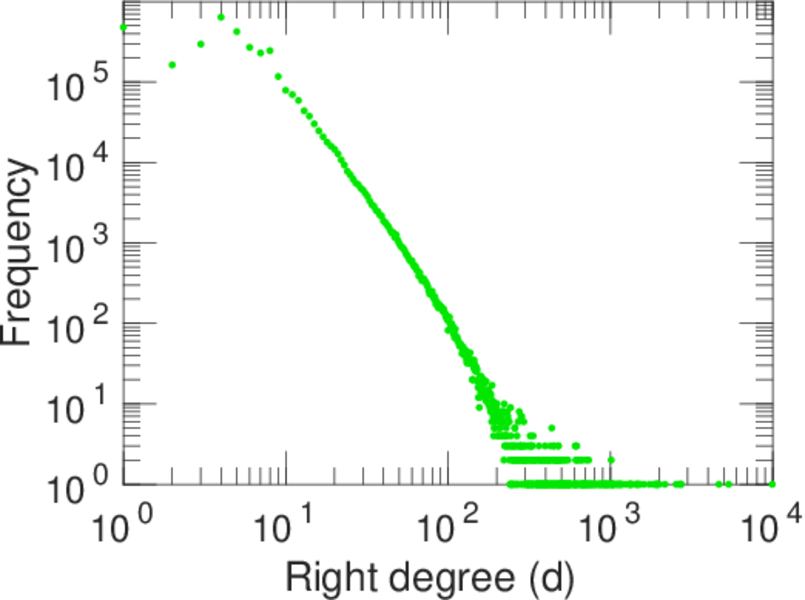
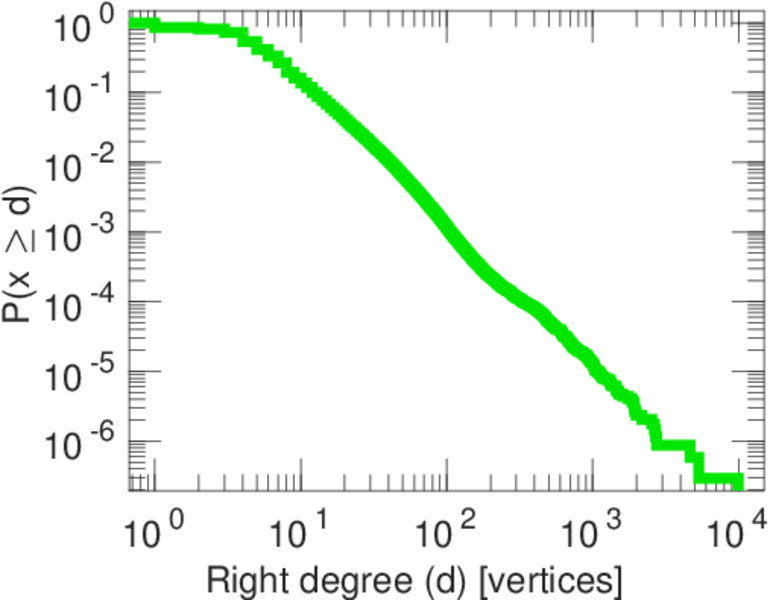
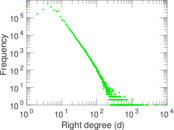
| Maximum right degree | d2max = | 9,952
|
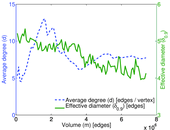
| Average degree | d = | 13.657 3
|
| Average left degree | d1 = | 1,389.34
|
| Average right degree | d2 = | 6.862 38
|
| Fill | p = | 0.000 232 937
|
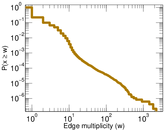
| Average edge multiplicity | m̃ = | 1.745 90
|
| Size of LCC | N = | 3,427,295
|
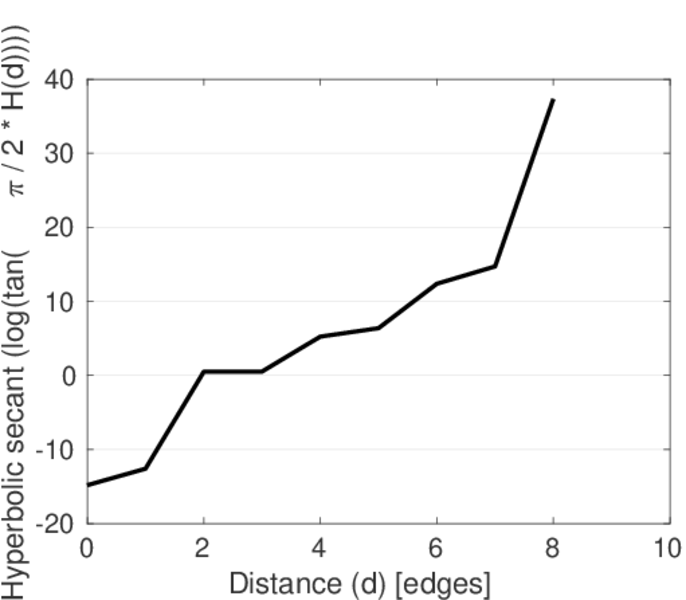
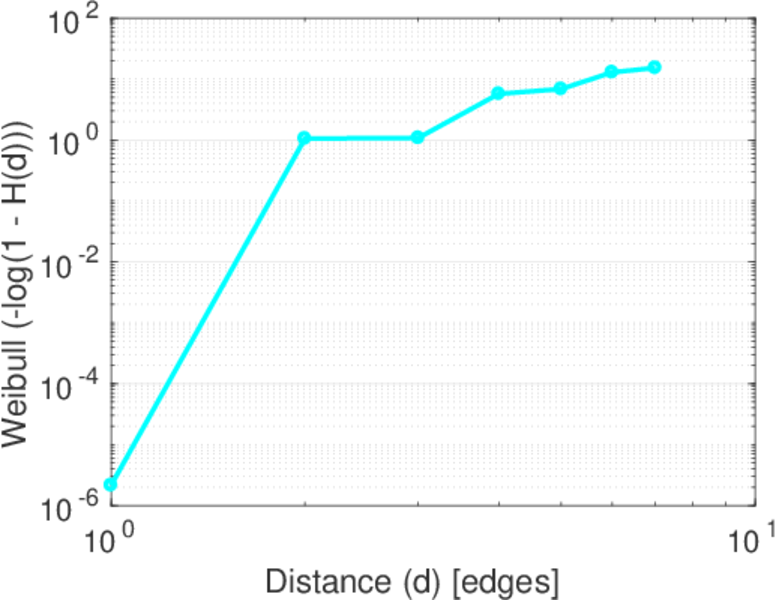
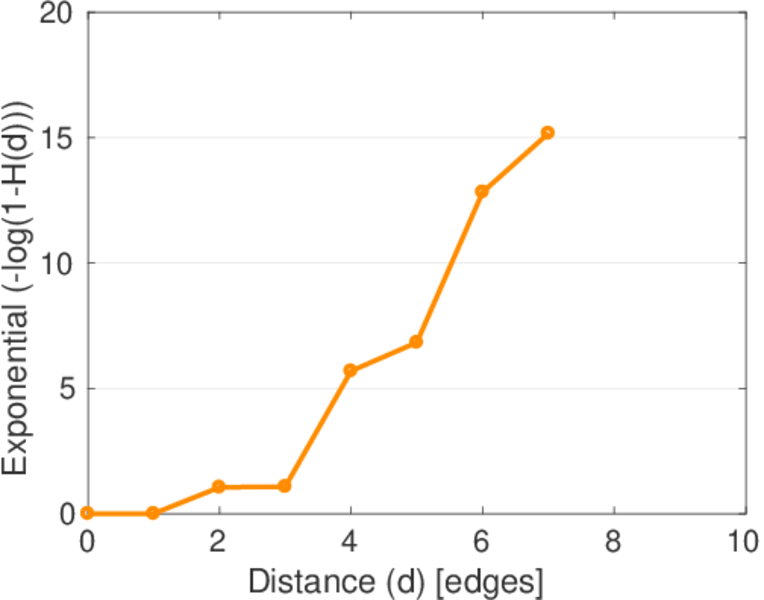
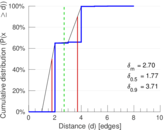
| Diameter | δ = | 10
|
| 50-Percentile effective diameter | δ0.5 = | 1.769 76
|
| 90-Percentile effective diameter | δ0.9 = | 3.714 03
|
| Median distance | δM = | 2
|
| Mean distance | δm = | 2.696 13
|
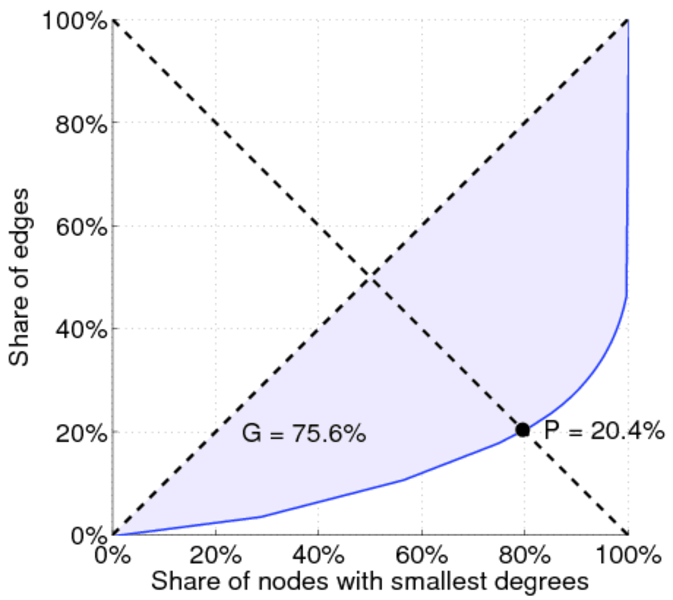
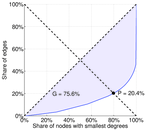
| Gini coefficient | G = | 0.729 354
|
| Balanced inequality ratio | P = | 0.226 426
|
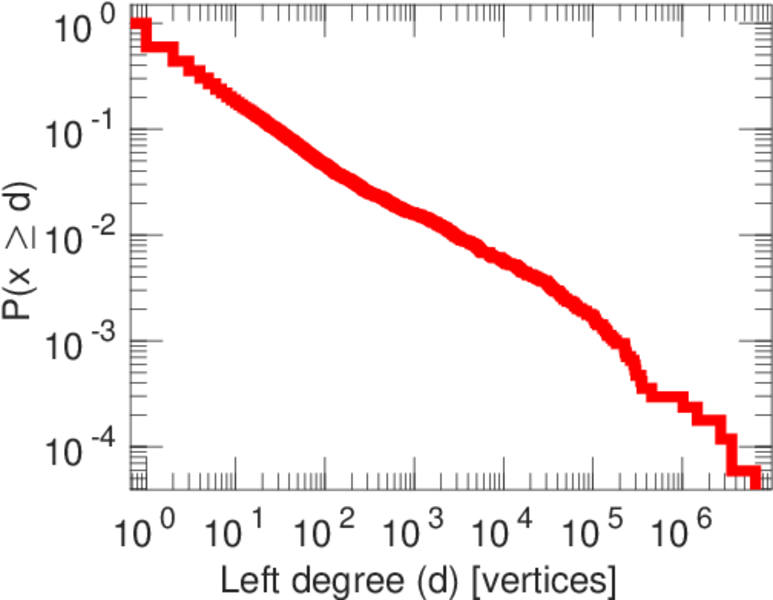
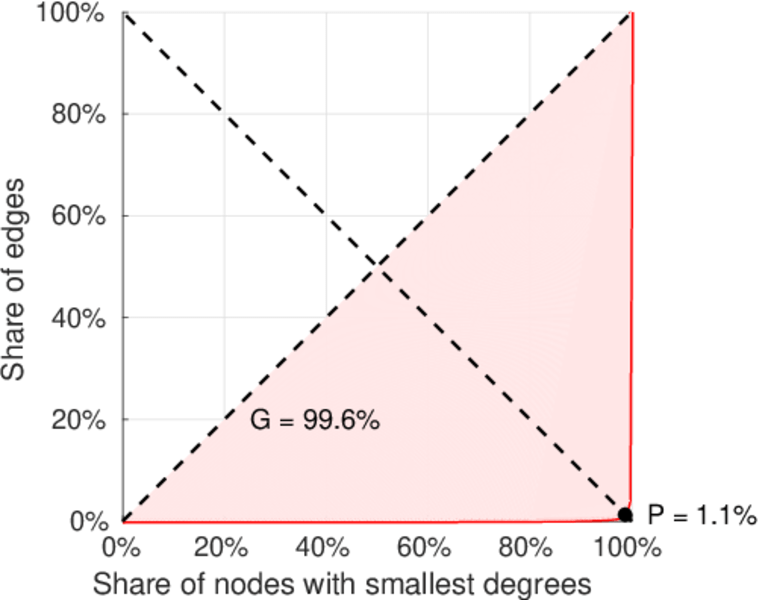
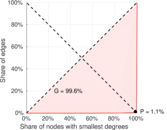
| Left balanced inequality ratio | P1 = | 0.011 498 8
|
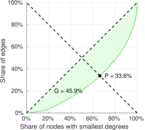
| Right balanced inequality ratio | P2 = | 0.335 824
|
| Relative edge distribution entropy | Her = | 0.650 120
|
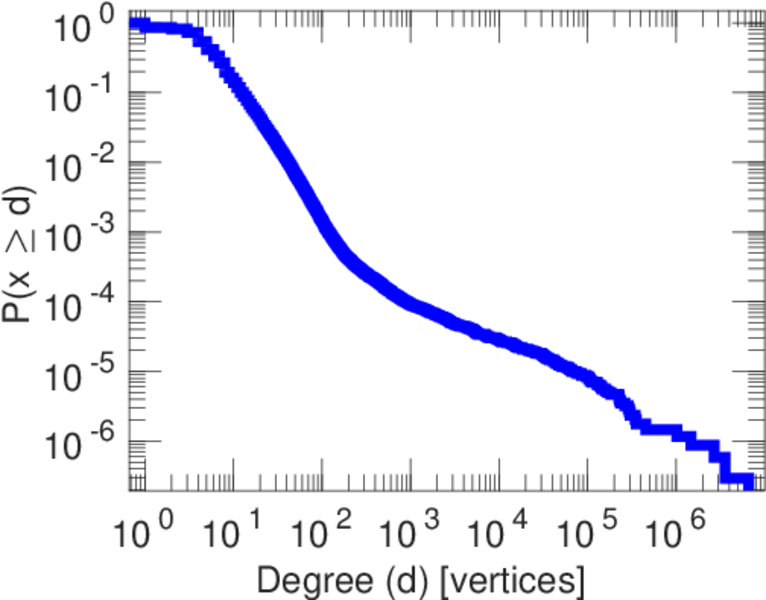
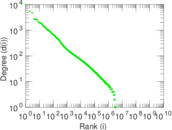
| Power law exponent | γ = | 1.885 13
|
| Tail power law exponent | γt = | 3.441 00
|
| Degree assortativity | ρ = | −0.296 311
|
| Degree assortativity p-value | pρ = | 0.000 00
|
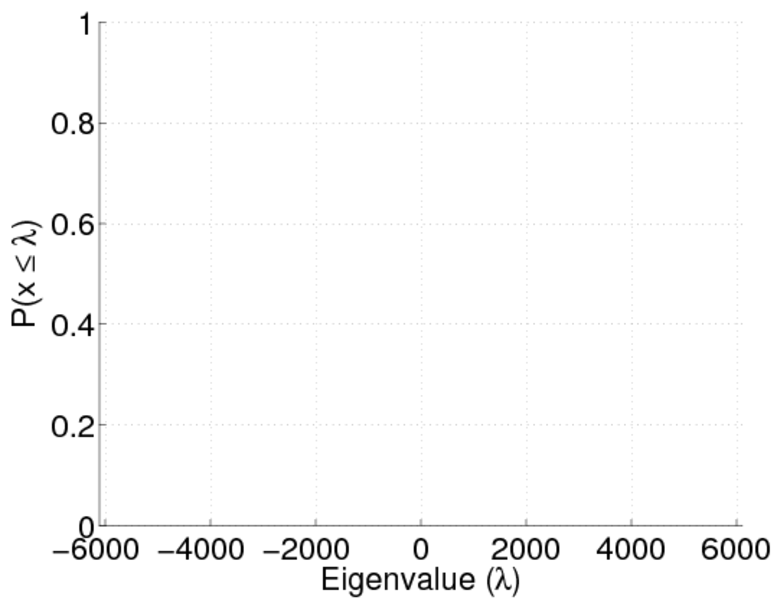
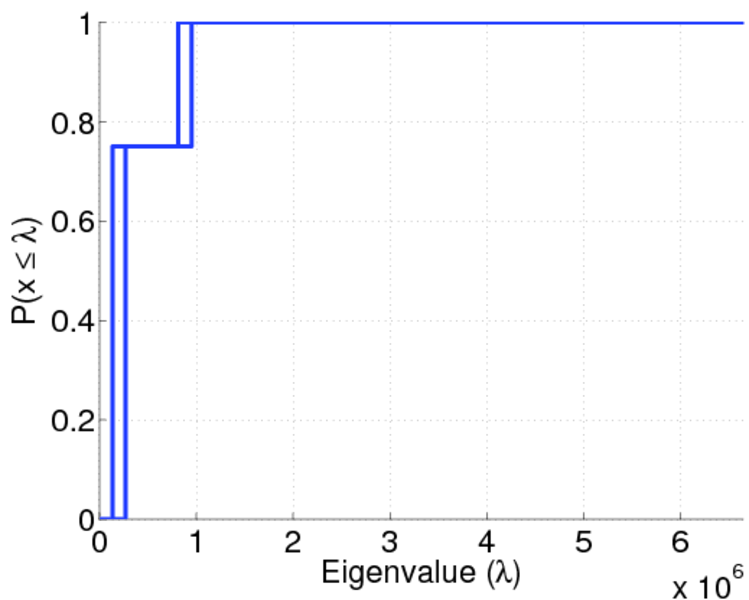
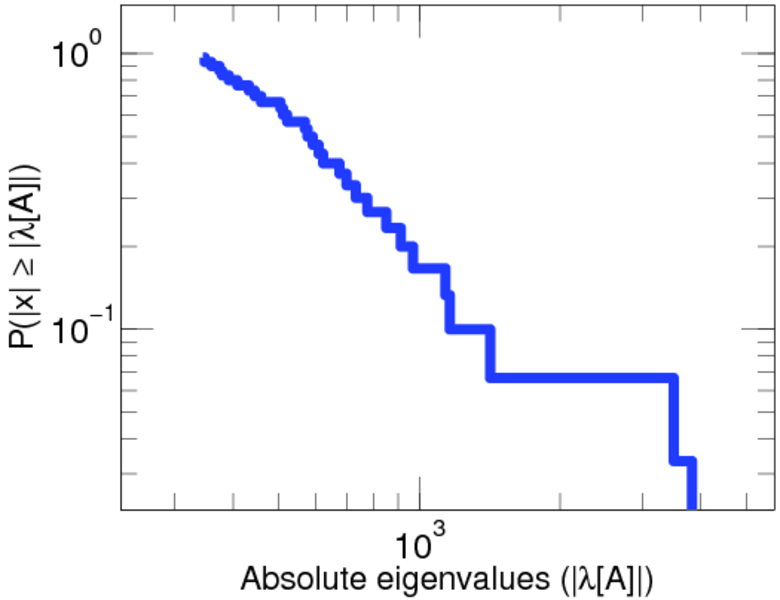
| Spectral norm | α = | 6,116.41
|
| Algebraic connectivity | a = | 0.012 448 8
|
| Spectral separation | |λ1[A] / λ2[A]| = | 1.018 23
|
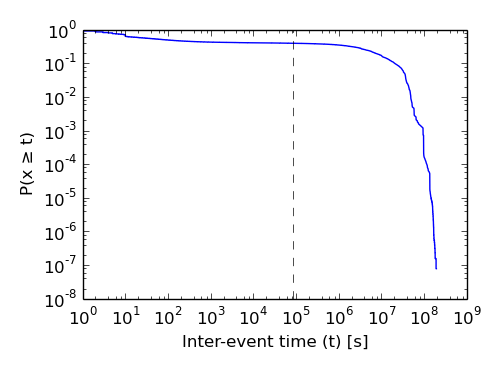
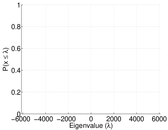
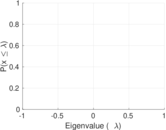
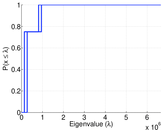
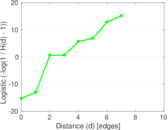
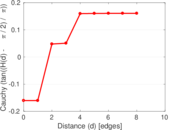
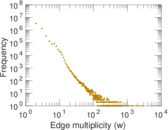
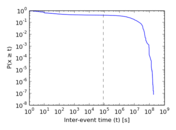
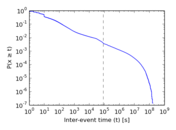
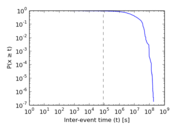
Plots


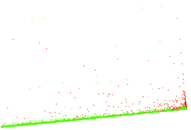
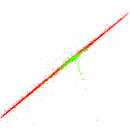


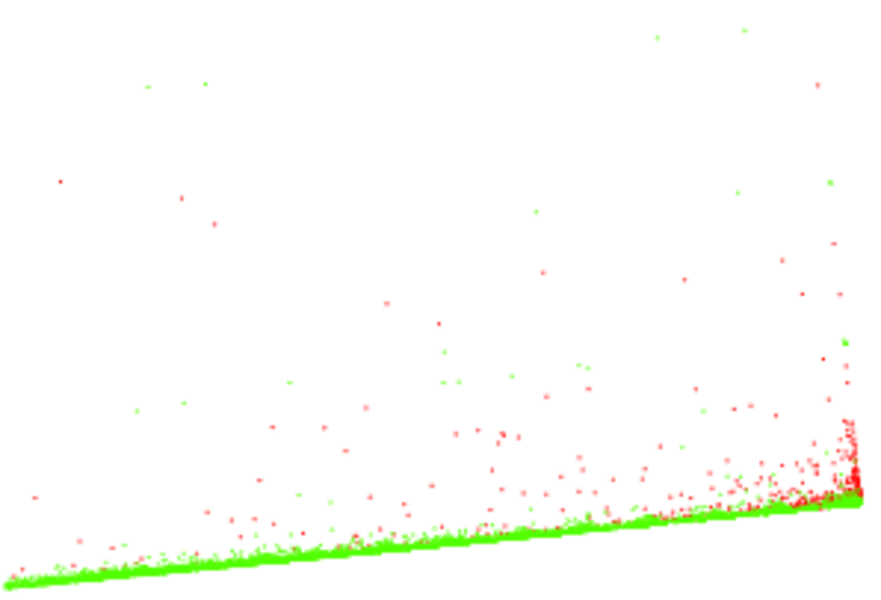
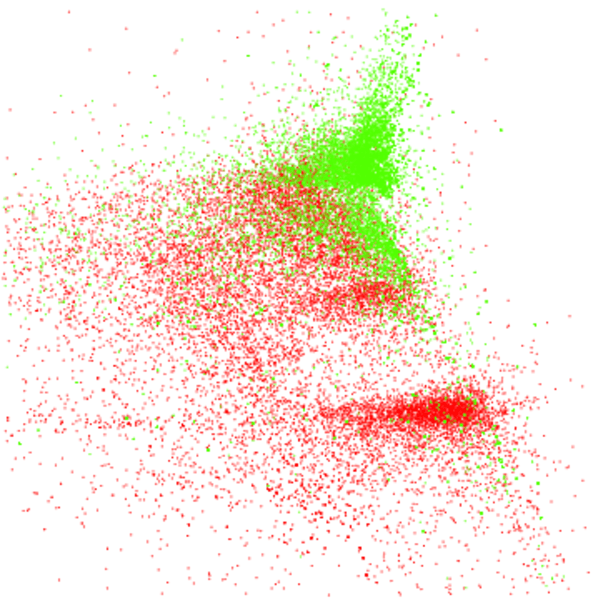
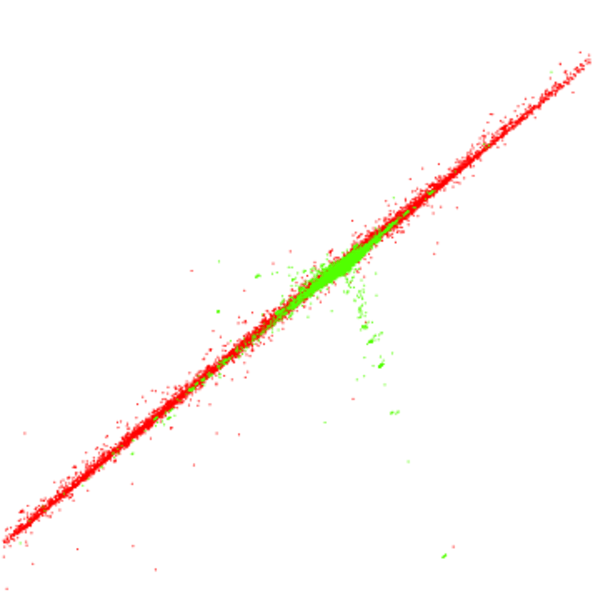
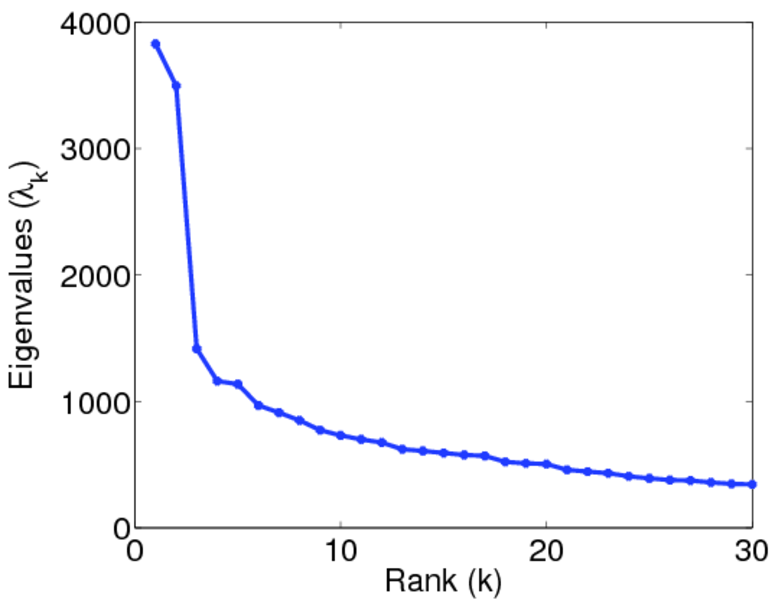
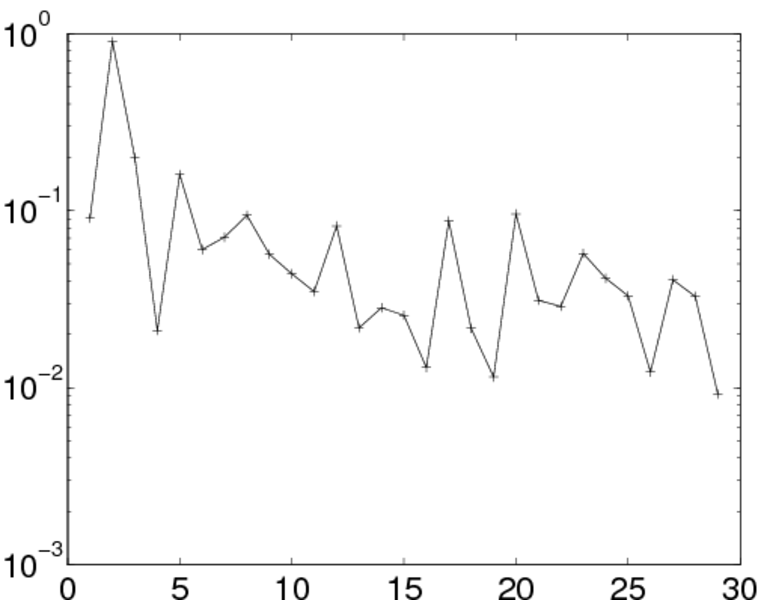
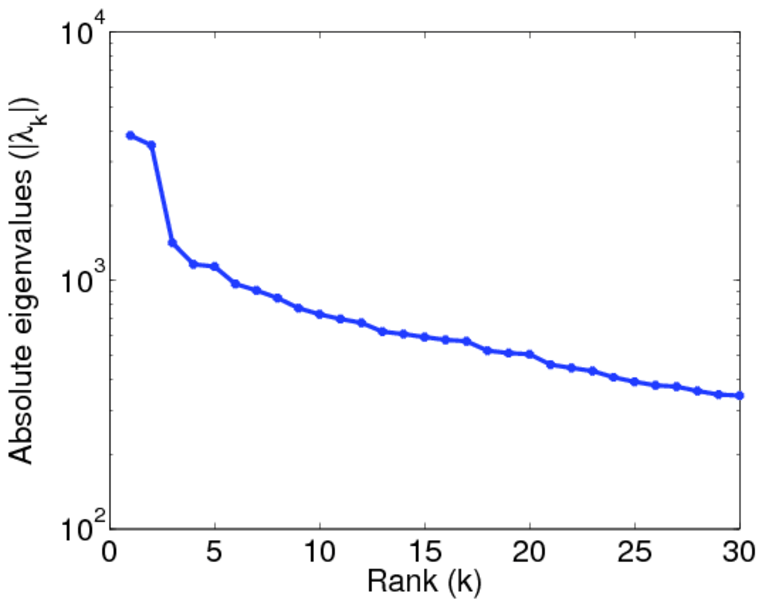
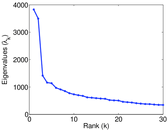
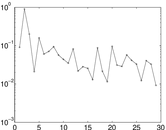
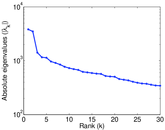
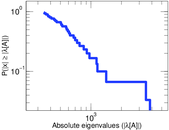
Matrix decompositions plots
Downloads
References
|
[1]
|
Jérôme Kunegis.
KONECT – The Koblenz Network Collection.
In Proc. Int. Conf. on World Wide Web Companion, pages
1343–1350, 2013.
[ http ]
|
|
[2]
|
Wikimedia Foundation.
Wikimedia downloads.
http://dumps.wikimedia.org/, January 2010.
|
 KONECT ‣ Networks ‣
Buy Me a Coffee
KONECT ‣ Networks ‣
Buy Me a Coffee