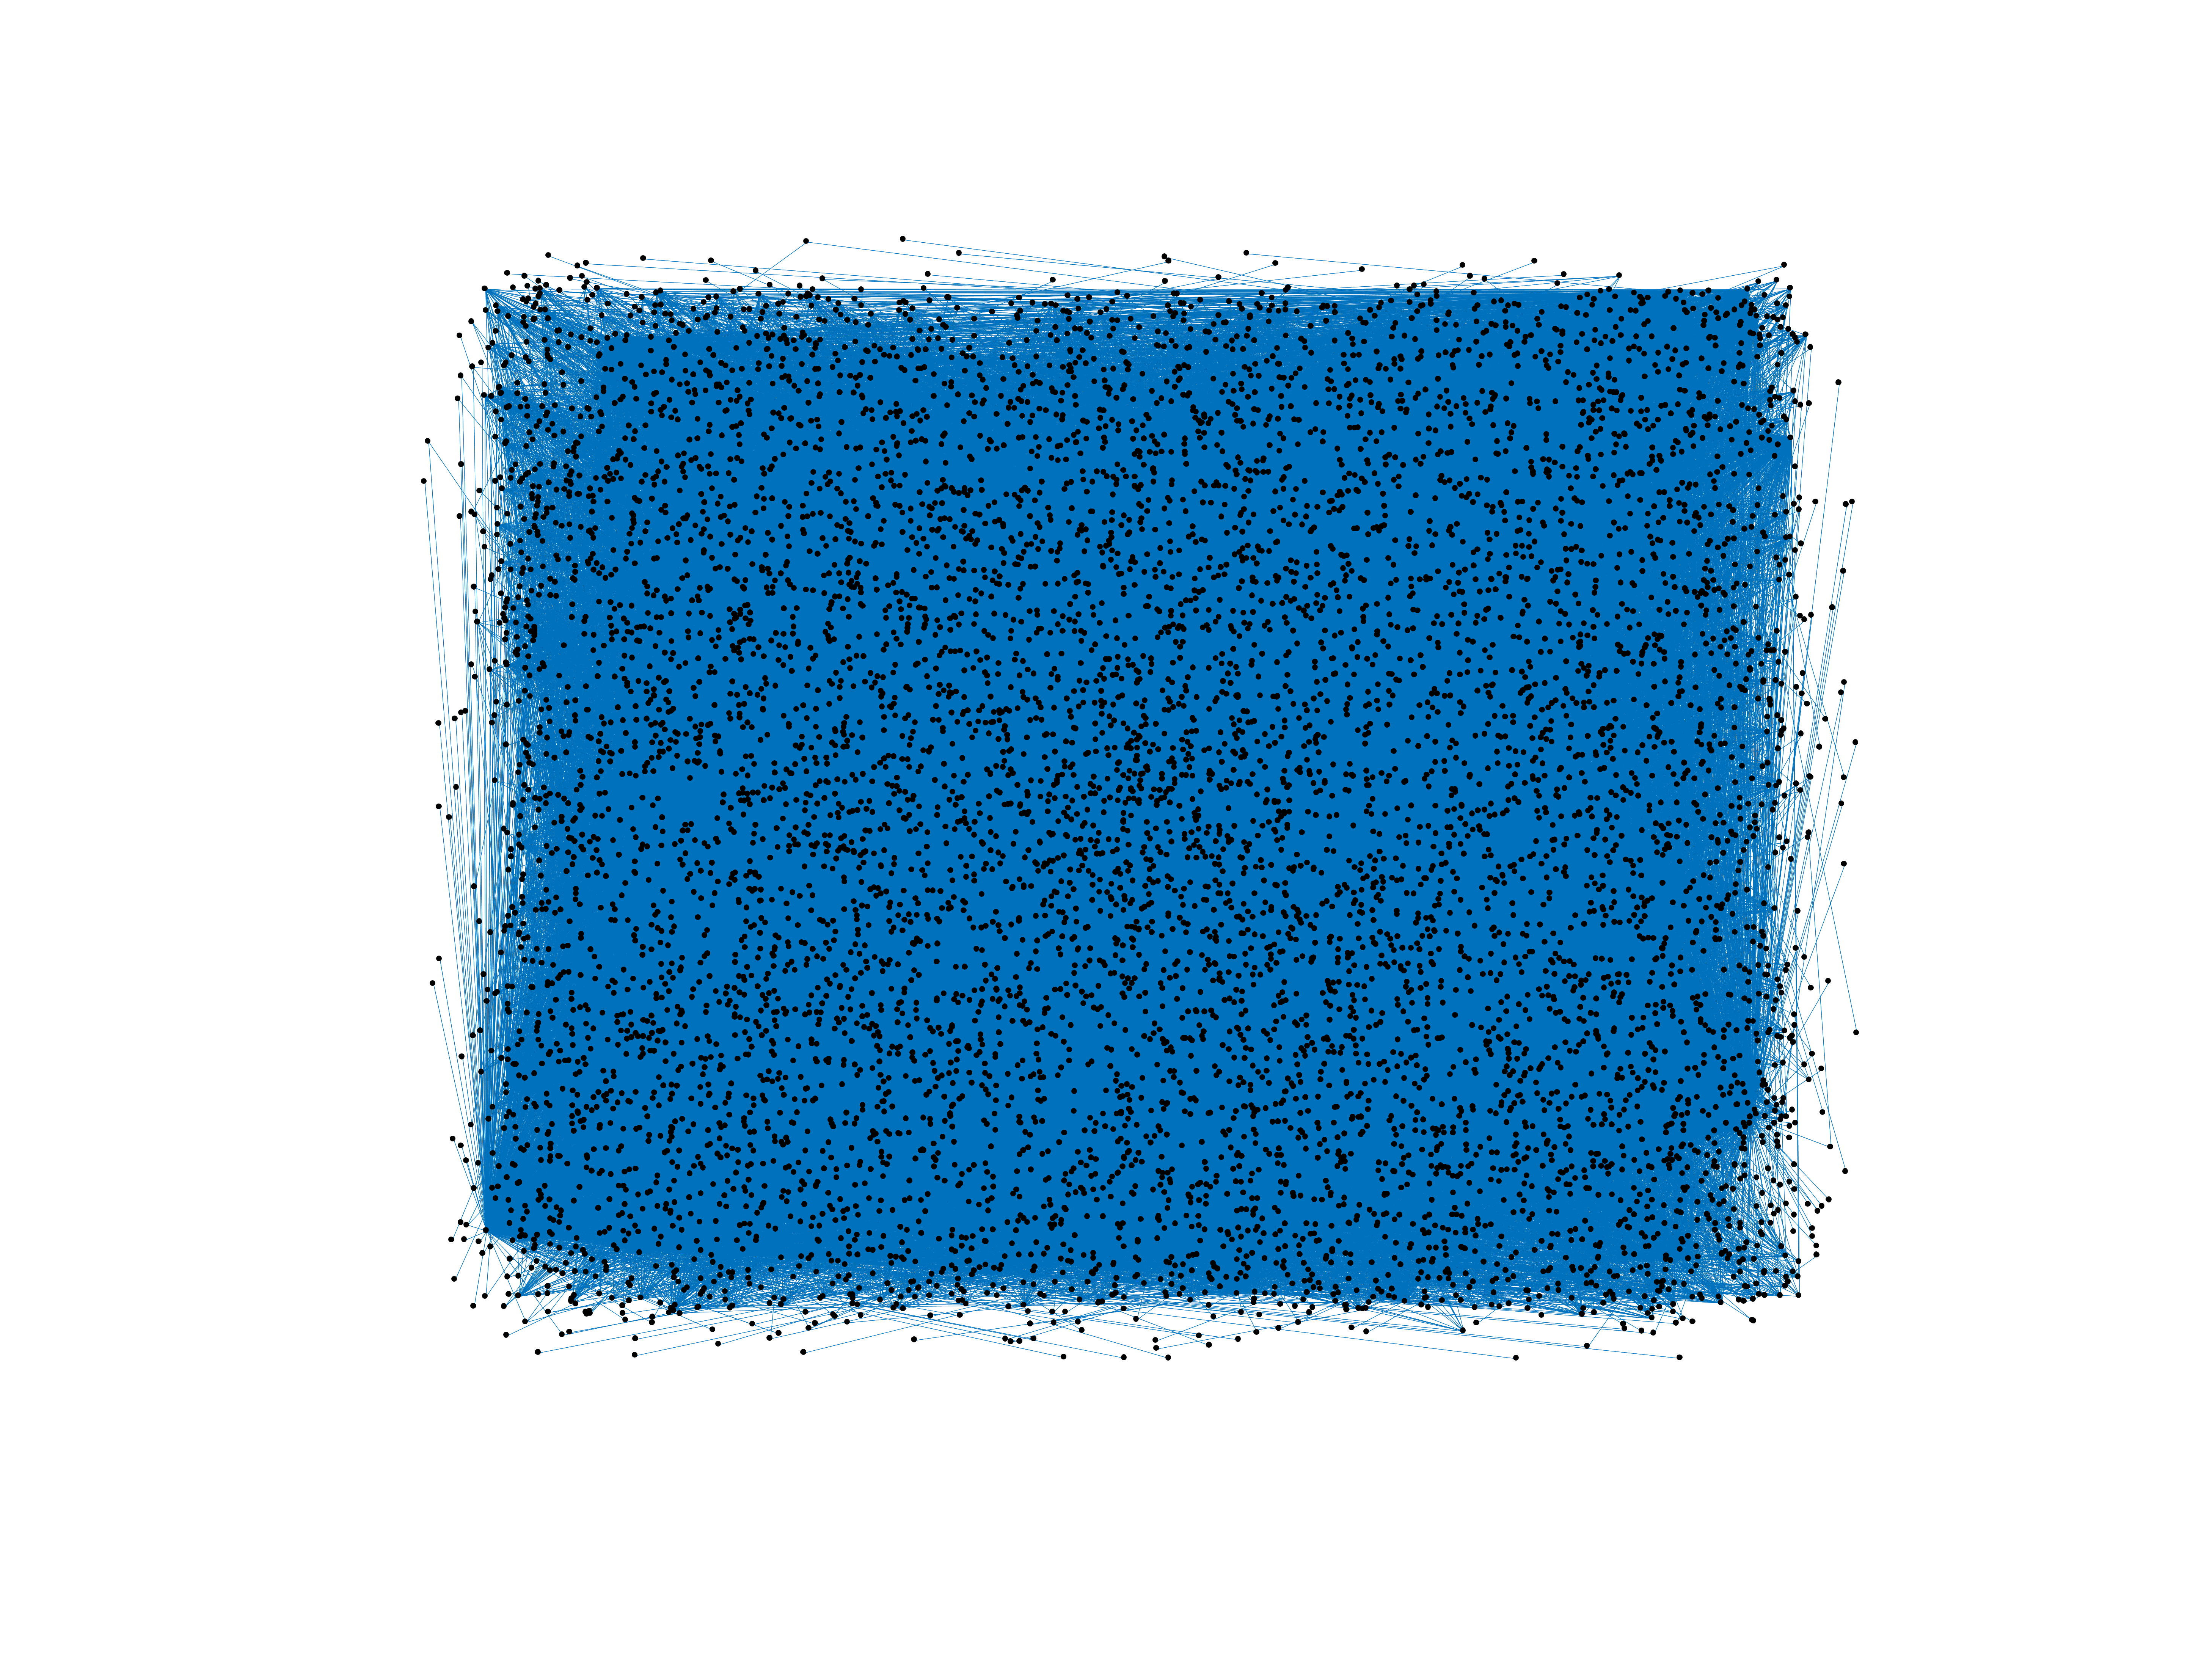
Wikipedia edits (fur)
This is the bipartite edit network of the Friulian Wikipedia. It contains users
and pages from the Friulian Wikipedia, connected by edit events. Each edge
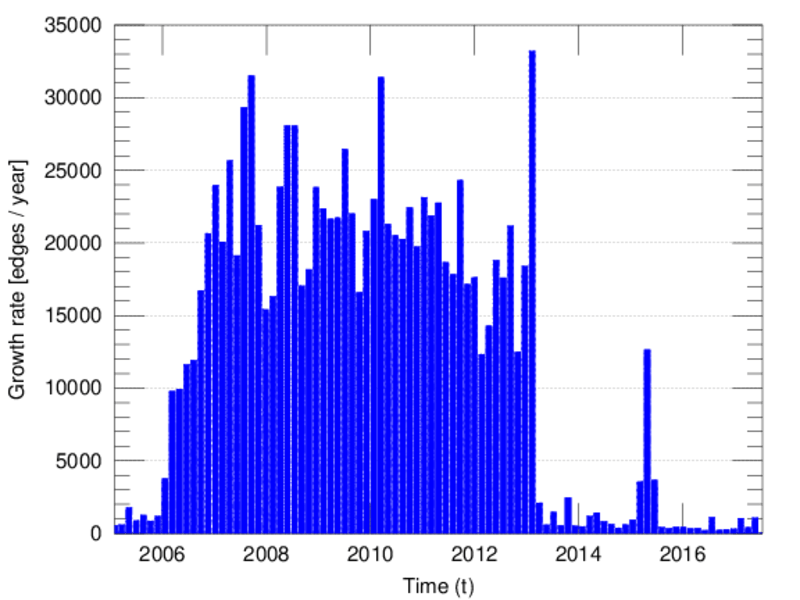
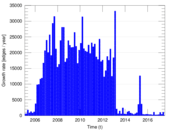
represents an edit. The dataset includes the timestamp of each edit.
Metadata
Statistics
| Size | n = | 8,444
|
| Left size | n1 = | 1,206
|
| Right size | n2 = | 7,238
|
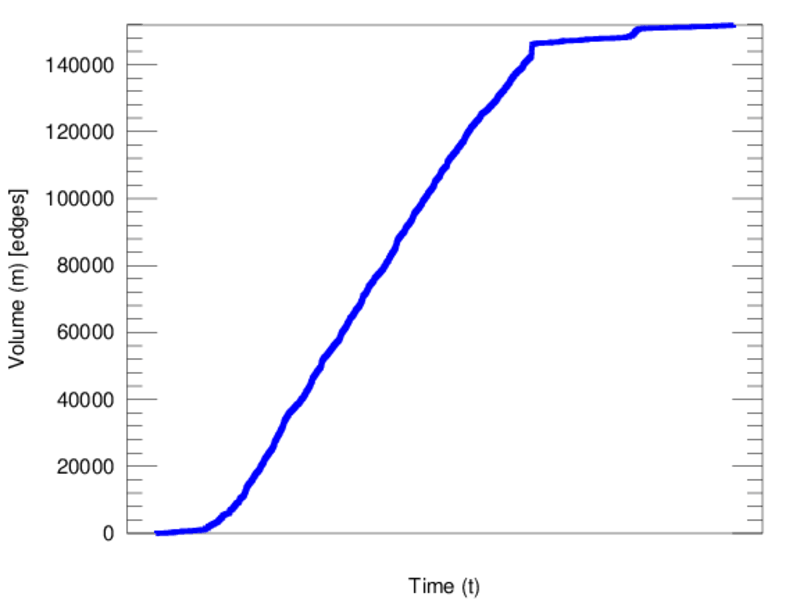
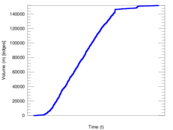
| Volume | m = | 151,824
|
| Unique edge count | m̿ = | 65,789
|
| Wedge count | s = | 38,294,691
|
| Claw count | z = | 21,243,227,912
|
| Cross count | x = | 10,364,466,438,777
|
| Square count | q = | 197,795,462
|
| 4-Tour count | T4 = | 1,735,719,686
|
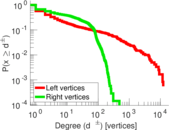
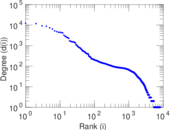
| Maximum degree | dmax = | 12,320
|
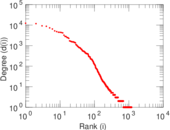
| Maximum left degree | d1max = | 12,320
|
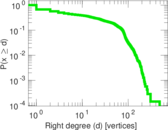
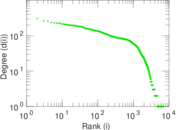
| Maximum right degree | d2max = | 484
|
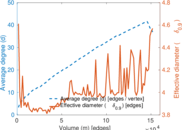
| Average degree | d = | 35.960 2
|
| Average left degree | d1 = | 125.891
|
| Average right degree | d2 = | 20.976 0
|
| Fill | p = | 0.007 536 81
|
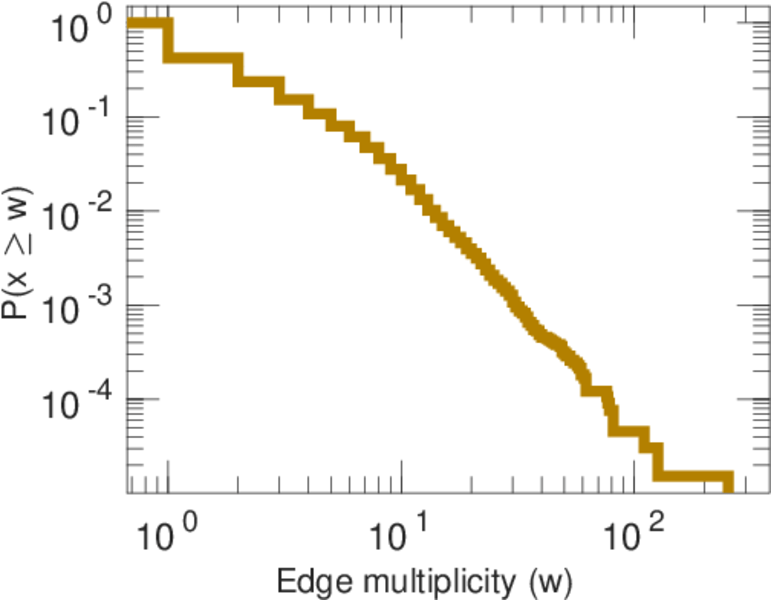
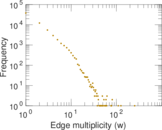
| Average edge multiplicity | m̃ = | 2.307 74
|
| Size of LCC | N = | 7,616
|
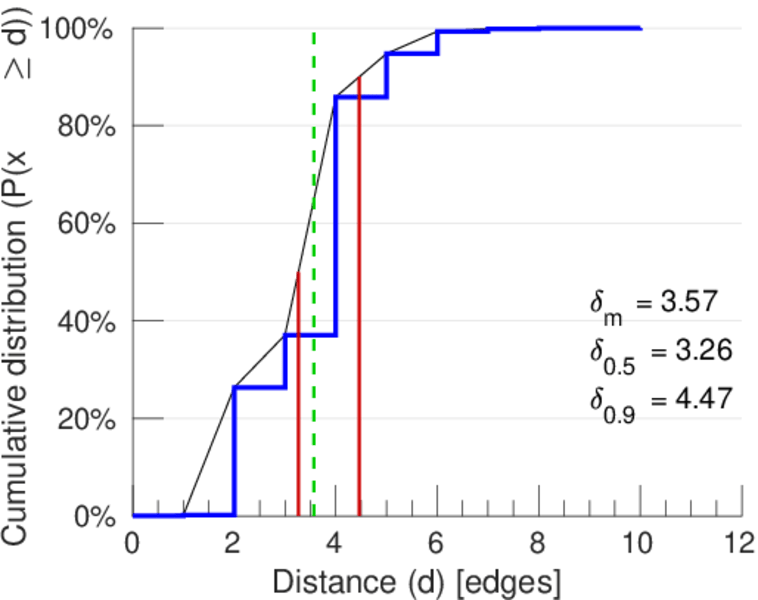
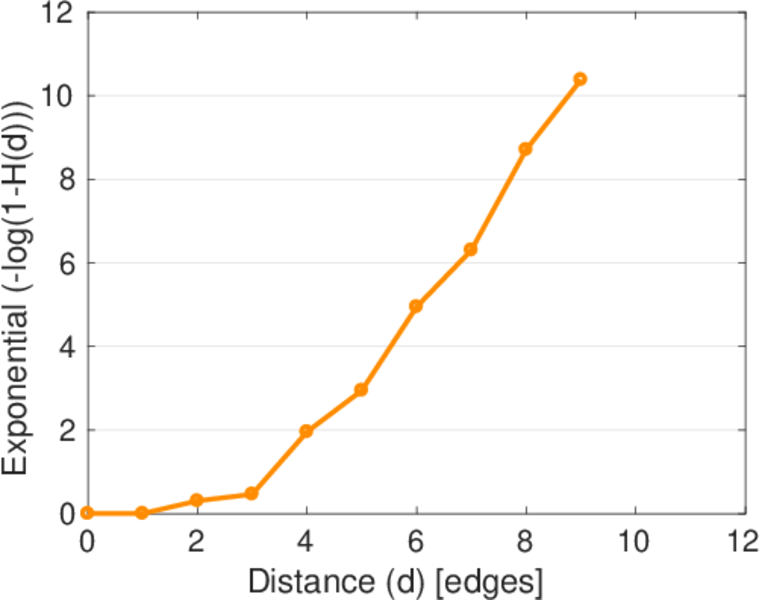
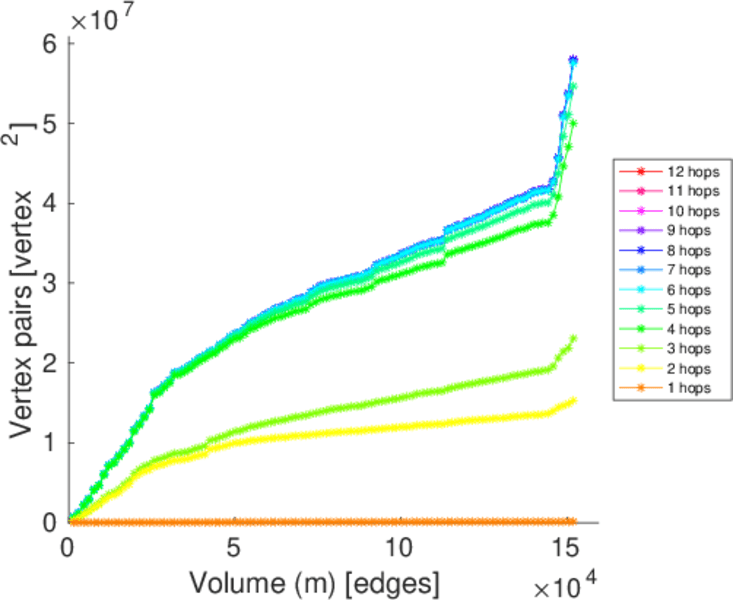
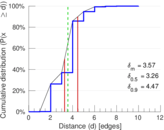
| Diameter | δ = | 11
|
| 50-Percentile effective diameter | δ0.5 = | 3.264 86
|
| 90-Percentile effective diameter | δ0.9 = | 4.465 17
|
| Median distance | δM = | 4
|
| Mean distance | δm = | 3.566 62
|
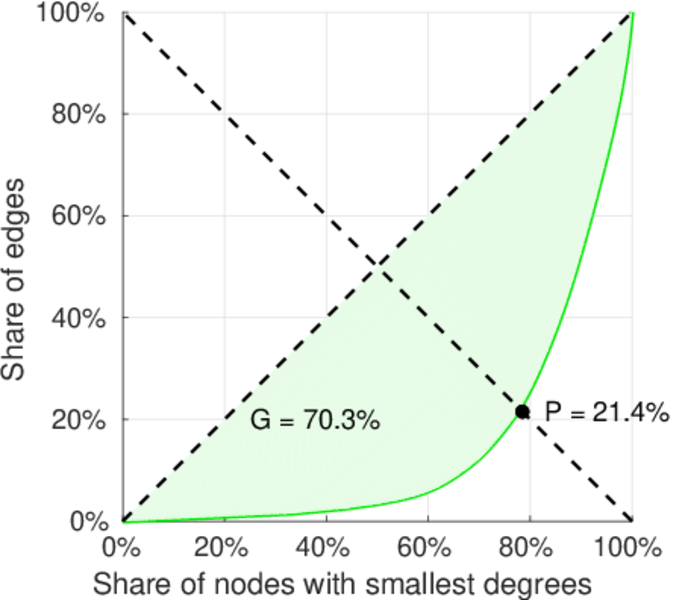
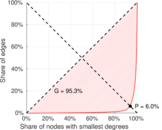
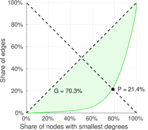
| Gini coefficient | G = | 0.829 477
|
| Balanced inequality ratio | P = | 0.172 588
|
| Left balanced inequality ratio | P1 = | 0.059 516 3
|
| Right balanced inequality ratio | P2 = | 0.213 827
|
| Relative edge distribution entropy | Her = | 0.781 305
|
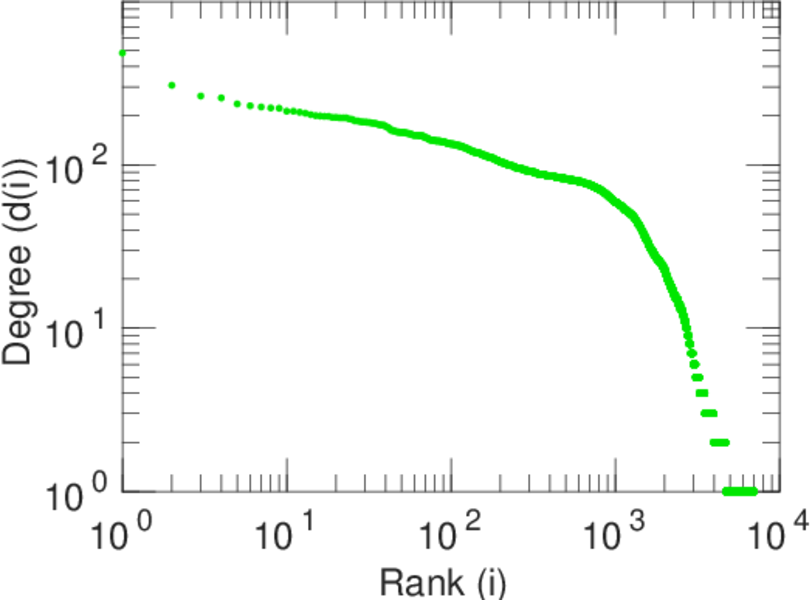
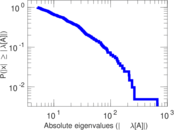
| Power law exponent | γ = | 1.786 36
|
| Tail power law exponent | γt = | 1.571 00
|
| Tail power law exponent with p | γ3 = | 1.571 00
|
| p-value | p = | 0.000 00
|
| Left tail power law exponent with p | γ3,1 = | 1.651 00
|
| Left p-value | p1 = | 0.000 00
|
| Right tail power law exponent with p | γ3,2 = | 8.911 00
|
| Right p-value | p2 = | 0.750 000
|
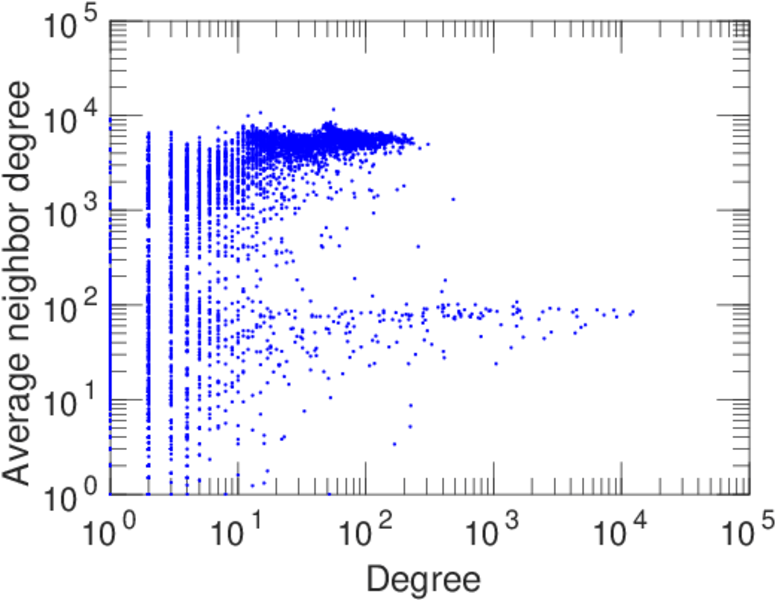
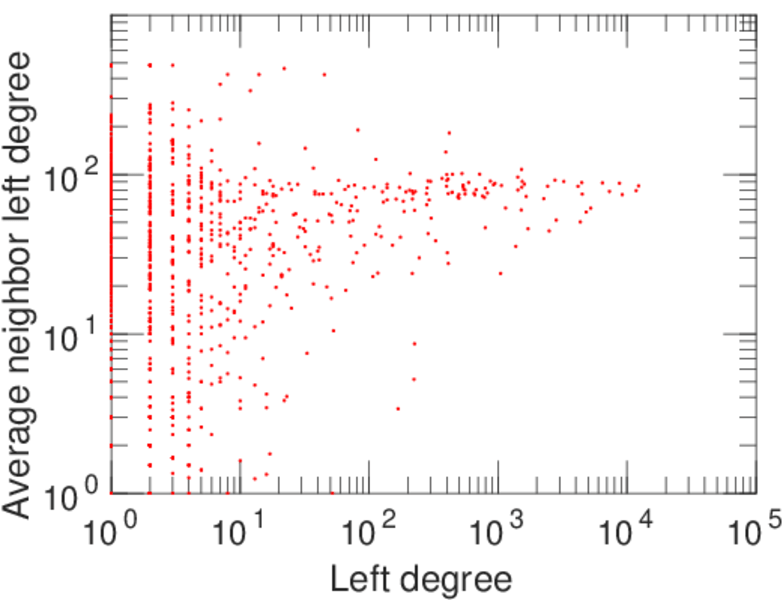
| Degree assortativity | ρ = | −0.068 334 0
|
| Degree assortativity p-value | pρ = | 6.225 77 × 10−69
|
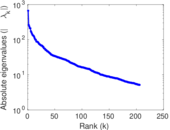
| Spectral norm | α = | 666.808
|
| Algebraic connectivity | a = | 0.069 226 4
|
| Spectral separation | |λ1[A] / λ2[A]| = | 2.539 85
|
| Controllability | C = | 6,010
|
| Relative controllability | Cr = | 0.731 321
|
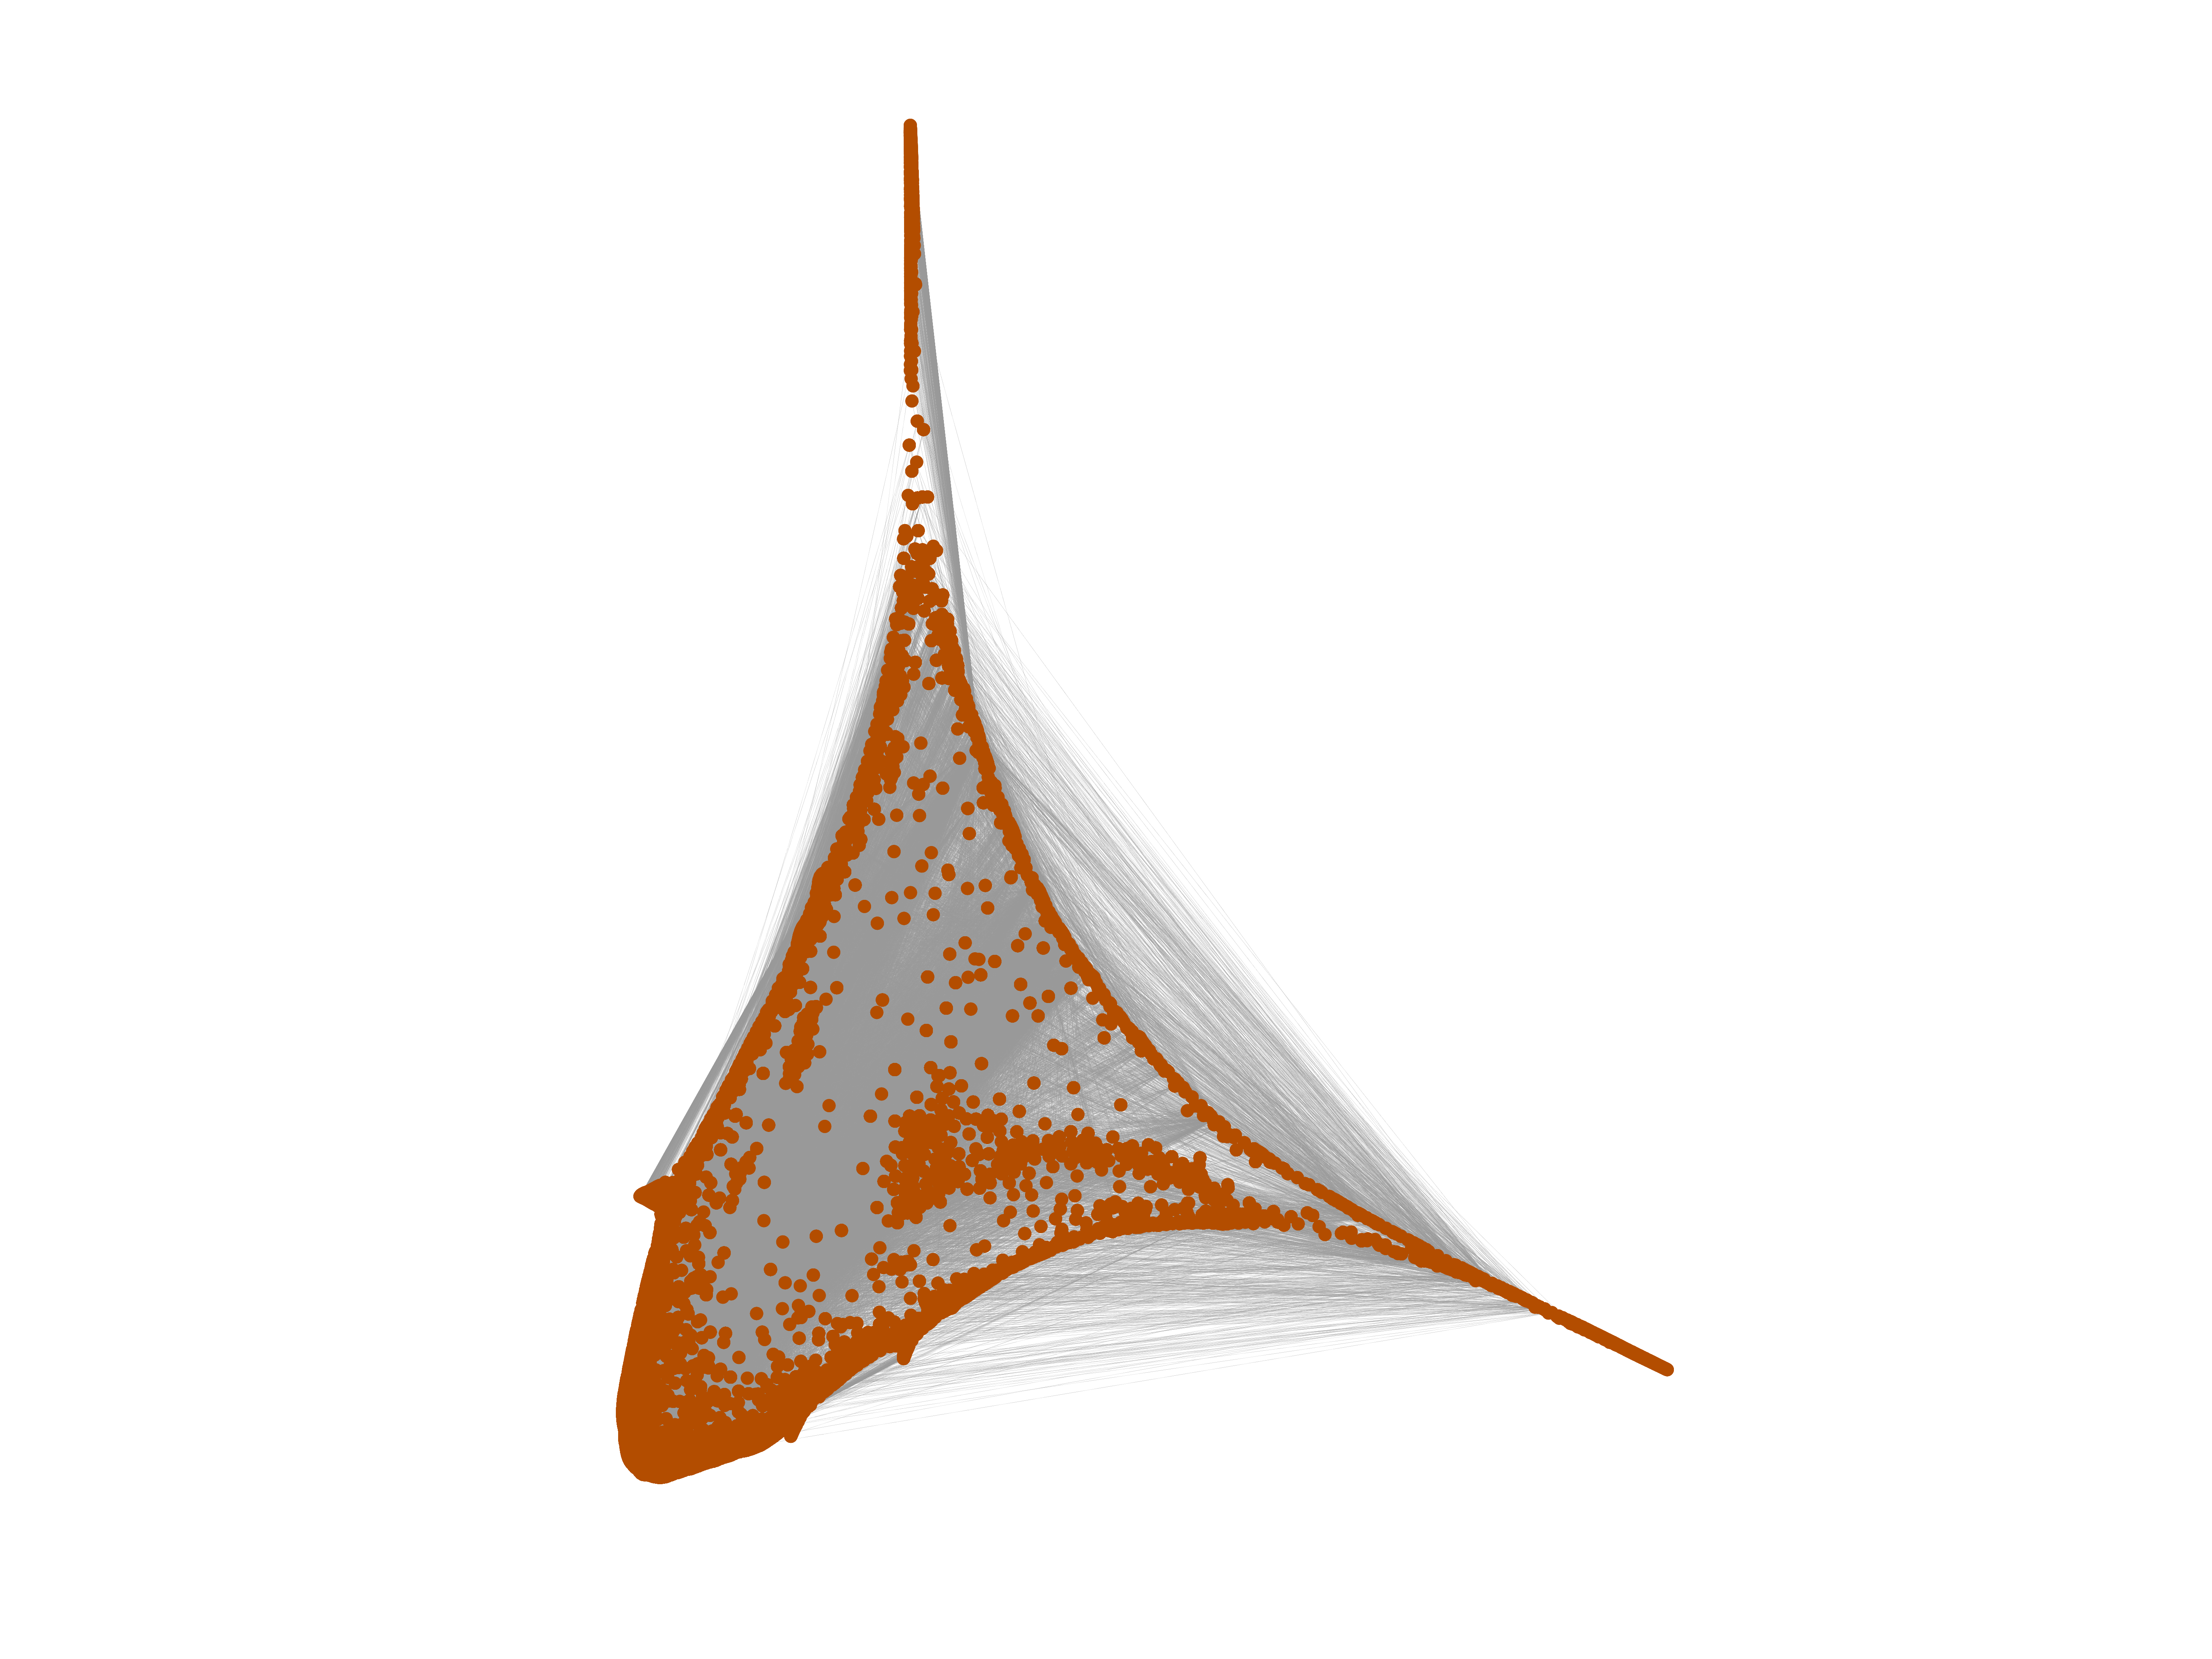
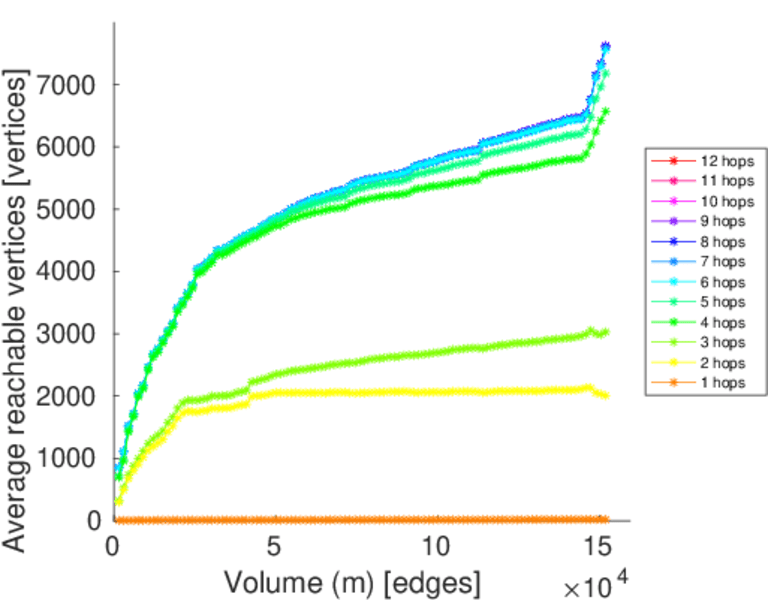
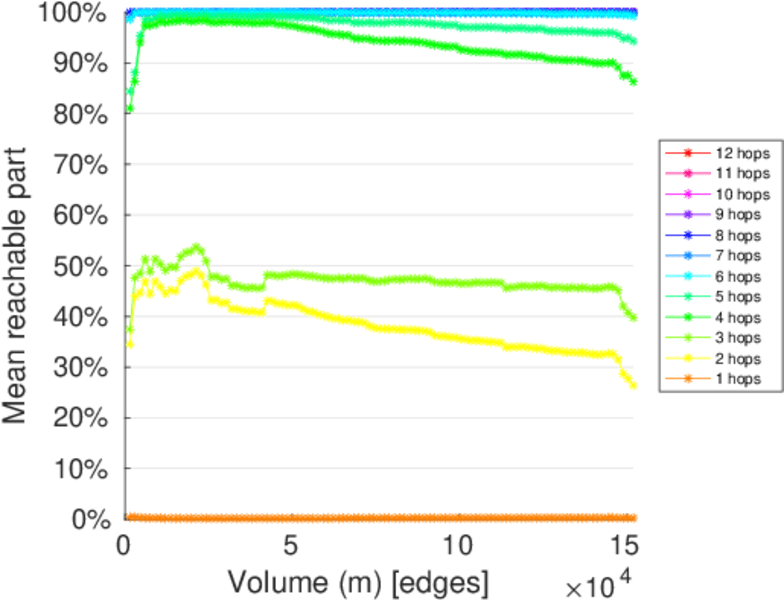
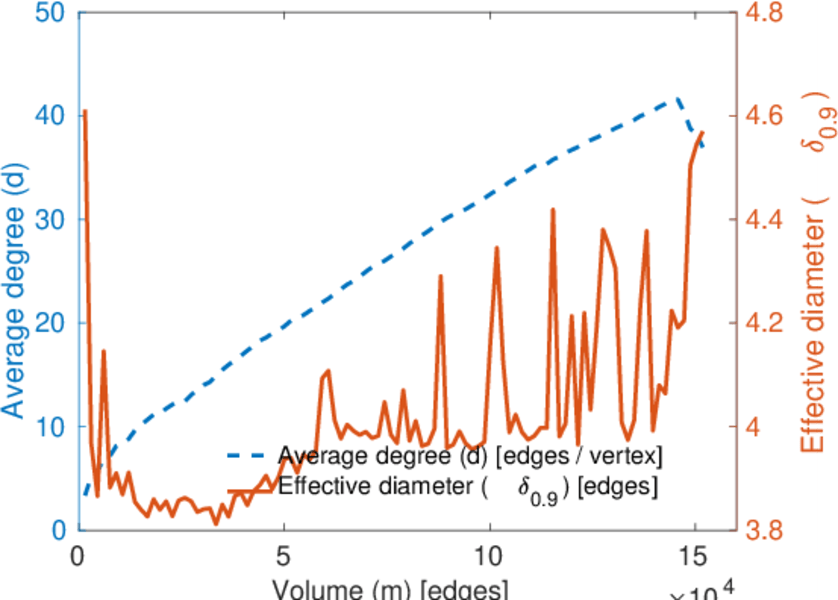
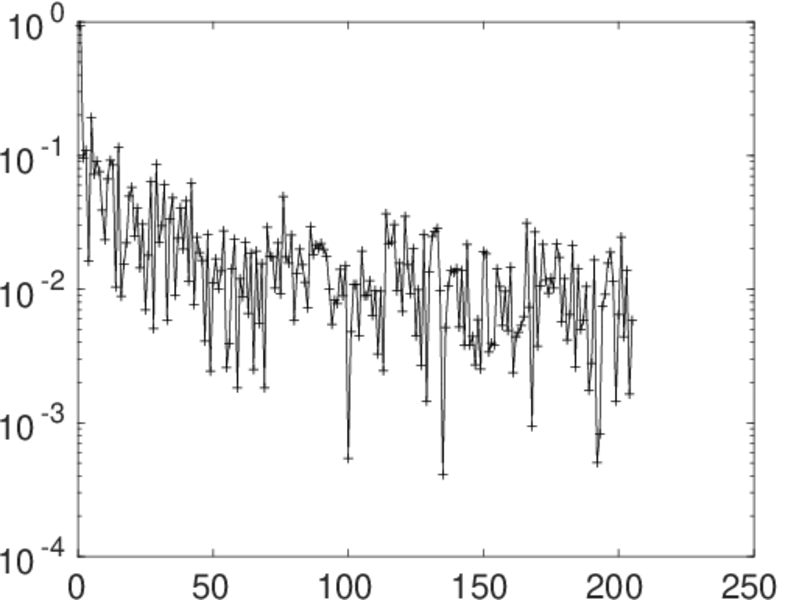
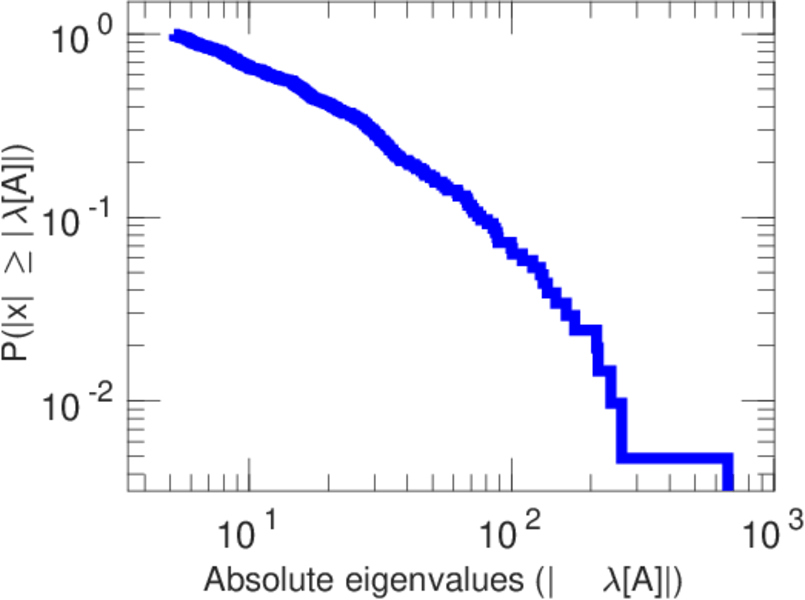
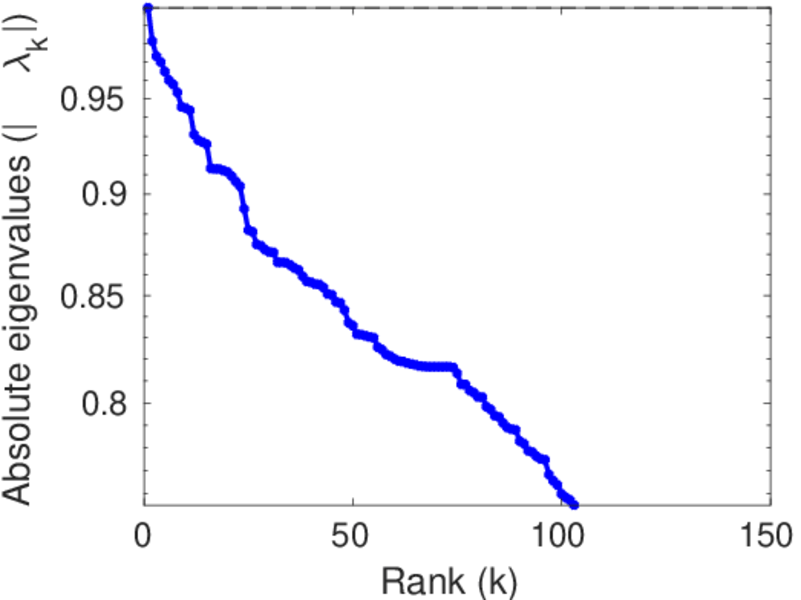
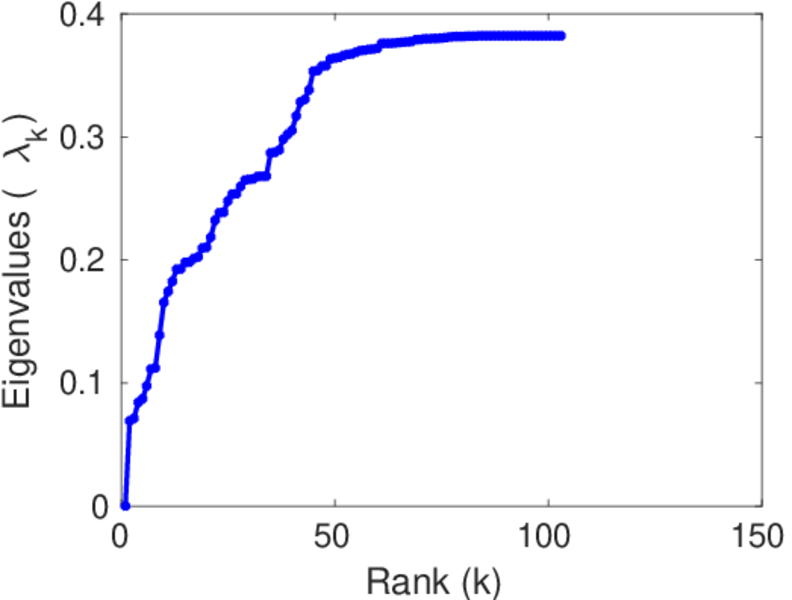
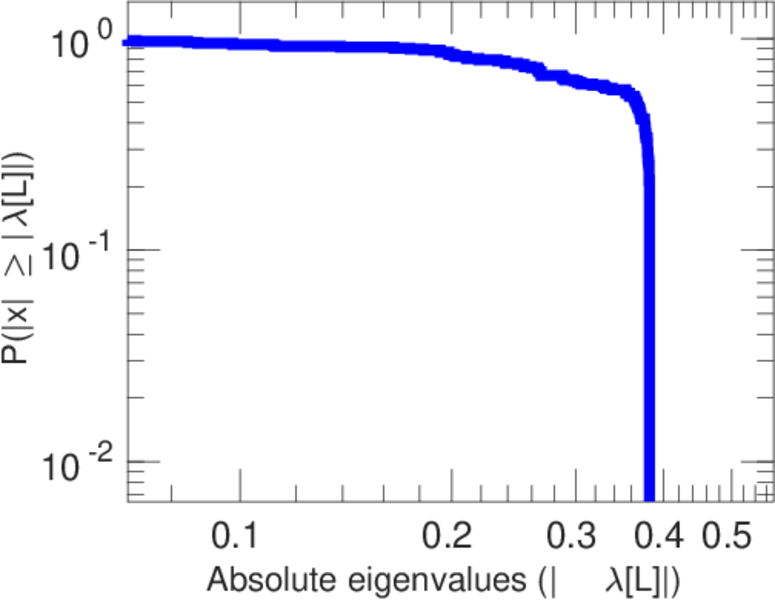
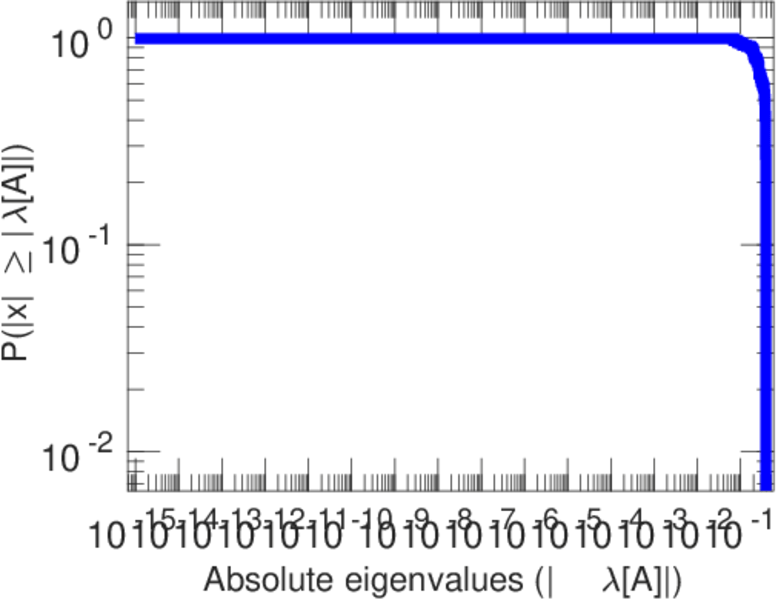
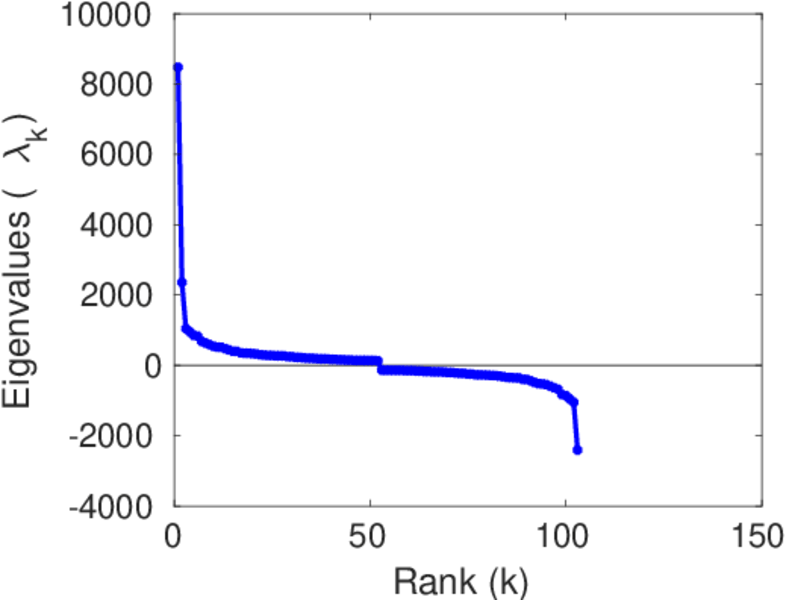
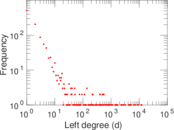
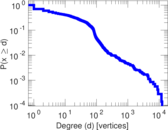
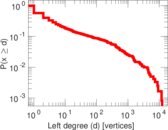
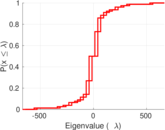
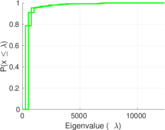
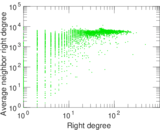
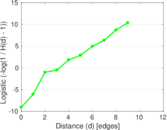
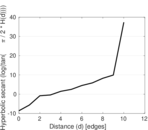
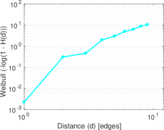
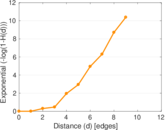
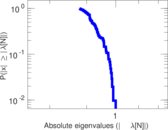
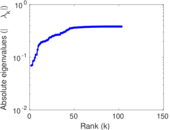
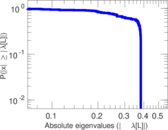
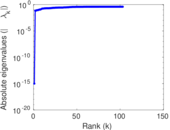
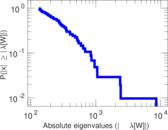
Plots


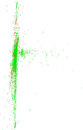


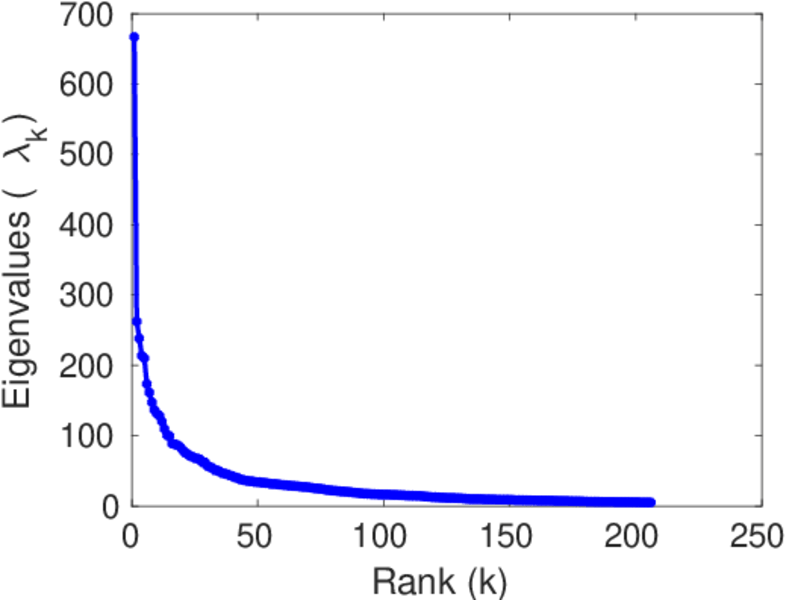
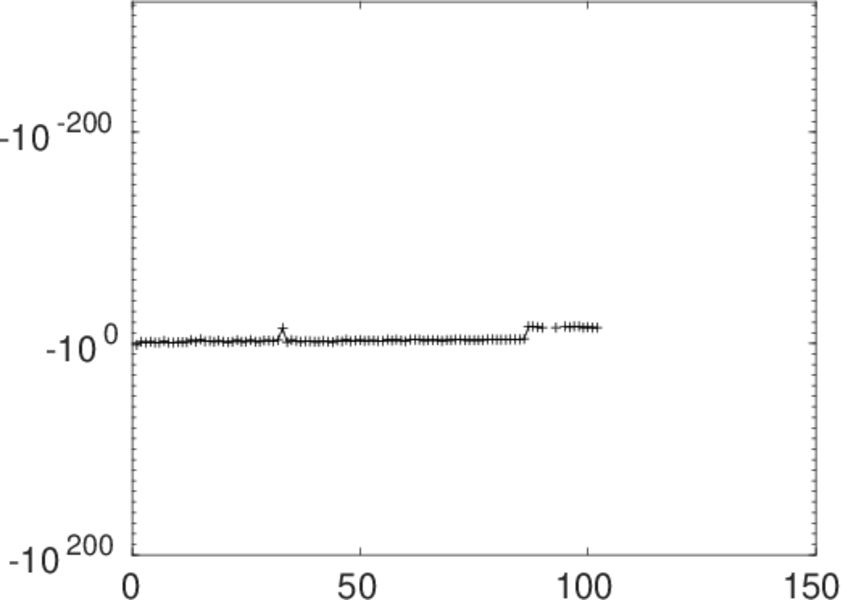
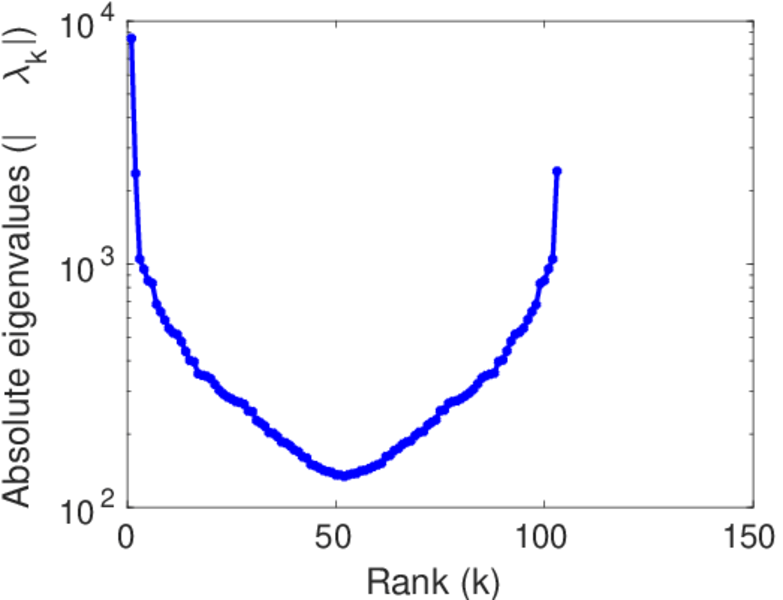
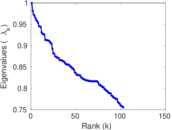
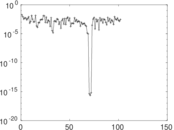
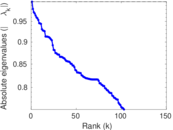
Matrix decompositions plots


Downloads
References
|
[1]
|
Jérôme Kunegis.
KONECT – The Koblenz Network Collection.
In Proc. Int. Conf. on World Wide Web Companion, pages
1343–1350, 2013.
[ http ]
|
|
[2]
|
Wikimedia Foundation.
Wikimedia downloads.
http://dumps.wikimedia.org/, January 2010.
|
 KONECT ‣ Networks ‣
Buy Me a Coffee
KONECT ‣ Networks ‣
Buy Me a Coffee