Wikipedia edits (fy)
This is the bipartite edit network of the Western Frisian Wikipedia. It
contains users and pages from the Western Frisian Wikipedia, connected by edit
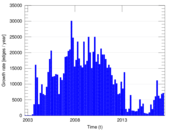
events. Each edge represents an edit. The dataset includes the timestamp of
each edit.
Metadata
Statistics
| Size | n = | 4,551
|
| Left size | n1 = | 1,041
|
| Right size | n2 = | 3,510
|
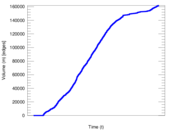
| Volume | m = | 161,936
|
| Unique edge count | m̿ = | 55,821
|
| Wedge count | s = | 25,945,514
|
| Claw count | z = | 10,483,037,798
|
| Cross count | x = | 3,847,537,848,418
|
| Square count | q = | 182,347,655
|
| 4-Tour count | T4 = | 1,562,731,962
|
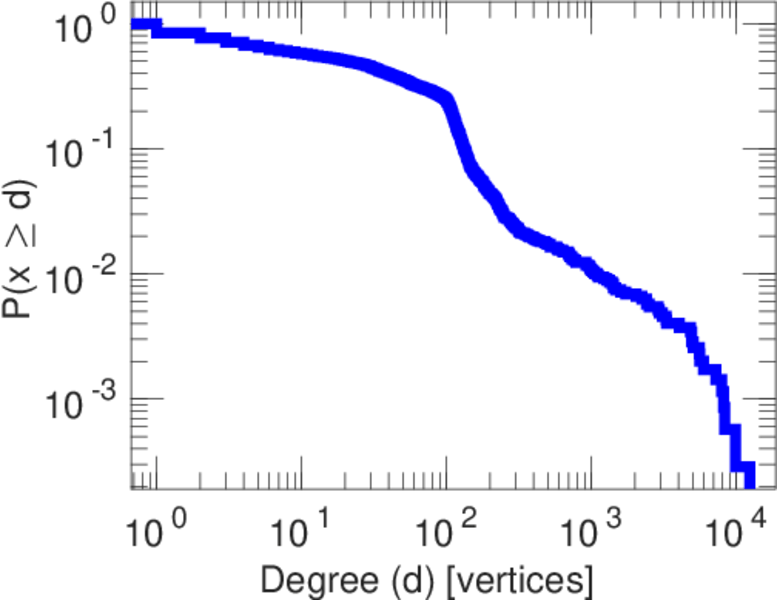
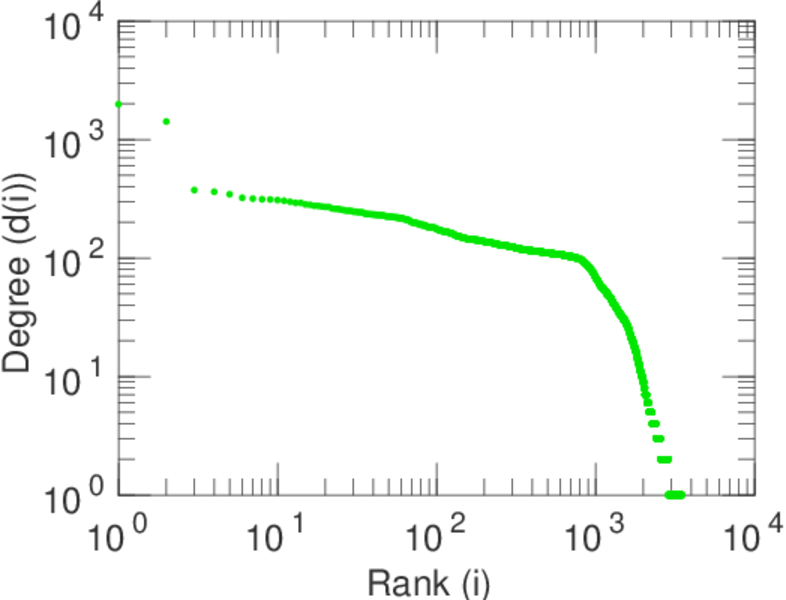
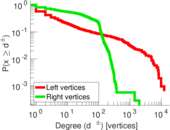
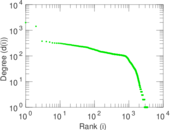
| Maximum degree | dmax = | 12,382
|
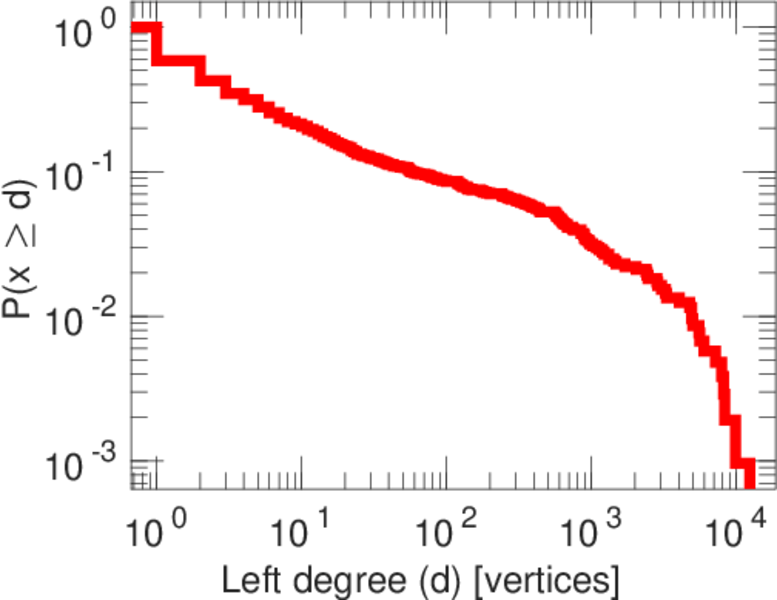
| Maximum left degree | d1max = | 12,382
|
| Maximum right degree | d2max = | 1,983
|
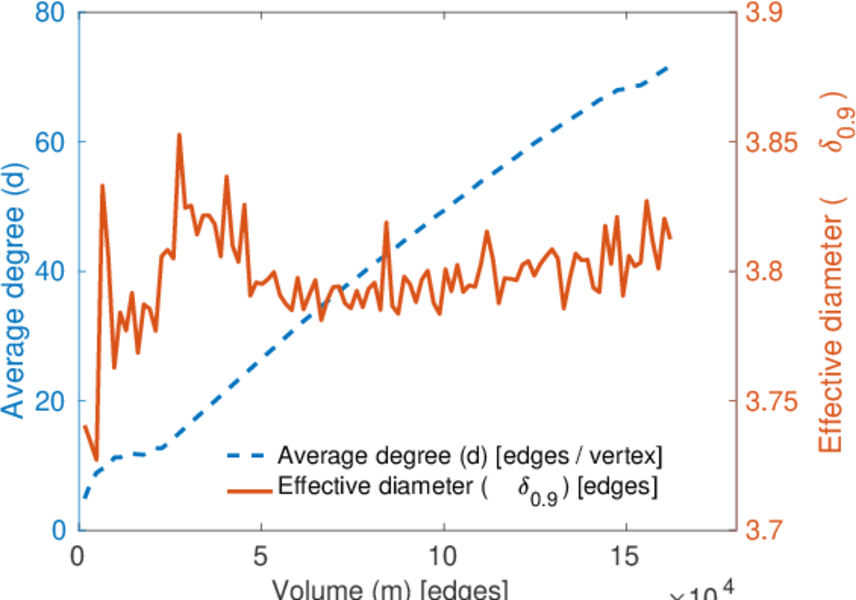
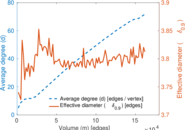
| Average degree | d = | 71.165 0
|
| Average left degree | d1 = | 155.558
|
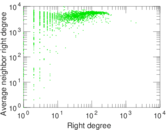
| Average right degree | d2 = | 46.135 6
|
| Fill | p = | 0.015 277 1
|
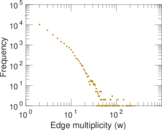
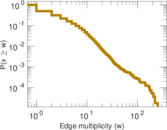
| Average edge multiplicity | m̃ = | 2.900 99
|
| Size of LCC | N = | 4,502
|
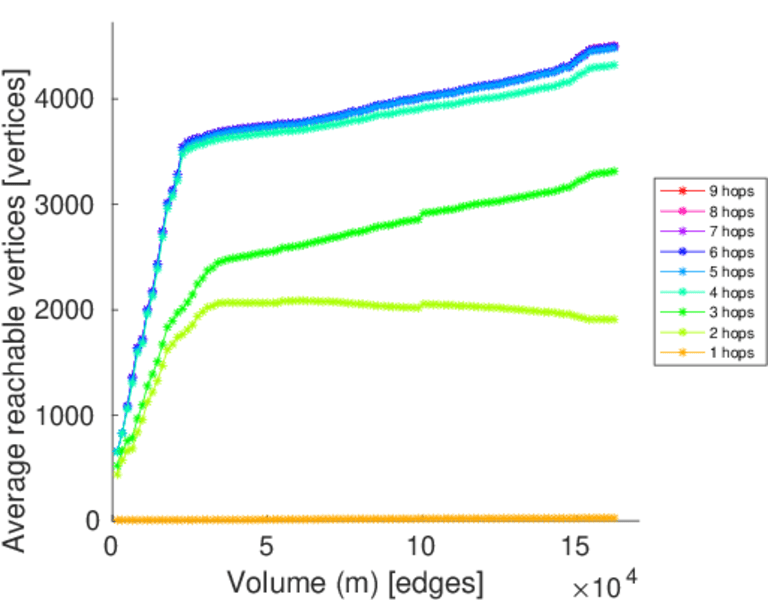
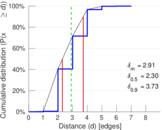
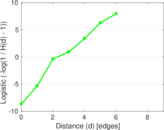
| Diameter | δ = | 9
|
| 50-Percentile effective diameter | δ0.5 = | 2.303 59
|
| 90-Percentile effective diameter | δ0.9 = | 3.731 65
|
| Median distance | δM = | 3
|
| Mean distance | δm = | 2.907 85
|
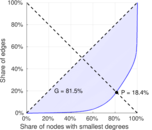
| Gini coefficient | G = | 0.788 820
|
| Balanced inequality ratio | P = | 0.206 270
|
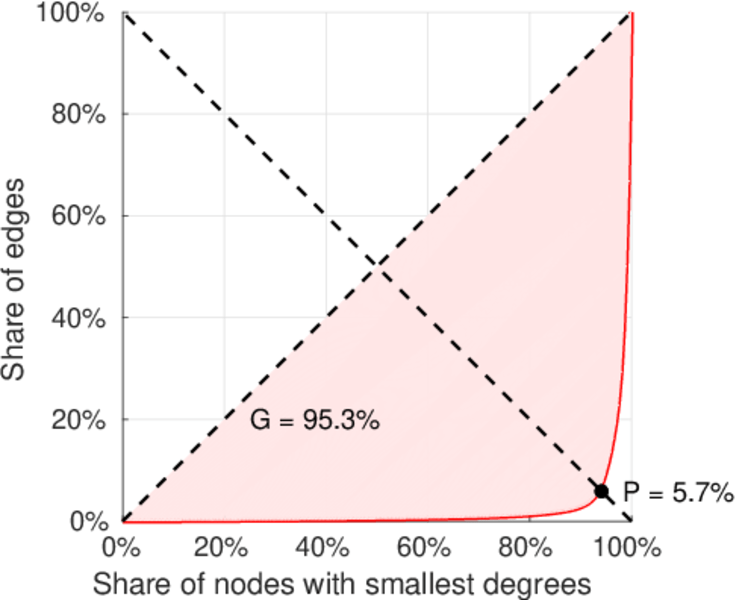
| Left balanced inequality ratio | P1 = | 0.057 238 7
|
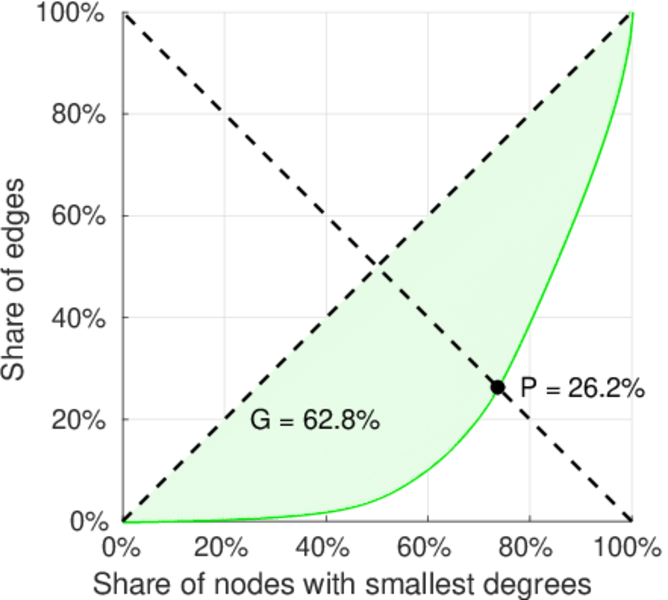
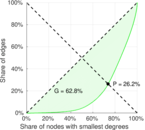
| Right balanced inequality ratio | P2 = | 0.261 591
|
| Relative edge distribution entropy | Her = | 0.807 306
|
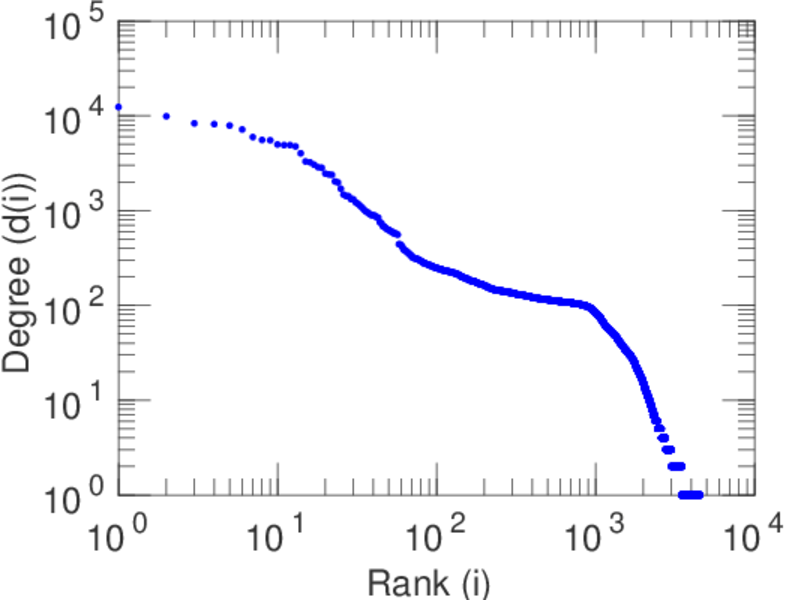
| Power law exponent | γ = | 1.556 63
|
| Tail power law exponent | γt = | 1.431 00
|
| Tail power law exponent with p | γ3 = | 1.431 00
|
| p-value | p = | 0.000 00
|
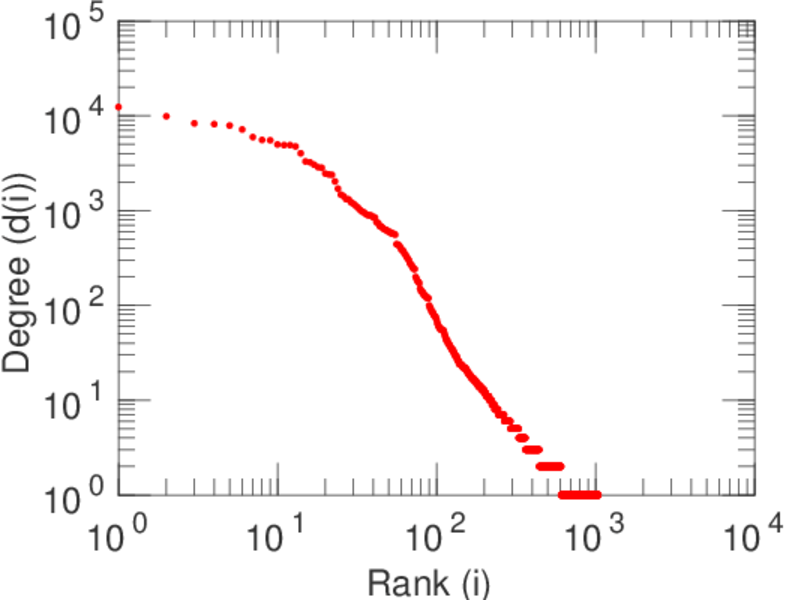
| Left tail power law exponent with p | γ3,1 = | 1.531 00
|
| Left p-value | p1 = | 0.000 00
|
| Right tail power law exponent with p | γ3,2 = | 7.441 00
|
| Right p-value | p2 = | 0.043 000 0
|
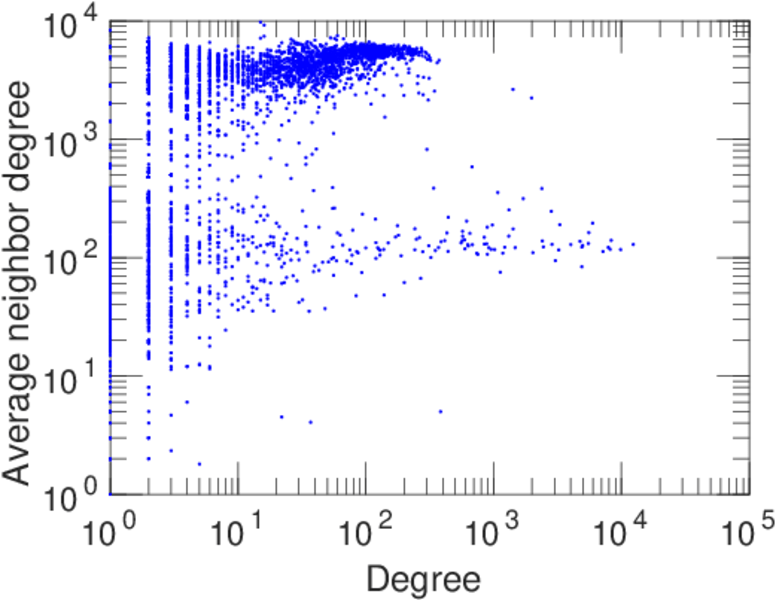
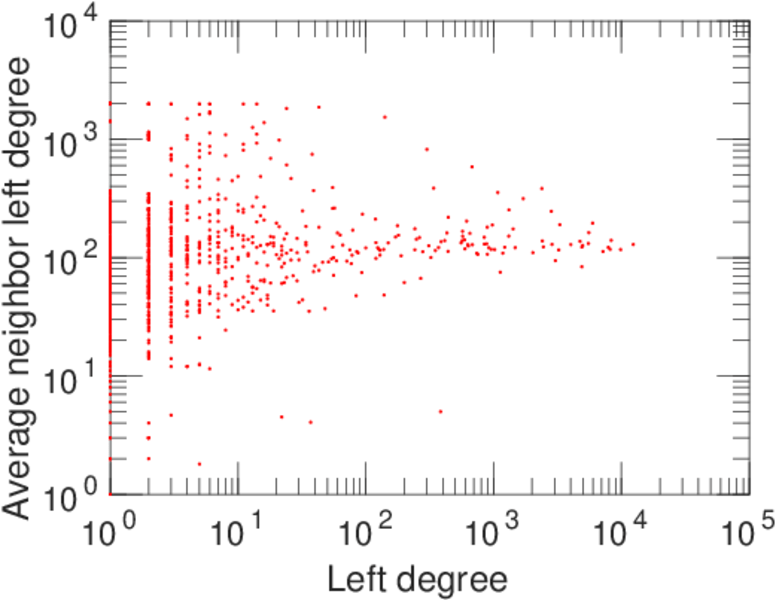
| Degree assortativity | ρ = | −0.181 380
|
| Degree assortativity p-value | pρ = | 0.000 00
|
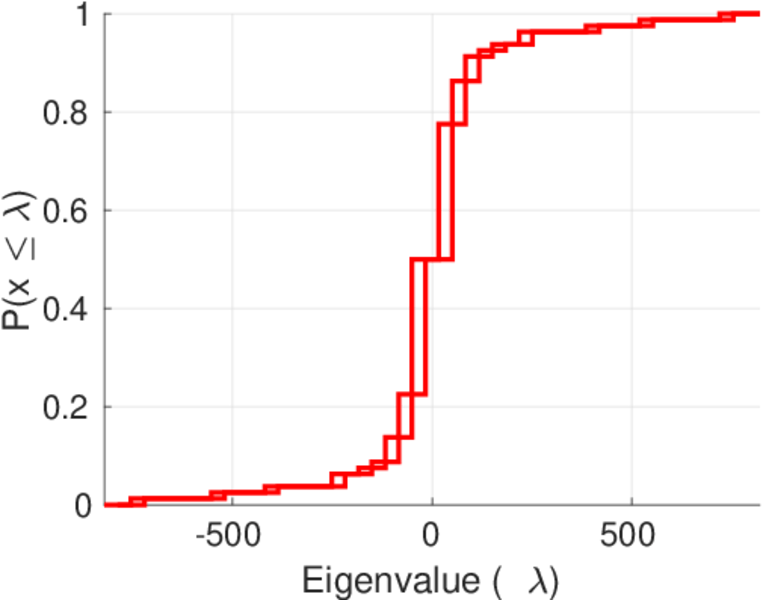
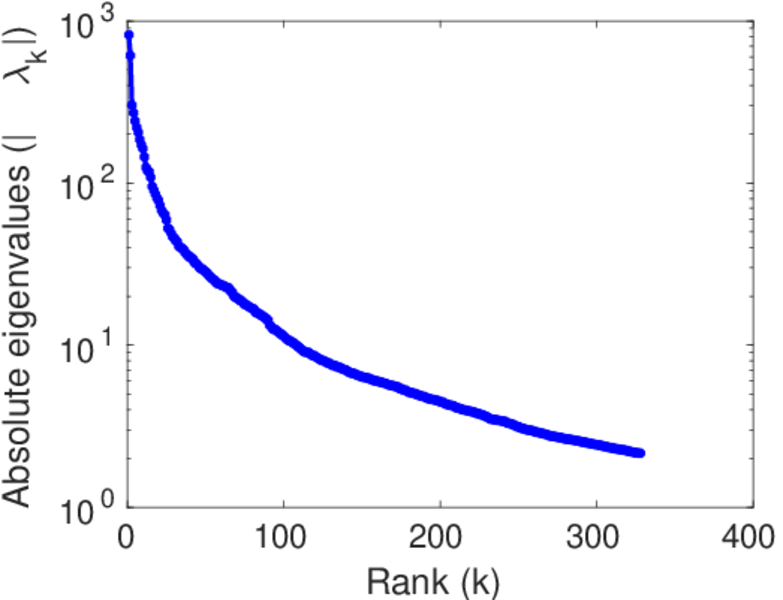
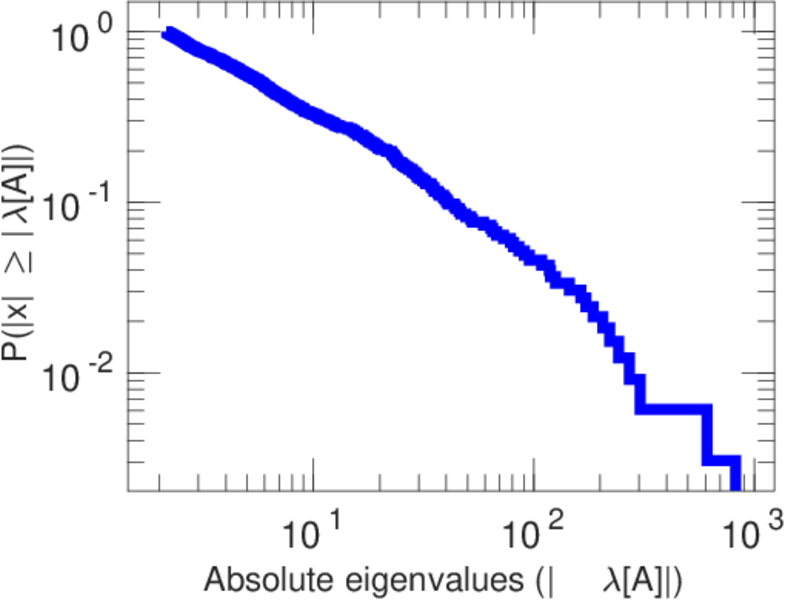
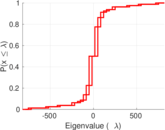
| Spectral norm | α = | 821.519
|
| Algebraic connectivity | a = | 0.131 173
|
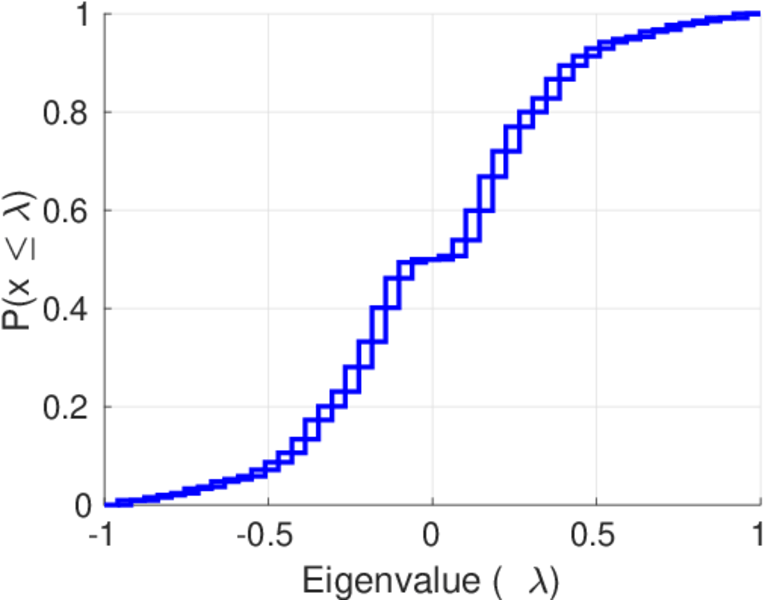
| Spectral separation | |λ1[A] / λ2[A]| = | 1.343 30
|
| Controllability | C = | 2,940
|
| Relative controllability | Cr = | 0.651 019
|
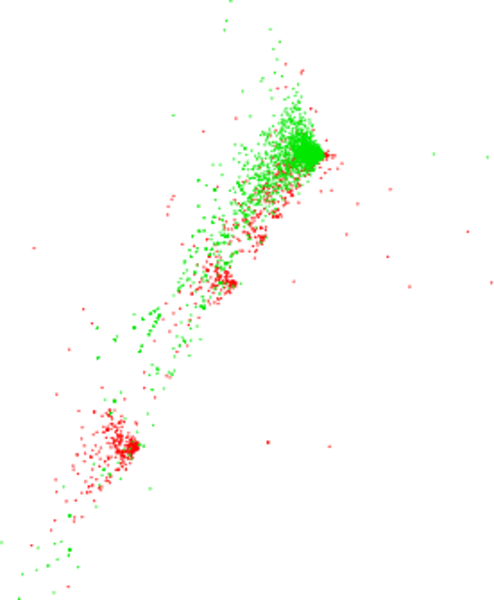
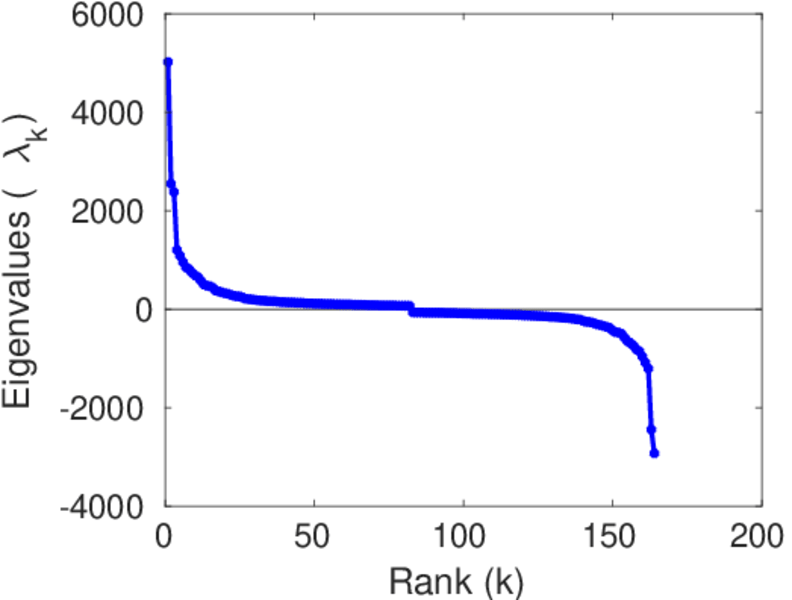
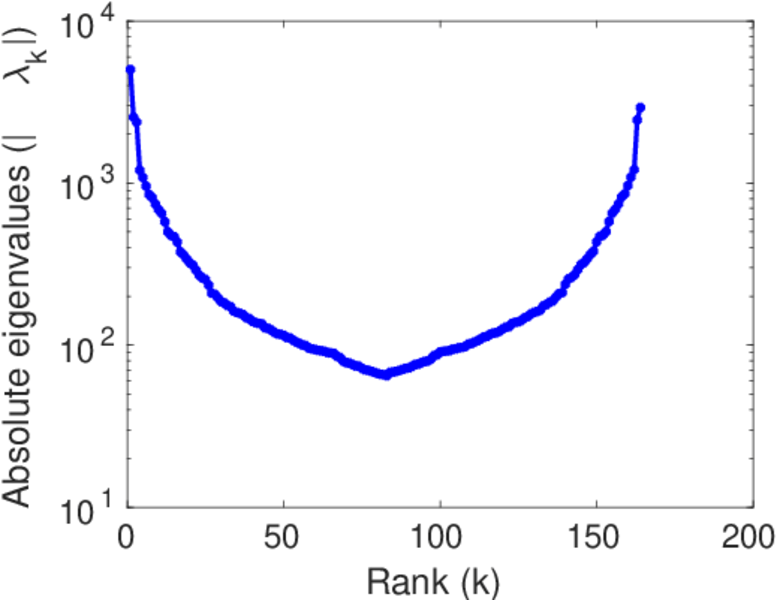
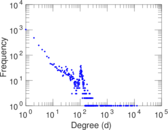
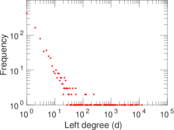
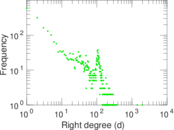
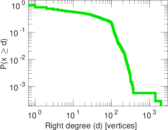
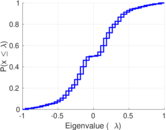
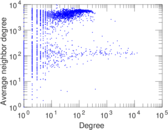
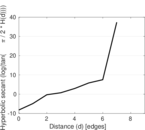
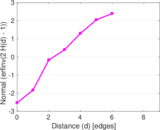
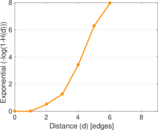
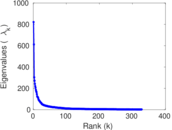
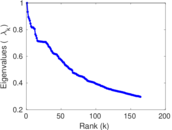
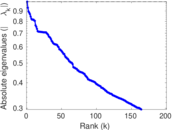
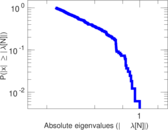
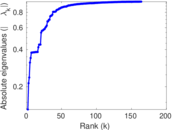
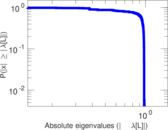
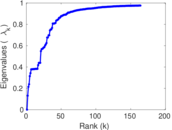
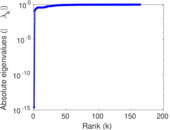
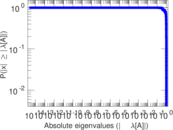
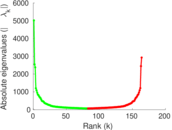
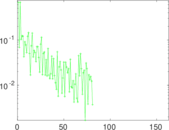
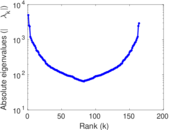
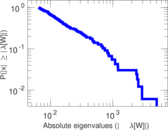
Plots


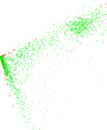

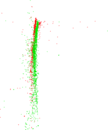


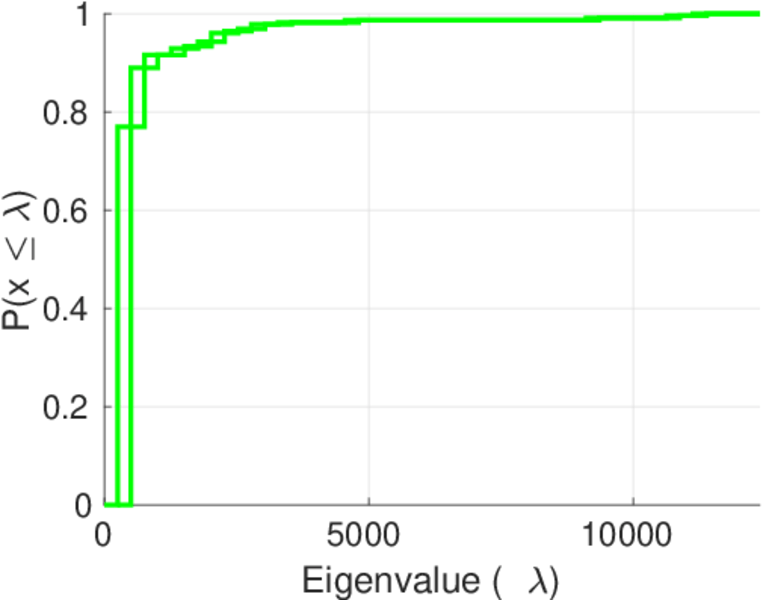
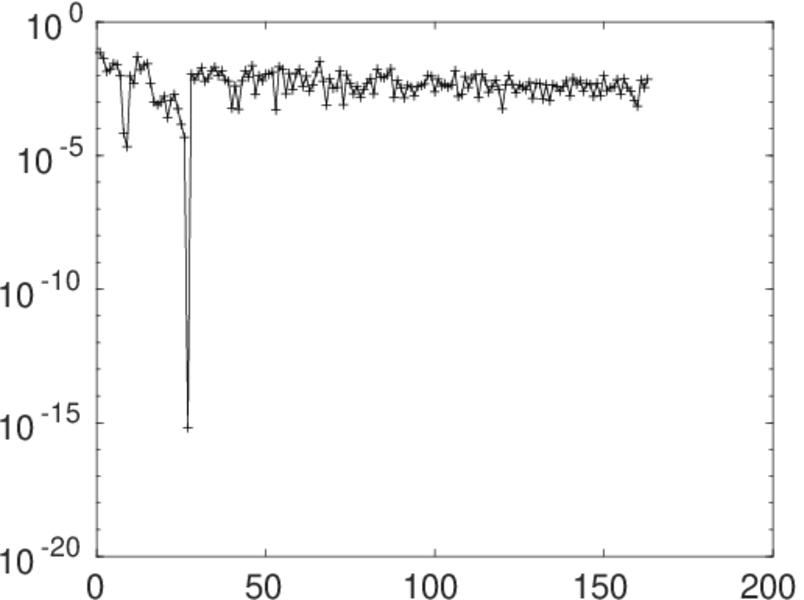
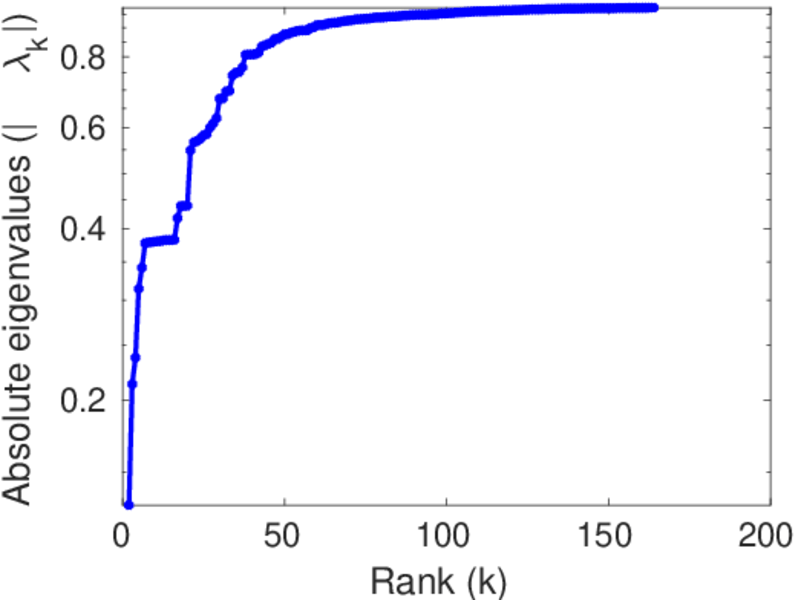
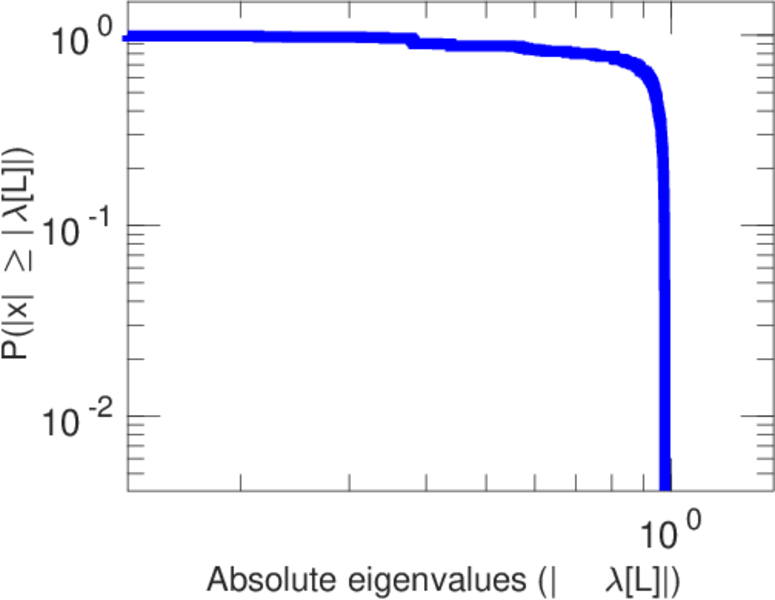
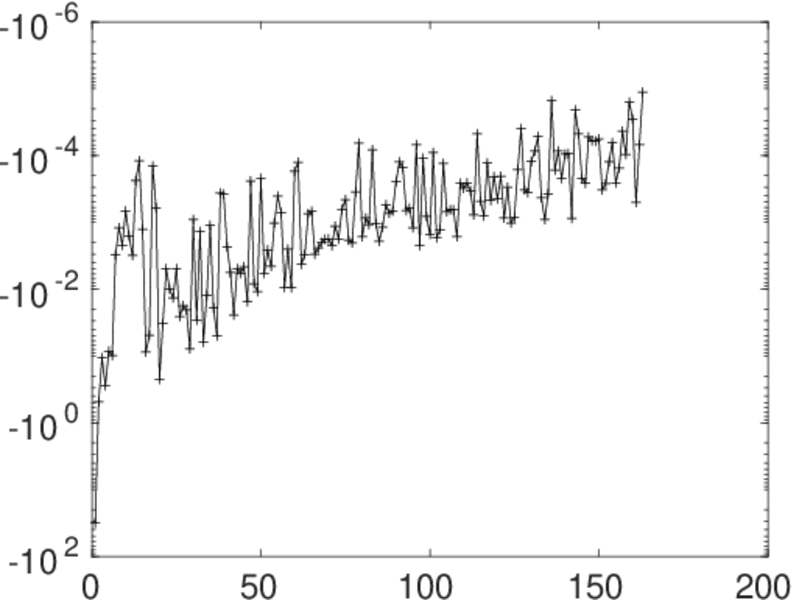
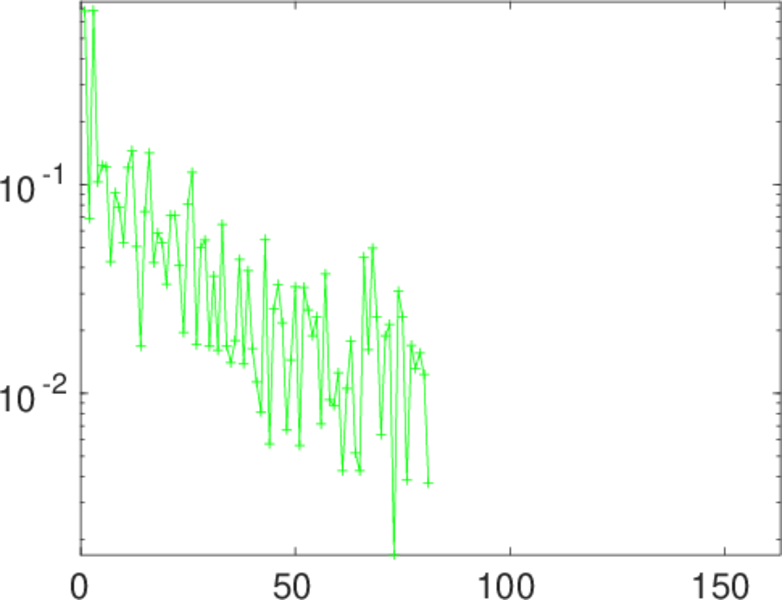
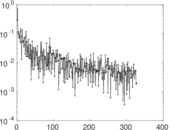
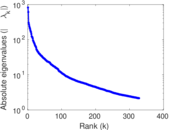
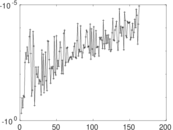
Matrix decompositions plots


Downloads
References
|
[1]
|
Jérôme Kunegis.
KONECT – The Koblenz Network Collection.
In Proc. Int. Conf. on World Wide Web Companion, pages
1343–1350, 2013.
[ http ]
|
|
[2]
|
Wikimedia Foundation.
Wikimedia downloads.
http://dumps.wikimedia.org/, January 2010.
|
 KONECT ‣ Networks ‣
Buy Me a Coffee
KONECT ‣ Networks ‣
Buy Me a Coffee