Wikipedia edits (gag)
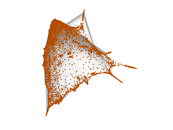
This is the bipartite edit network of the Gagauz Wikipedia. It contains users
and pages from the Gagauz Wikipedia, connected by edit events. Each edge
represents an edit. The dataset includes the timestamp of each edit.
Metadata
Statistics
| Size | n = | 6,999
|
| Left size | n1 = | 799
|
| Right size | n2 = | 6,200
|
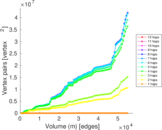
| Volume | m = | 54,855
|
| Unique edge count | m̿ = | 28,126
|
| Wedge count | s = | 10,131,228
|
| Claw count | z = | 3,990,981,464
|
| Cross count | x = | 1,452,505,795,966
|
| Square count | q = | 13,409,869
|
| 4-Tour count | T4 = | 147,913,884
|
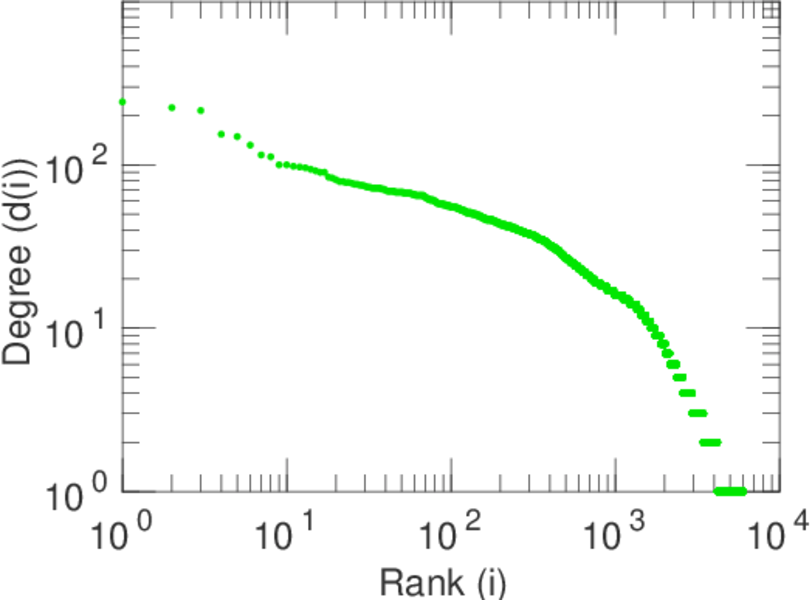
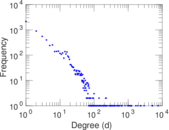
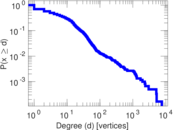
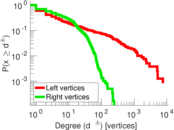
| Maximum degree | dmax = | 7,558
|
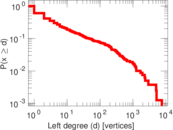
| Maximum left degree | d1max = | 7,558
|
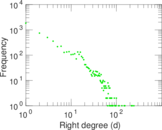
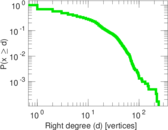
| Maximum right degree | d2max = | 243
|
| Average degree | d = | 15.675 1
|
| Average left degree | d1 = | 68.654 6
|
| Average right degree | d2 = | 8.847 58
|
| Fill | p = | 0.005 677 66
|
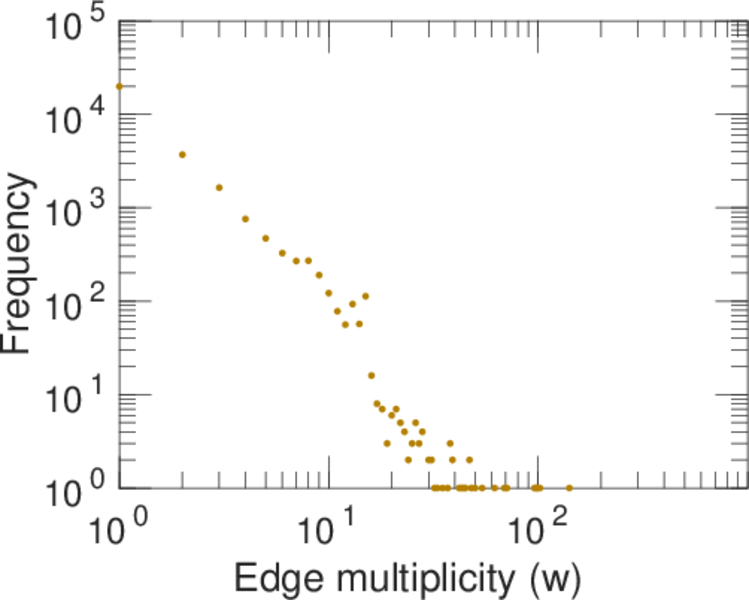
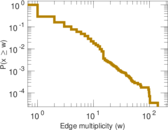
| Average edge multiplicity | m̃ = | 1.950 33
|
| Size of LCC | N = | 6,481
|
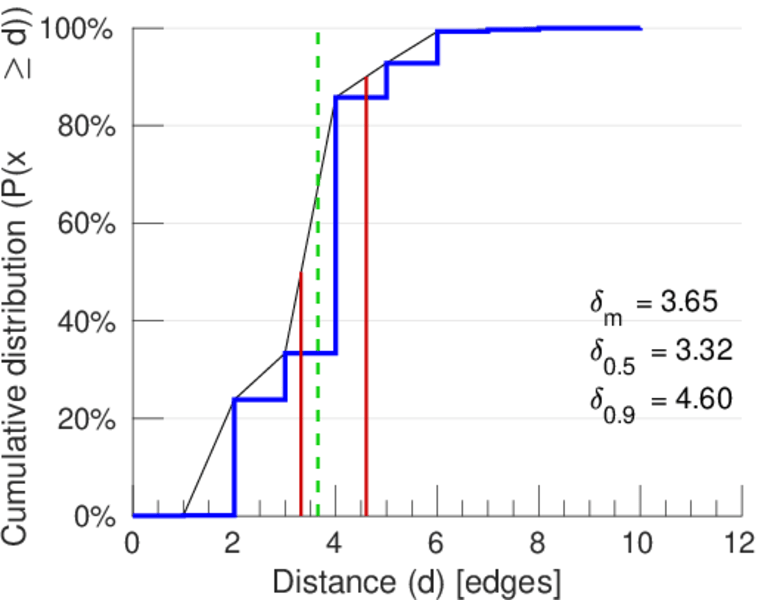
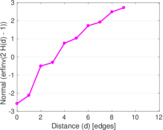
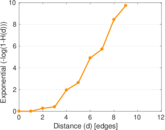
| Diameter | δ = | 12
|
| 50-Percentile effective diameter | δ0.5 = | 3.317 79
|
| 90-Percentile effective diameter | δ0.9 = | 4.599 24
|
| Median distance | δM = | 4
|
| Mean distance | δm = | 3.652 06
|
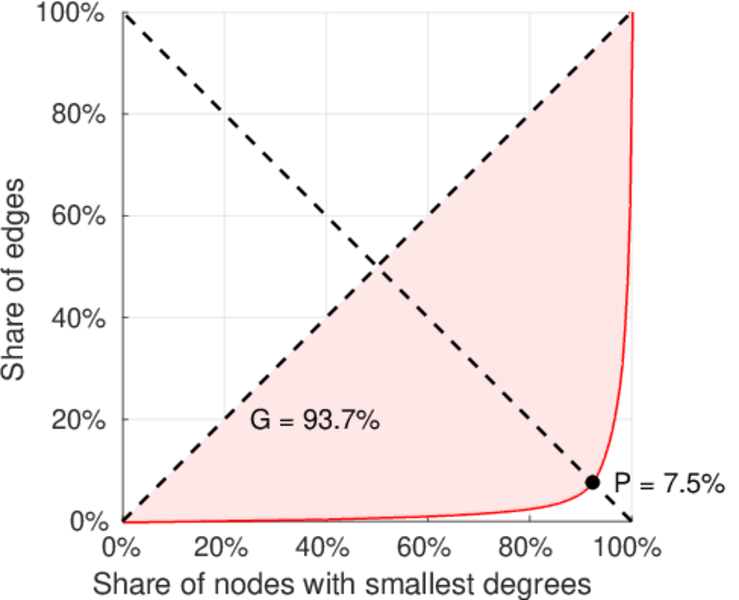
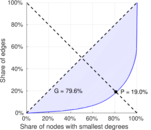
| Gini coefficient | G = | 0.802 148
|
| Balanced inequality ratio | P = | 0.187 348
|
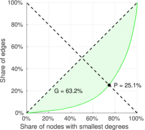
| Left balanced inequality ratio | P1 = | 0.074 797 2
|
| Right balanced inequality ratio | P2 = | 0.250 734
|
| Relative edge distribution entropy | Her = | 0.784 648
|
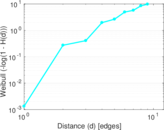
| Power law exponent | γ = | 2.001 76
|
| Tail power law exponent | γt = | 1.871 00
|
| Tail power law exponent with p | γ3 = | 1.871 00
|
| p-value | p = | 0.000 00
|
| Left tail power law exponent with p | γ3,1 = | 1.641 00
|
| Left p-value | p1 = | 0.000 00
|
| Right tail power law exponent with p | γ3,2 = | 6.751 00
|
| Right p-value | p2 = | 0.033 000 0
|
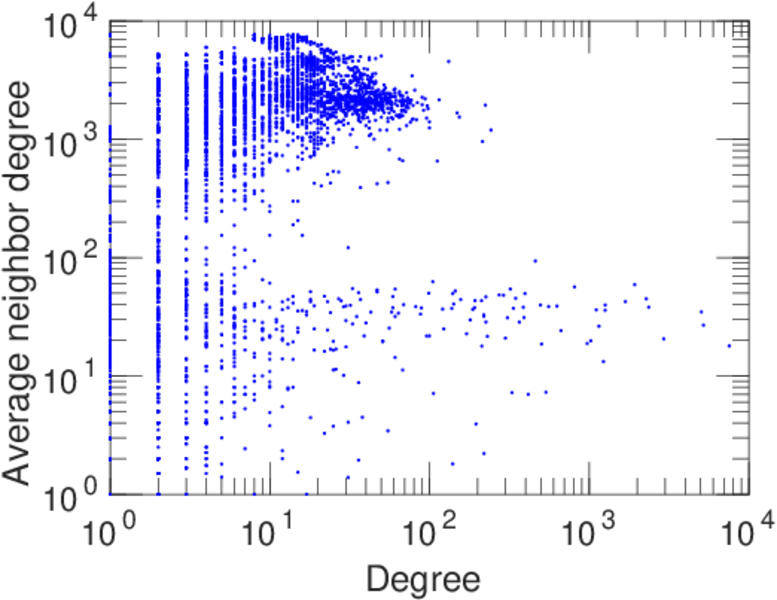
| Degree assortativity | ρ = | −0.209 217
|
| Degree assortativity p-value | pρ = | 1.034 03 × 10−275
|
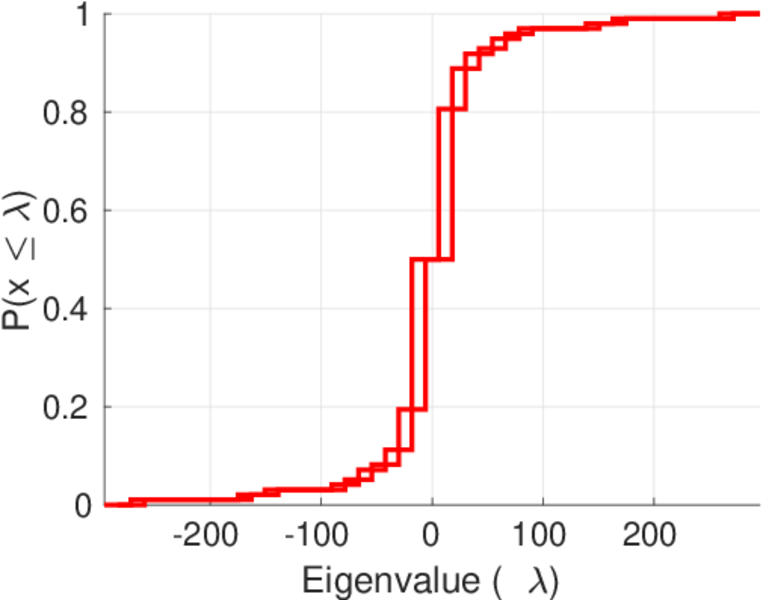
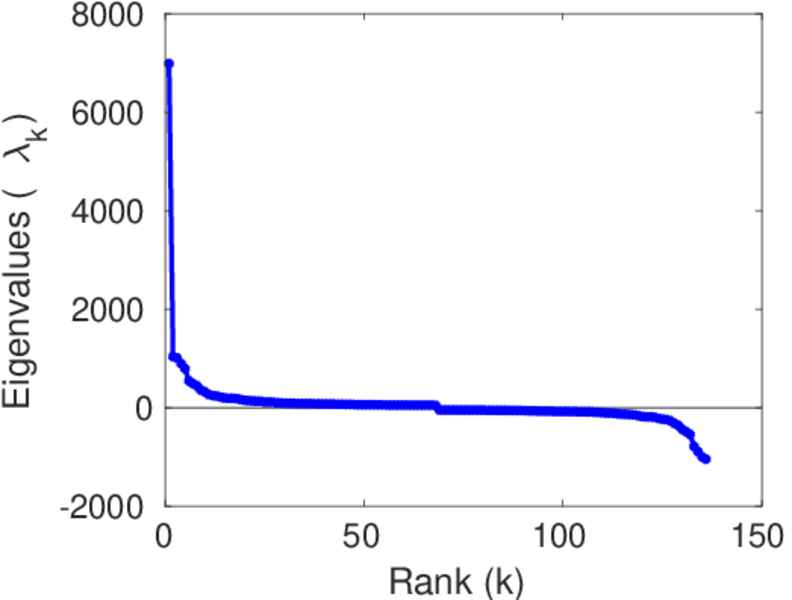
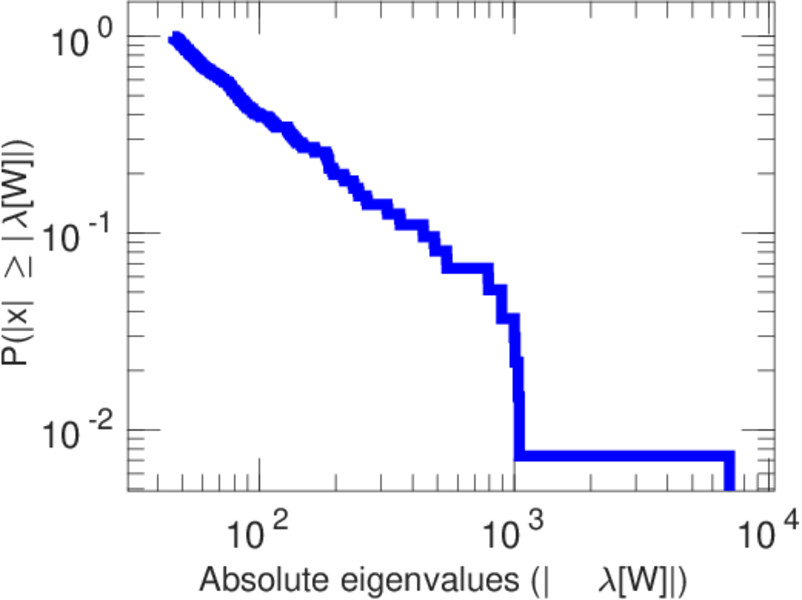
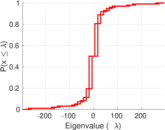
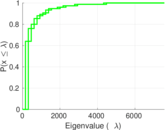
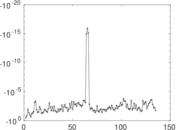
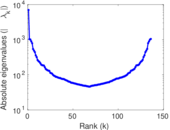
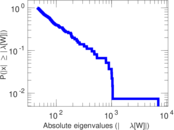
| Spectral norm | α = | 295.379
|
| Algebraic connectivity | a = | 0.070 811 3
|
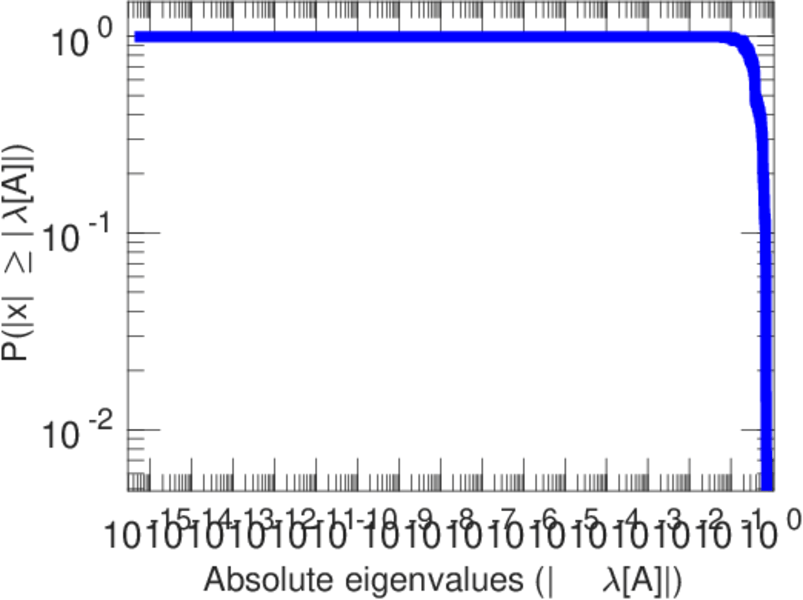
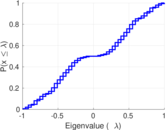
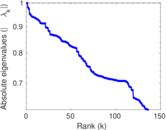
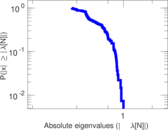
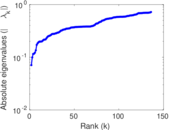
| Spectral separation | |λ1[A] / λ2[A]| = | 1.166 75
|
| Controllability | C = | 5,384
|
| Relative controllability | Cr = | 0.788 749
|
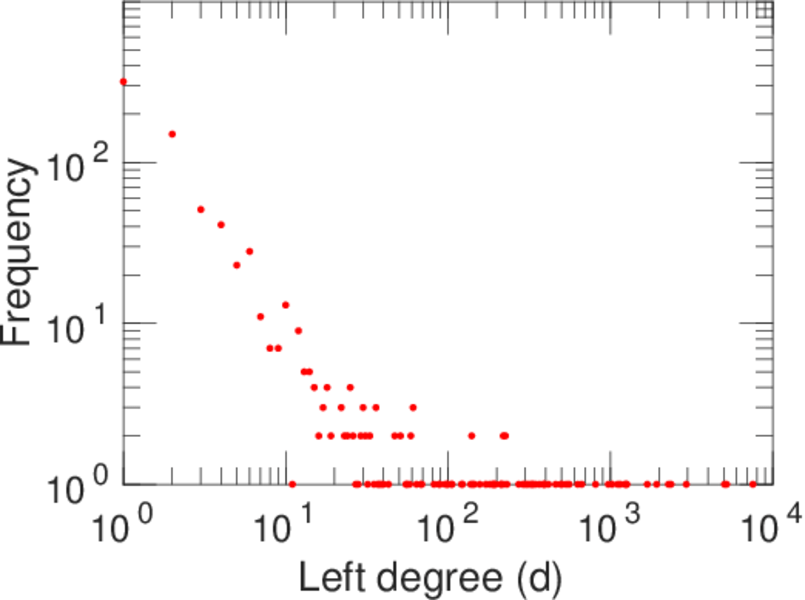
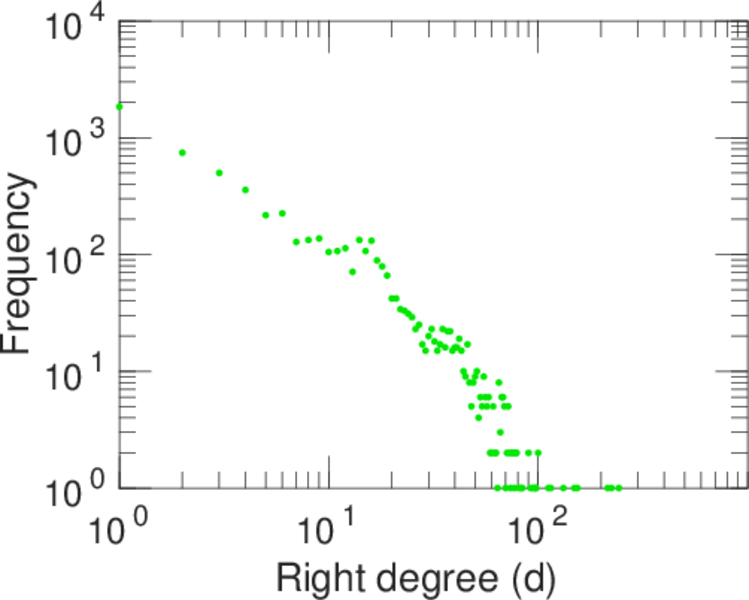
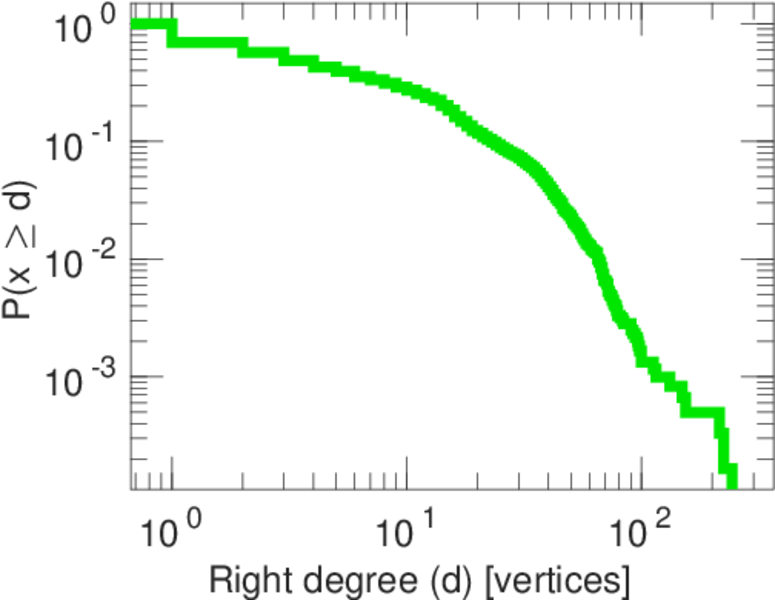
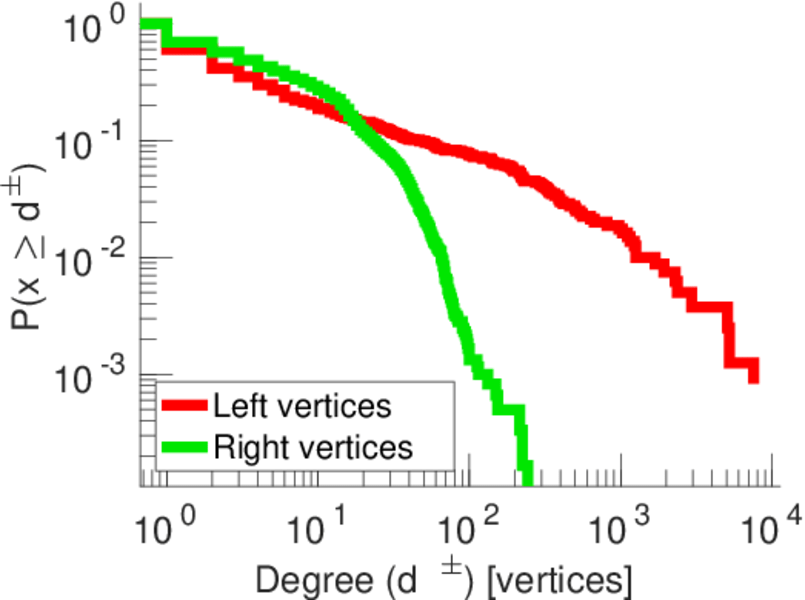
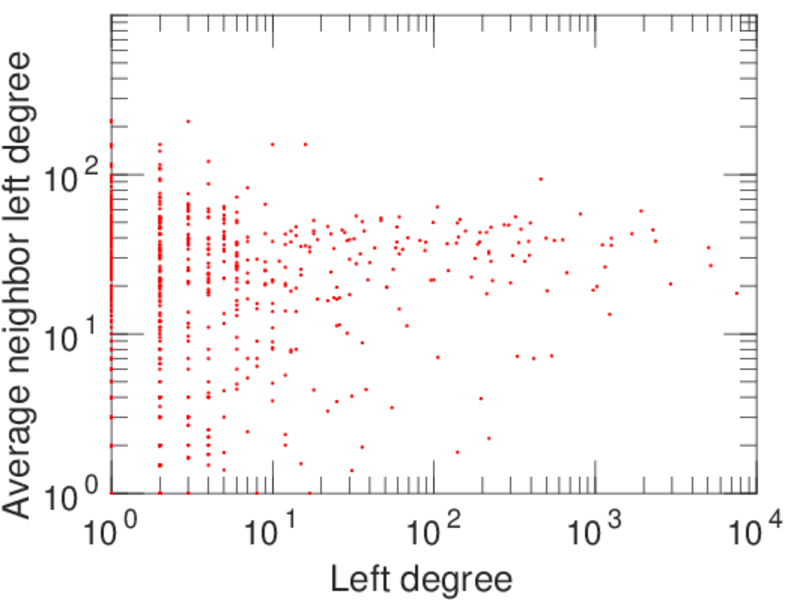
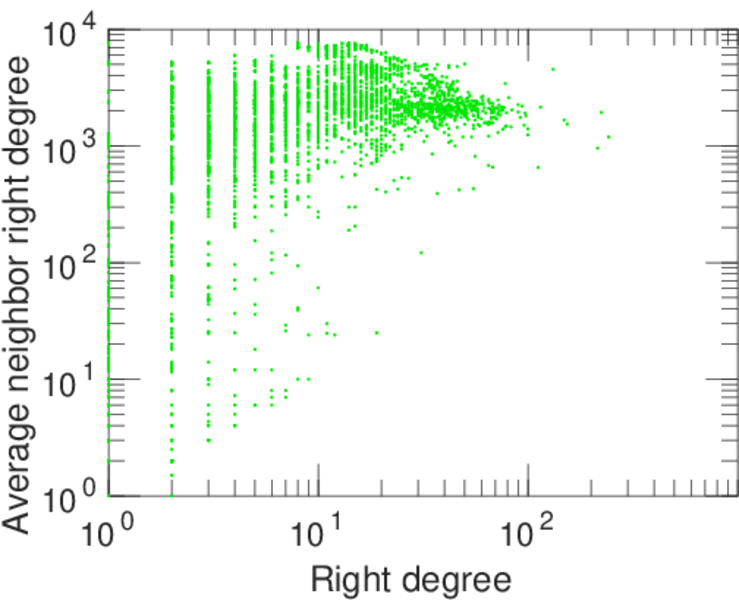
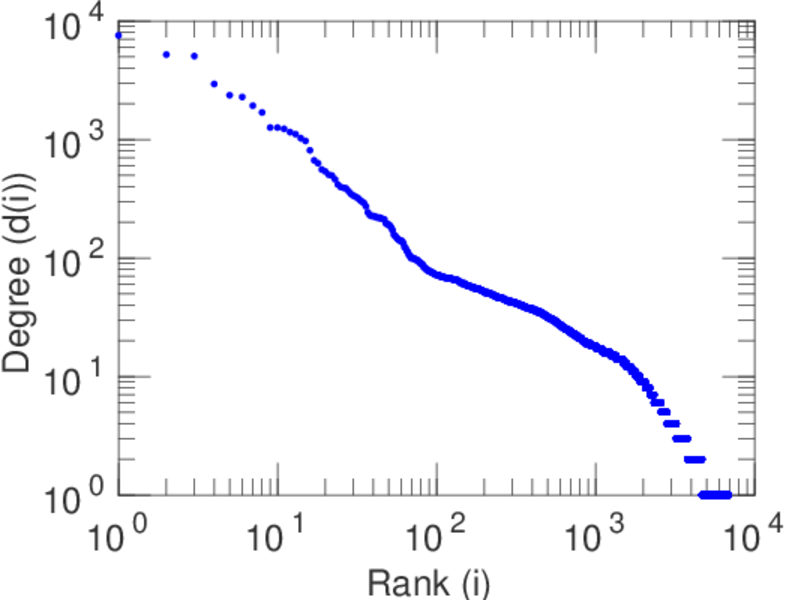
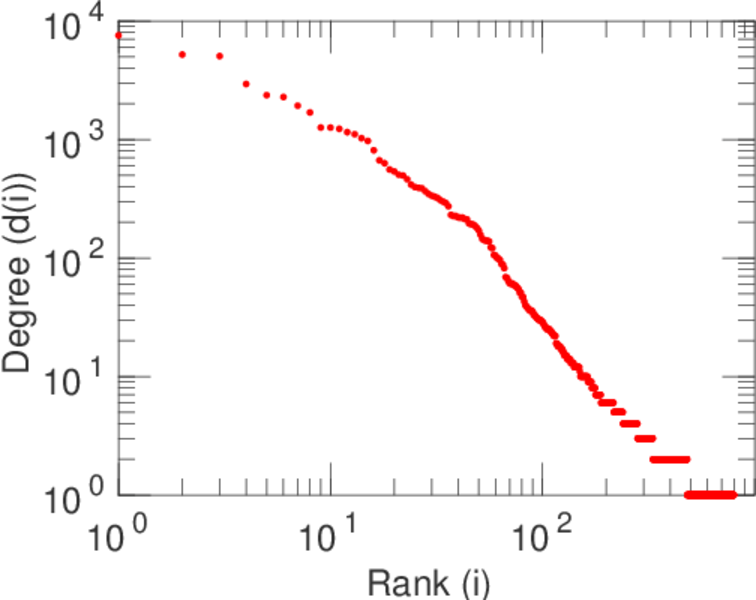
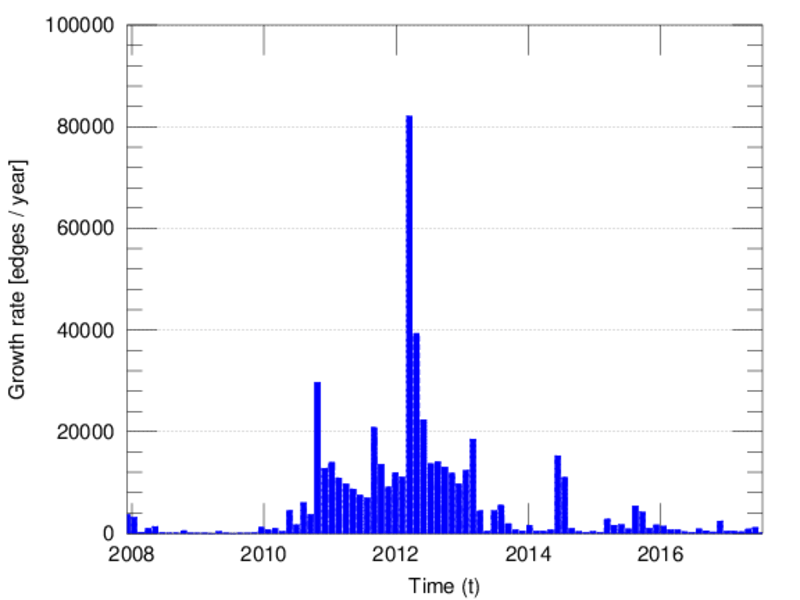
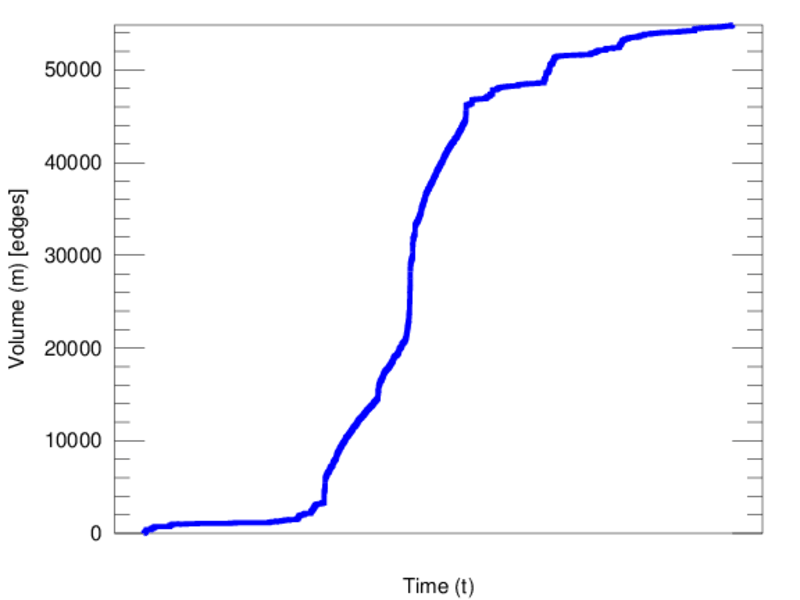
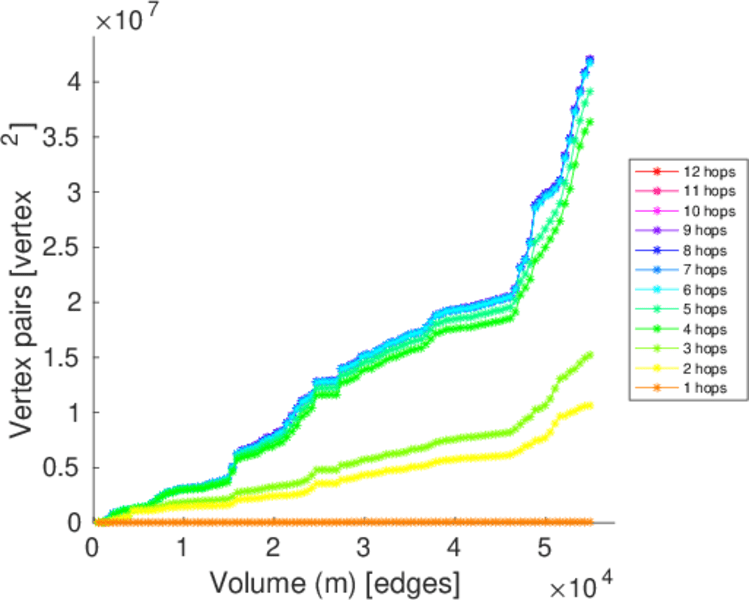
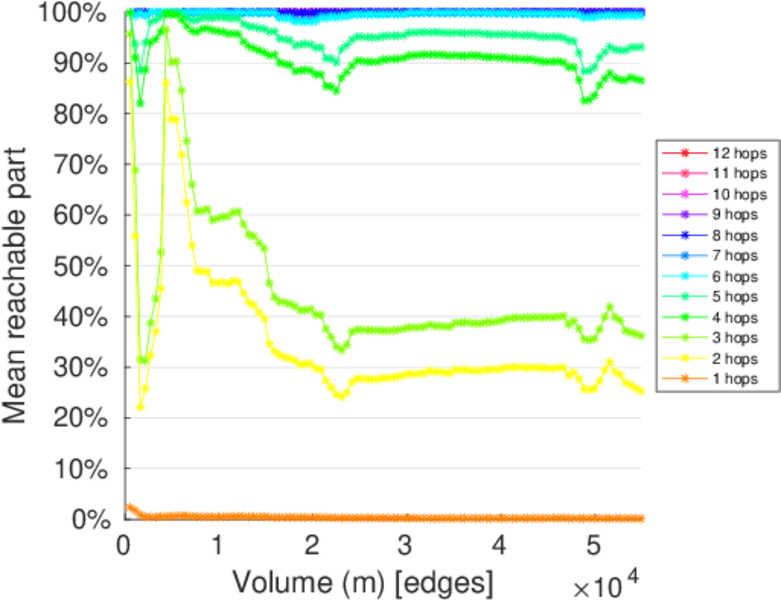
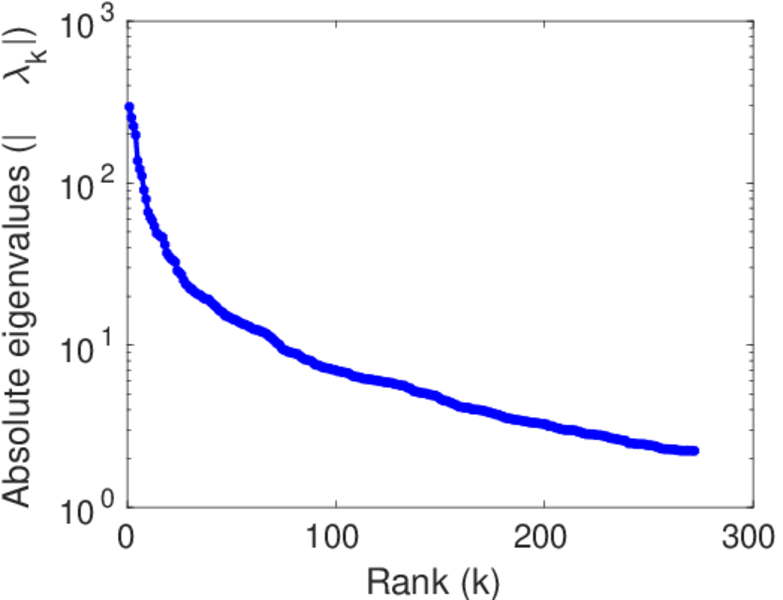
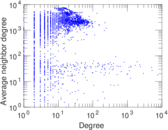
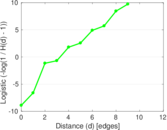
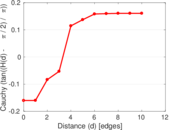
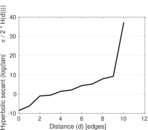
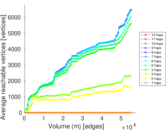
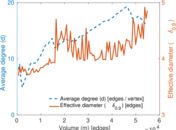
Plots


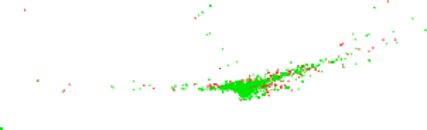
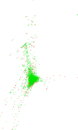


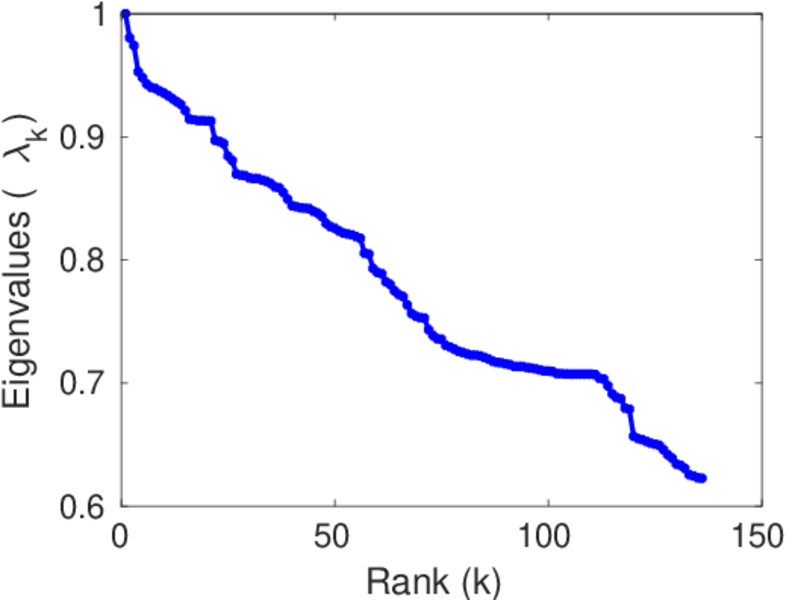
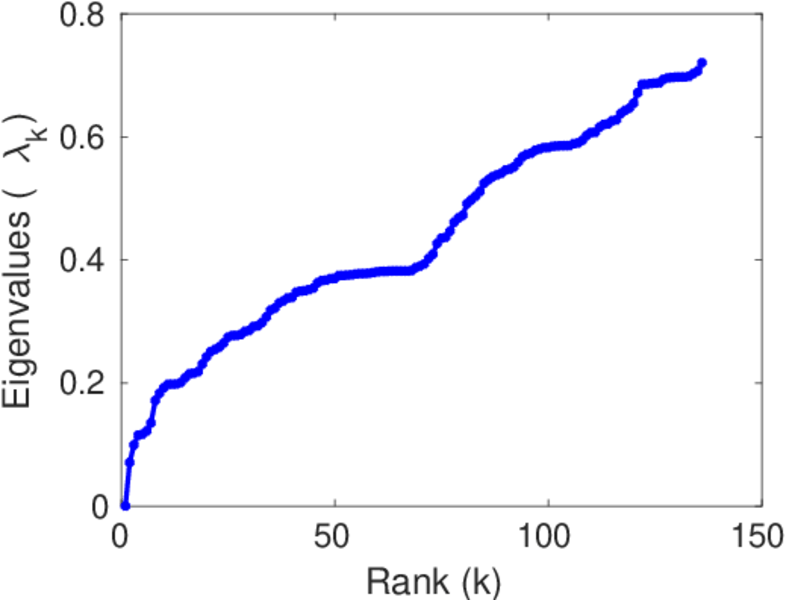
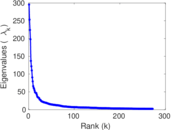
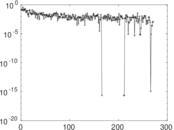
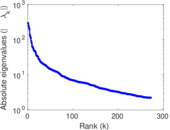
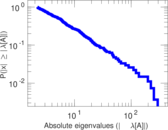
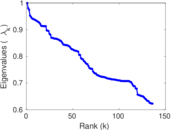
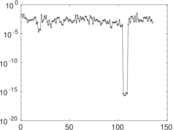
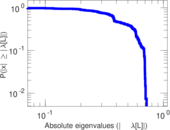
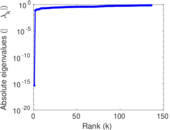
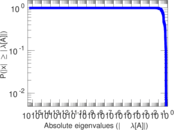
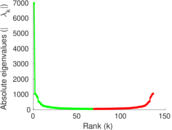
Matrix decompositions plots


Downloads
References
|
[1]
|
Jérôme Kunegis.
KONECT – The Koblenz Network Collection.
In Proc. Int. Conf. on World Wide Web Companion, pages
1343–1350, 2013.
[ http ]
|
|
[2]
|
Wikimedia Foundation.
Wikimedia downloads.
http://dumps.wikimedia.org/, January 2010.
|
 KONECT ‣ Networks ‣
Buy Me a Coffee
KONECT ‣ Networks ‣
Buy Me a Coffee