Wikipedia edits (gan)
This is the bipartite edit network of the Gan Chinese Wikipedia. It contains
users and pages from the Gan Chinese Wikipedia, connected by edit events. Each
edge represents an edit. The dataset includes the timestamp of each edit.
Metadata
Statistics
| Size | n = | 34,354
|
| Left size | n1 = | 1,186
|
| Right size | n2 = | 33,168
|
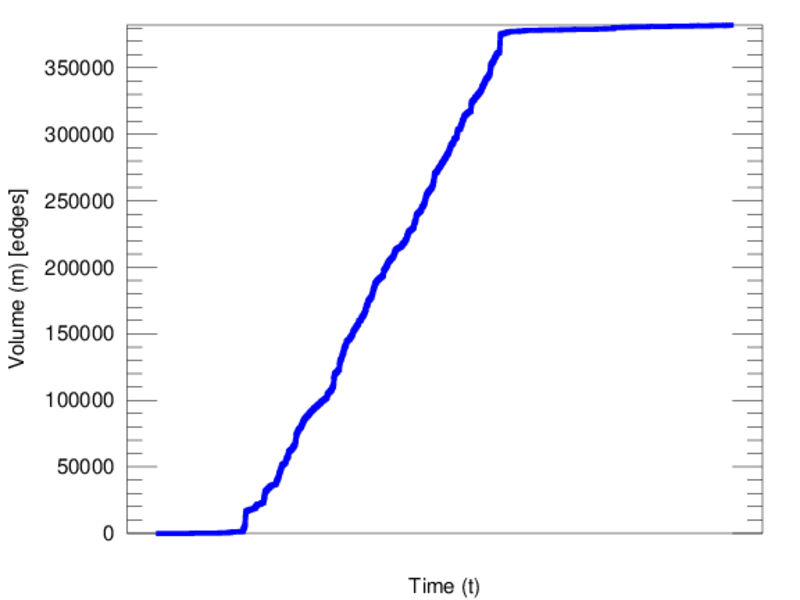
| Volume | m = | 382,174
|
| Unique edge count | m̿ = | 202,398
|
| Wedge count | s = | 746,639,483
|
| Claw count | z = | 3,093,315,623,066
|
| Cross count | x = | 12,553,852,725,862,754
|
| Square count | q = | 1,788,857,578
|
| 4-Tour count | T4 = | 17,298,091,972
|
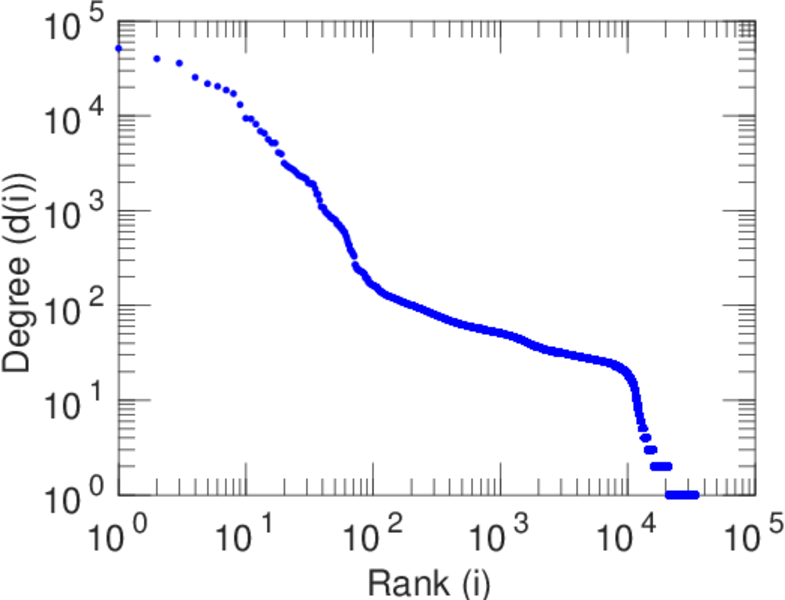
| Maximum degree | dmax = | 51,478
|
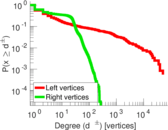
| Maximum left degree | d1max = | 51,478
|
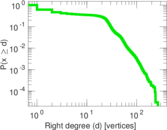
| Maximum right degree | d2max = | 266
|
| Average degree | d = | 22.249 2
|
| Average left degree | d1 = | 322.238
|
| Average right degree | d2 = | 11.522 4
|
| Fill | p = | 0.005 145 20
|
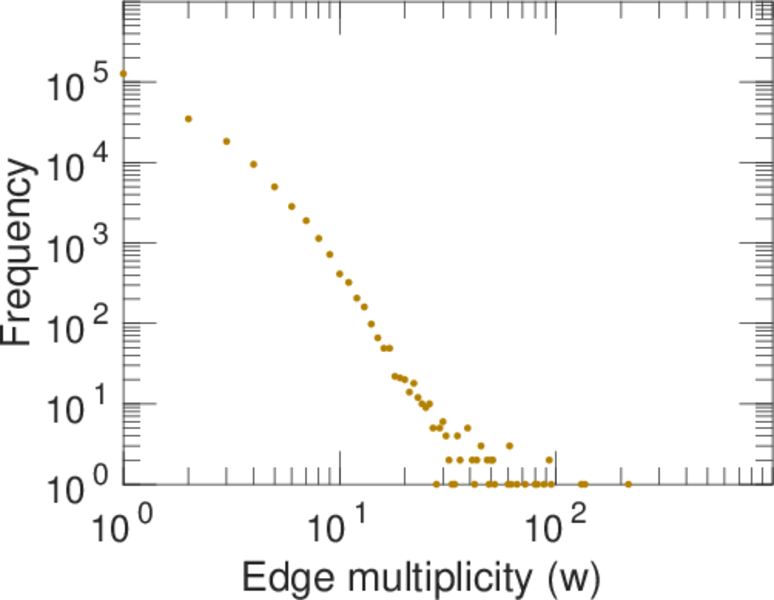
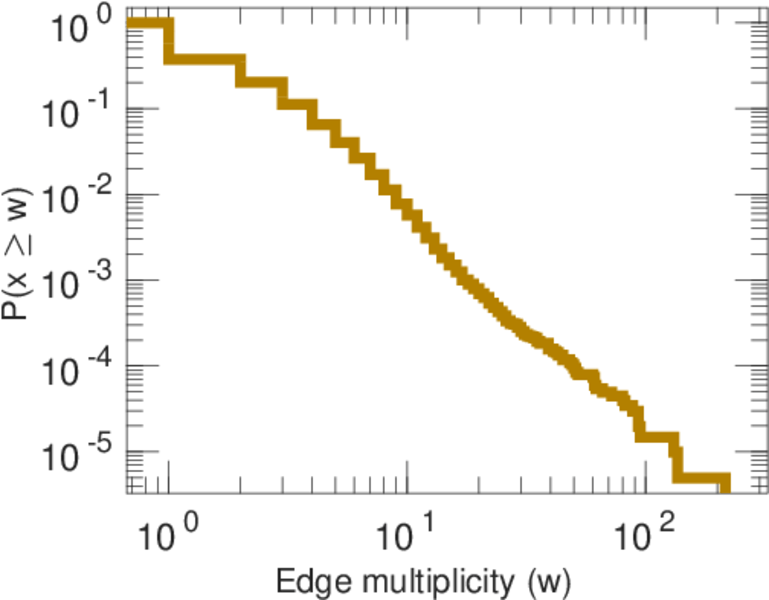
| Average edge multiplicity | m̃ = | 1.888 23
|
| Size of LCC | N = | 33,650
|
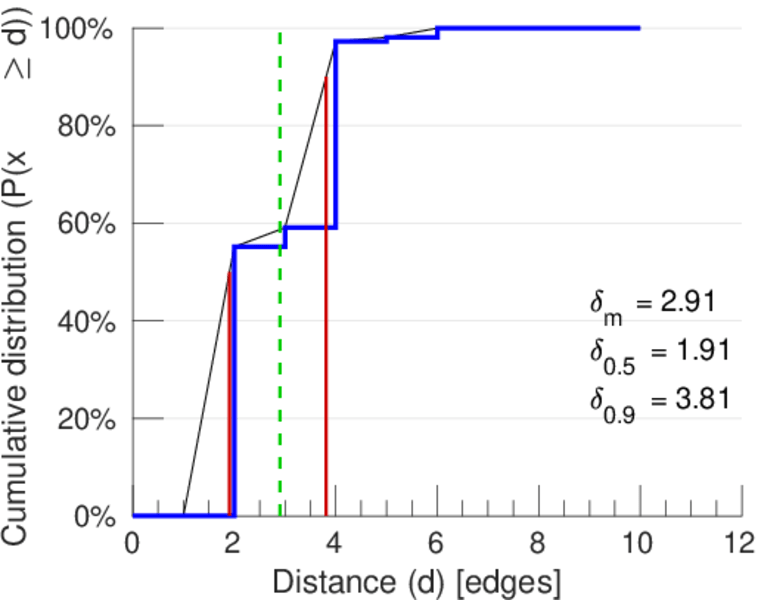
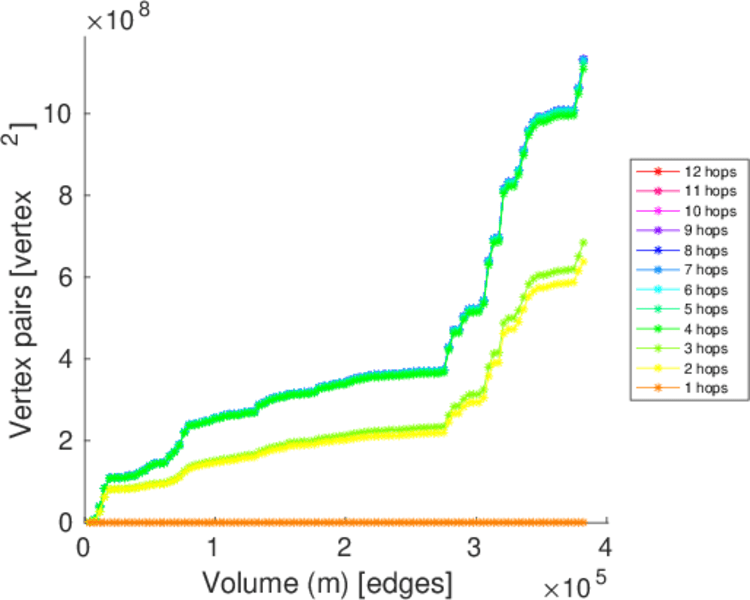
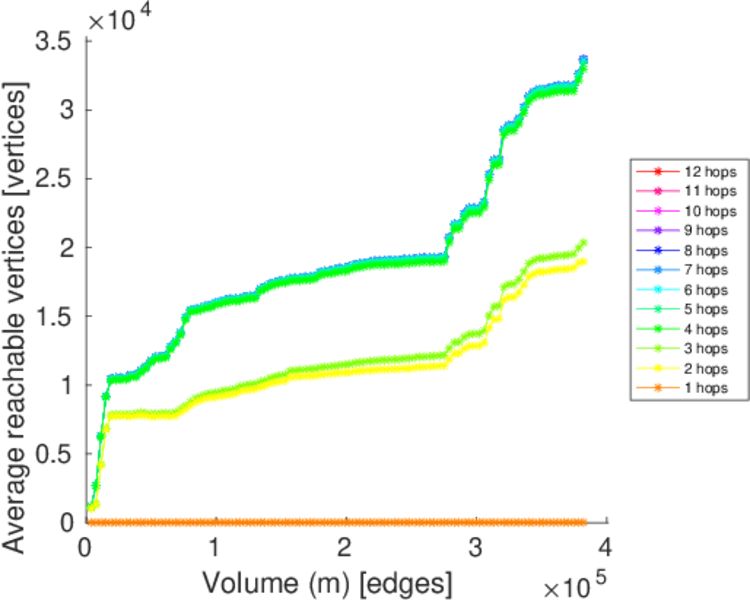
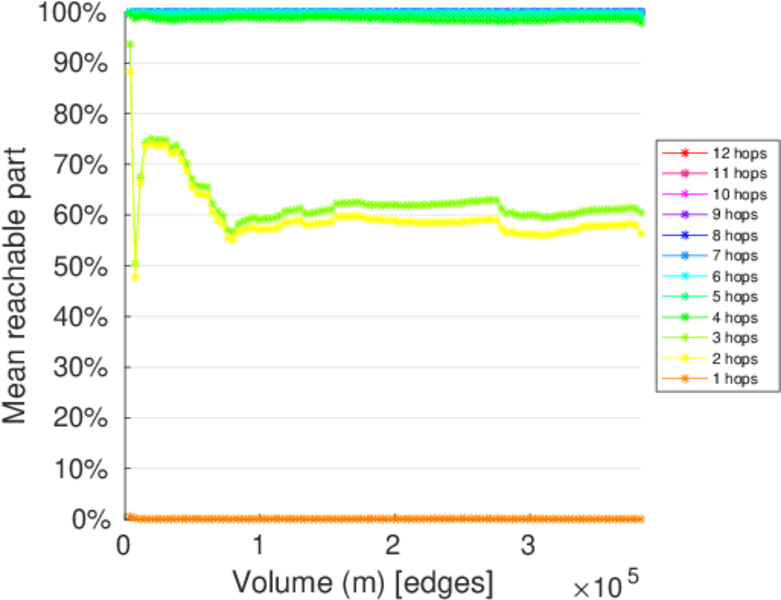
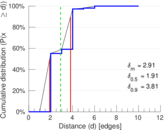
| Diameter | δ = | 12
|
| 50-Percentile effective diameter | δ0.5 = | 1.906 70
|
| 90-Percentile effective diameter | δ0.9 = | 3.810 59
|
| Median distance | δM = | 2
|
| Mean distance | δm = | 2.905 18
|
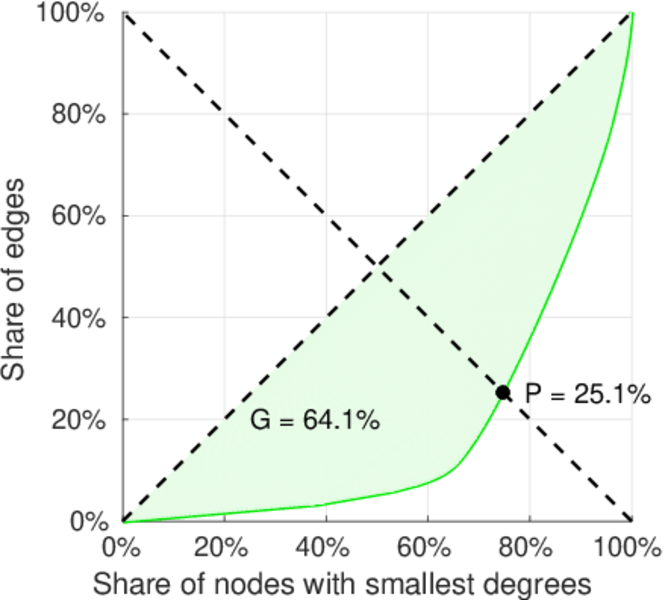
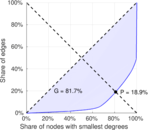
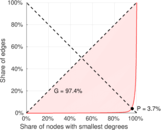
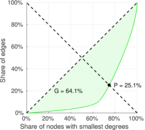
| Gini coefficient | G = | 0.816 801
|
| Balanced inequality ratio | P = | 0.191 889
|
| Left balanced inequality ratio | P1 = | 0.037 247 4
|
| Right balanced inequality ratio | P2 = | 0.251 378
|
| Relative edge distribution entropy | Her = | 0.717 731
|
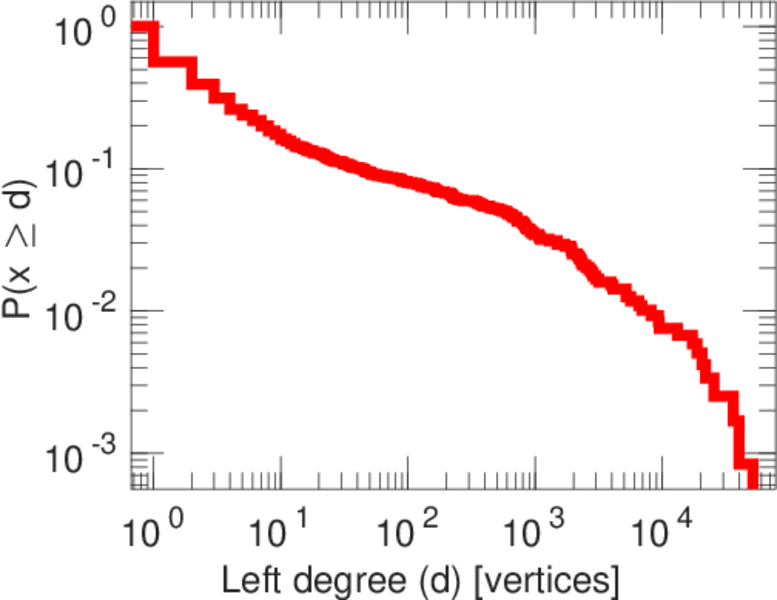
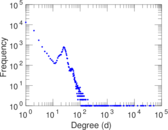
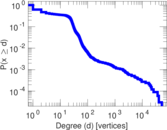
| Power law exponent | γ = | 2.001 79
|
| Tail power law exponent | γt = | 4.071 00
|
| Tail power law exponent with p | γ3 = | 4.071 00
|
| p-value | p = | 0.000 00
|
| Left tail power law exponent with p | γ3,1 = | 1.371 00
|
| Left p-value | p1 = | 0.000 00
|
| Right tail power law exponent with p | γ3,2 = | 7.861 00
|
| Right p-value | p2 = | 0.533 000
|
| Degree assortativity | ρ = | −0.491 832
|
| Degree assortativity p-value | pρ = | 0.000 00
|
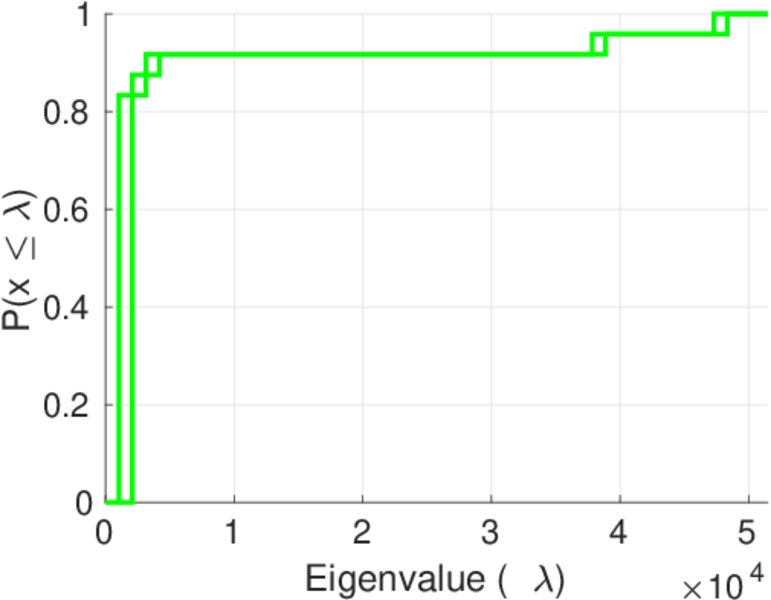
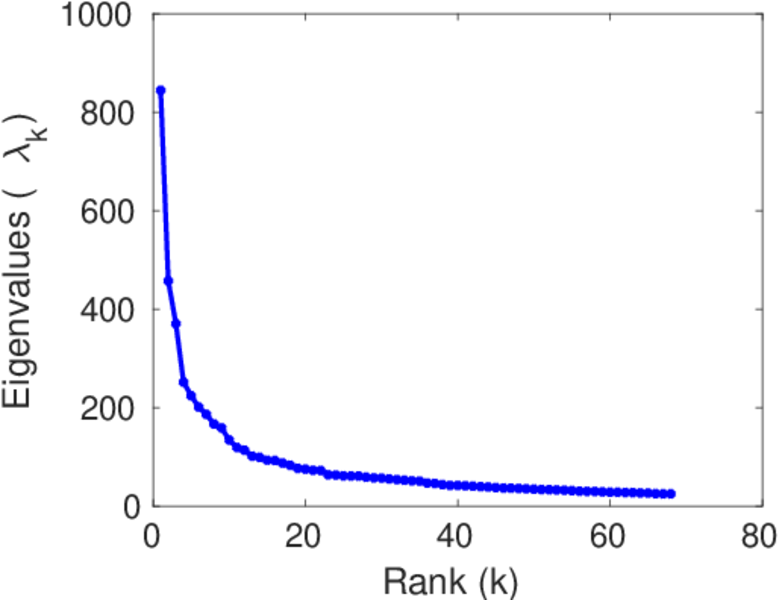
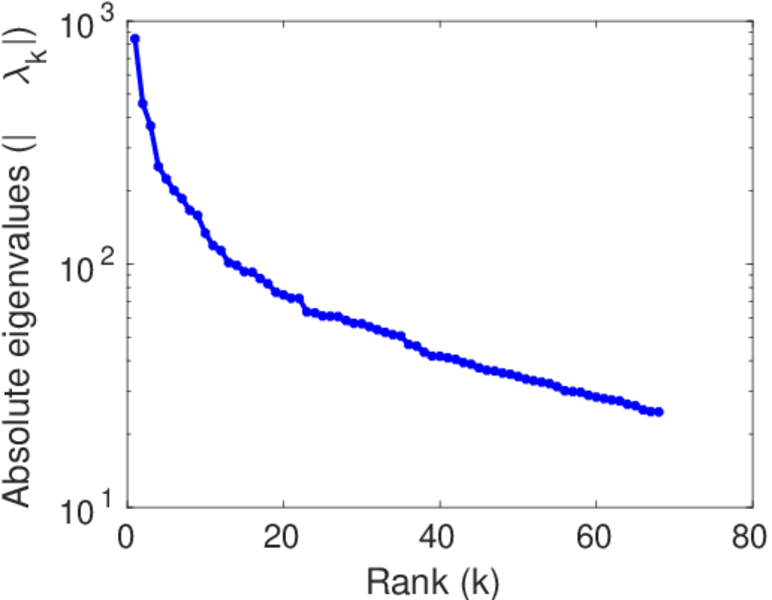
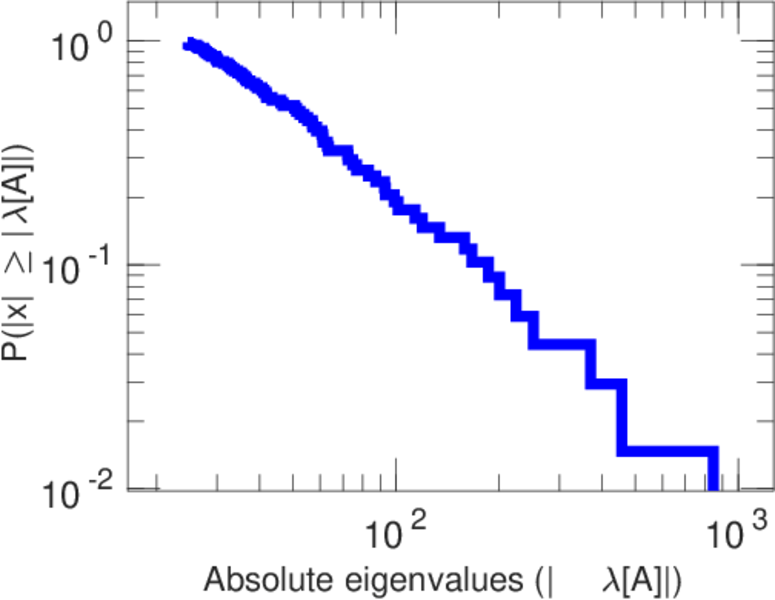
| Spectral norm | α = | 844.454
|
| Algebraic connectivity | a = | 0.050 884 5
|
| Spectral separation | |λ1[A] / λ2[A]| = | 1.846 86
|
| Controllability | C = | 32,118
|
| Relative controllability | Cr = | 0.937 259
|
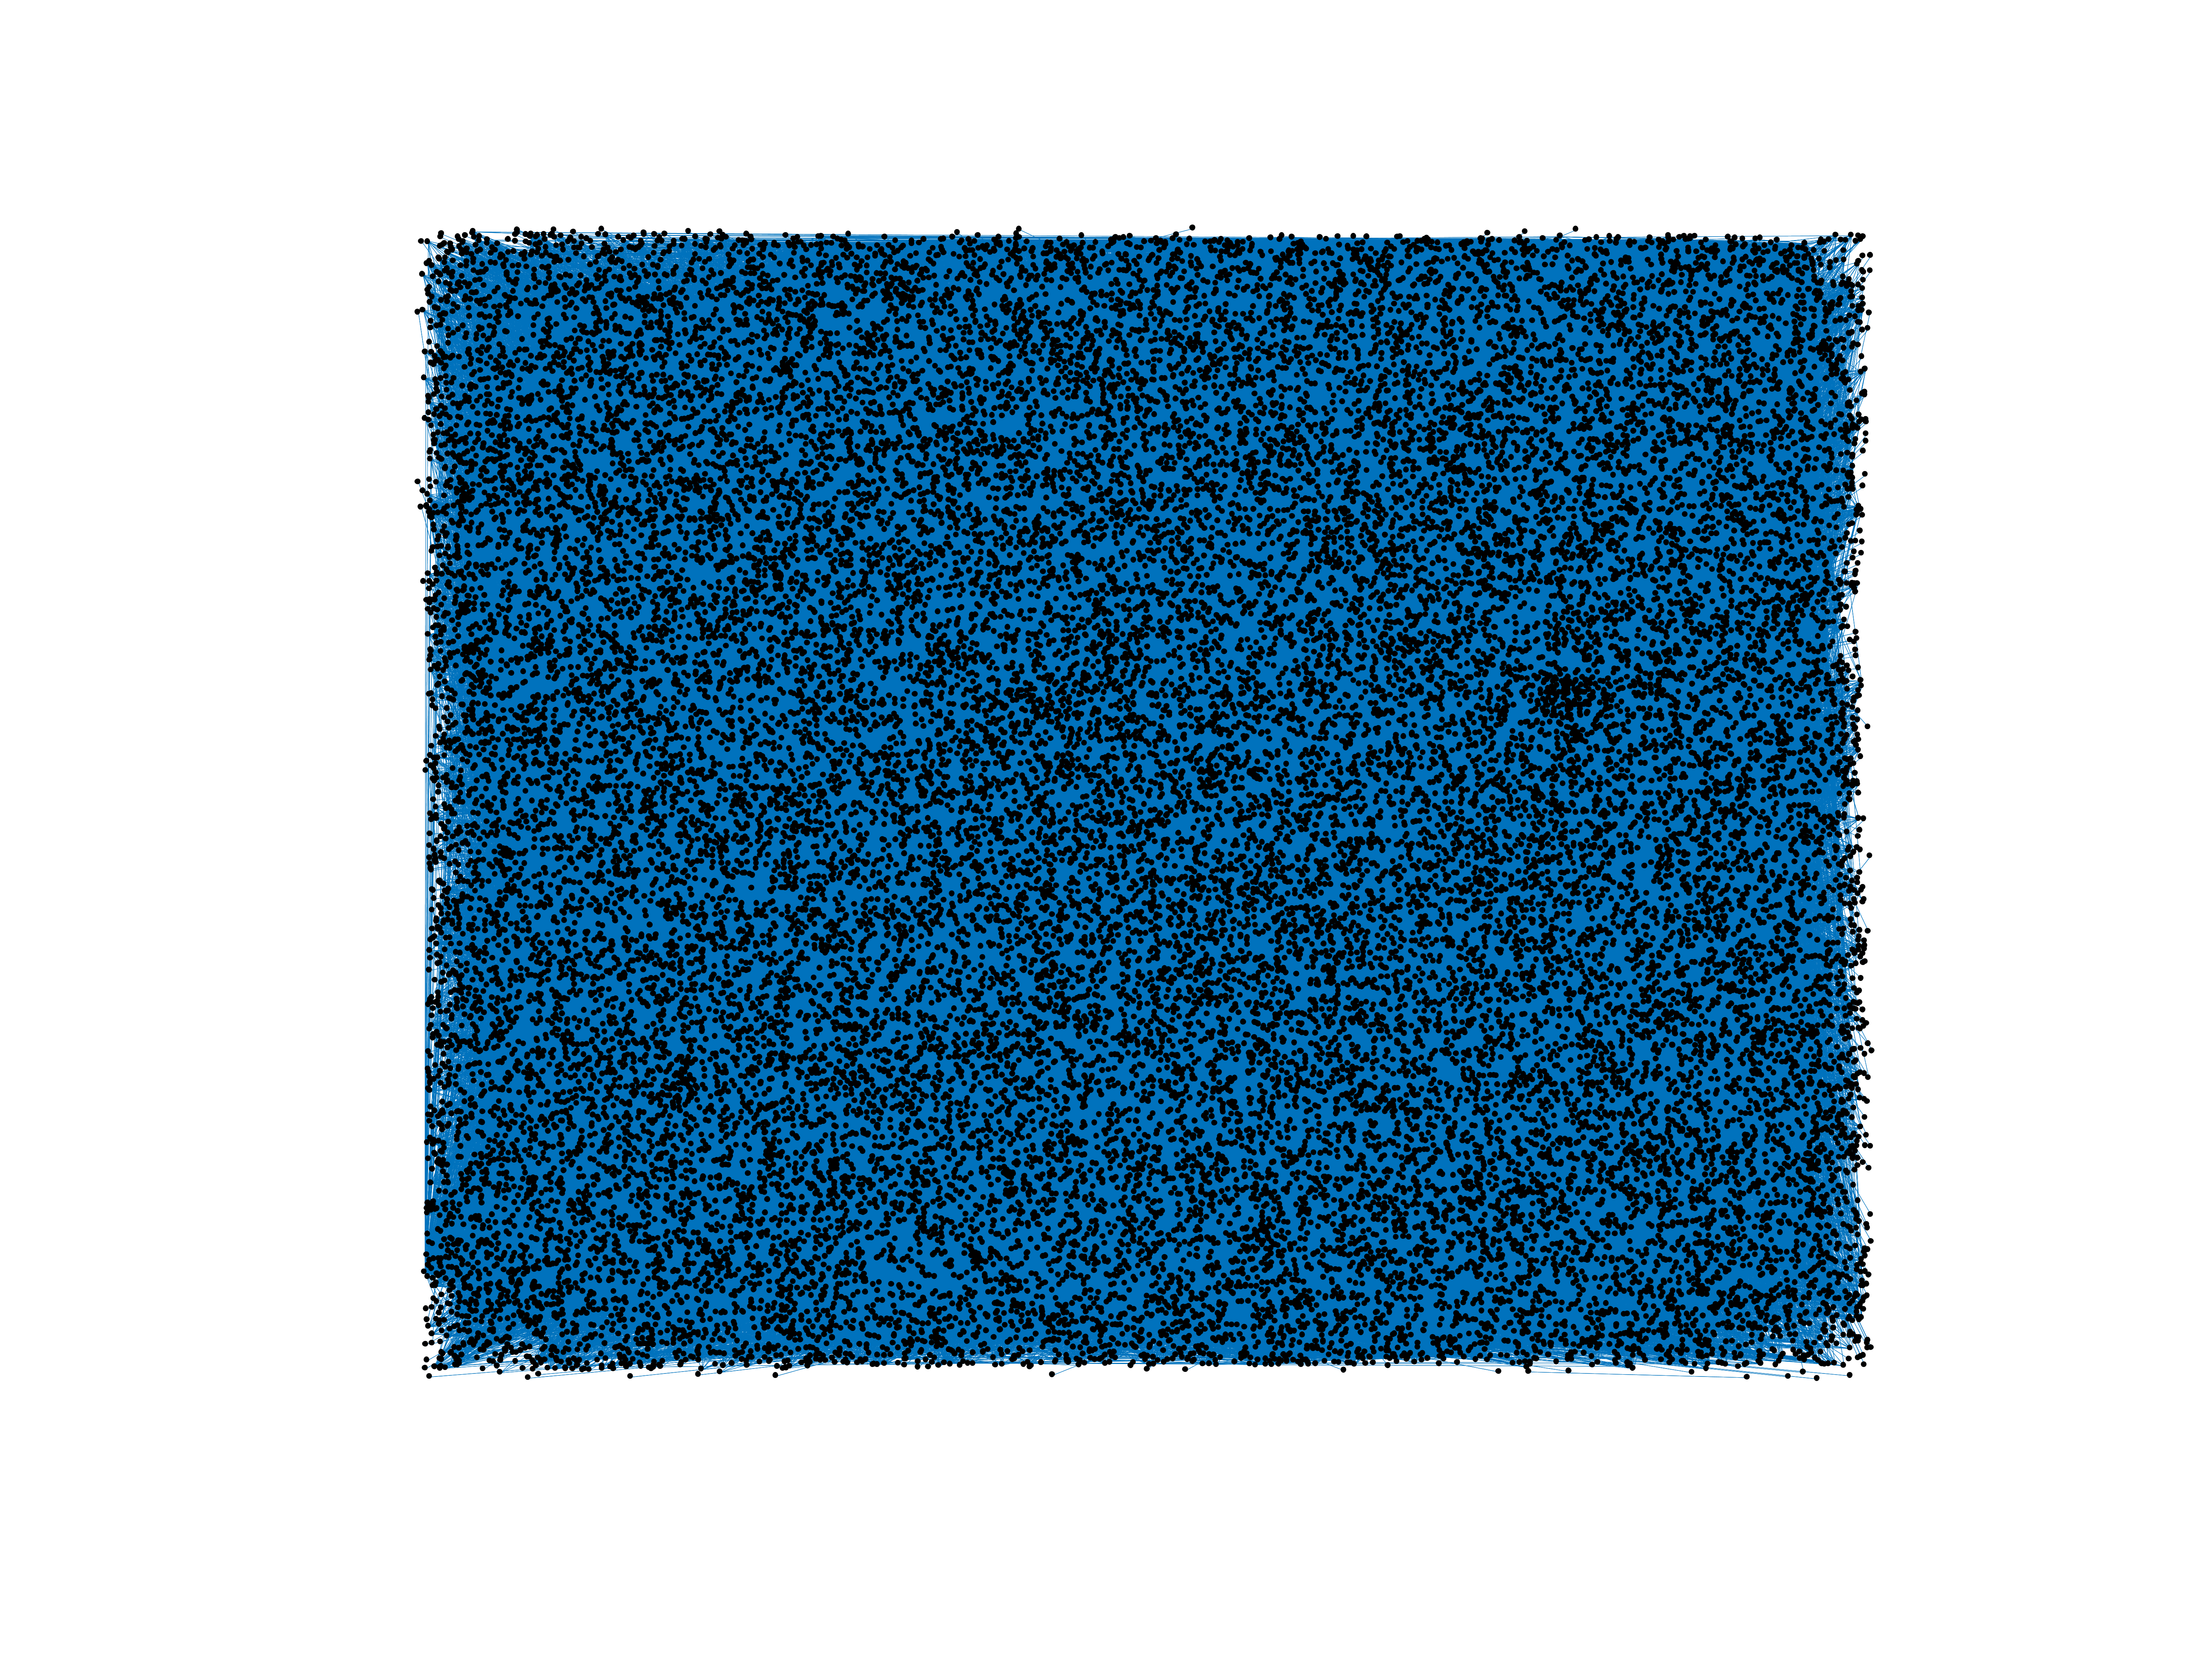
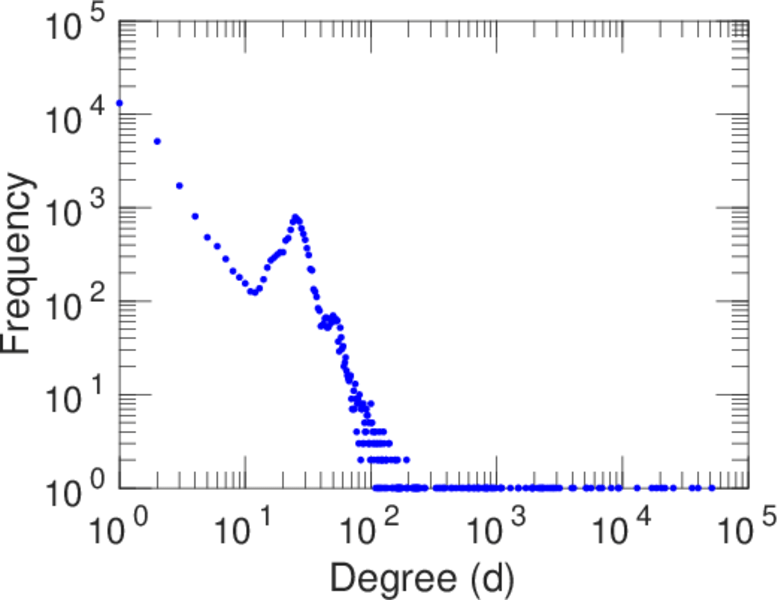
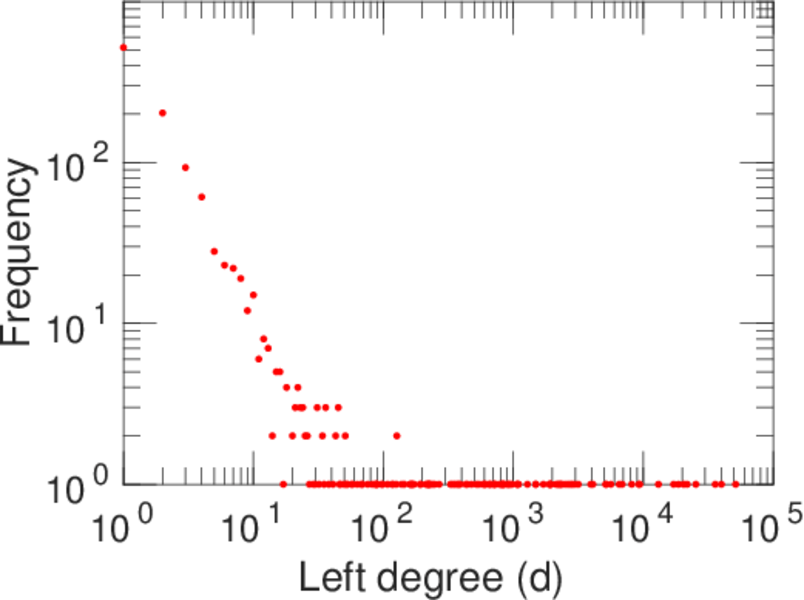
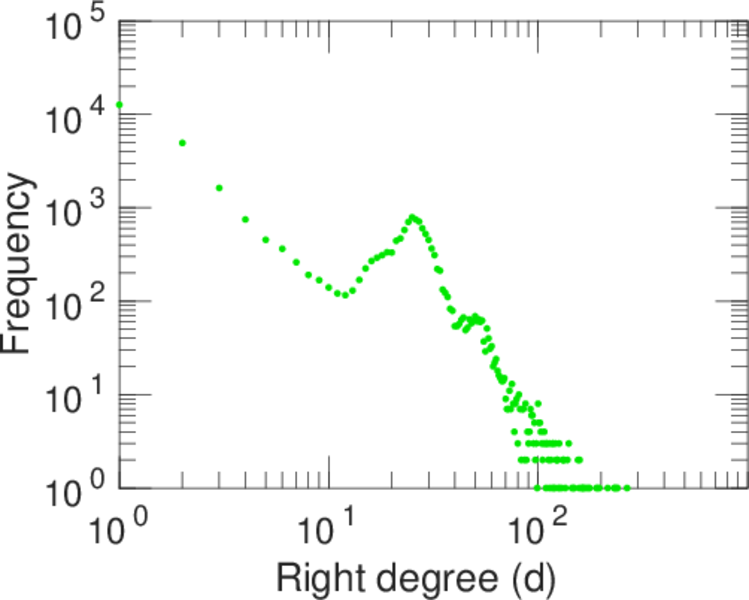
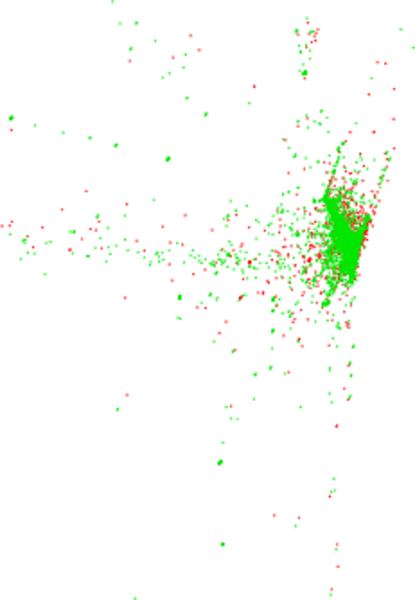
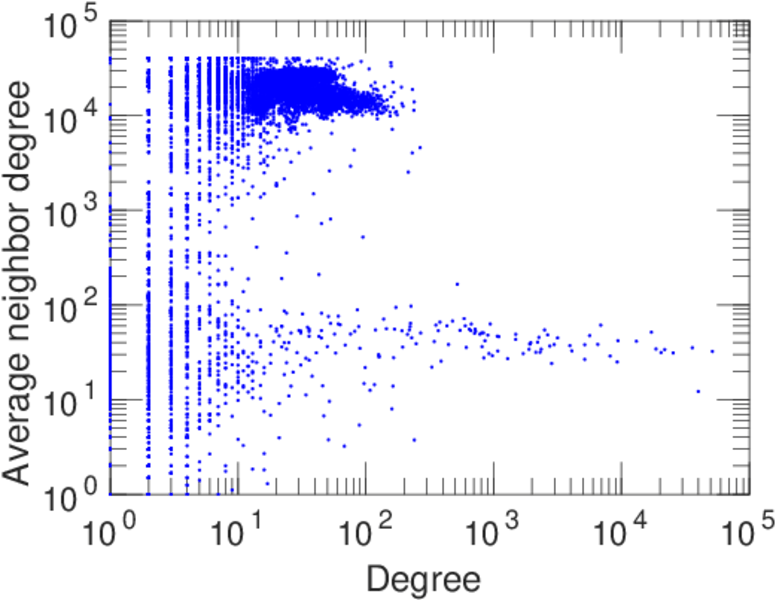
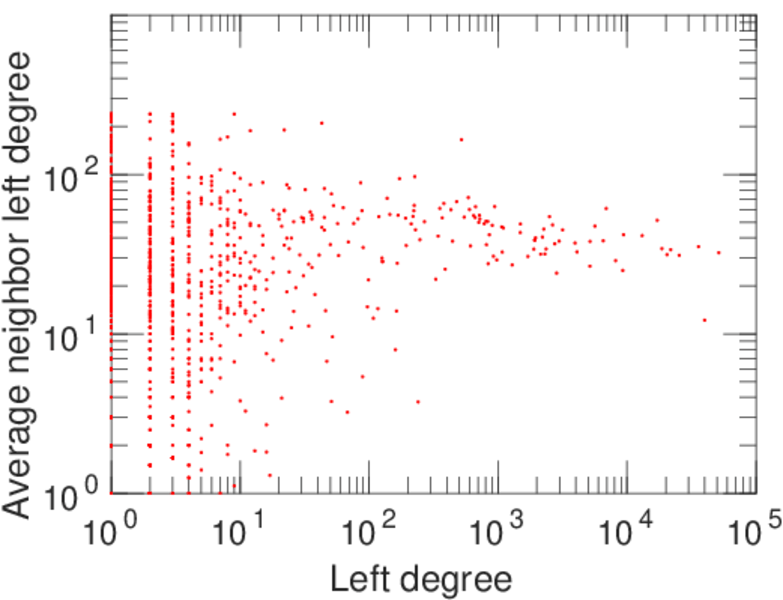
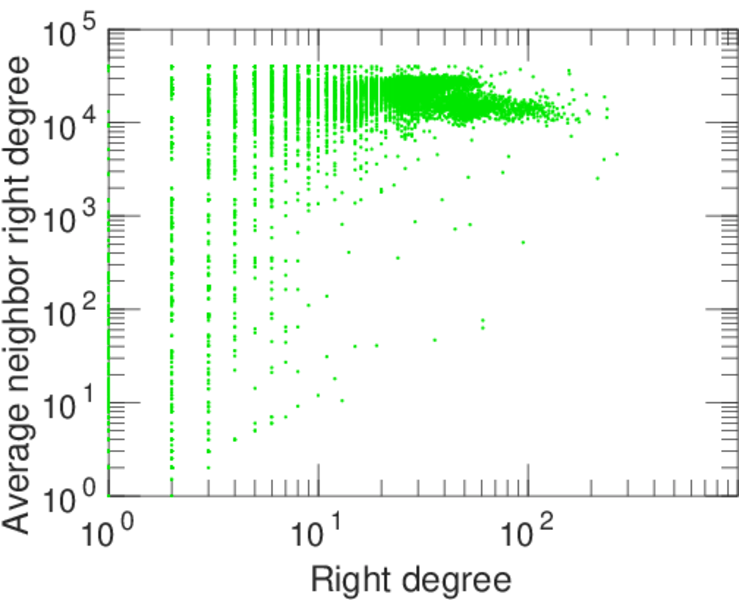
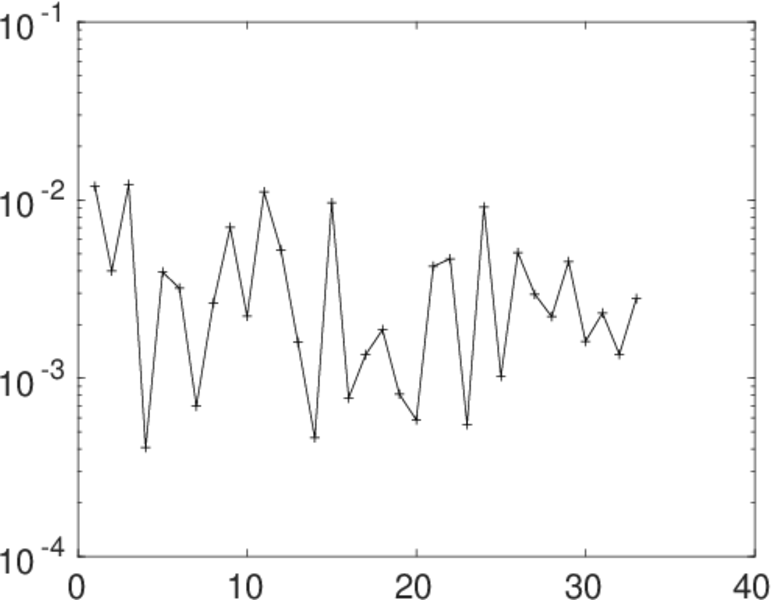
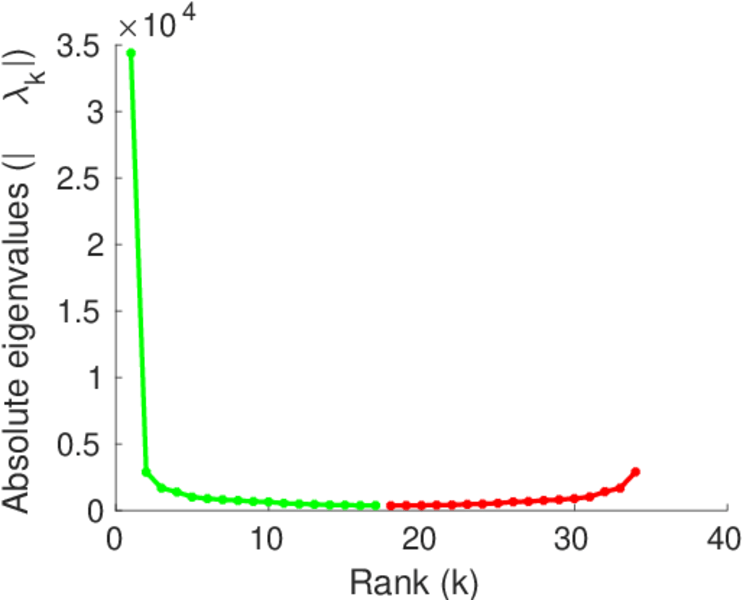
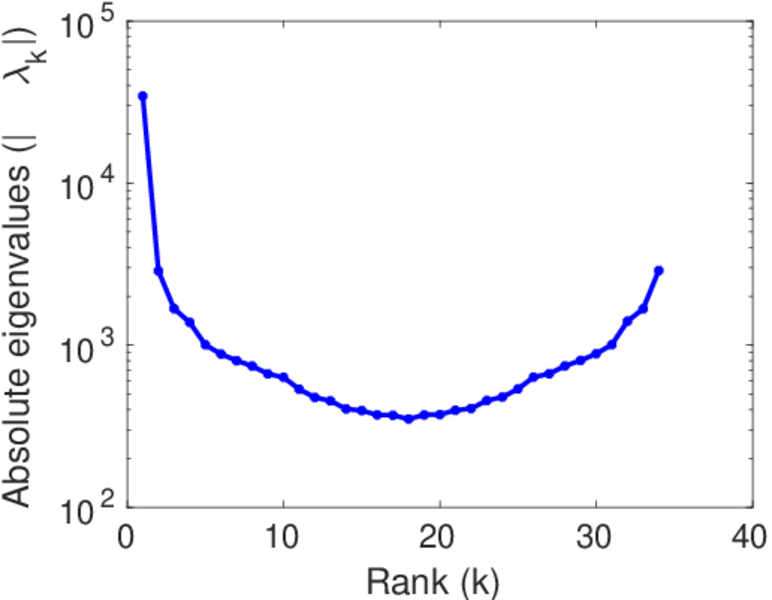
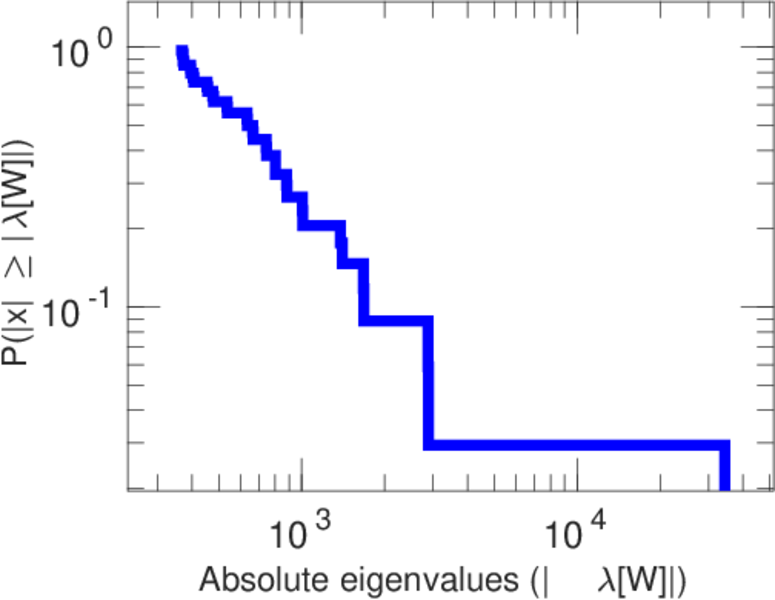
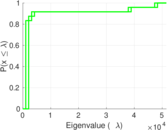
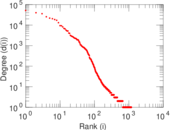
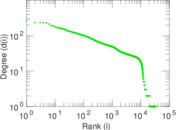
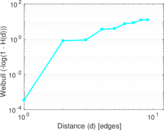
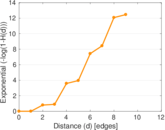
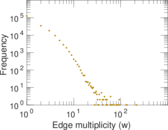
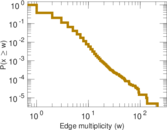
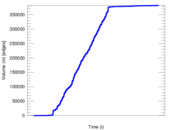
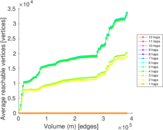
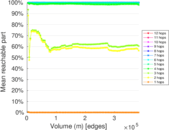
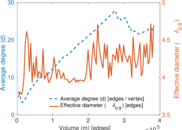
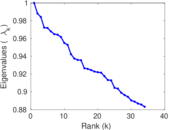
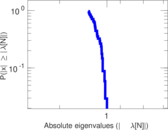
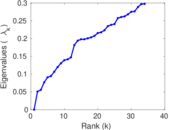
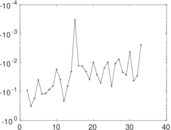
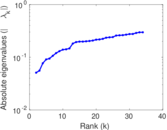
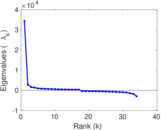
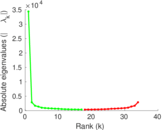
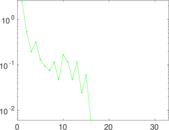
Plots


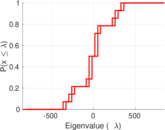
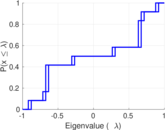
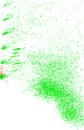


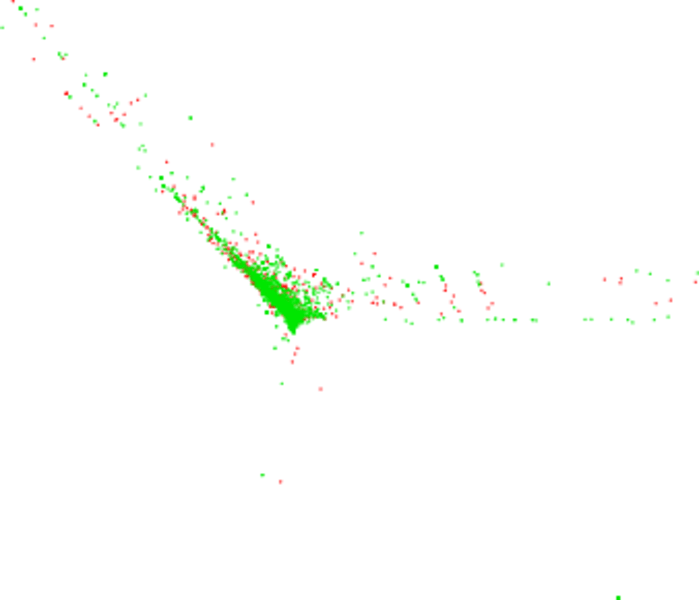
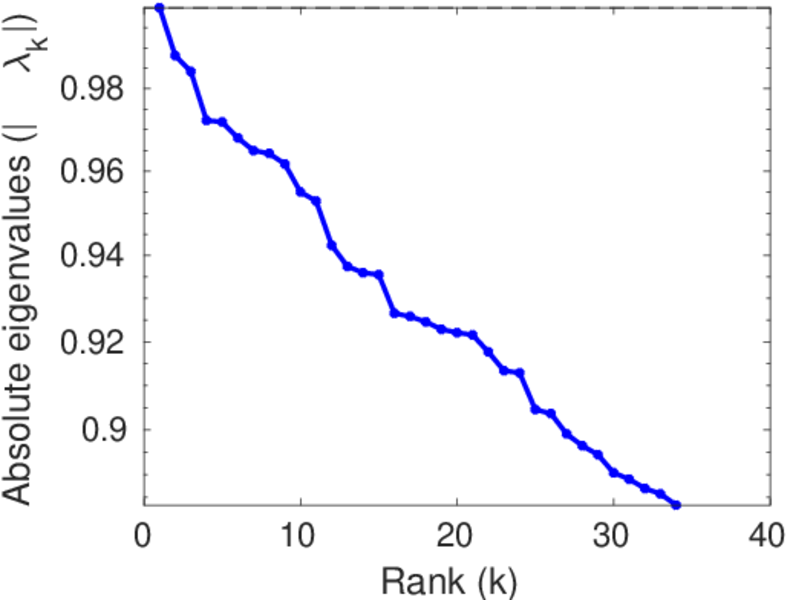
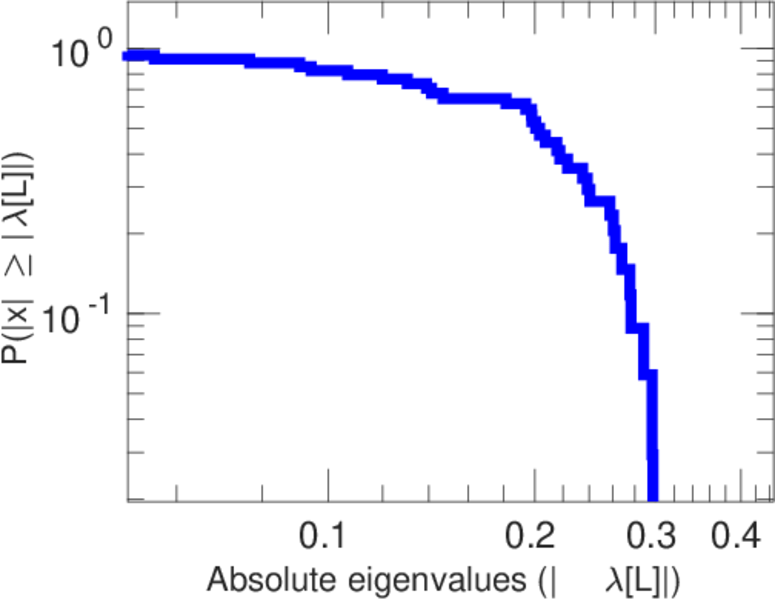
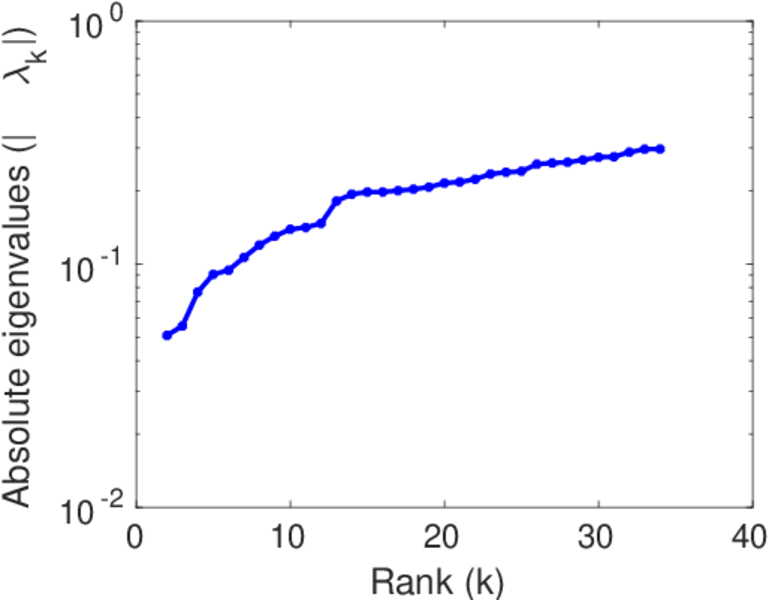
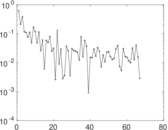
Matrix decompositions plots


Downloads
References
|
[1]
|
Jérôme Kunegis.
KONECT – The Koblenz Network Collection.
In Proc. Int. Conf. on World Wide Web Companion, pages
1343–1350, 2013.
[ http ]
|
|
[2]
|
Wikimedia Foundation.
Wikimedia downloads.
http://dumps.wikimedia.org/, January 2010.
|
 KONECT ‣ Networks ‣
Buy Me a Coffee
KONECT ‣ Networks ‣
Buy Me a Coffee