Wikipedia edits (ga)
This is the bipartite edit network of the Irish Wikipedia. It contains users
and pages from the Irish Wikipedia, connected by edit events. Each edge
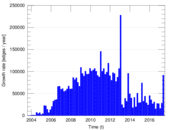
represents an edit. The dataset includes the timestamp of each edit.
Metadata
Statistics
| Size | n = | 71,677
|
| Left size | n1 = | 3,936
|
| Right size | n2 = | 67,741
|
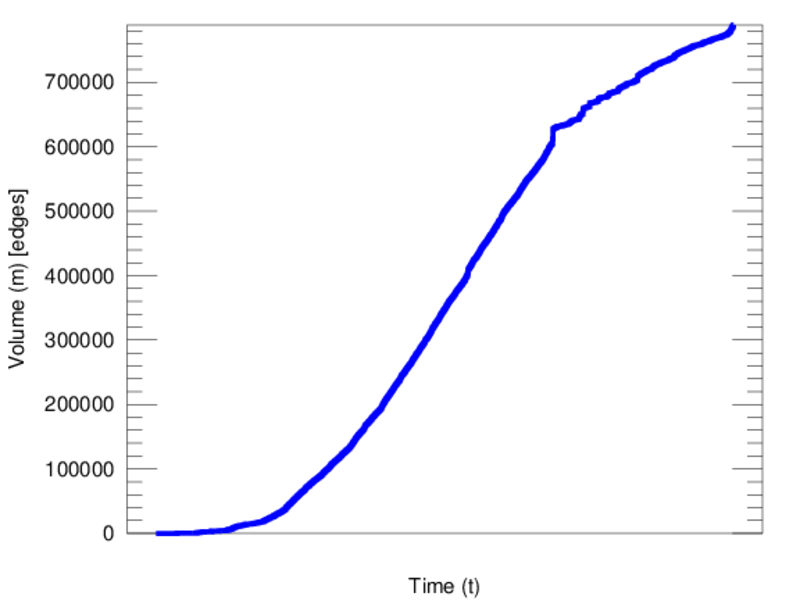
| Volume | m = | 789,085
|
| Unique edge count | m̿ = | 373,422
|
| Wedge count | s = | 1,303,541,184
|
| Claw count | z = | 5,087,573,426,588
|
| Cross count | x = | 17,693,773,241,769,704
|
| Square count | q = | 2,843,936,563
|
| 4-Tour count | T4 = | 27,966,581,052
|
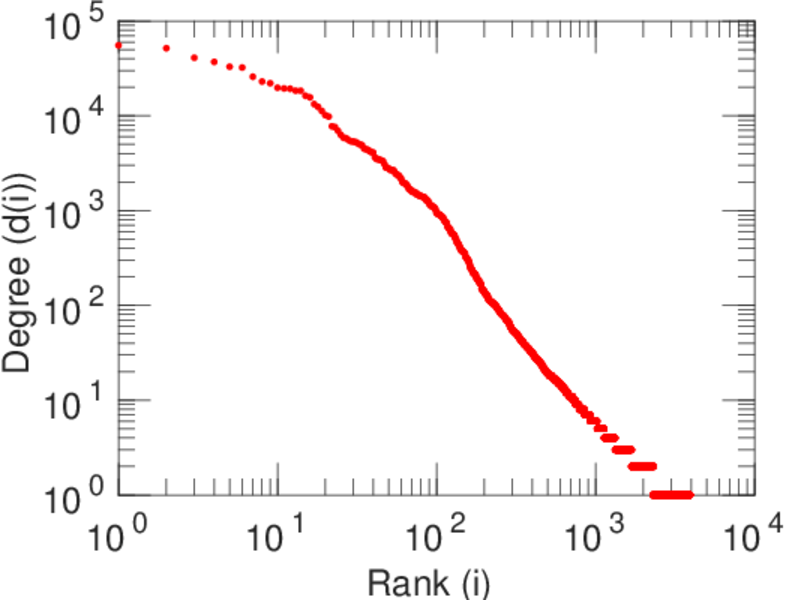
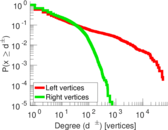
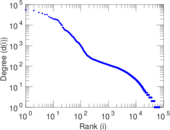
| Maximum degree | dmax = | 55,265
|
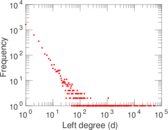
| Maximum left degree | d1max = | 55,265
|
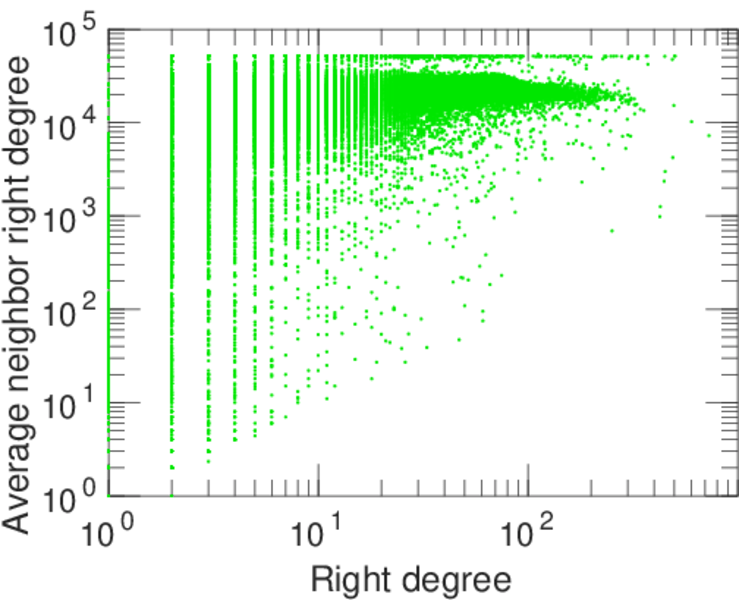
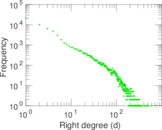
| Maximum right degree | d2max = | 731
|
| Average degree | d = | 22.017 8
|
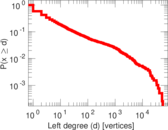
| Average left degree | d1 = | 200.479
|
| Average right degree | d2 = | 11.648 6
|
| Fill | p = | 0.001 400 53
|
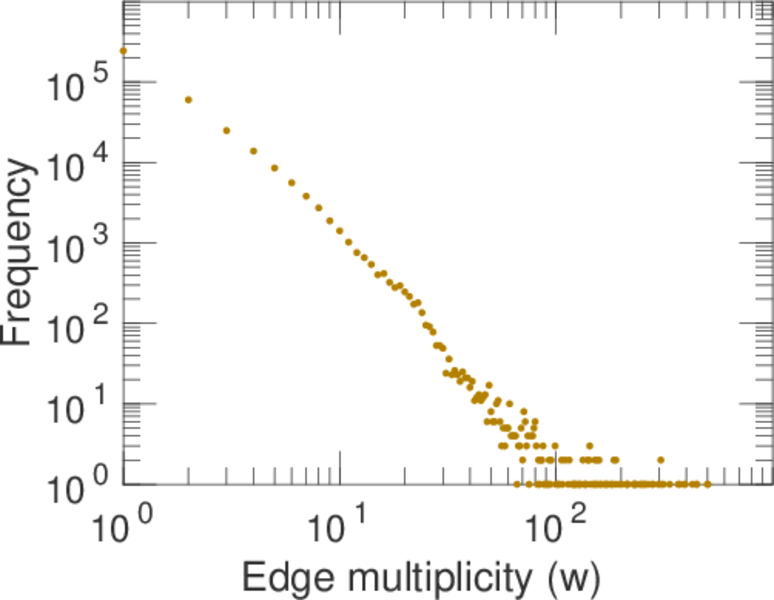
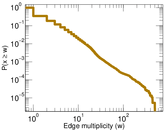
| Average edge multiplicity | m̃ = | 2.113 12
|
| Size of LCC | N = | 69,764
|
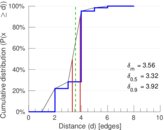
| Diameter | δ = | 10
|
| 50-Percentile effective diameter | δ0.5 = | 3.323 11
|
| 90-Percentile effective diameter | δ0.9 = | 3.920 85
|
| Median distance | δM = | 4
|
| Mean distance | δm = | 3.559 82
|
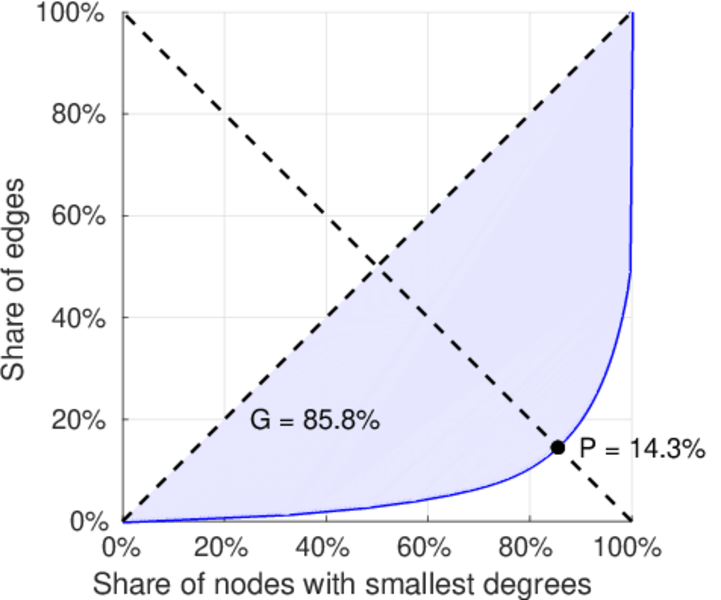
| Gini coefficient | G = | 0.859 887
|
| Balanced inequality ratio | P = | 0.142 962
|
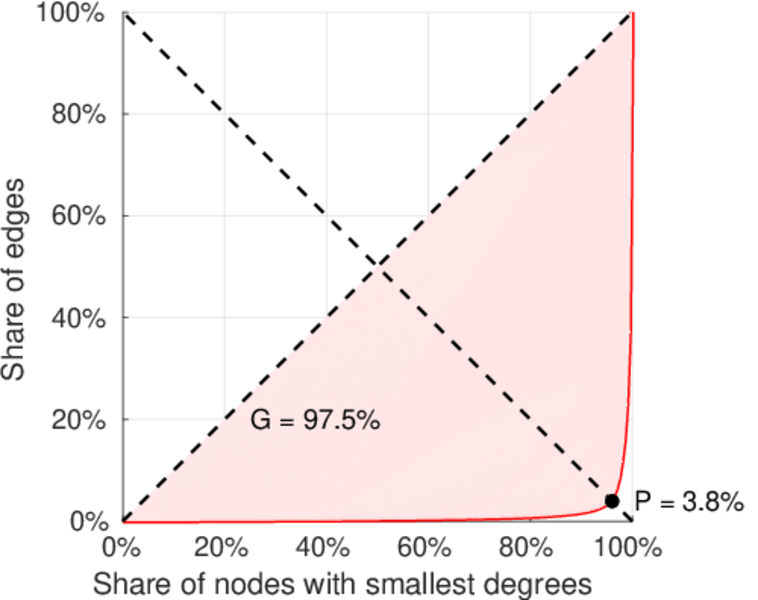
| Left balanced inequality ratio | P1 = | 0.037 798 2
|
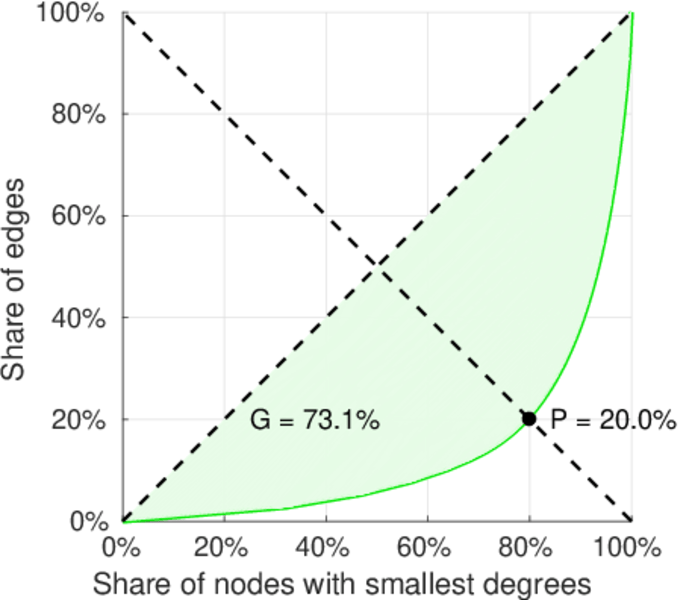
| Right balanced inequality ratio | P2 = | 0.199 630
|
| Relative edge distribution entropy | Her = | 0.735 153
|
| Power law exponent | γ = | 2.007 12
|
| Tail power law exponent | γt = | 1.821 00
|
| Tail power law exponent with p | γ3 = | 1.821 00
|
| p-value | p = | 0.000 00
|
| Left tail power law exponent with p | γ3,1 = | 1.701 00
|
| Left p-value | p1 = | 0.000 00
|
| Right tail power law exponent with p | γ3,2 = | 6.241 00
|
| Right p-value | p2 = | 0.000 00
|
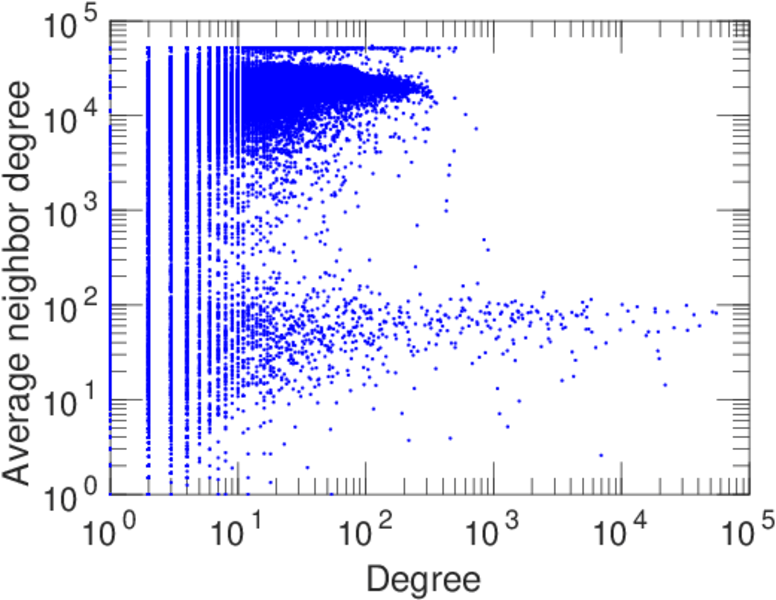
| Degree assortativity | ρ = | −0.262 871
|
| Degree assortativity p-value | pρ = | 0.000 00
|
| Algebraic connectivity | a = | 0.076 899 0
|
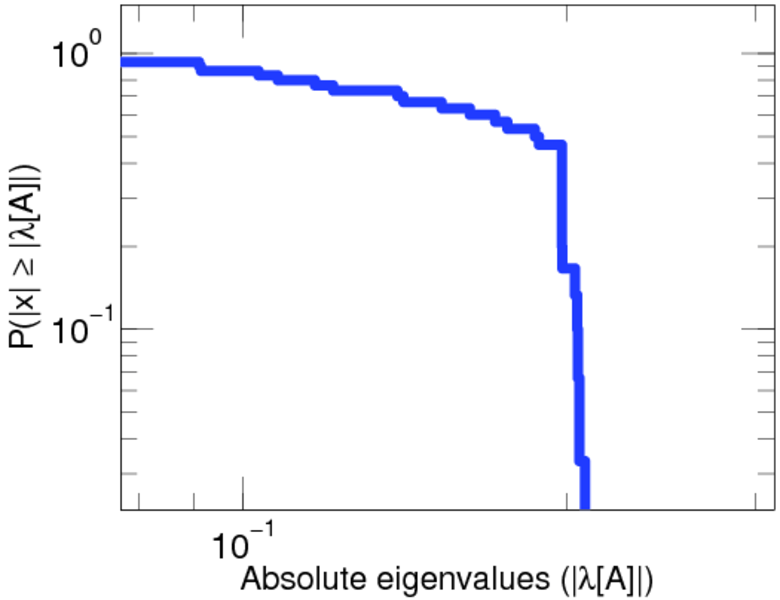
| Spectral separation | |λ1[A] / λ2[A]| = | 1.500 48
|
| Controllability | C = | 63,377
|
| Relative controllability | Cr = | 0.896 574
|
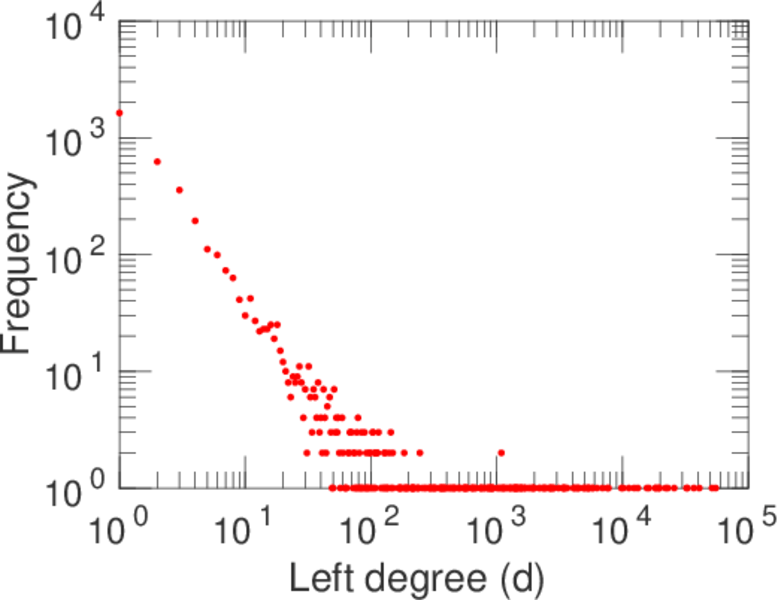
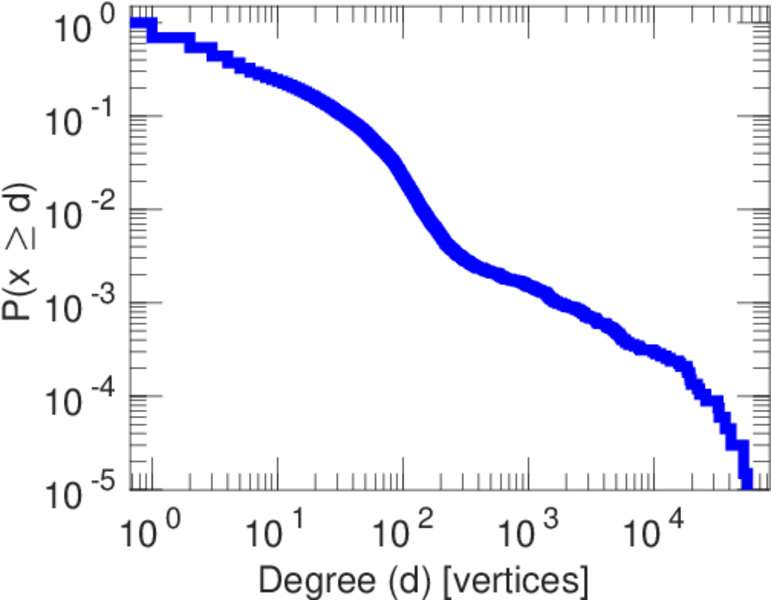
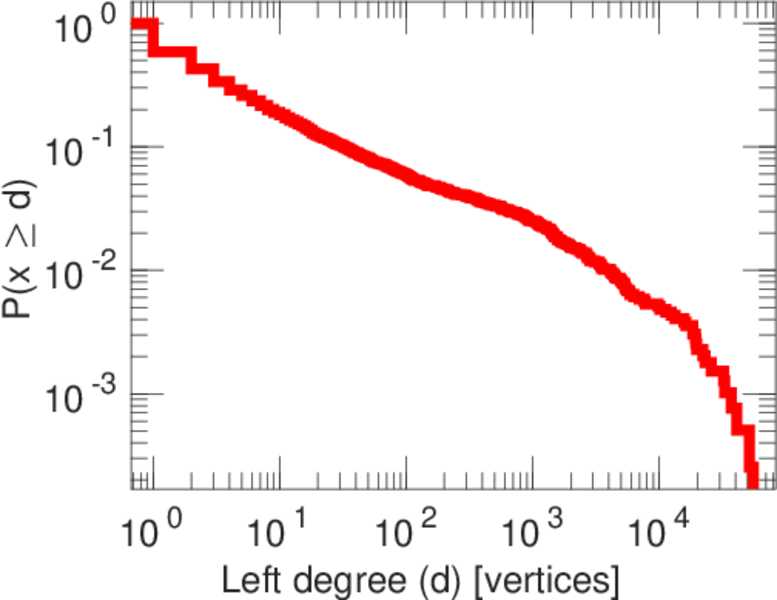
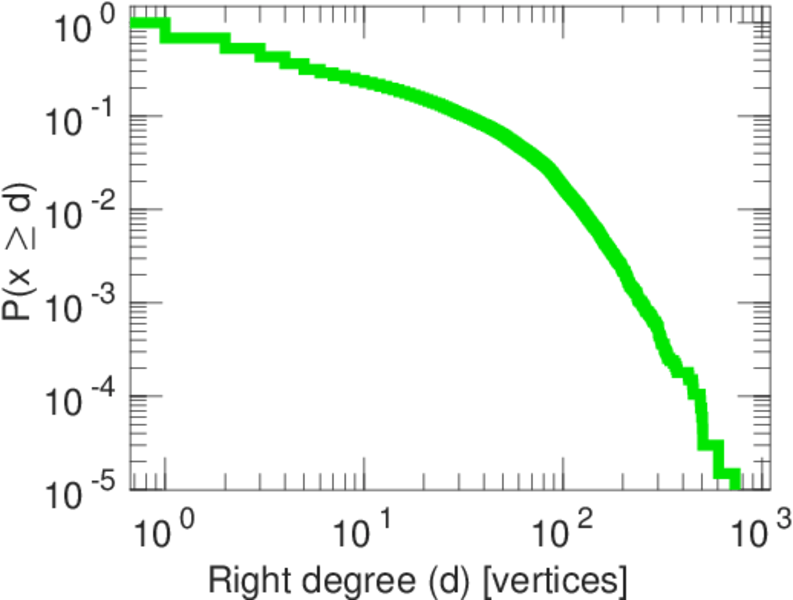
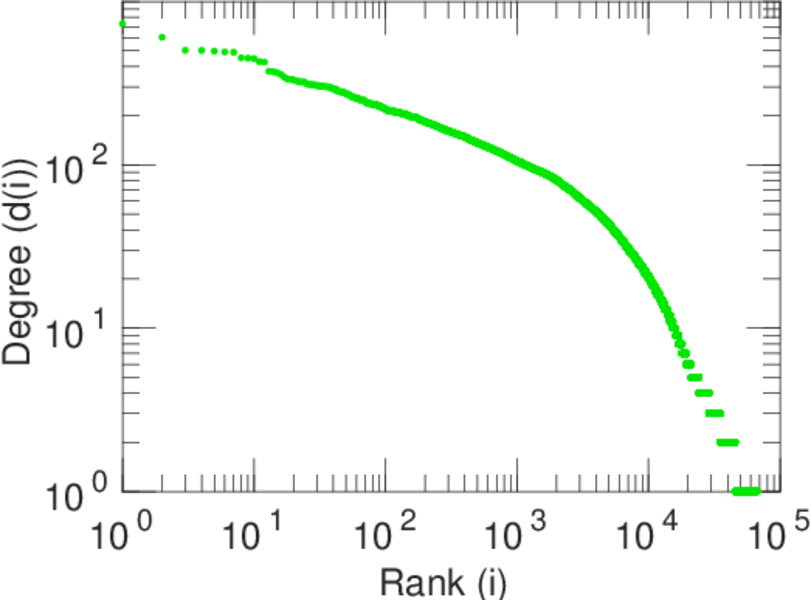
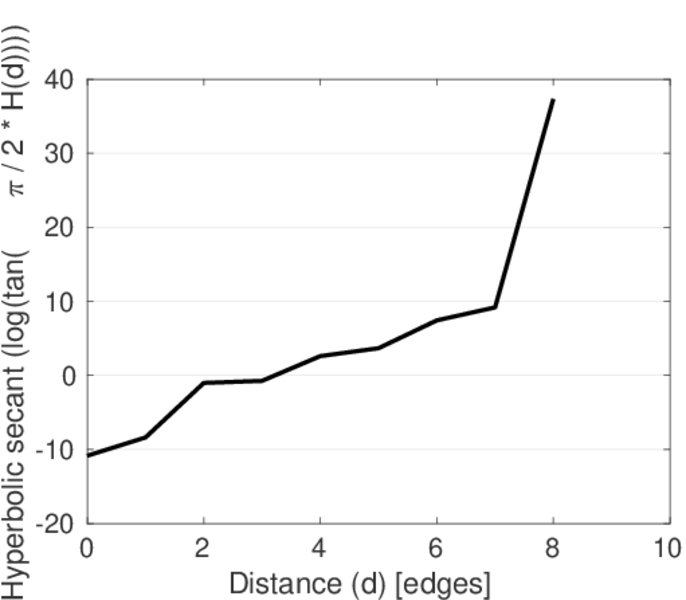
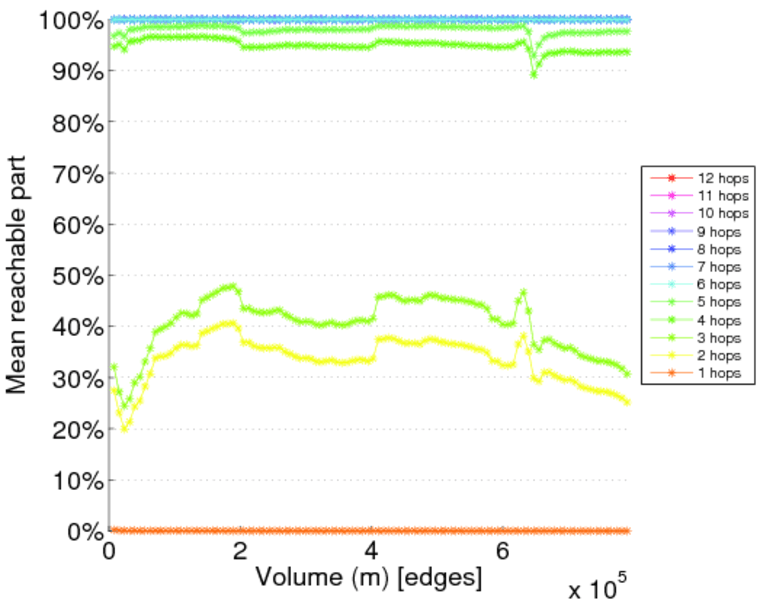
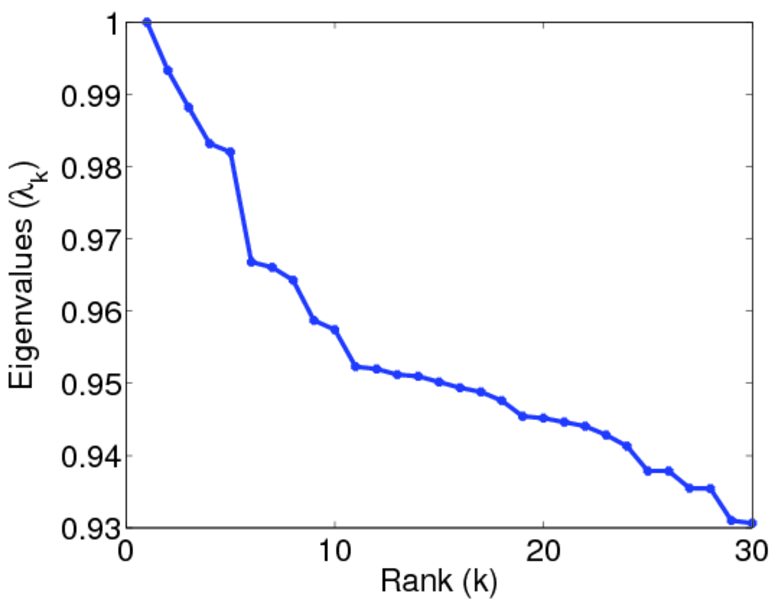
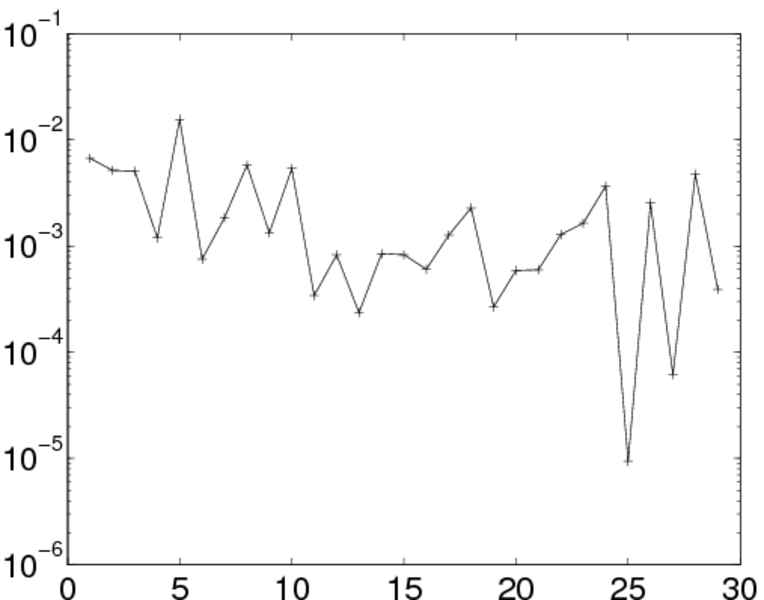
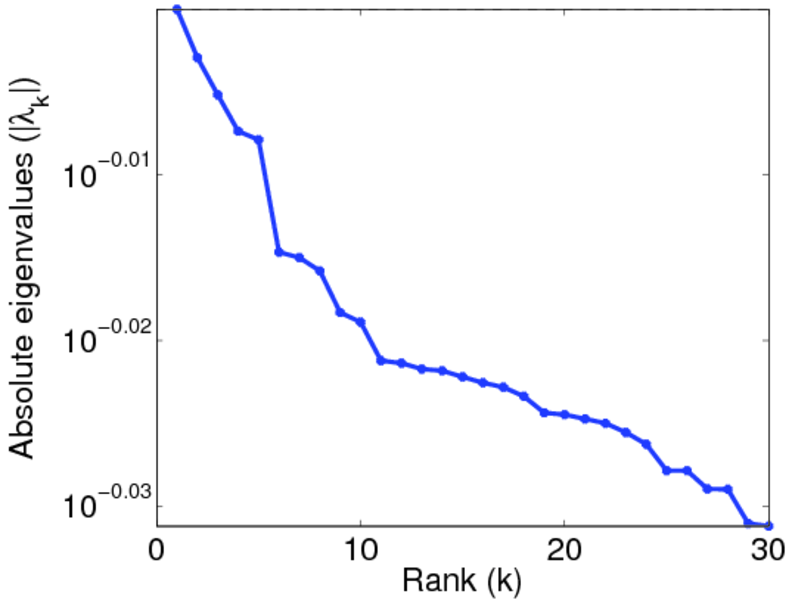
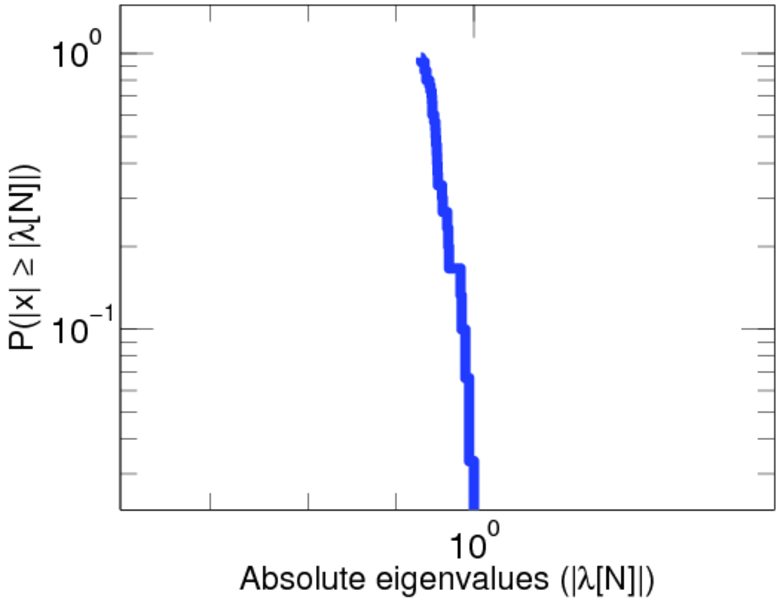
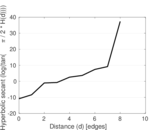
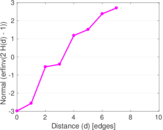
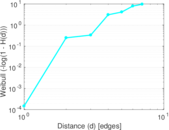
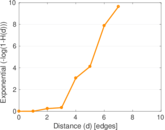
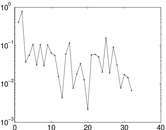
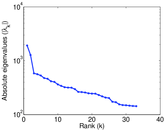
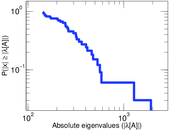
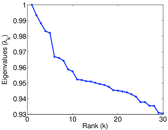
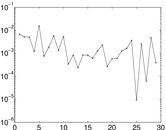
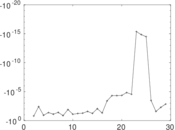
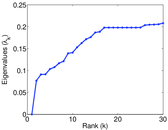
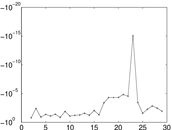
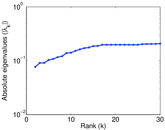
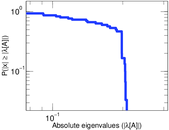
Plots


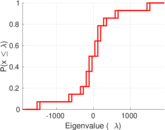

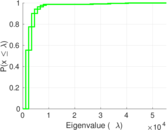


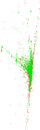


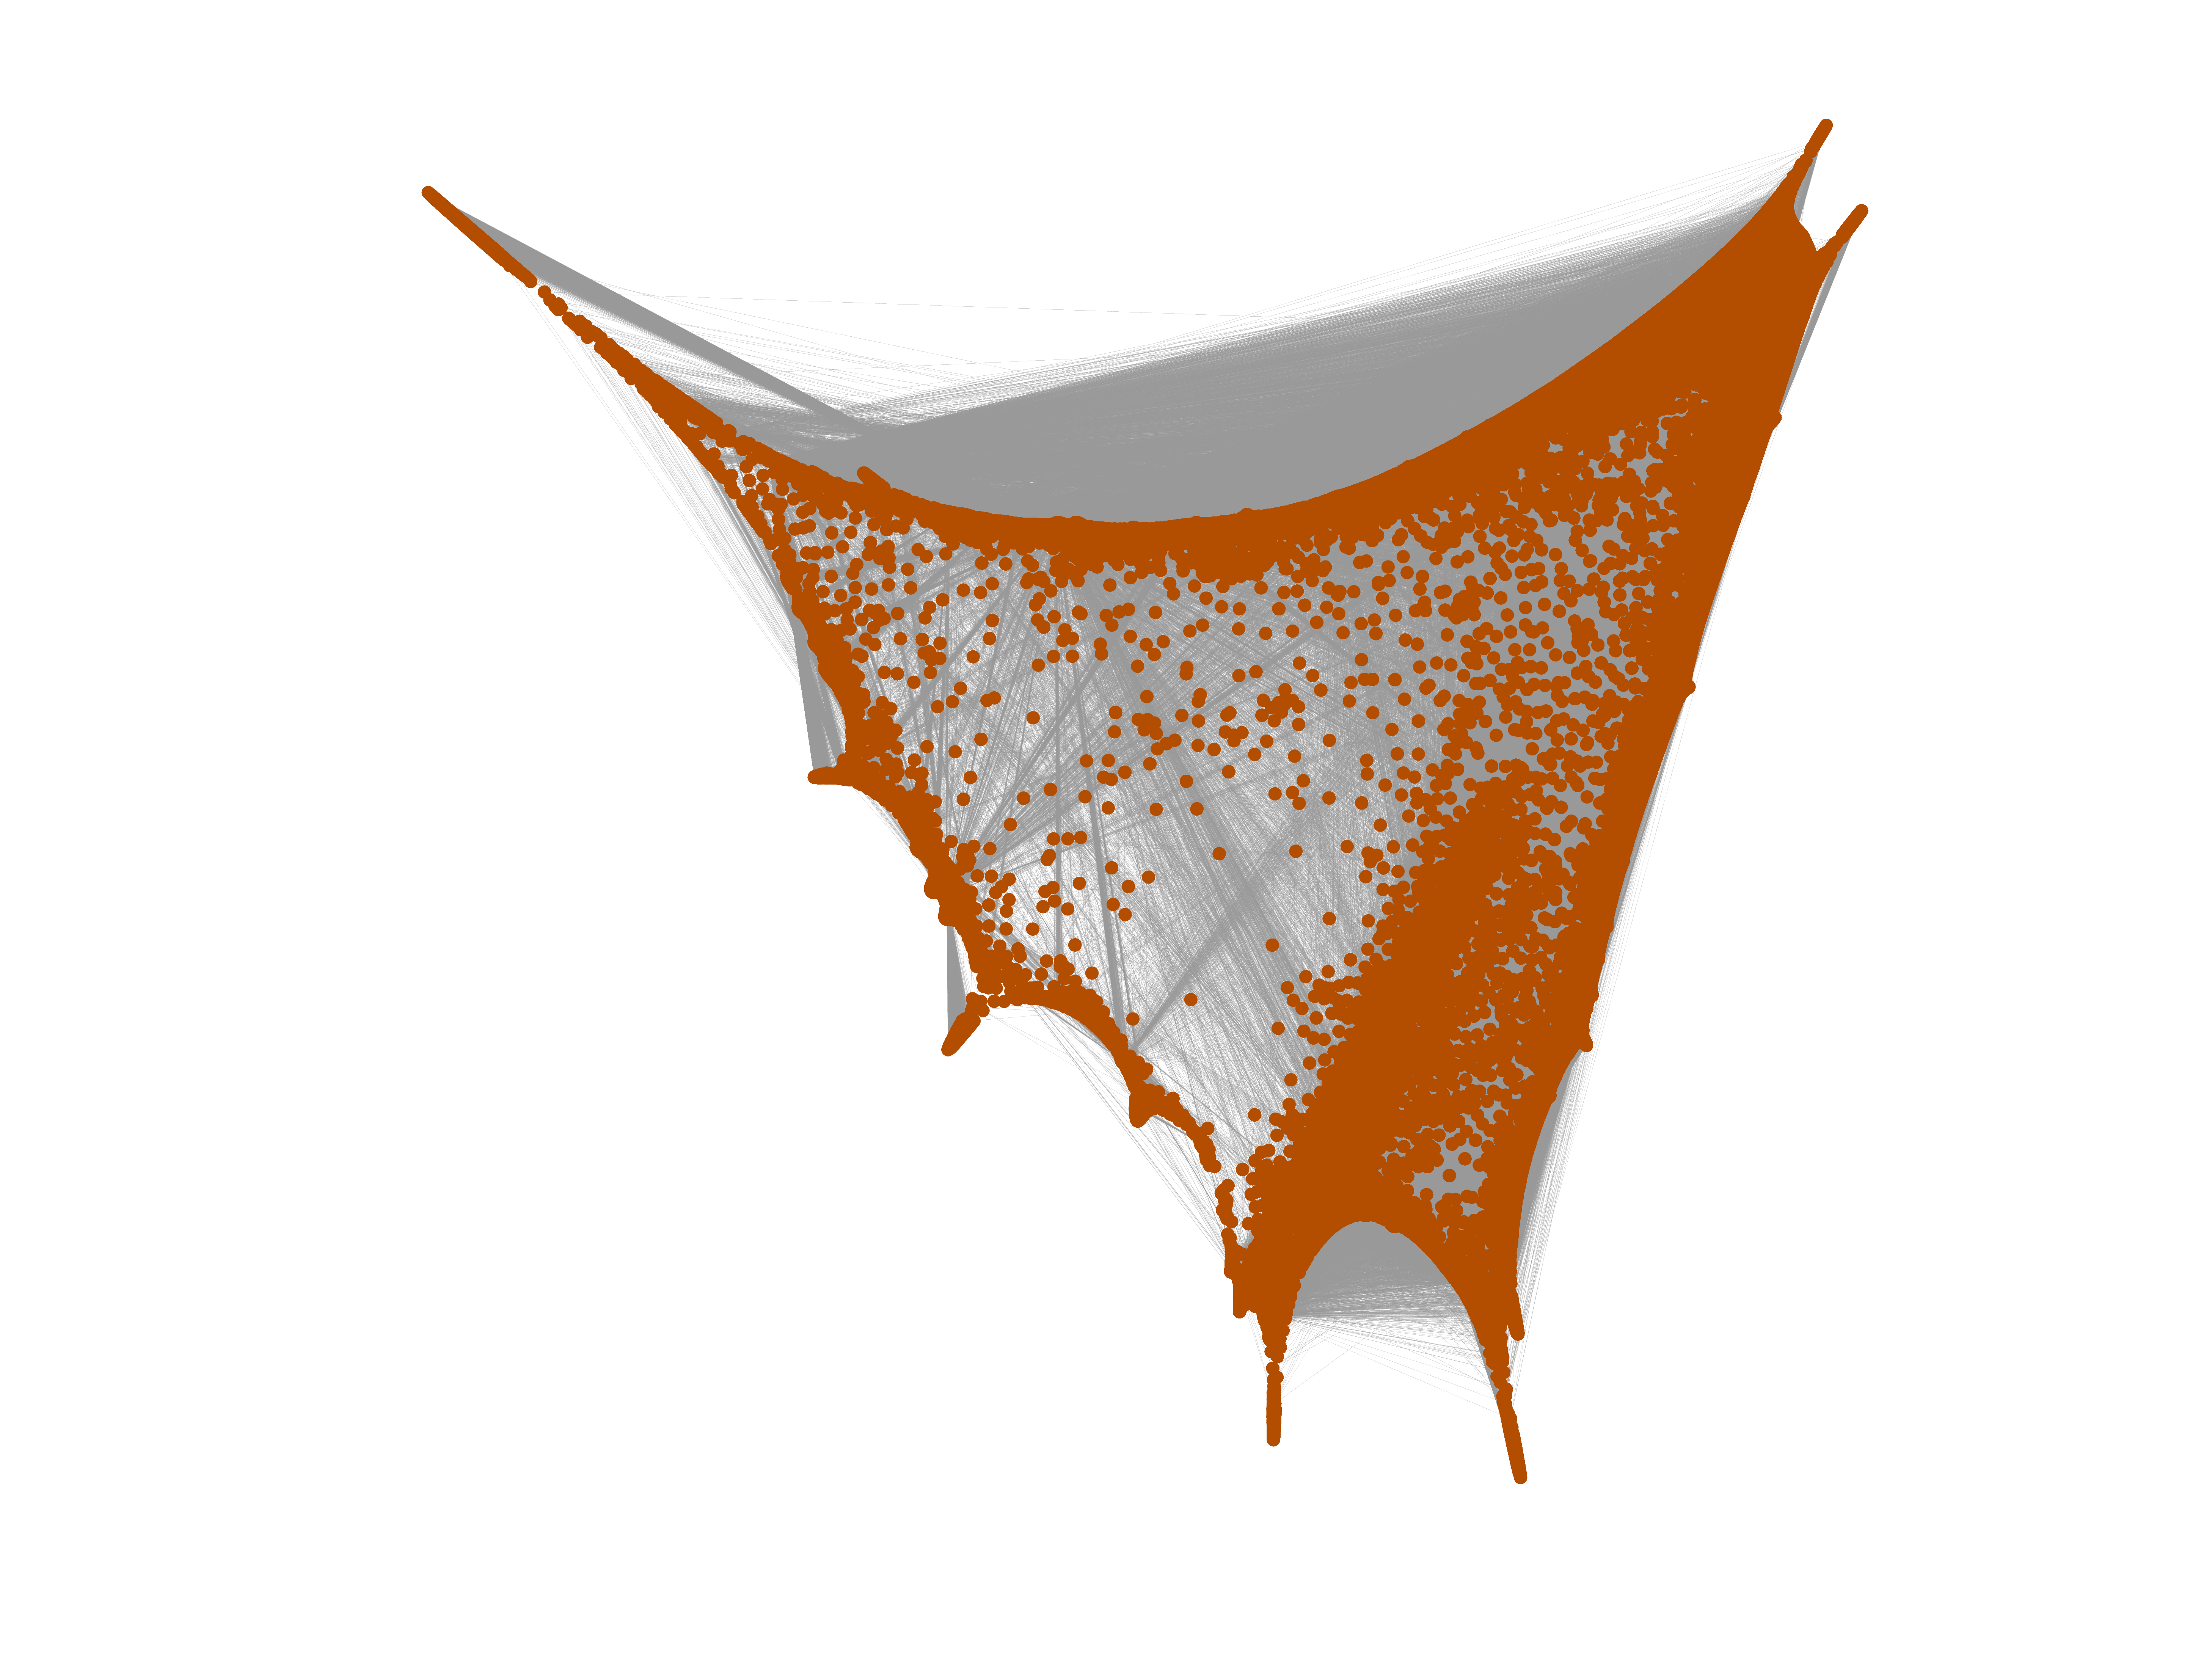
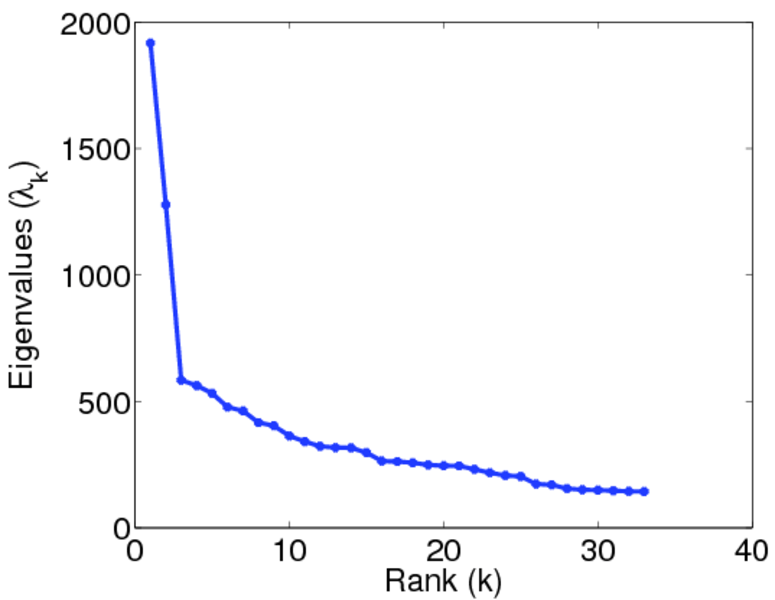
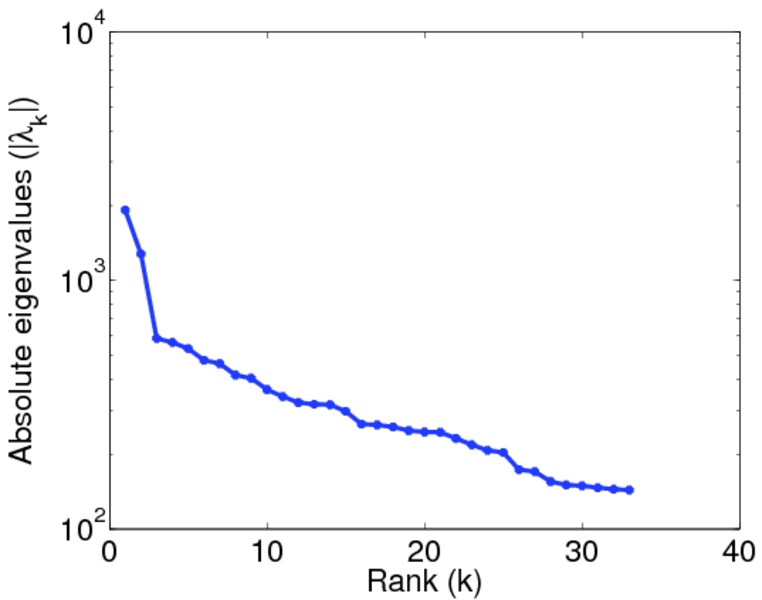
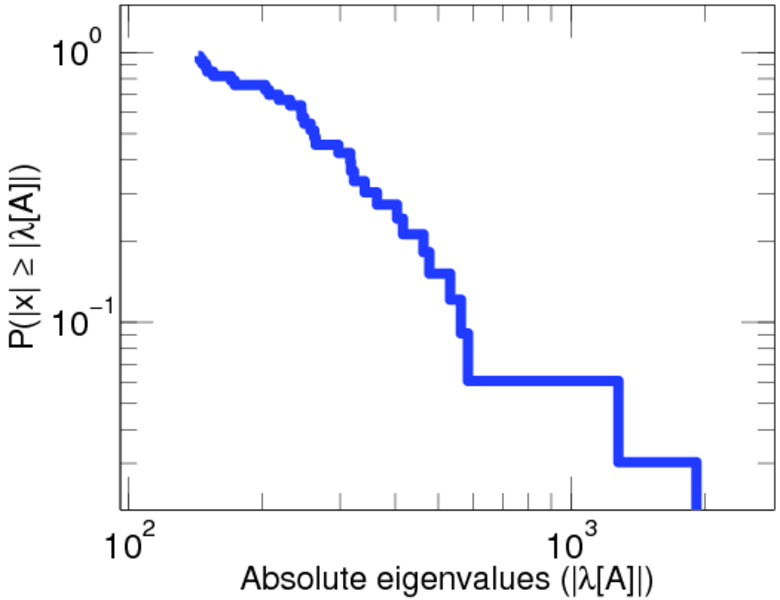
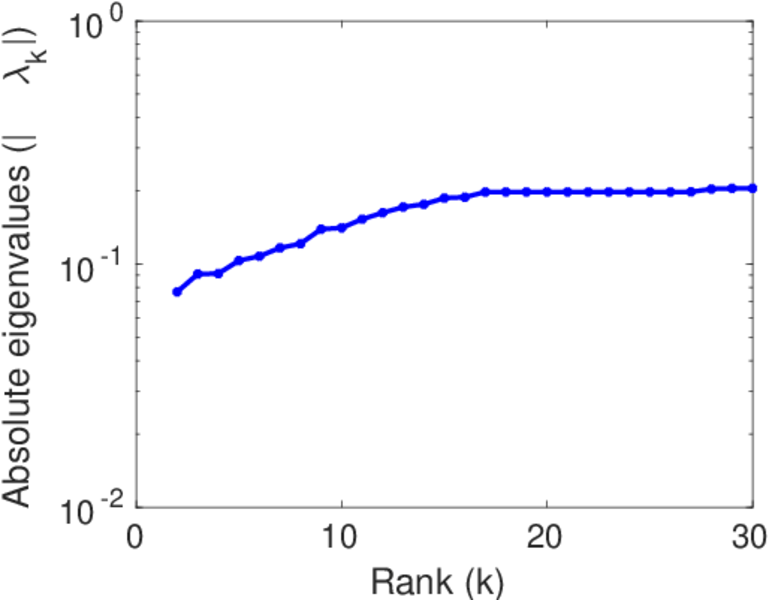
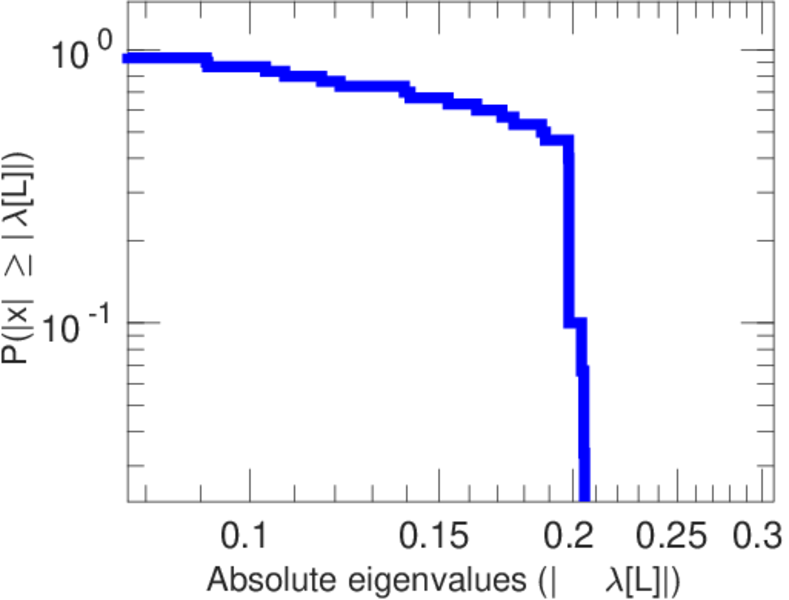
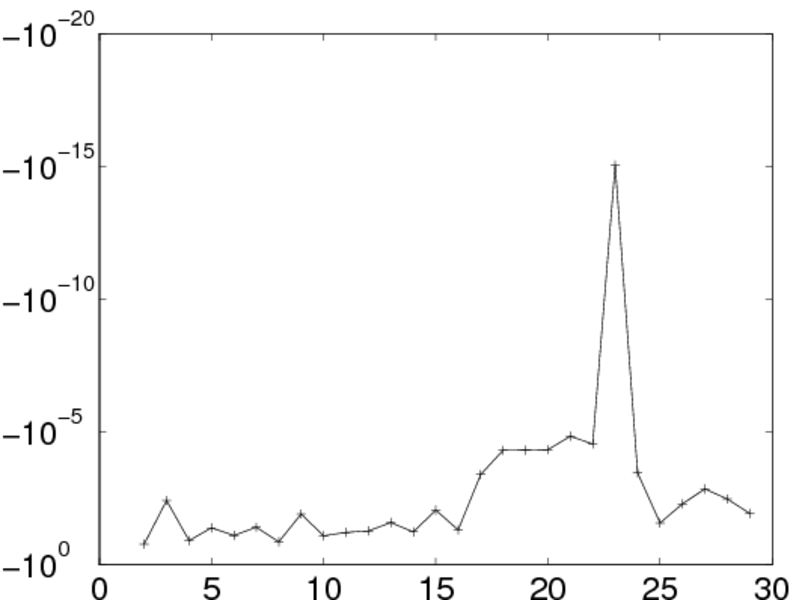
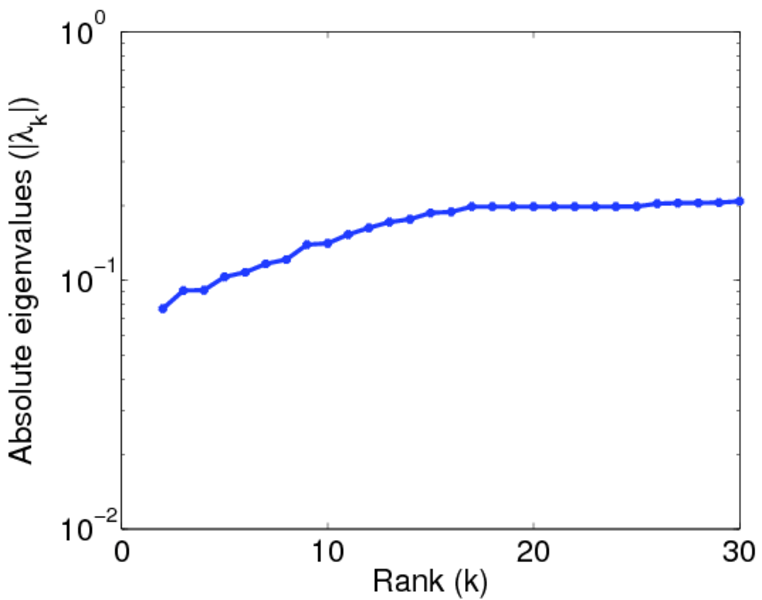
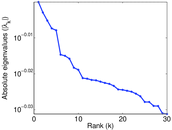
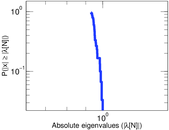
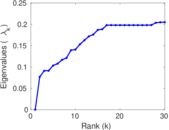
Matrix decompositions plots


Downloads
References
|
[1]
|
Jérôme Kunegis.
KONECT – The Koblenz Network Collection.
In Proc. Int. Conf. on World Wide Web Companion, pages
1343–1350, 2013.
[ http ]
|
|
[2]
|
Wikimedia Foundation.
Wikimedia downloads.
http://dumps.wikimedia.org/, January 2010.
|
 KONECT ‣ Networks ‣
Buy Me a Coffee
KONECT ‣ Networks ‣
Buy Me a Coffee