 KONECT ‣ Networks ‣
Buy Me a Coffee
KONECT ‣ Networks ‣
Buy Me a Coffee
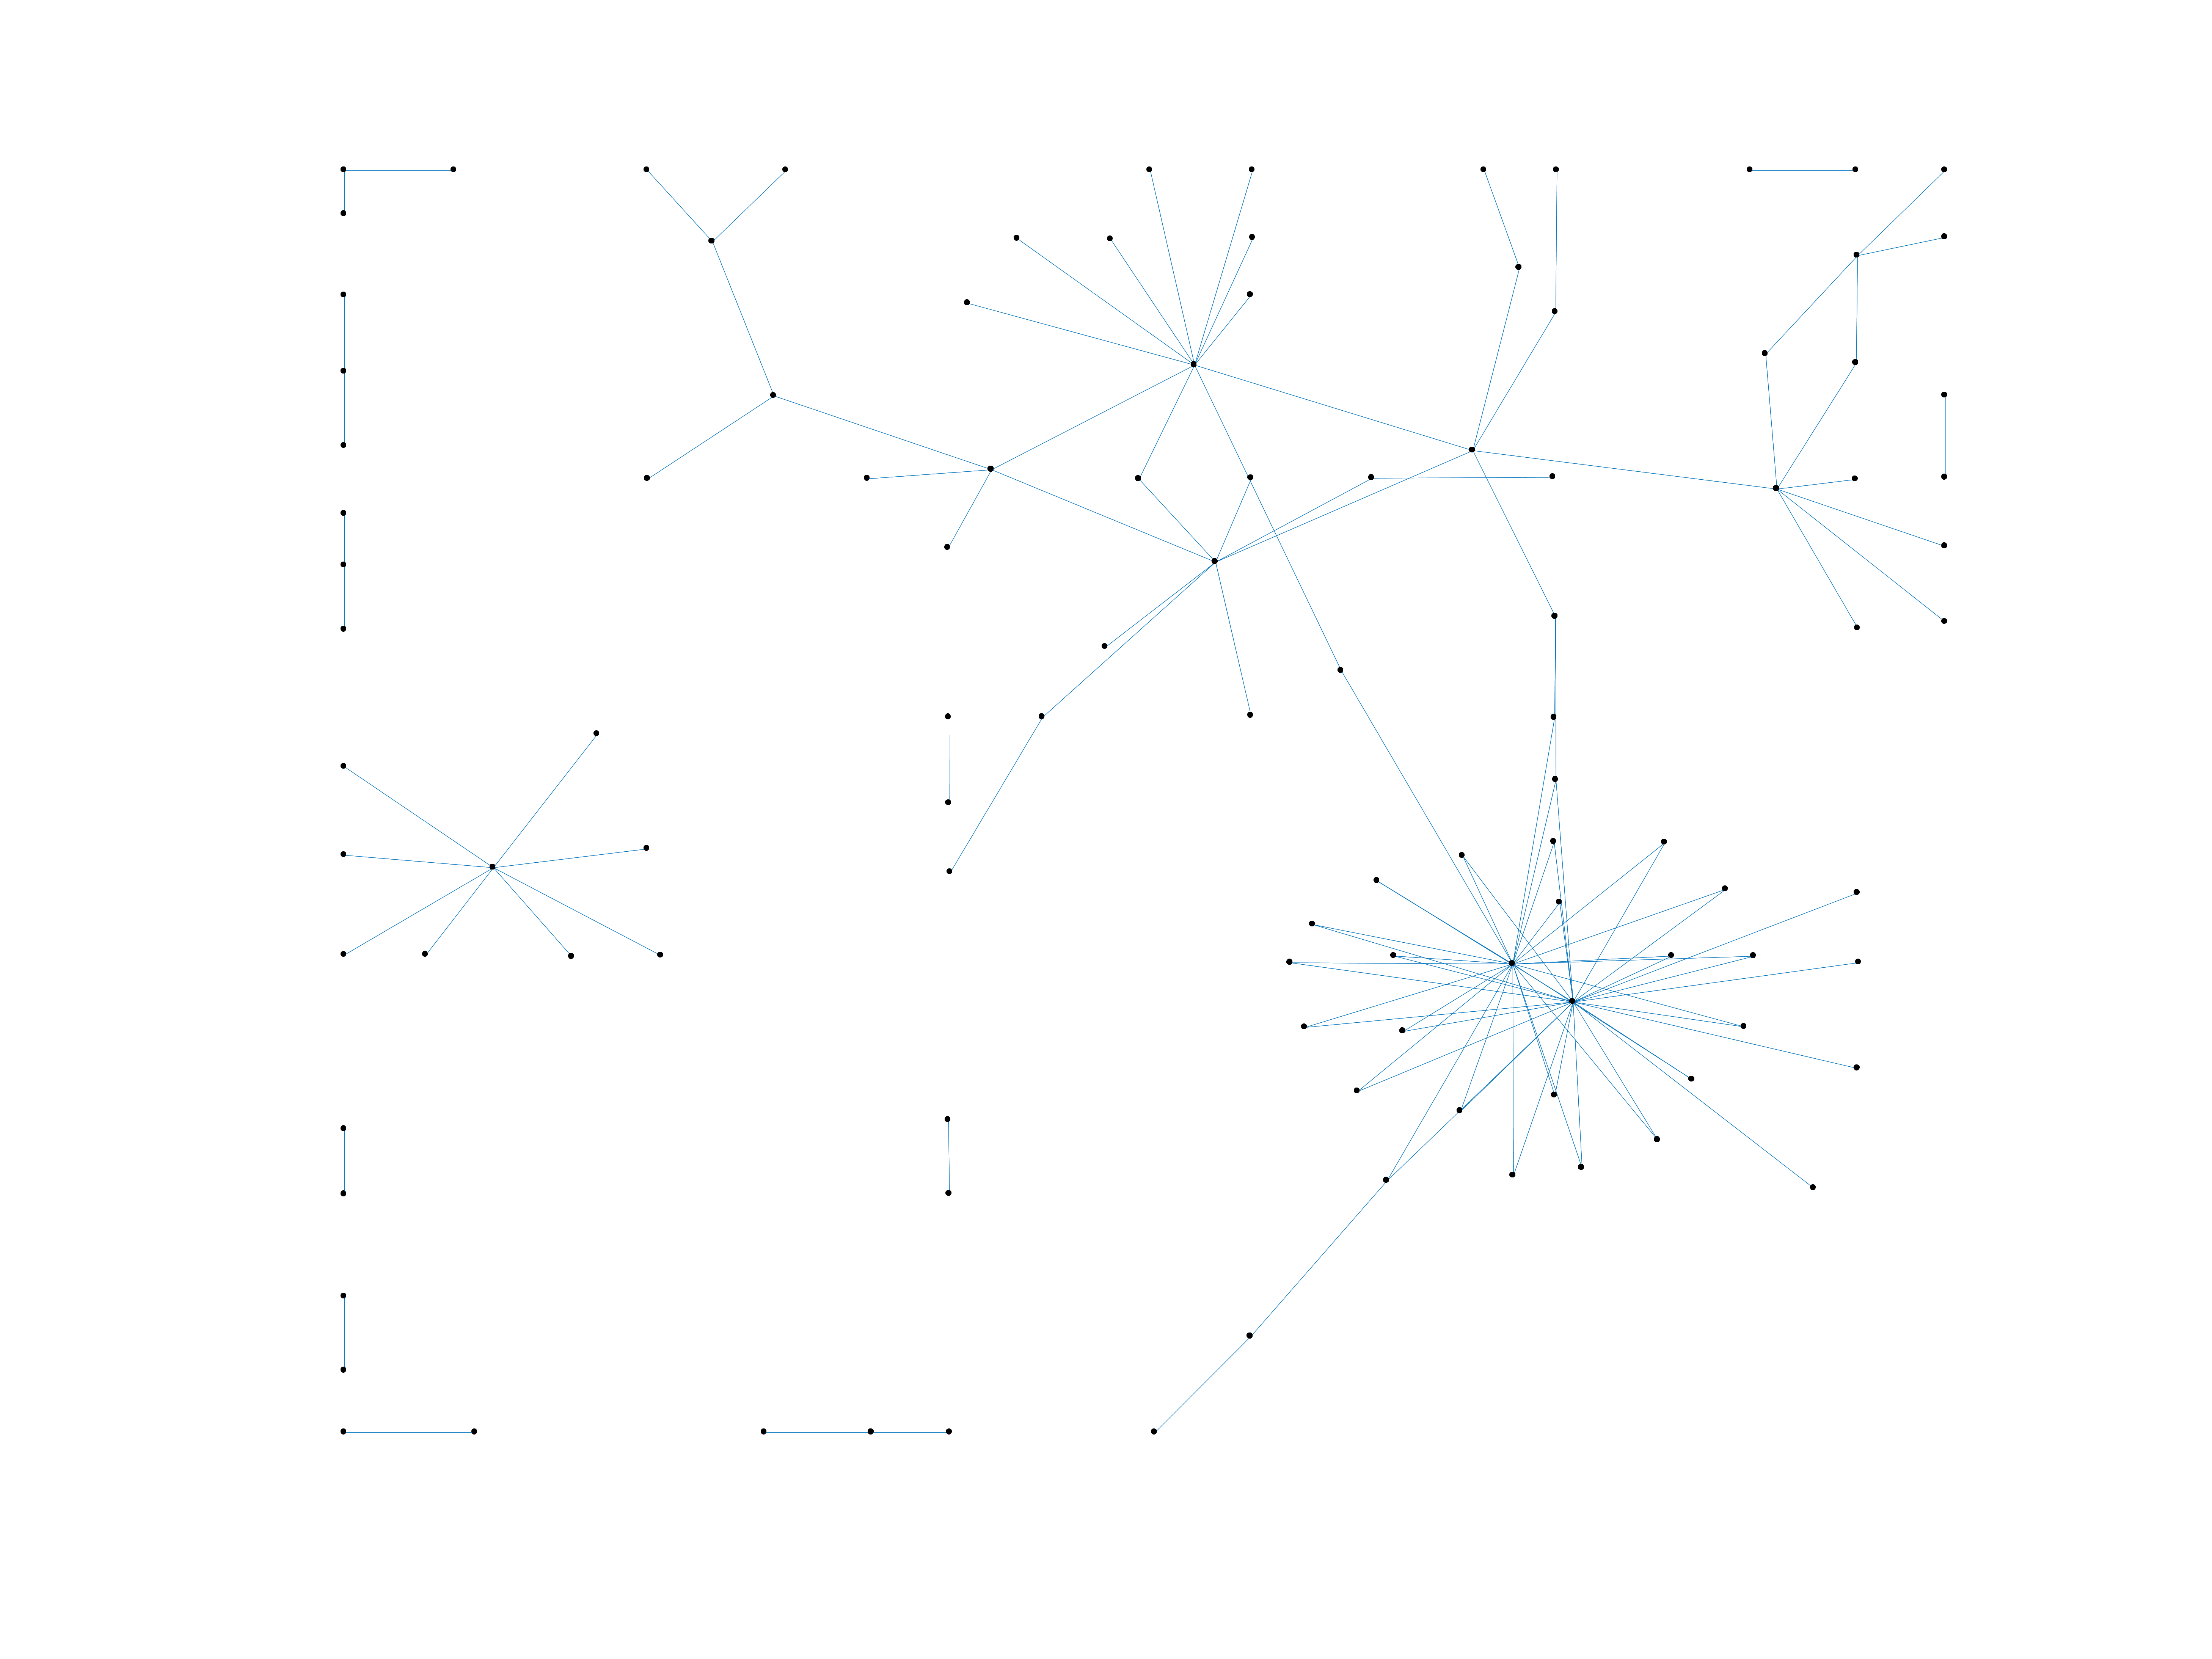
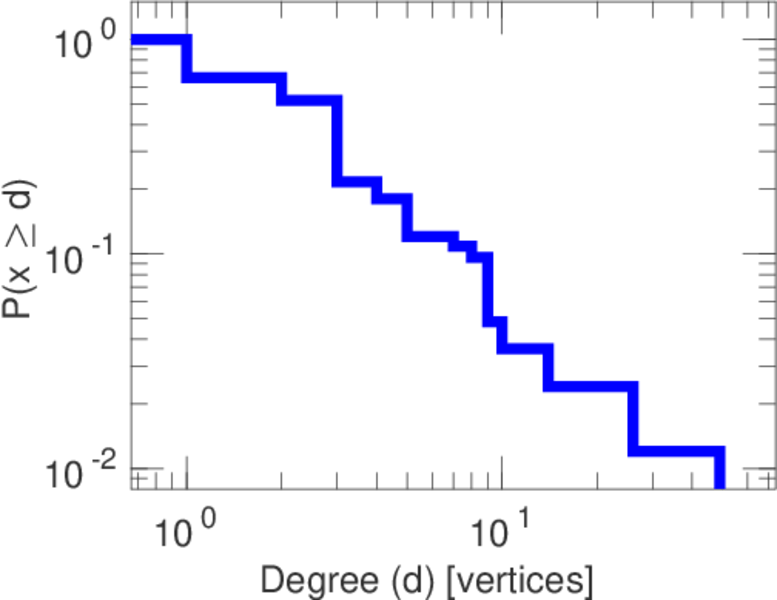
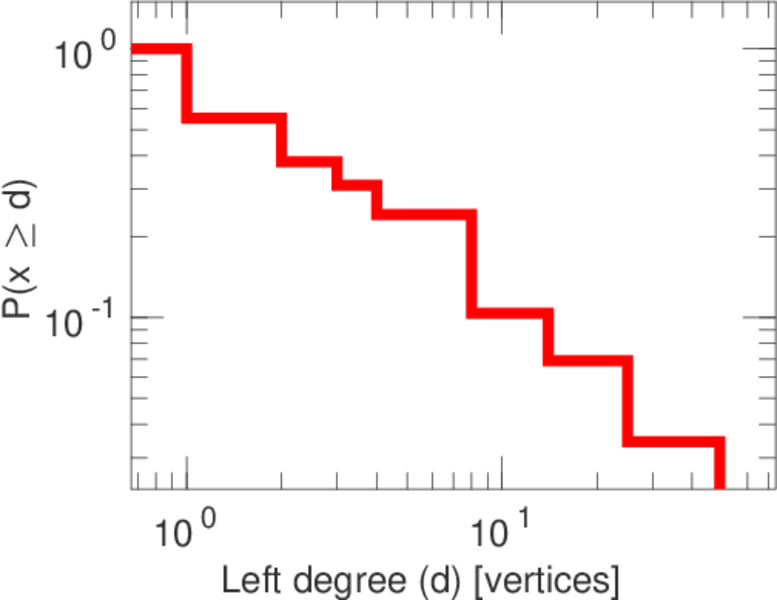
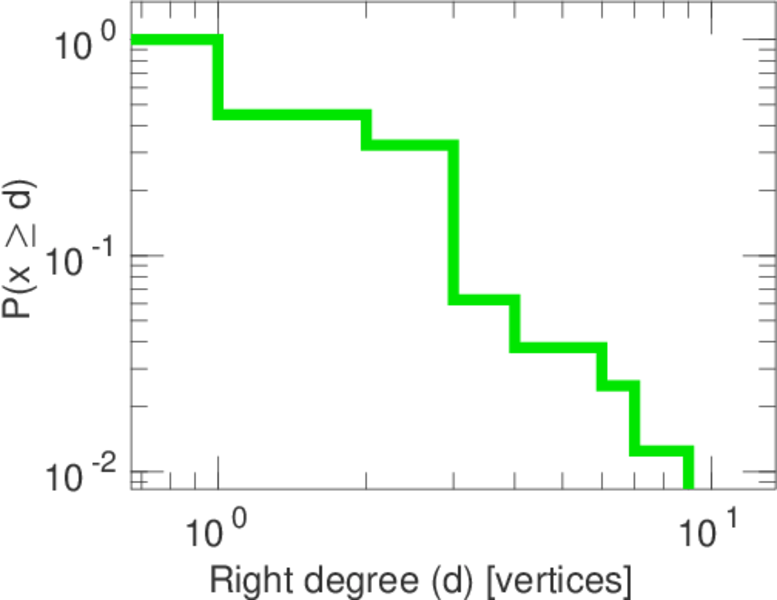
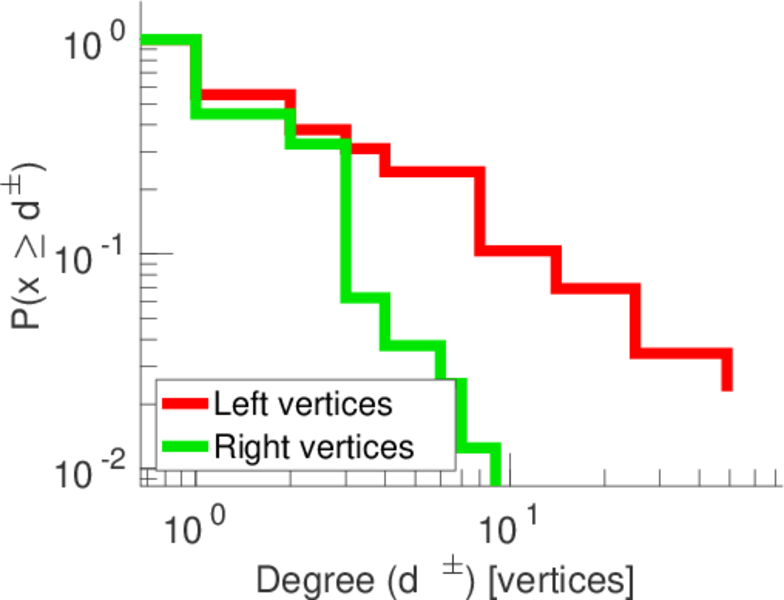
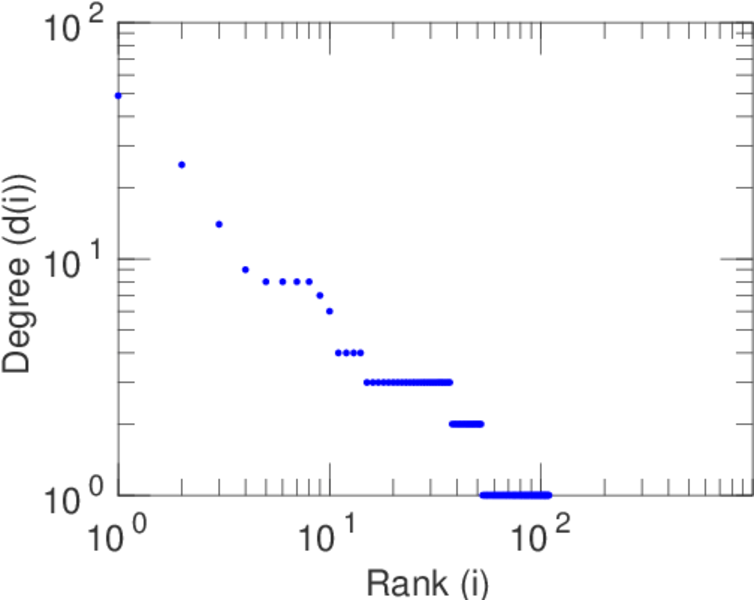
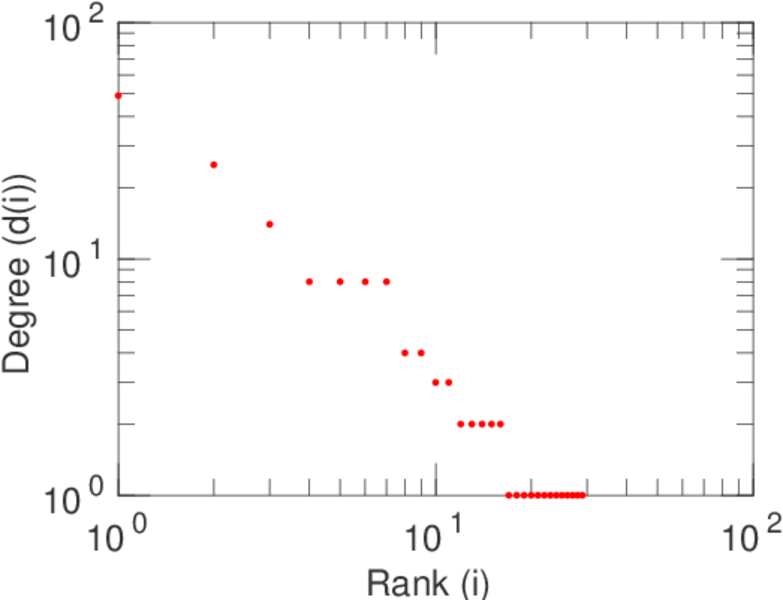
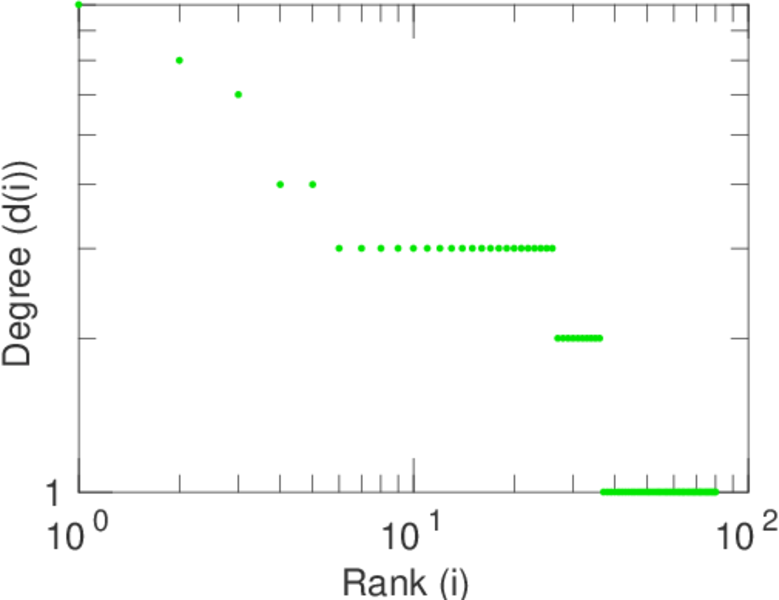
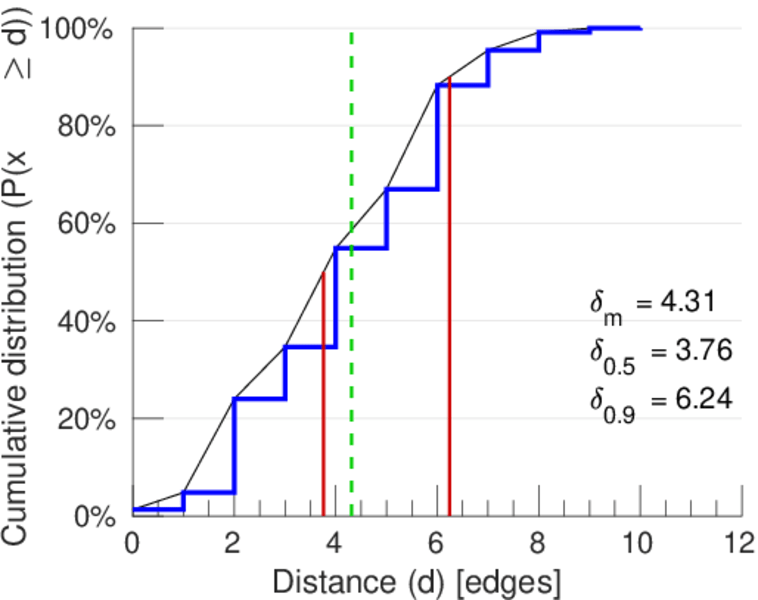
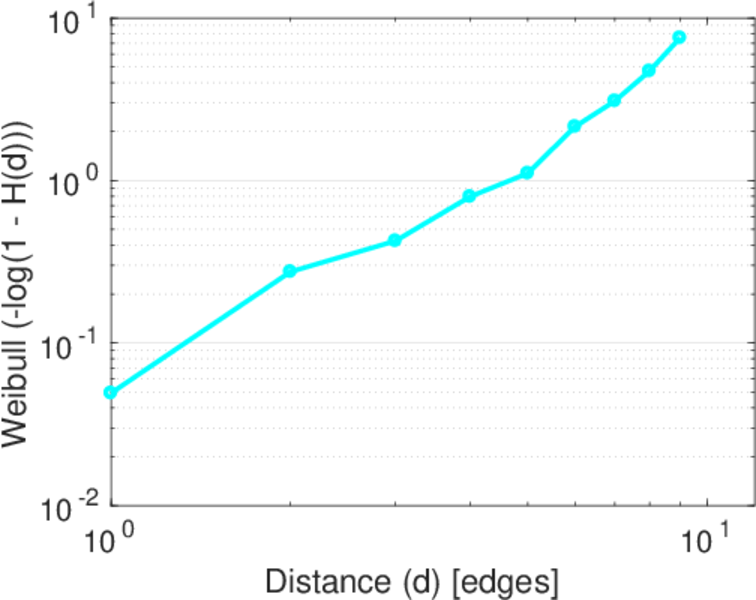
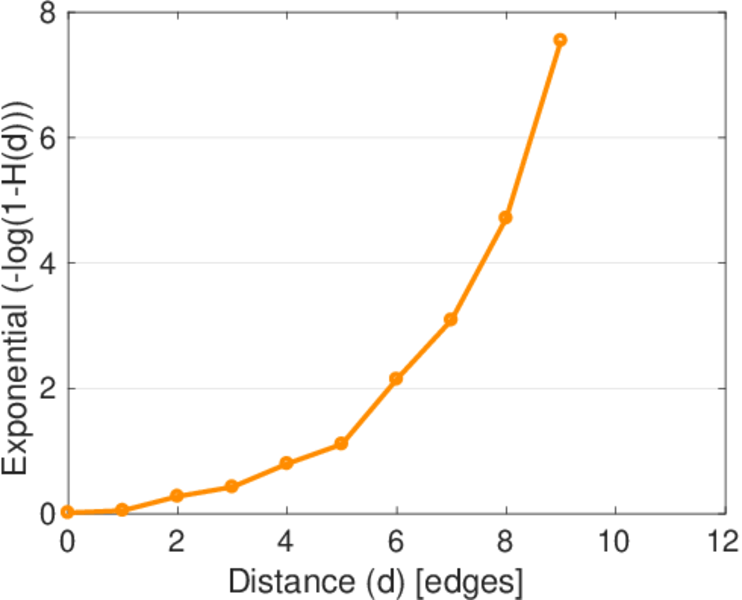
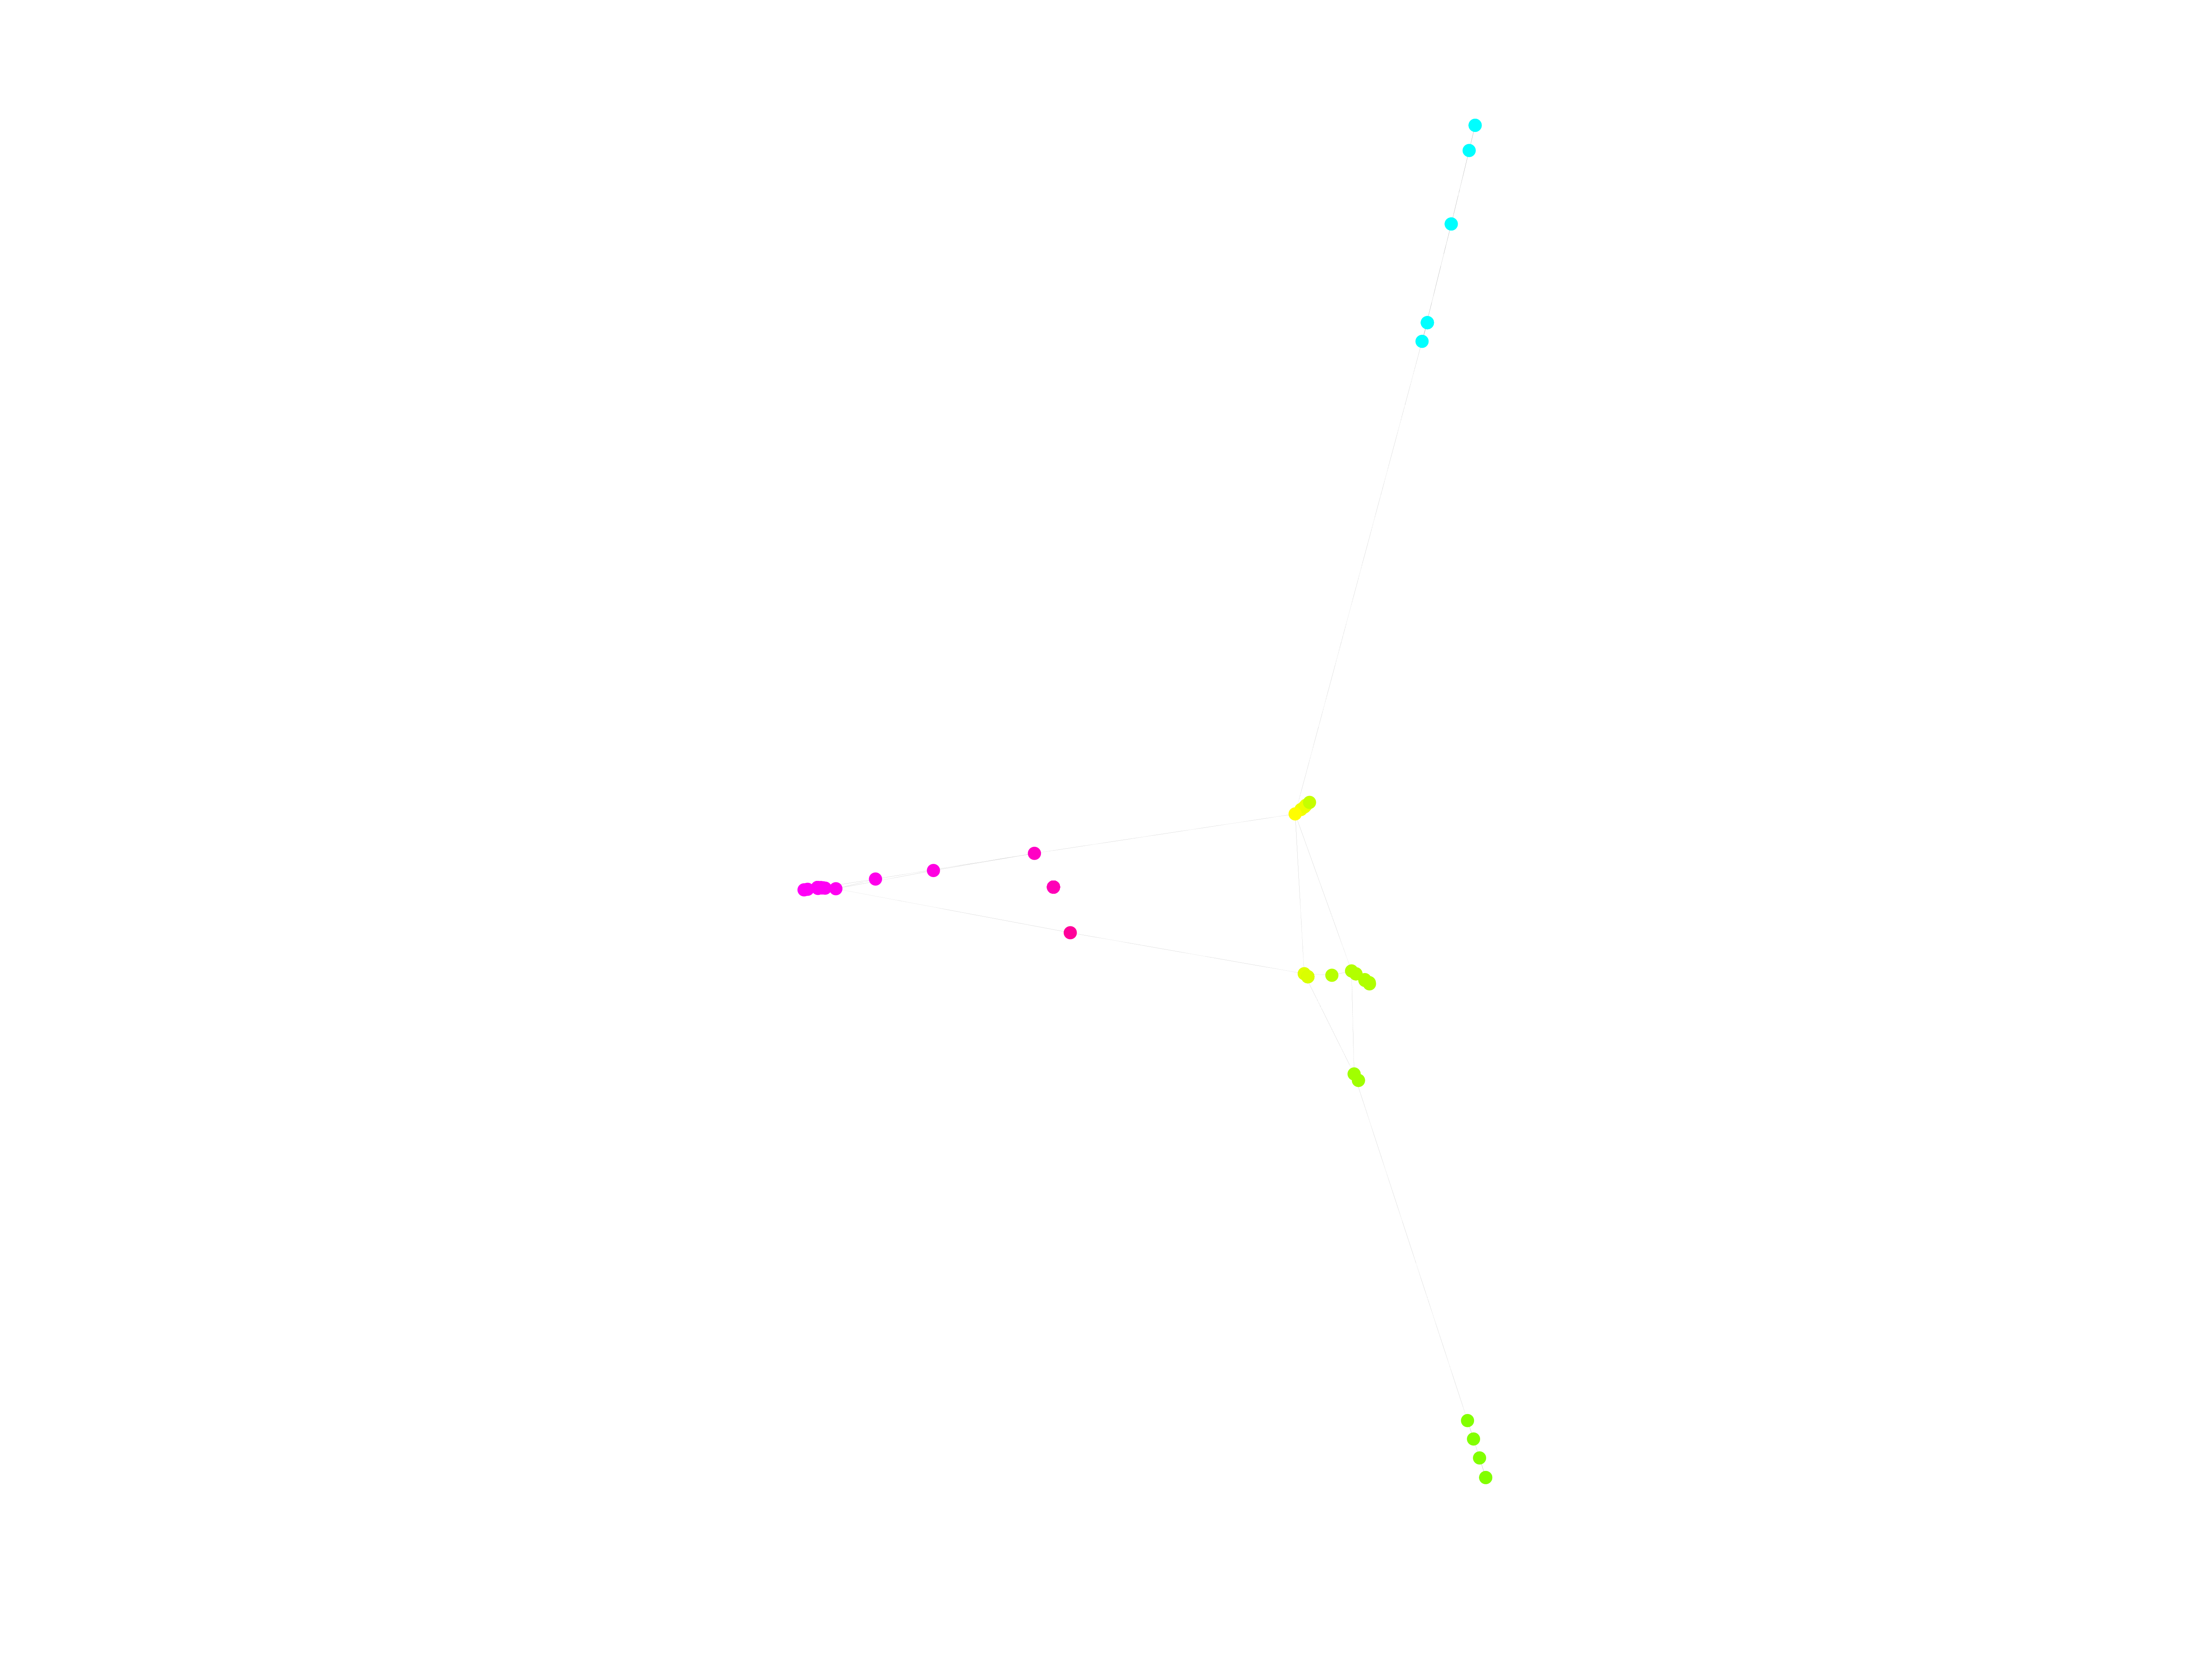
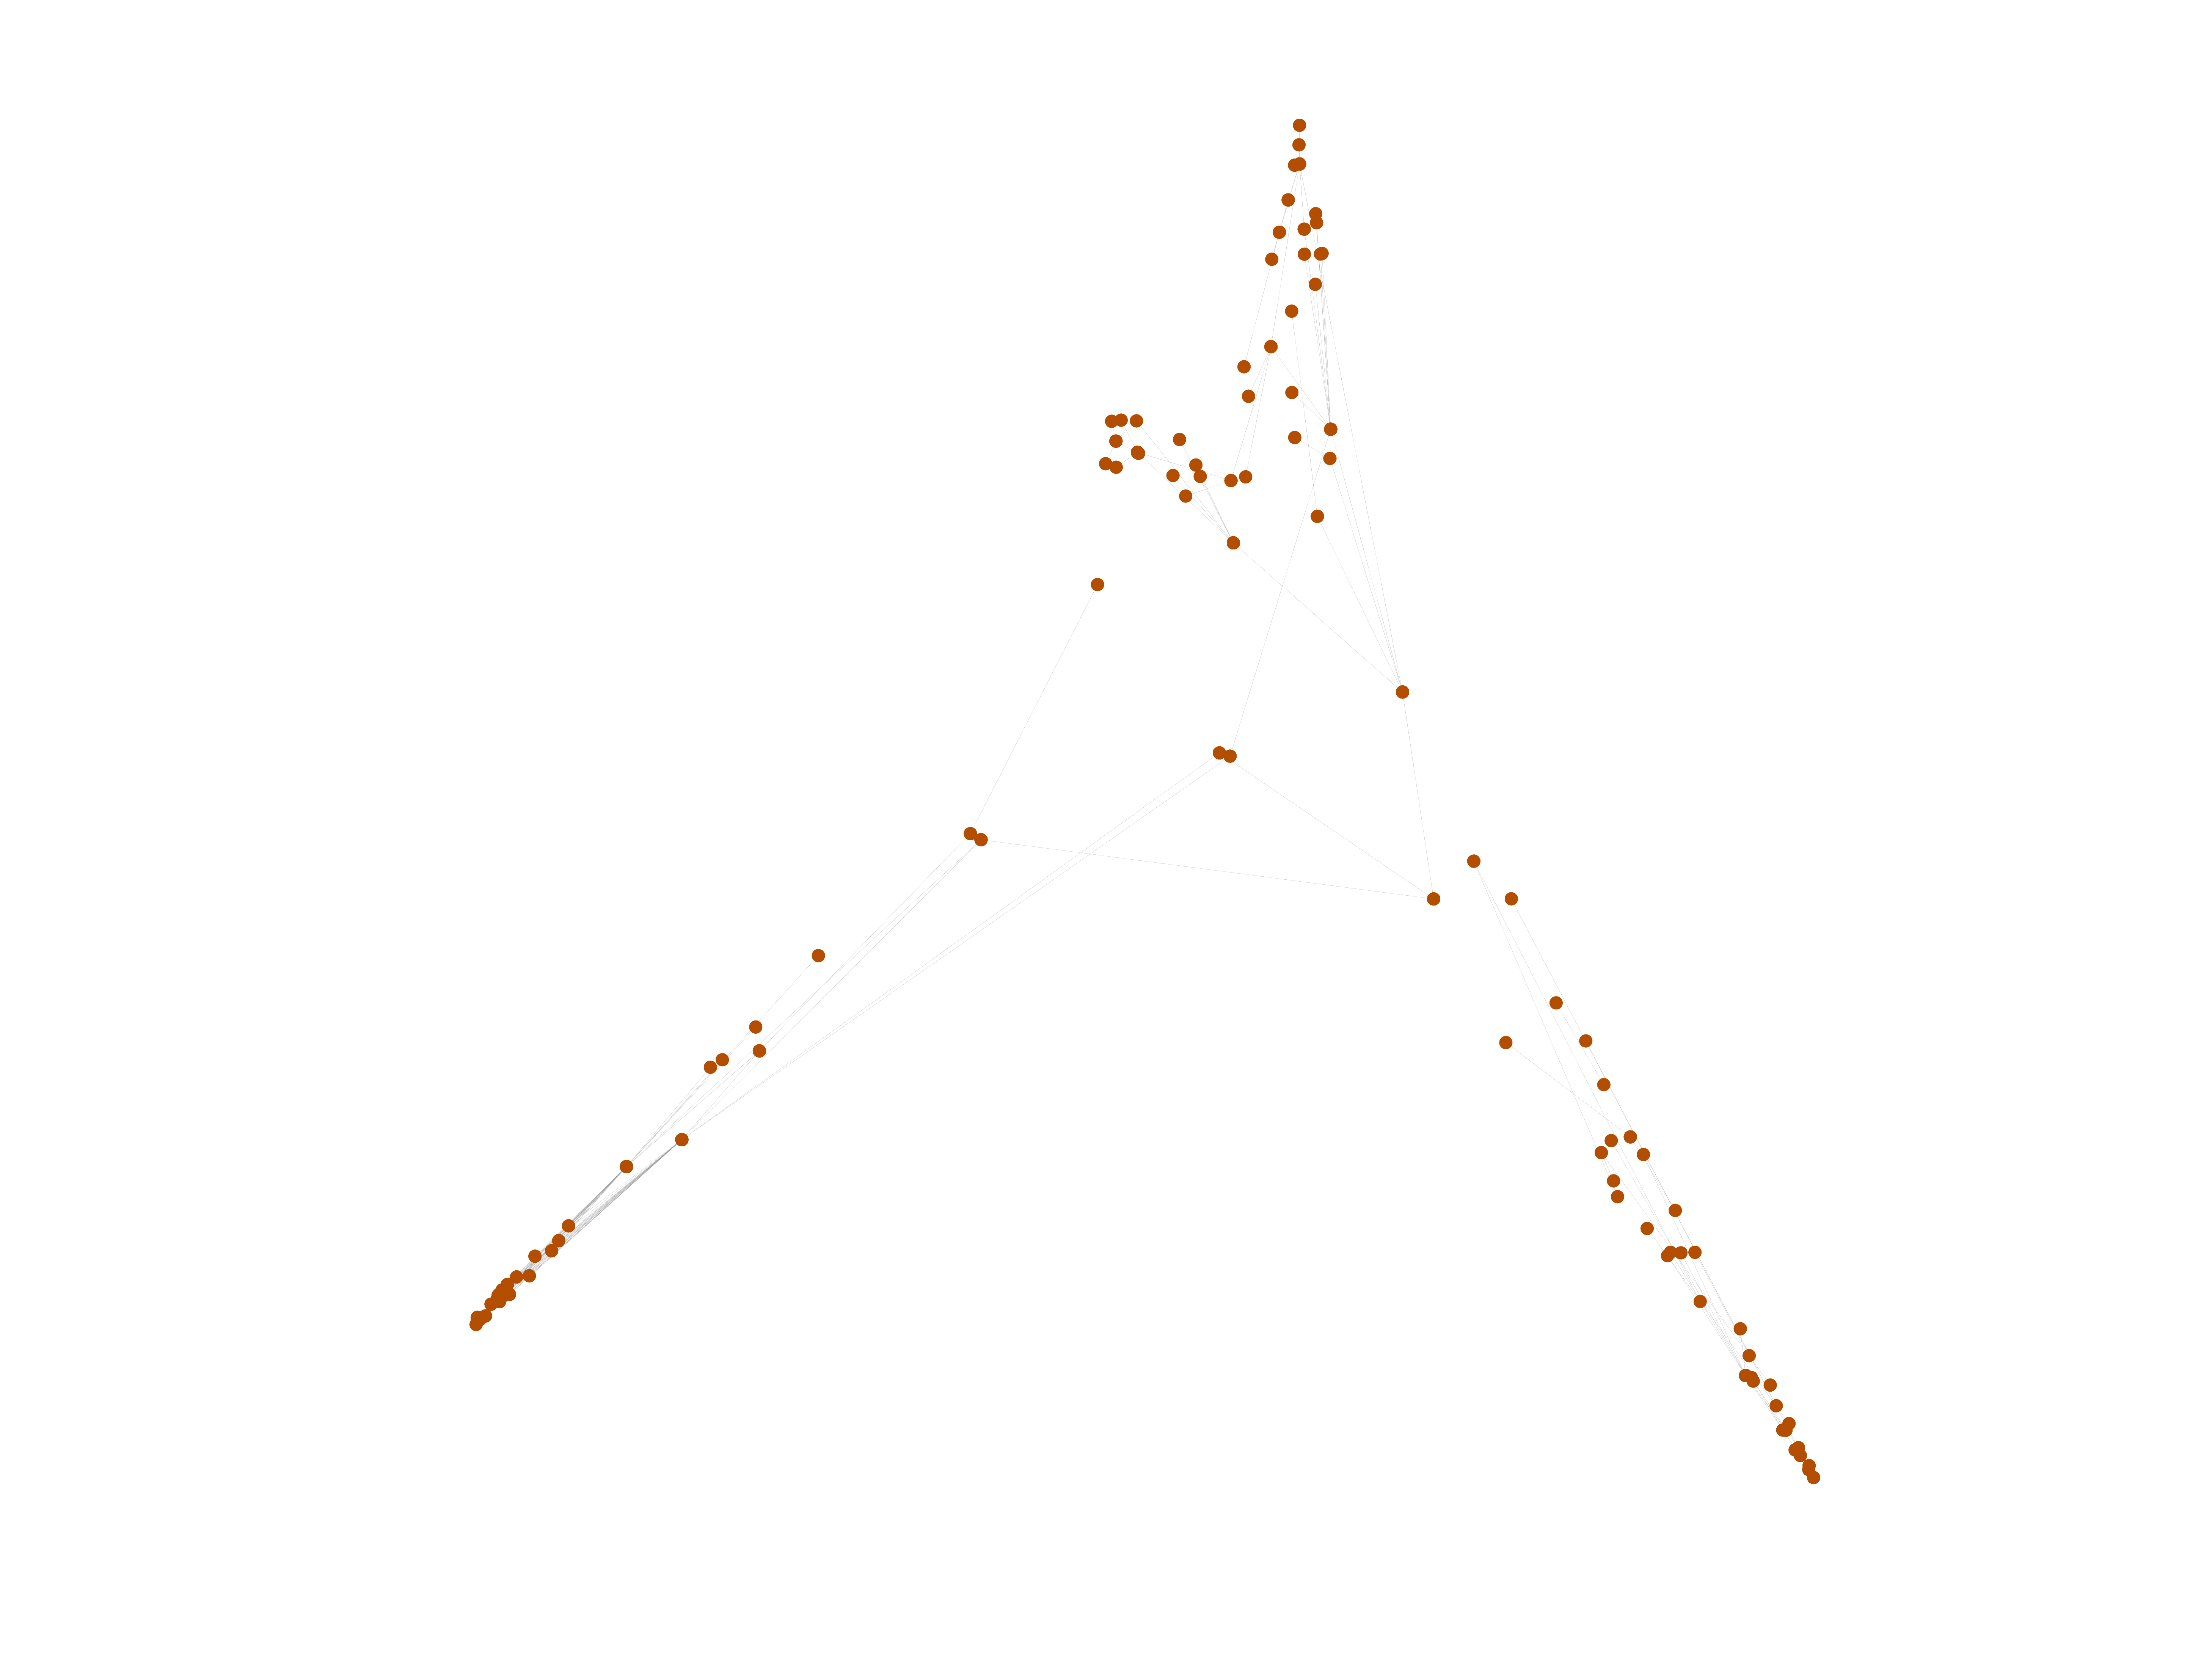
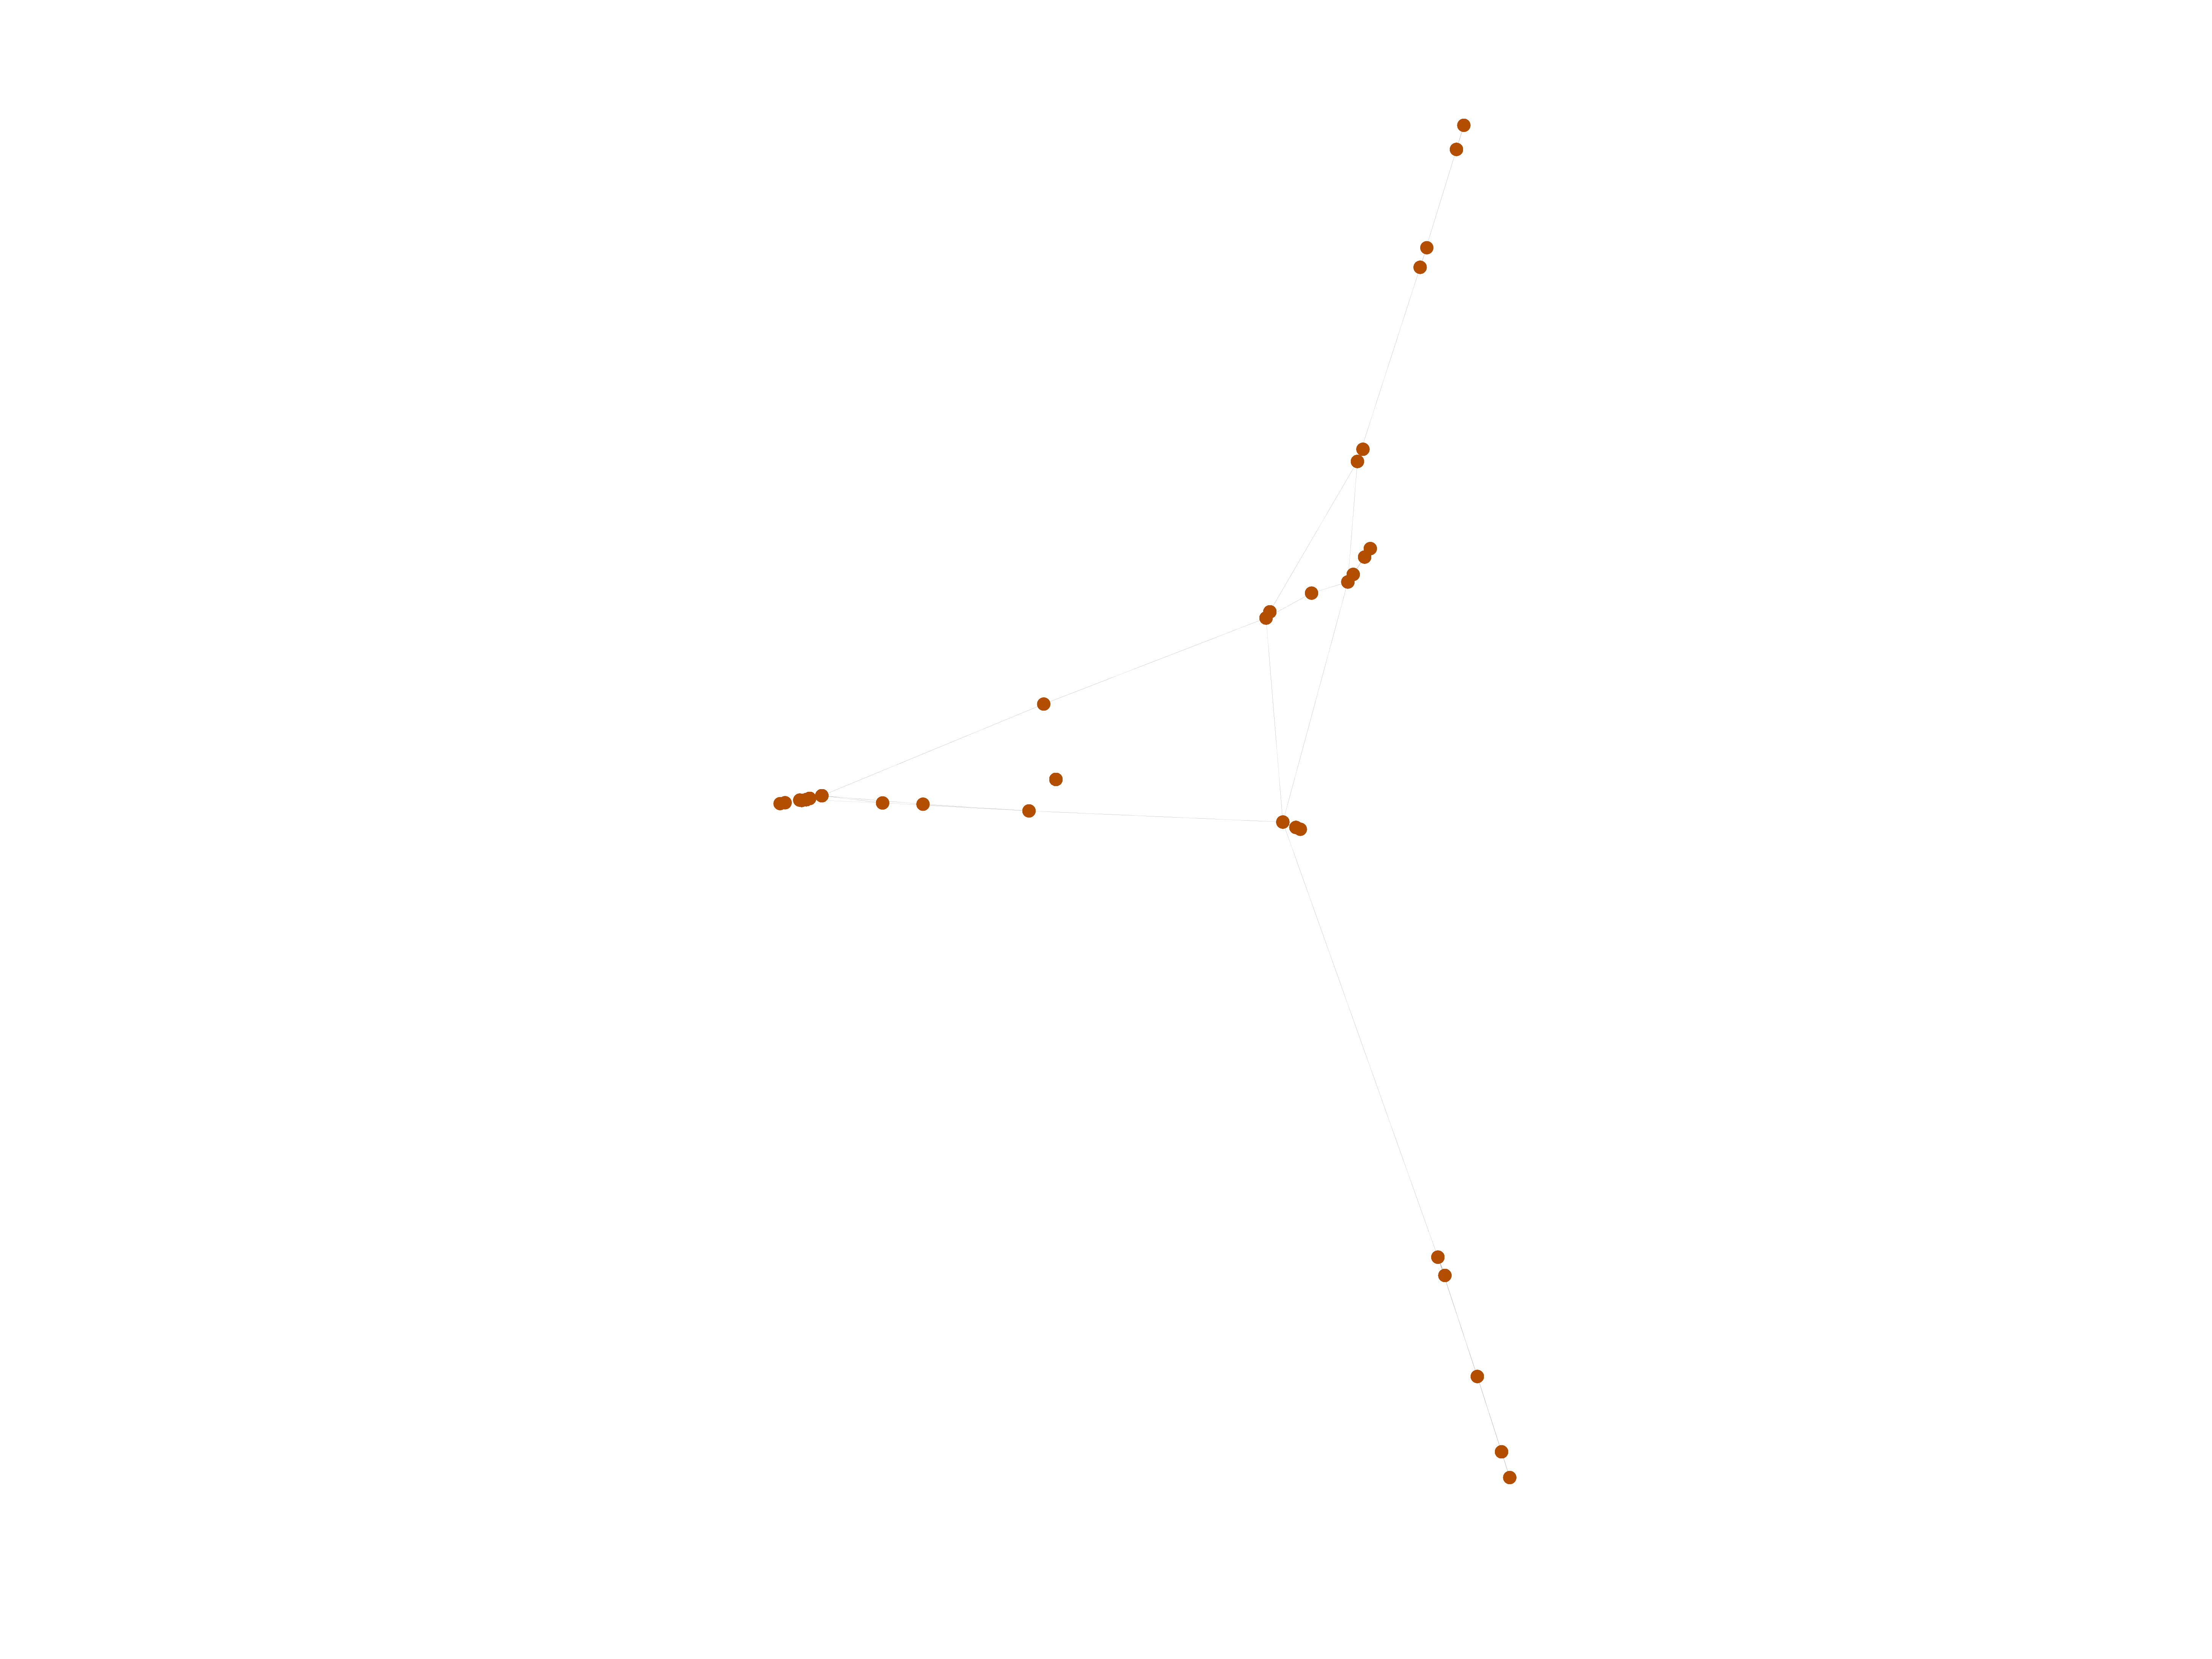
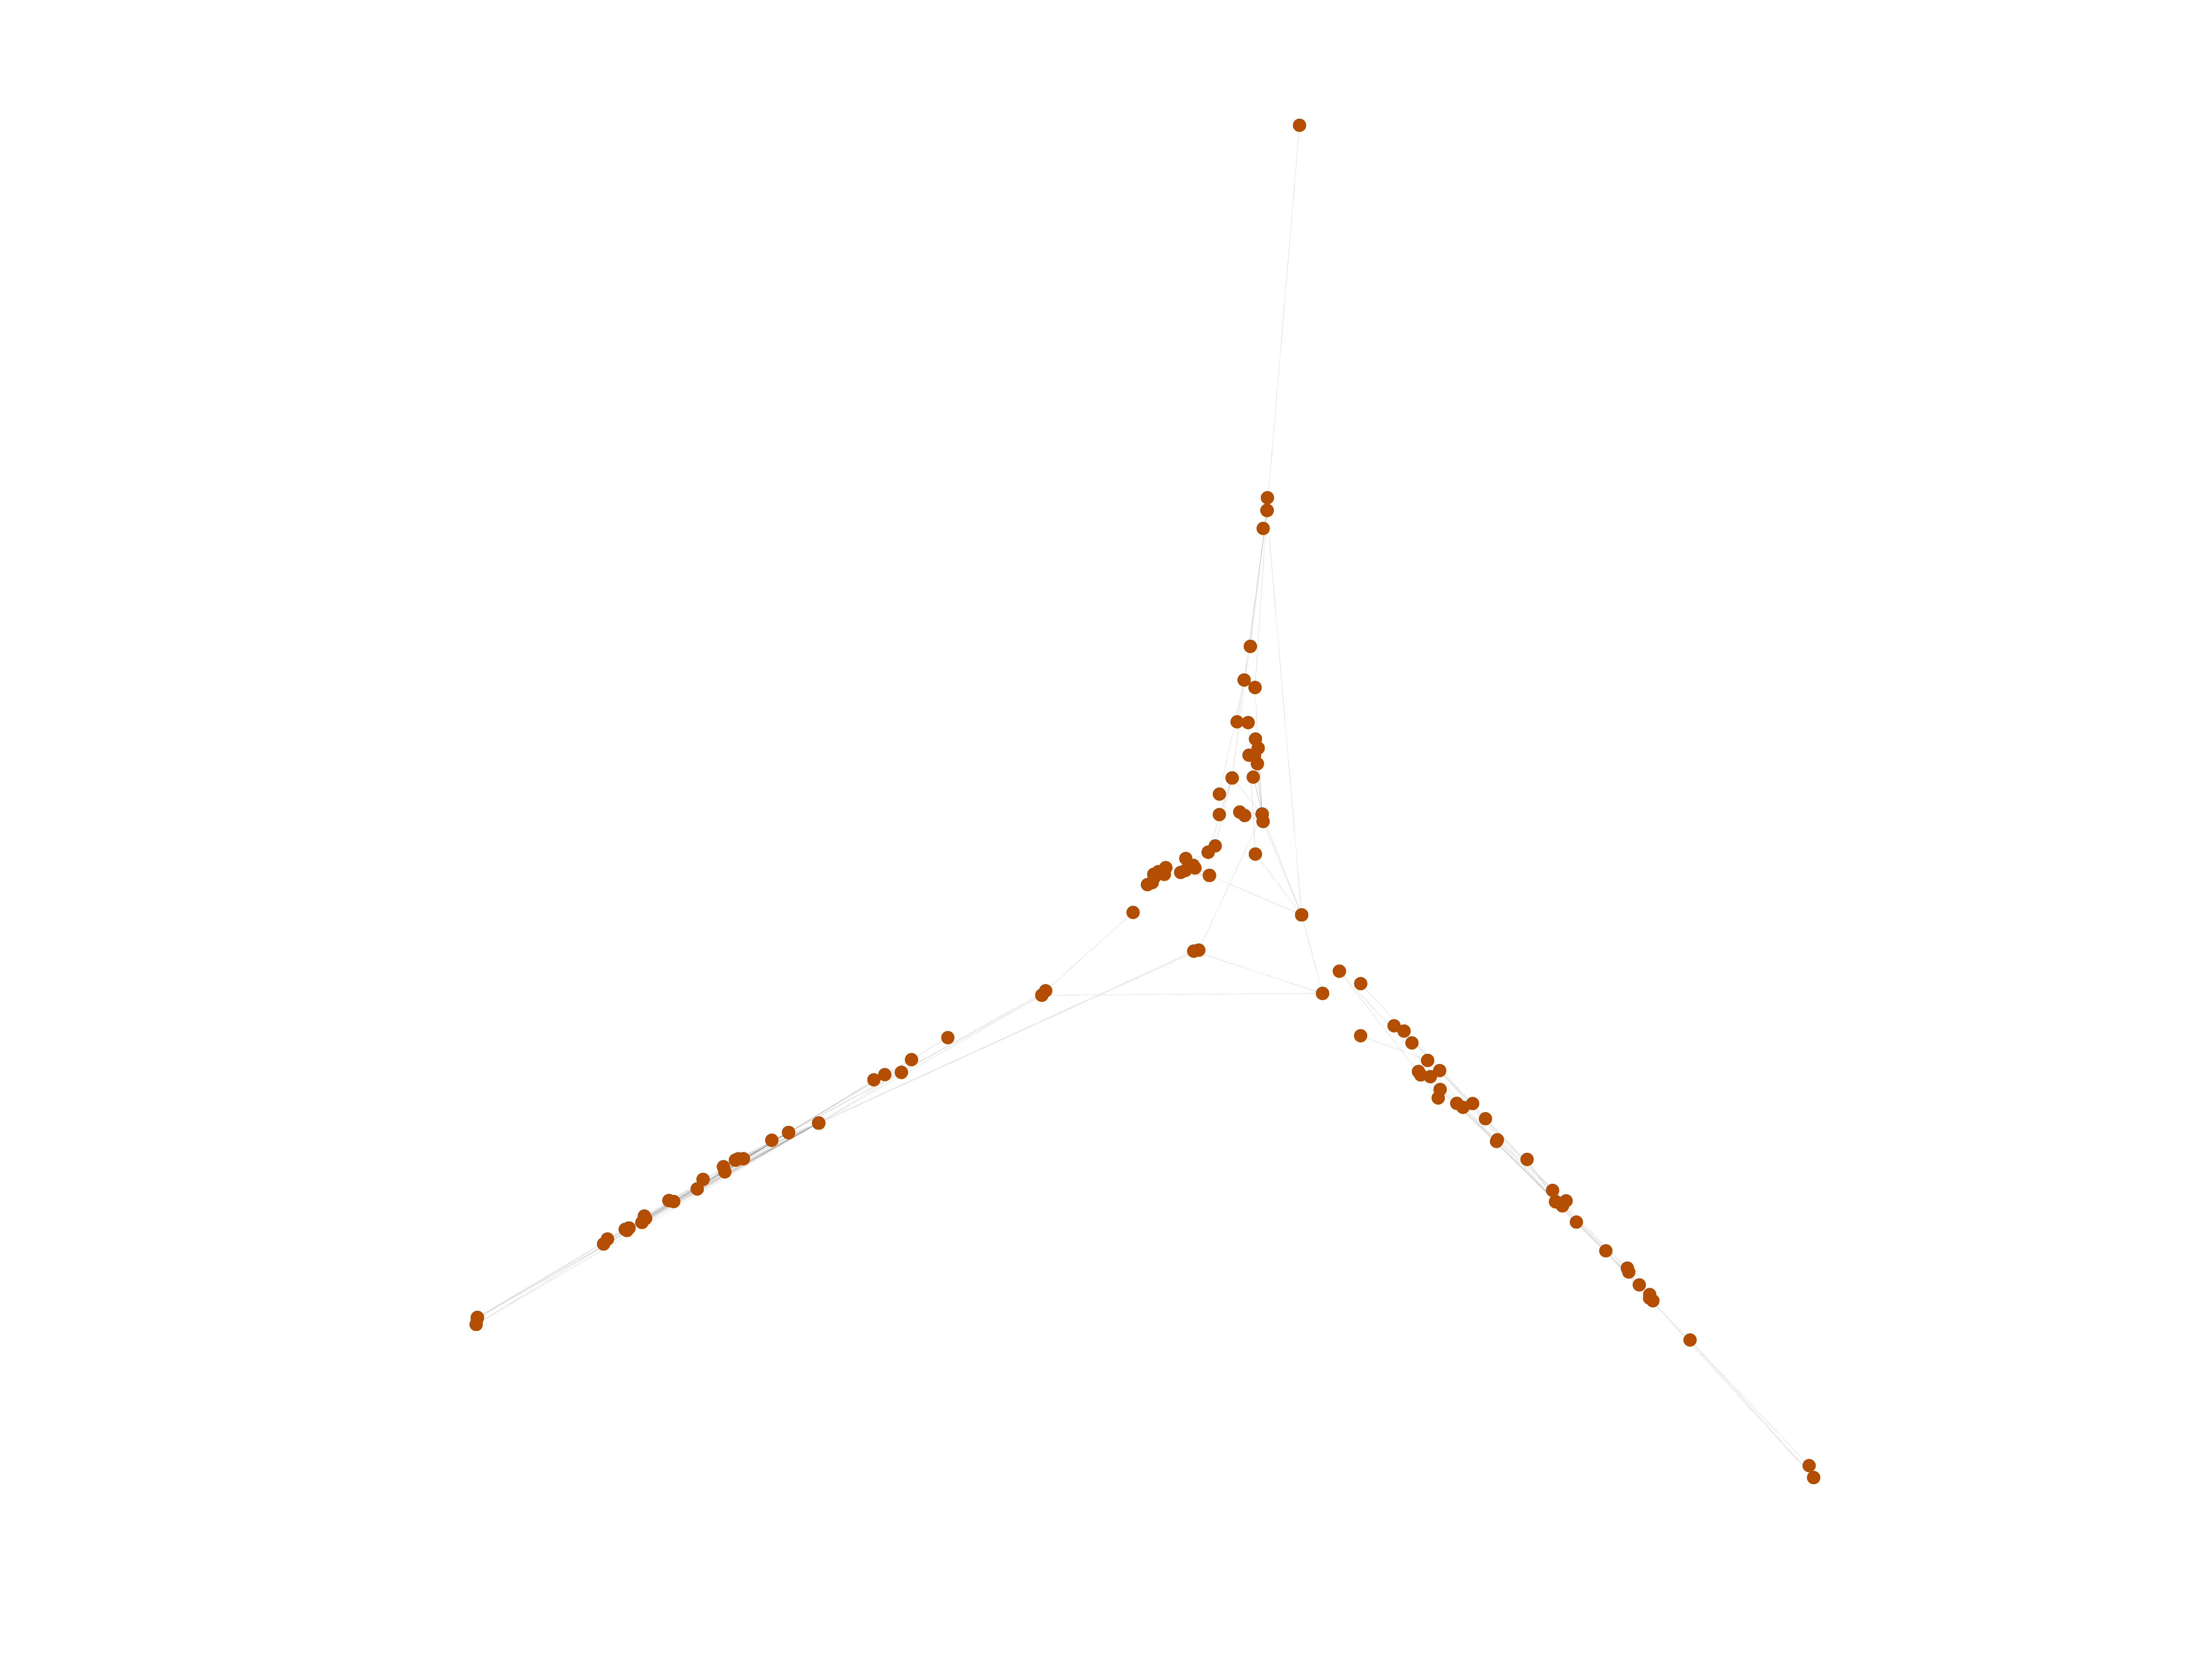
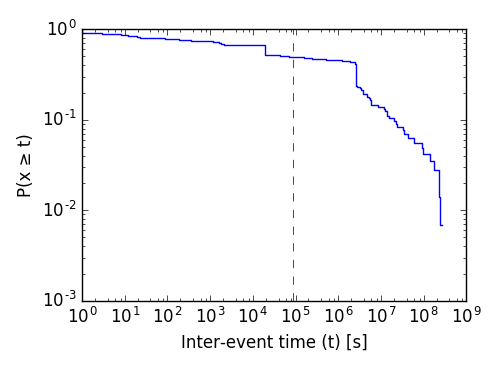
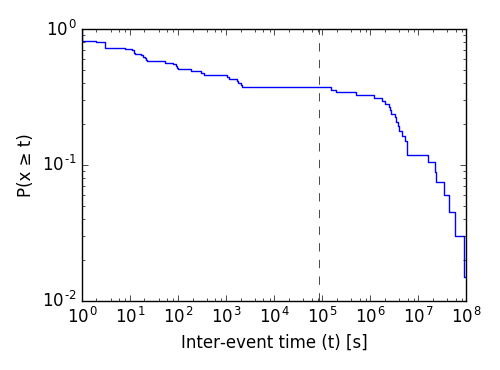
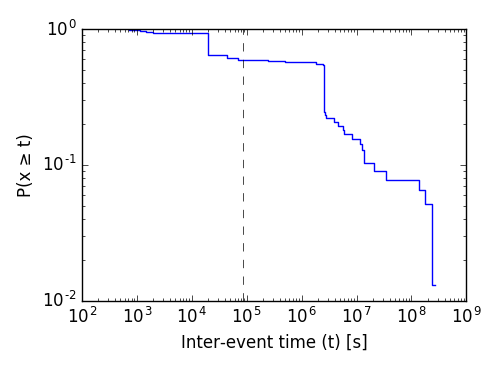
This is the bipartite edit network of the Irish Wikiquote. It contains users and pages from the Irish Wikiquote, connected by edit events. Each edge represents an edit. The dataset includes the timestamp of each edit.
| Code | qga
| |
| Internal name | edit-gawikiquote
| |
| Name | Wikiquote edits (ga) | |
| Data source | http://dumps.wikimedia.org/ | |
| Availability | Dataset is available for download | |
| Consistency check | Dataset passed all tests | |
| Category | Authorship network | |
| Dataset timestamp | 2017-10-20 | |
| Node meaning | User, article | |
| Edge meaning | Edit | |
| Network format | Bipartite, undirected | |
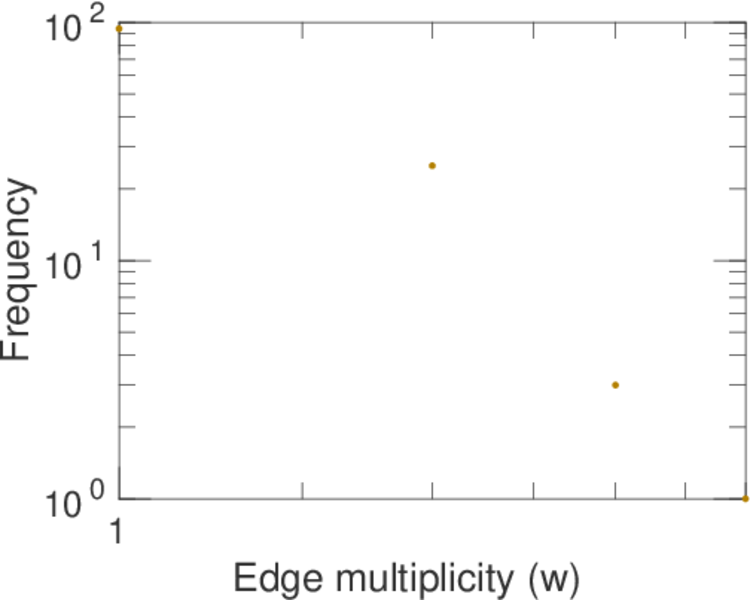
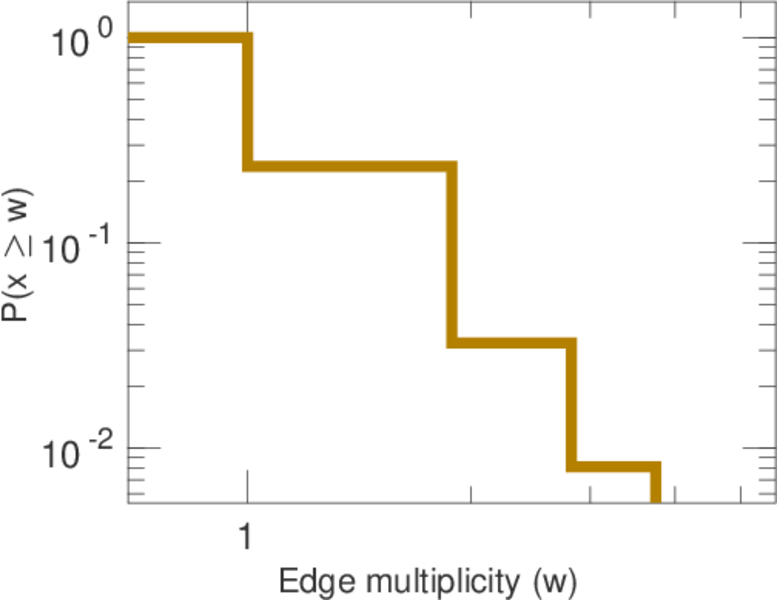
| Edge type | Unweighted, multiple edges | |
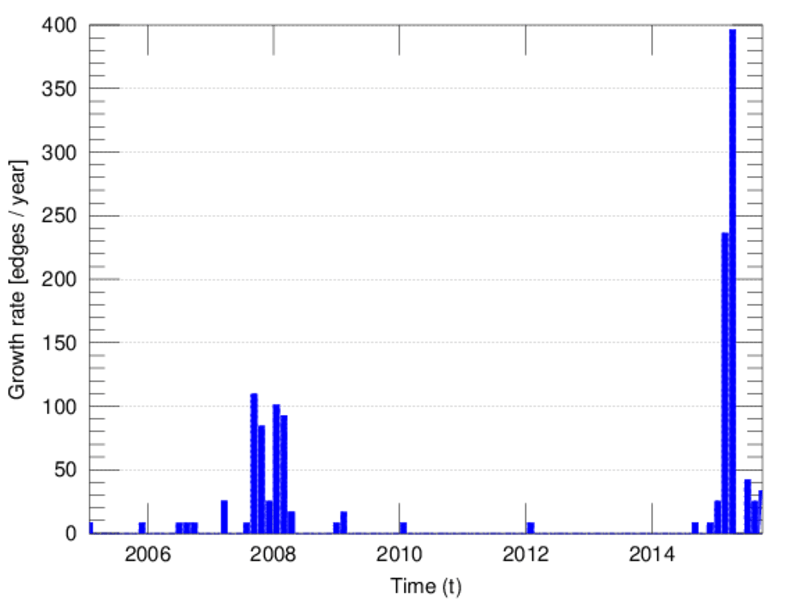
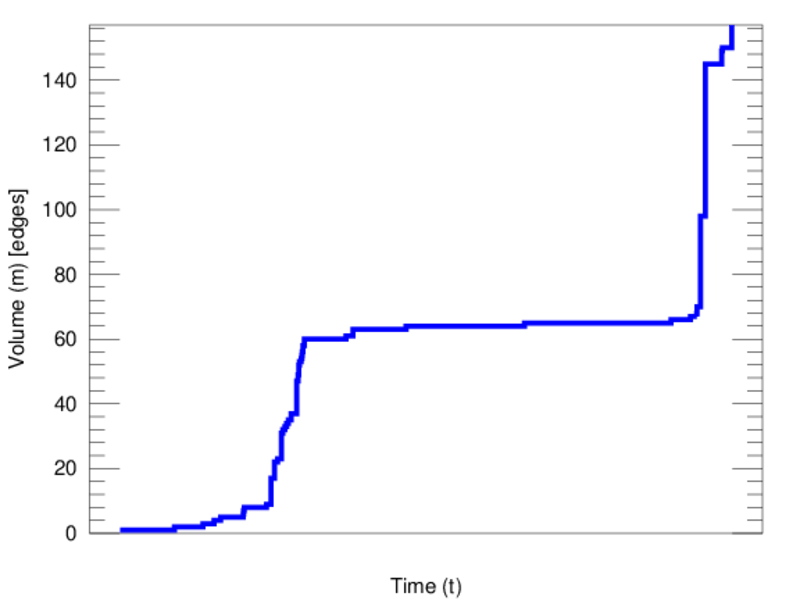
| Temporal data | Edges are annotated with timestamps |


| [1] | Jérôme Kunegis. KONECT – The Koblenz Network Collection. In Proc. Int. Conf. on World Wide Web Companion, pages 1343–1350, 2013. [ http ] |
| [2] | Wikimedia Foundation. Wikimedia downloads. http://dumps.wikimedia.org/, January 2010. |