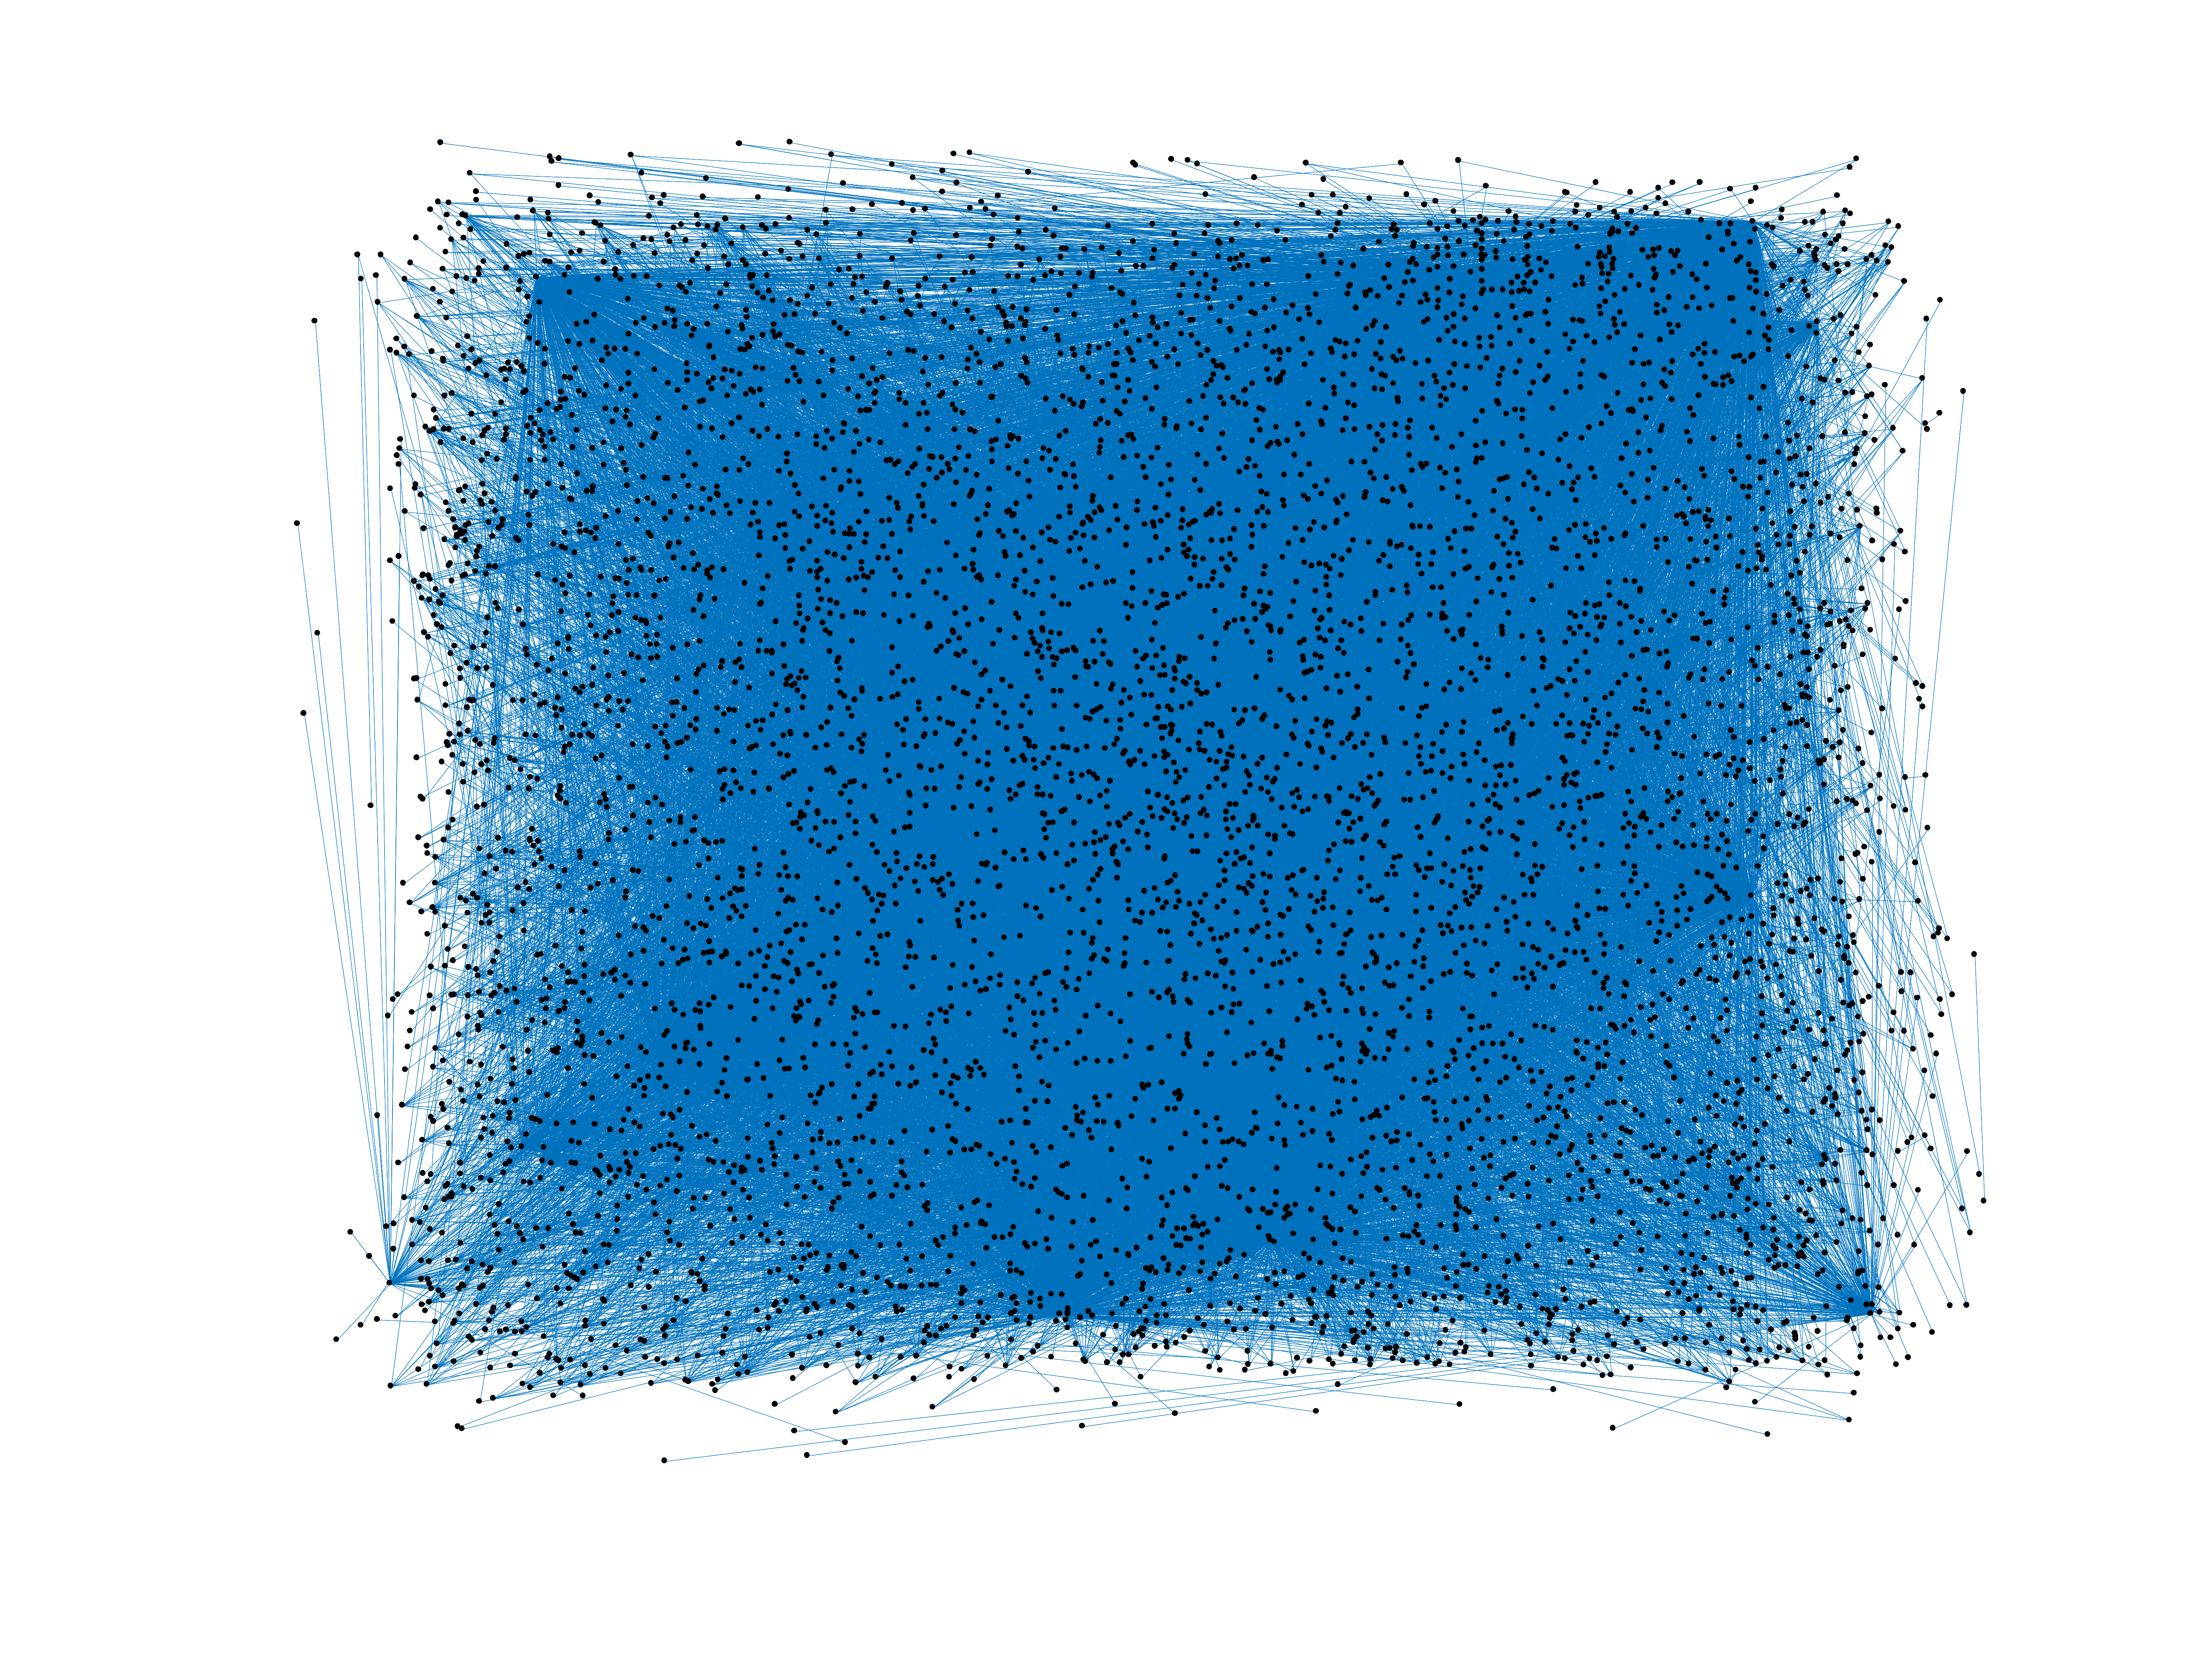
Wiktionary edits (ga)
This is the bipartite edit network of the Irish Wiktionary. It contains users
and pages from the Irish Wiktionary, connected by edit events. Each edge
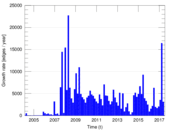
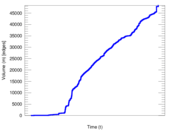
represents an edit. The dataset includes the timestamp of each edit.
Metadata
Statistics
| Size | n = | 6,005
|
| Left size | n1 = | 392
|
| Right size | n2 = | 5,613
|
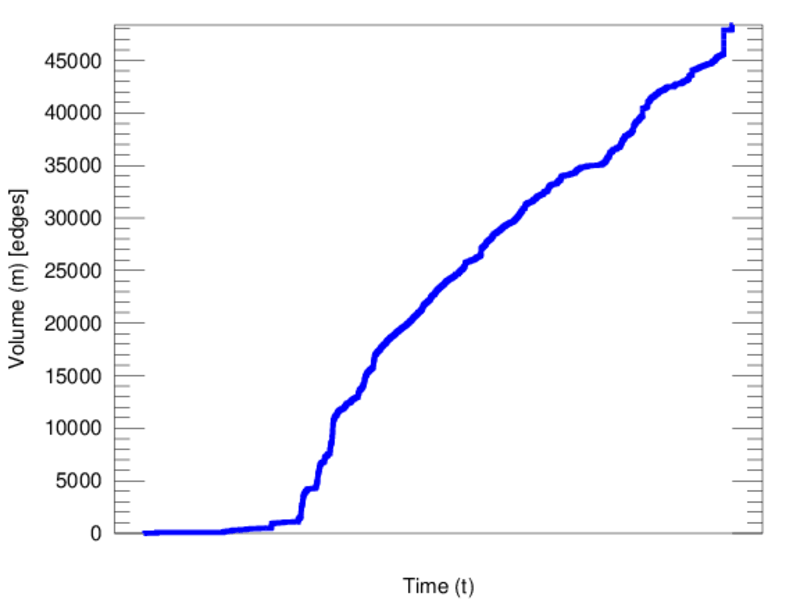
| Volume | m = | 48,361
|
| Unique edge count | m̿ = | 23,134
|
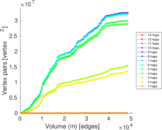
| Wedge count | s = | 14,218,602
|
| Claw count | z = | 8,545,478,473
|
| Cross count | x = | 4,501,431,785,639
|
| Square count | q = | 17,888,007
|
| 4-Tour count | T4 = | 200,025,036
|
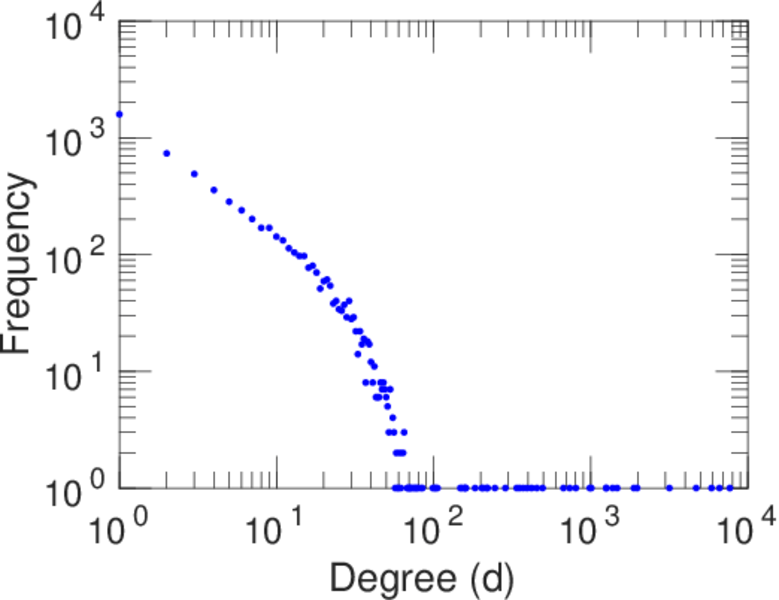
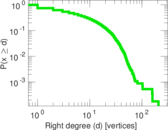
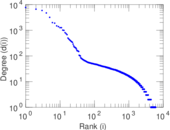
| Maximum degree | dmax = | 7,699
|
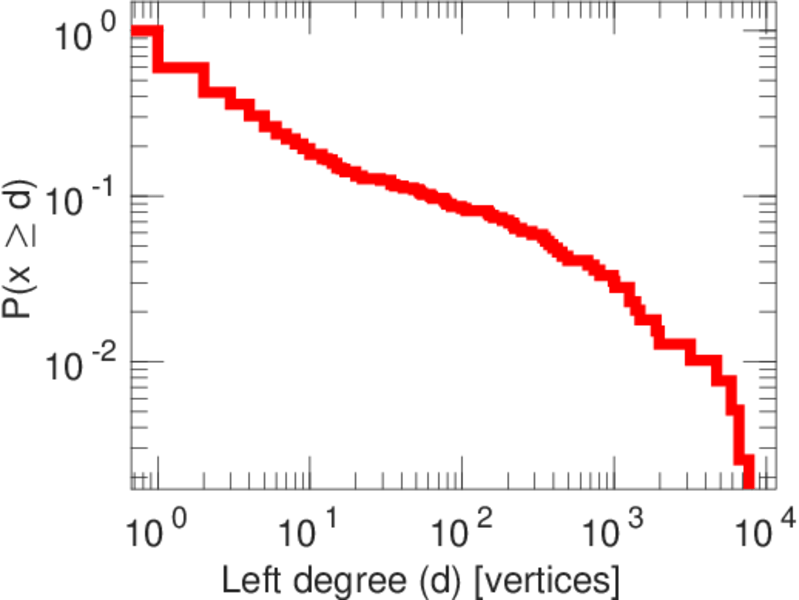
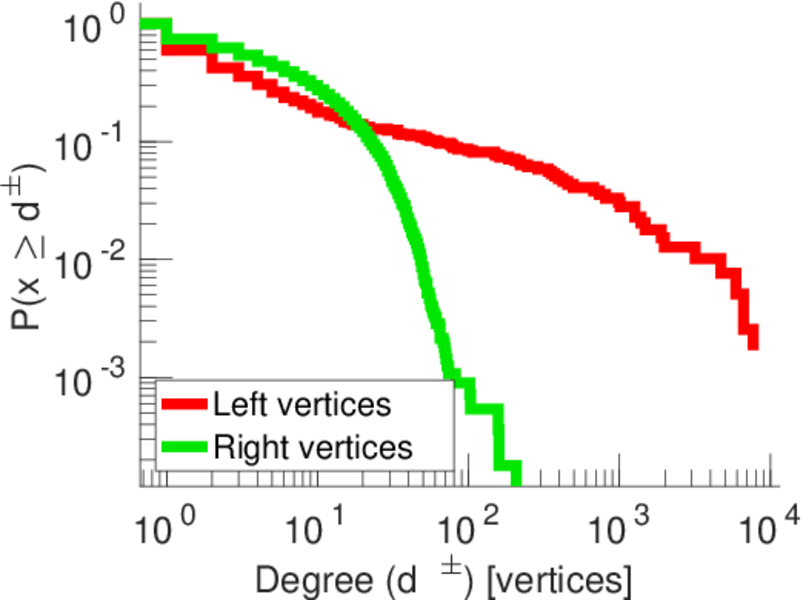
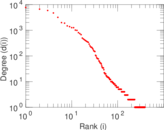
| Maximum left degree | d1max = | 7,699
|
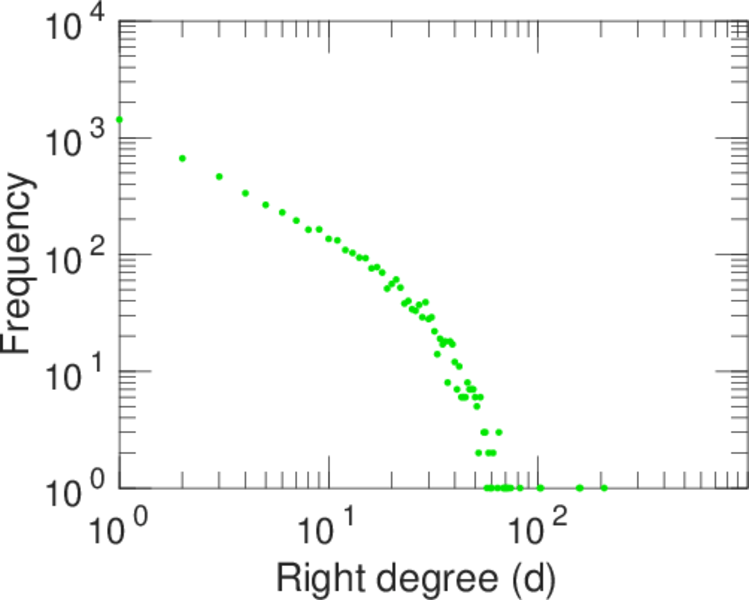
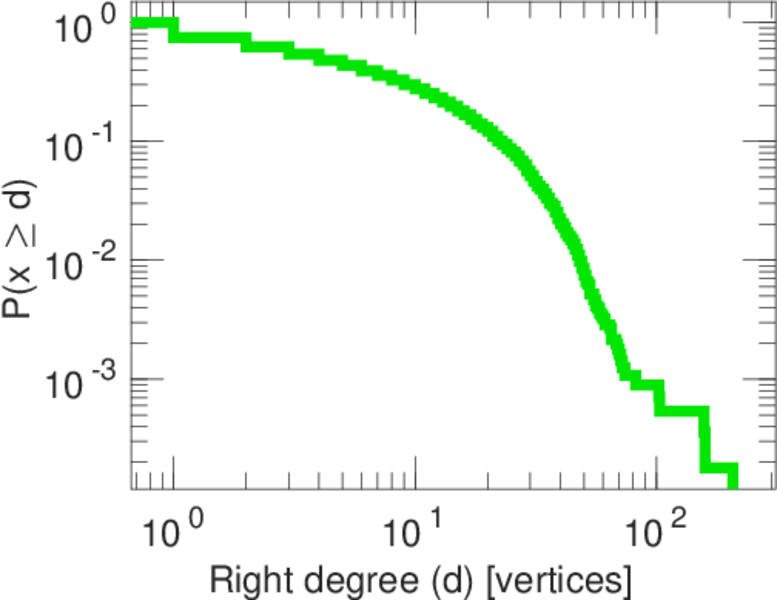
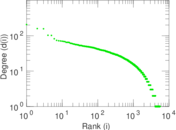
| Maximum right degree | d2max = | 207
|
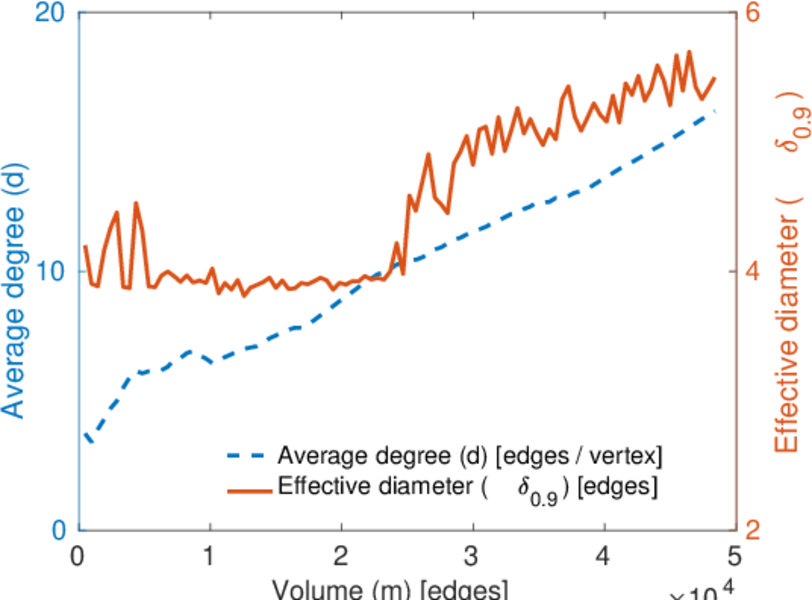
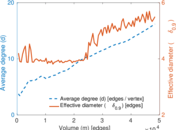
| Average degree | d = | 16.106 9
|
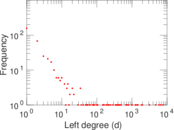
| Average left degree | d1 = | 123.370
|
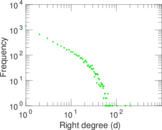
| Average right degree | d2 = | 8.615 89
|
| Fill | p = | 0.010 514 0
|
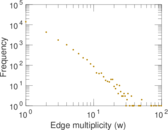
| Average edge multiplicity | m̃ = | 2.090 47
|
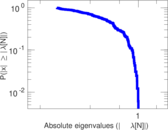
| Size of LCC | N = | 5,701
|
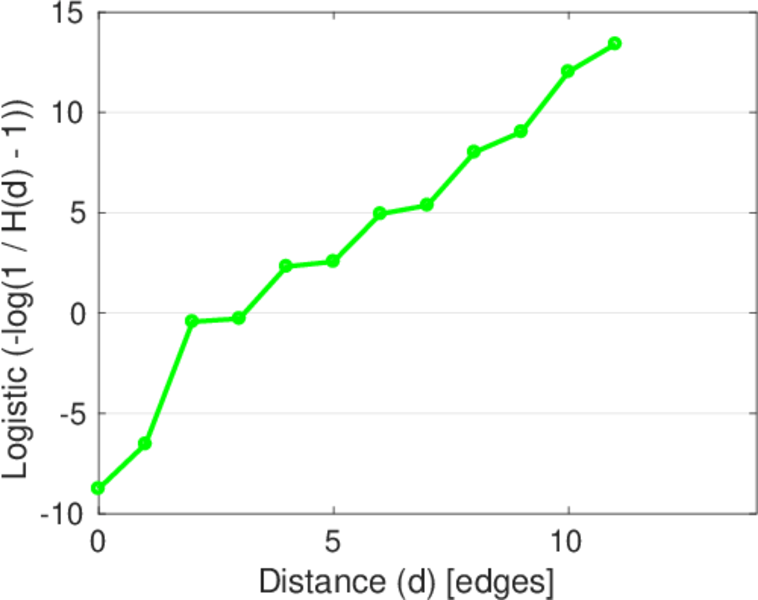
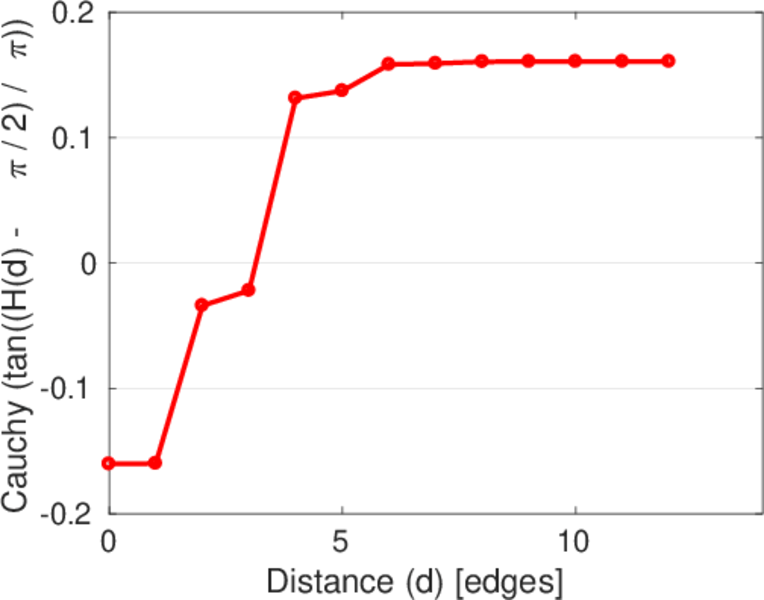
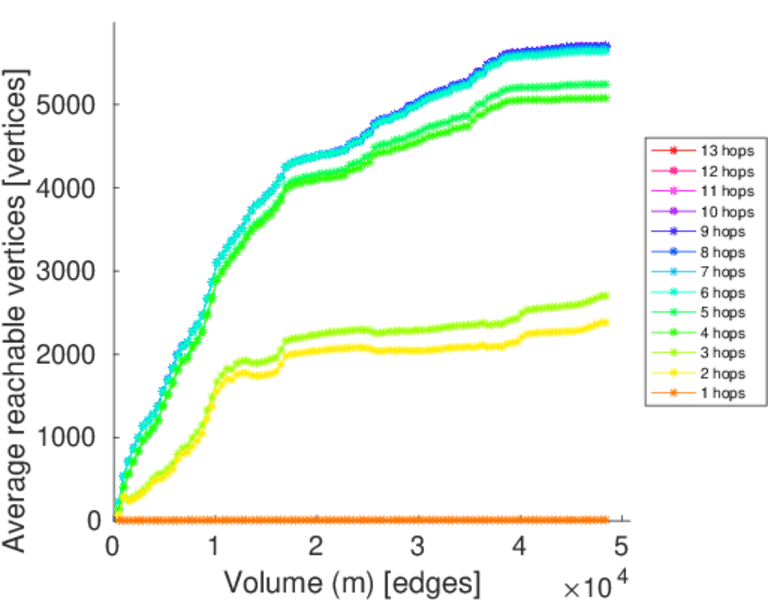
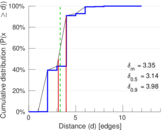
| Diameter | δ = | 13
|
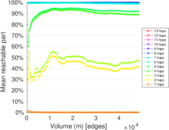
| 50-Percentile effective diameter | δ0.5 = | 3.144 73
|
| 90-Percentile effective diameter | δ0.9 = | 3.979 12
|
| Median distance | δM = | 4
|
| Mean distance | δm = | 3.348 86
|
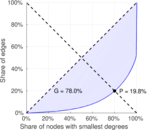
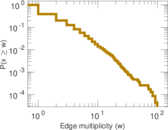
| Gini coefficient | G = | 0.772 957
|
| Balanced inequality ratio | P = | 0.201 681
|
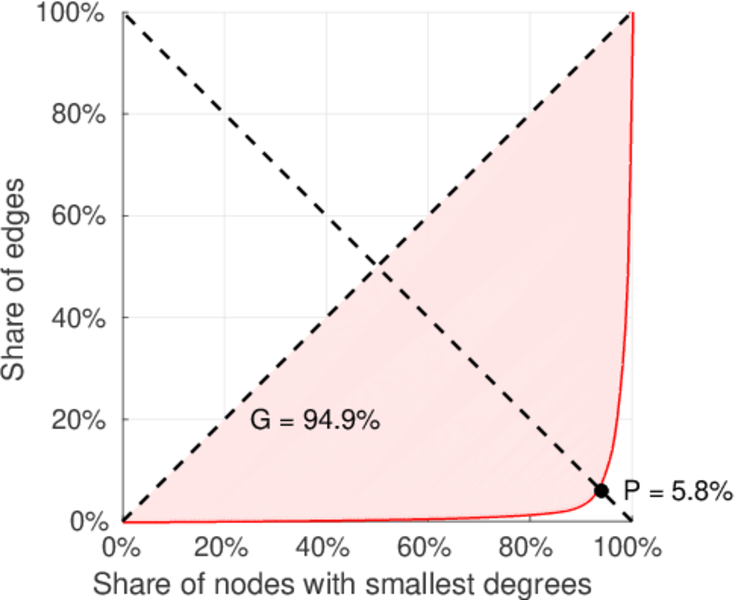
| Left balanced inequality ratio | P1 = | 0.058 290 8
|
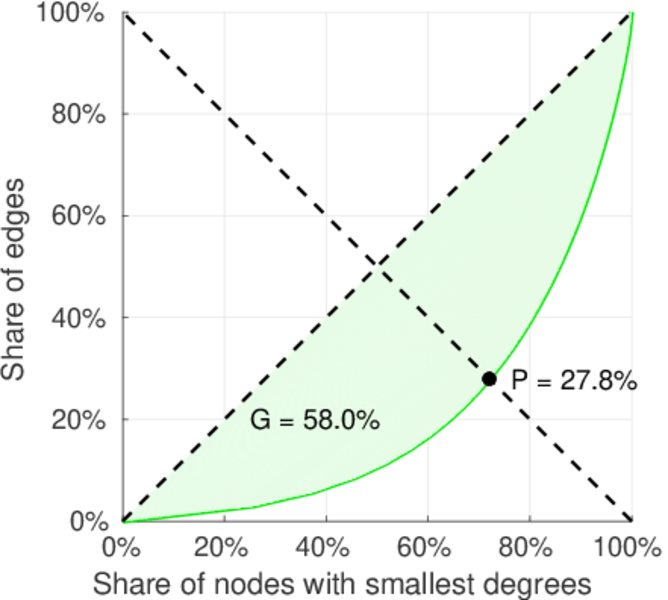
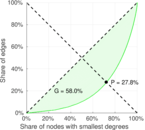
| Right balanced inequality ratio | P2 = | 0.278 117
|
| Relative edge distribution entropy | Her = | 0.751 330
|
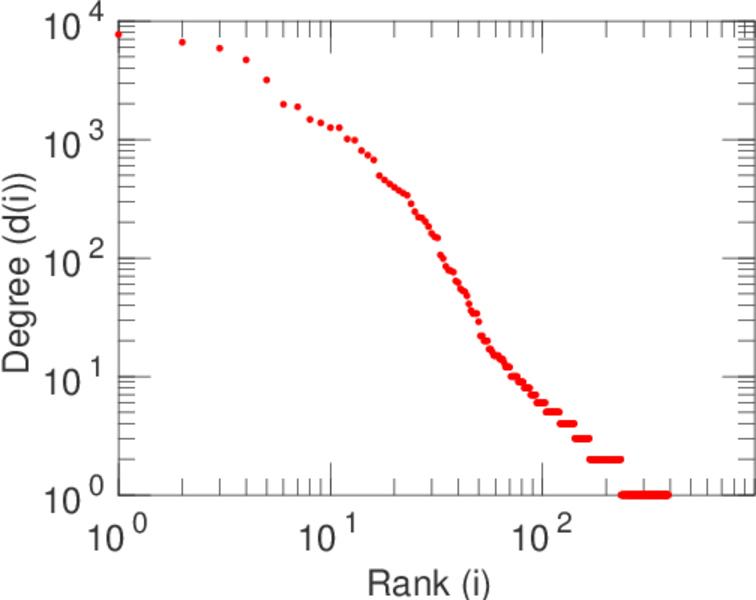
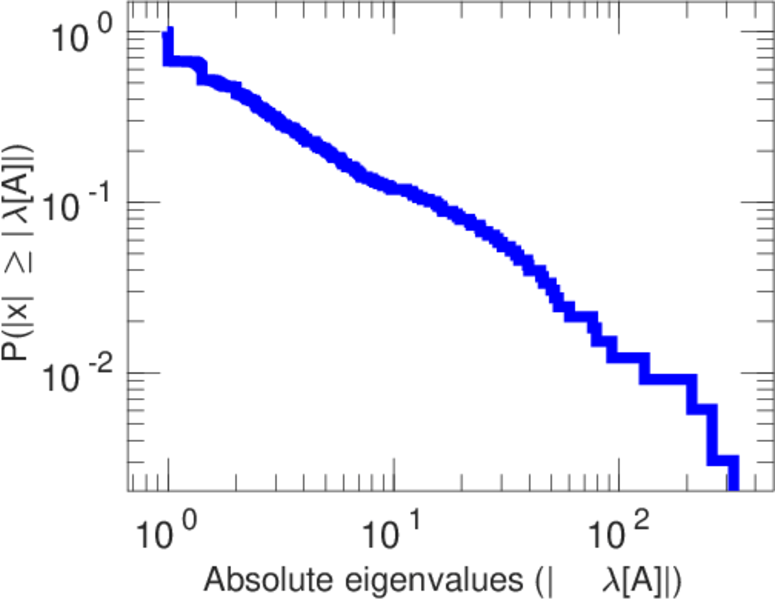
| Power law exponent | γ = | 1.997 43
|
| Tail power law exponent | γt = | 2.931 00
|
| Tail power law exponent with p | γ3 = | 2.931 00
|
| p-value | p = | 0.000 00
|
| Left tail power law exponent with p | γ3,1 = | 1.611 00
|
| Left p-value | p1 = | 0.000 00
|
| Right tail power law exponent with p | γ3,2 = | 7.381 00
|
| Right p-value | p2 = | 0.626 000
|
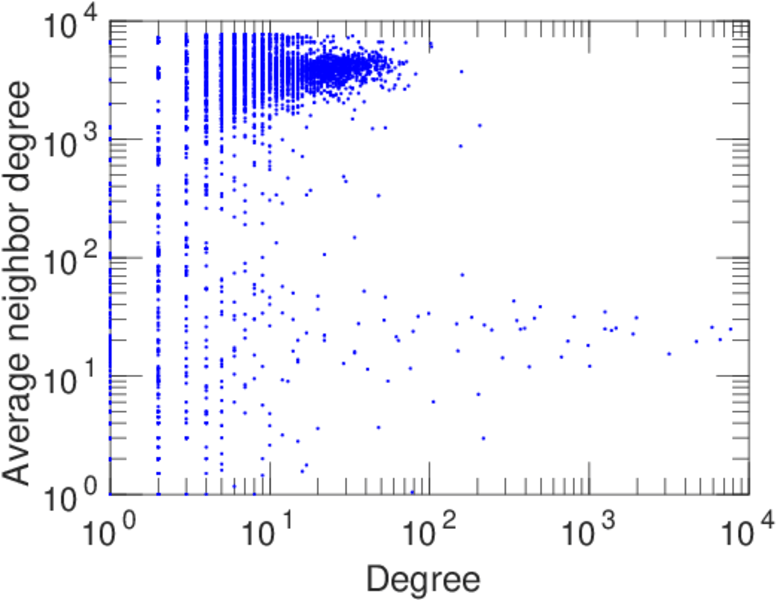
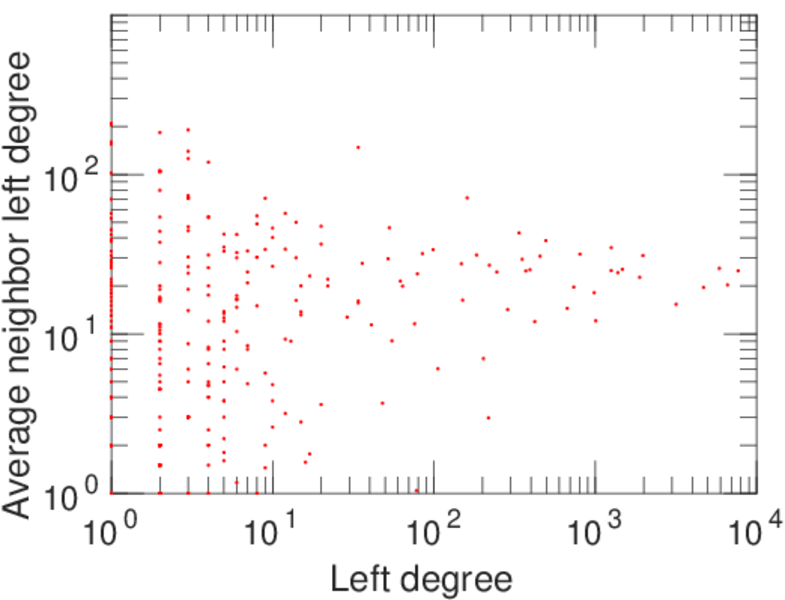
| Degree assortativity | ρ = | −0.184 868
|
| Degree assortativity p-value | pρ = | 6.036 29 × 10−177
|
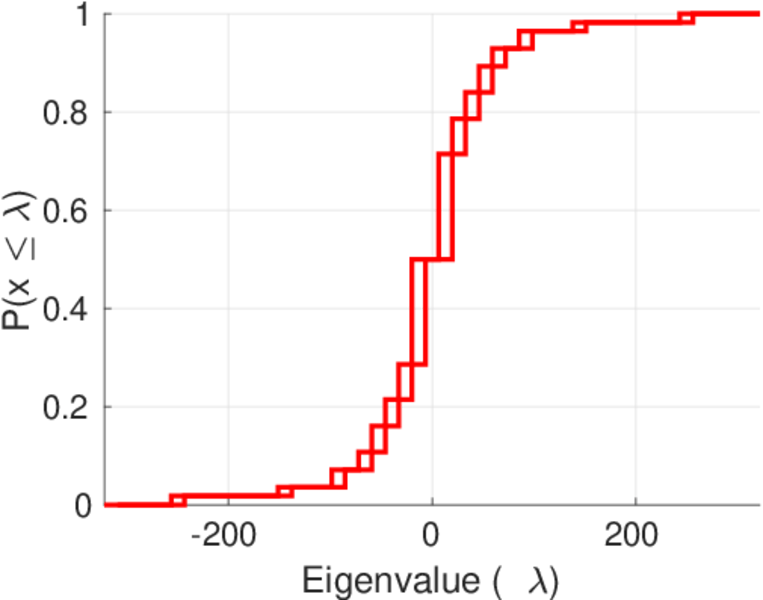
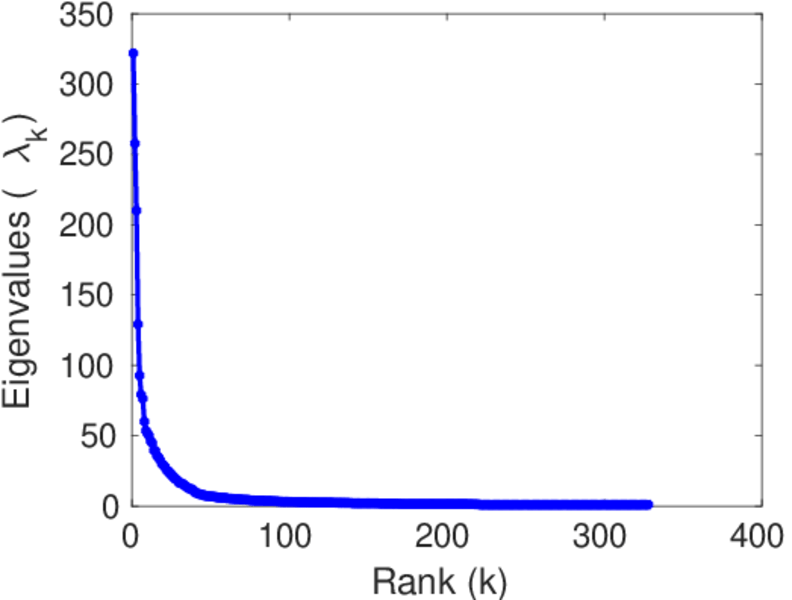
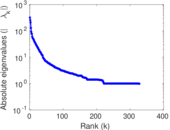
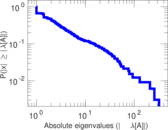
| Spectral norm | α = | 321.925
|
| Algebraic connectivity | a = | 0.006 441 09
|
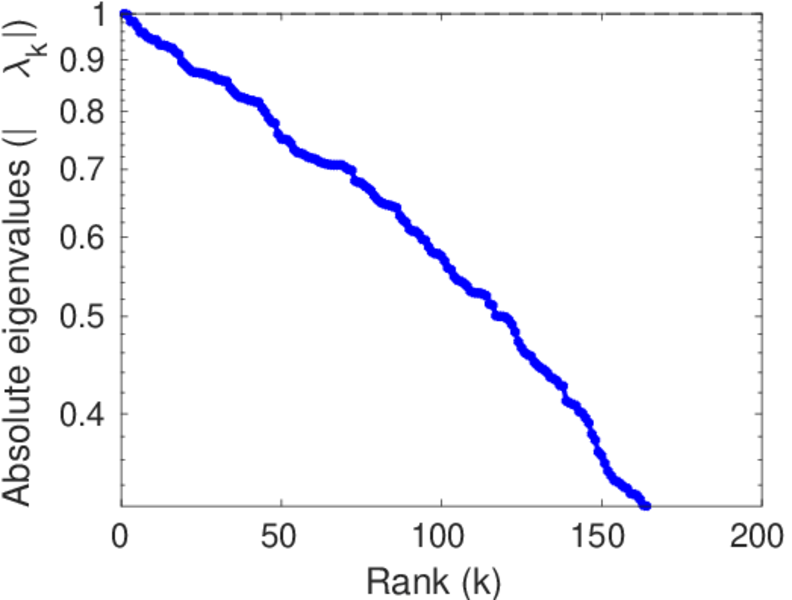
| Spectral separation | |λ1[A] / λ2[A]| = | 1.249 29
|
| Controllability | C = | 5,248
|
| Relative controllability | Cr = | 0.877 886
|
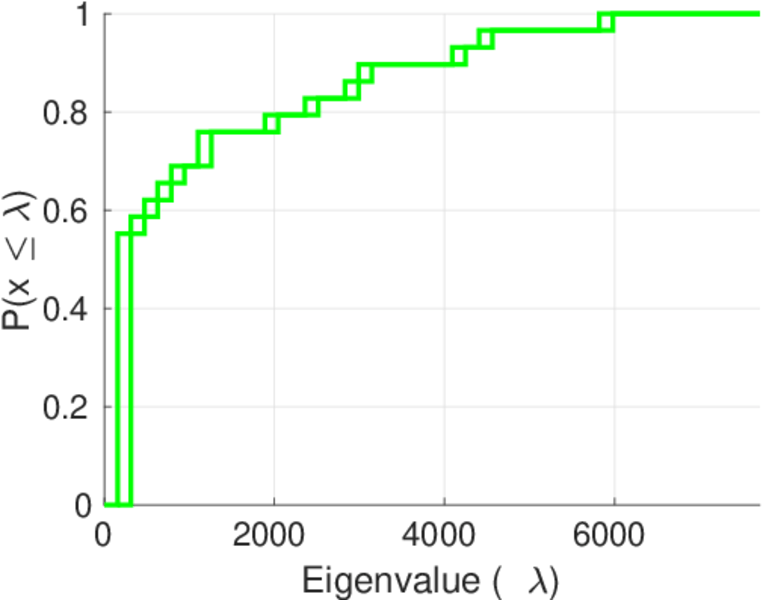
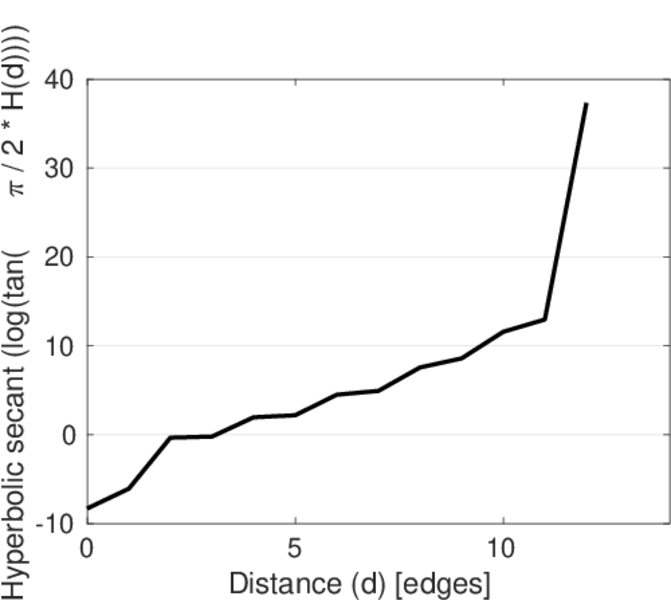
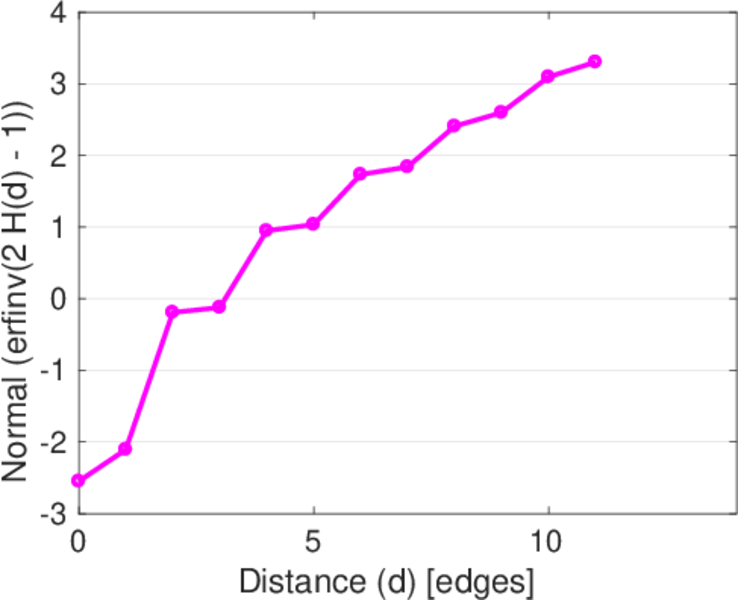
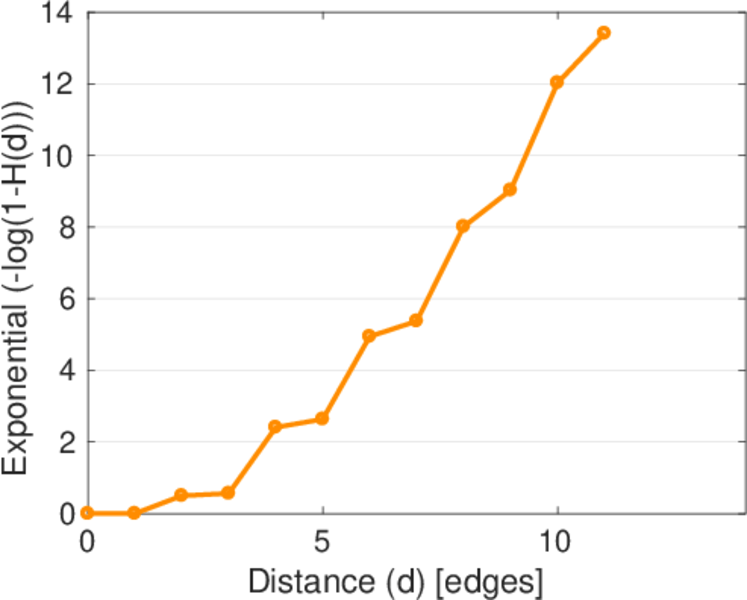
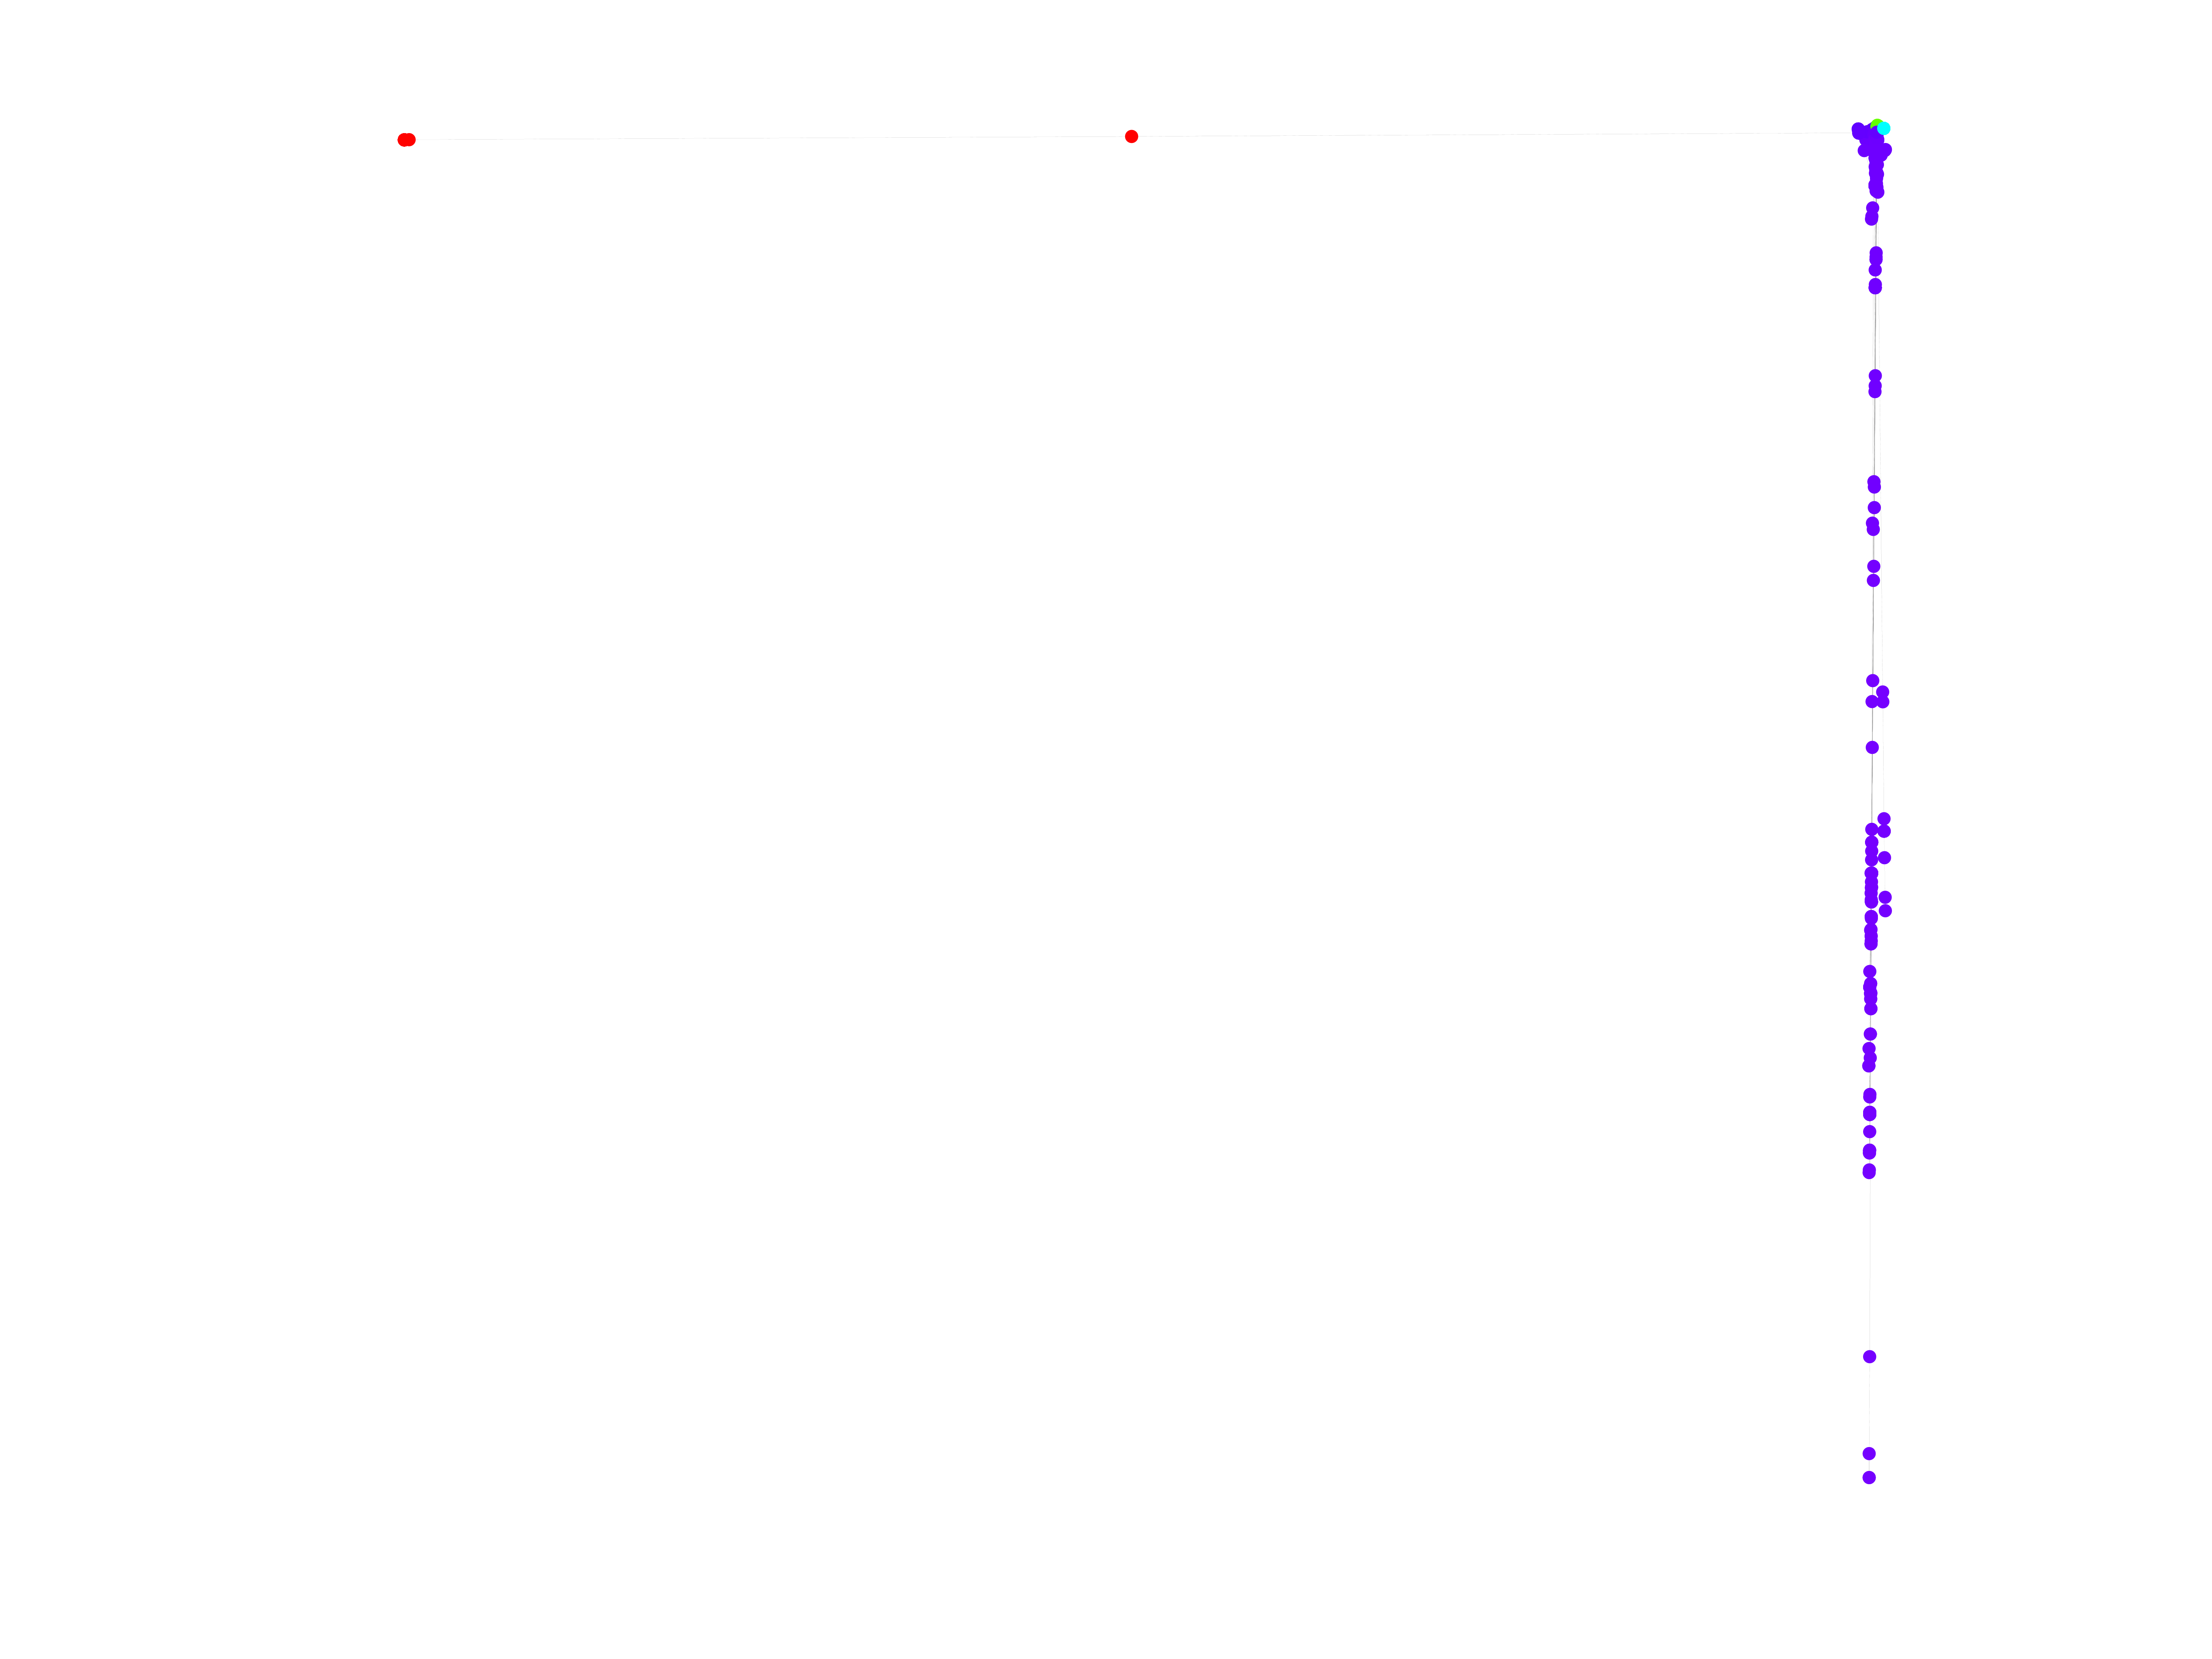
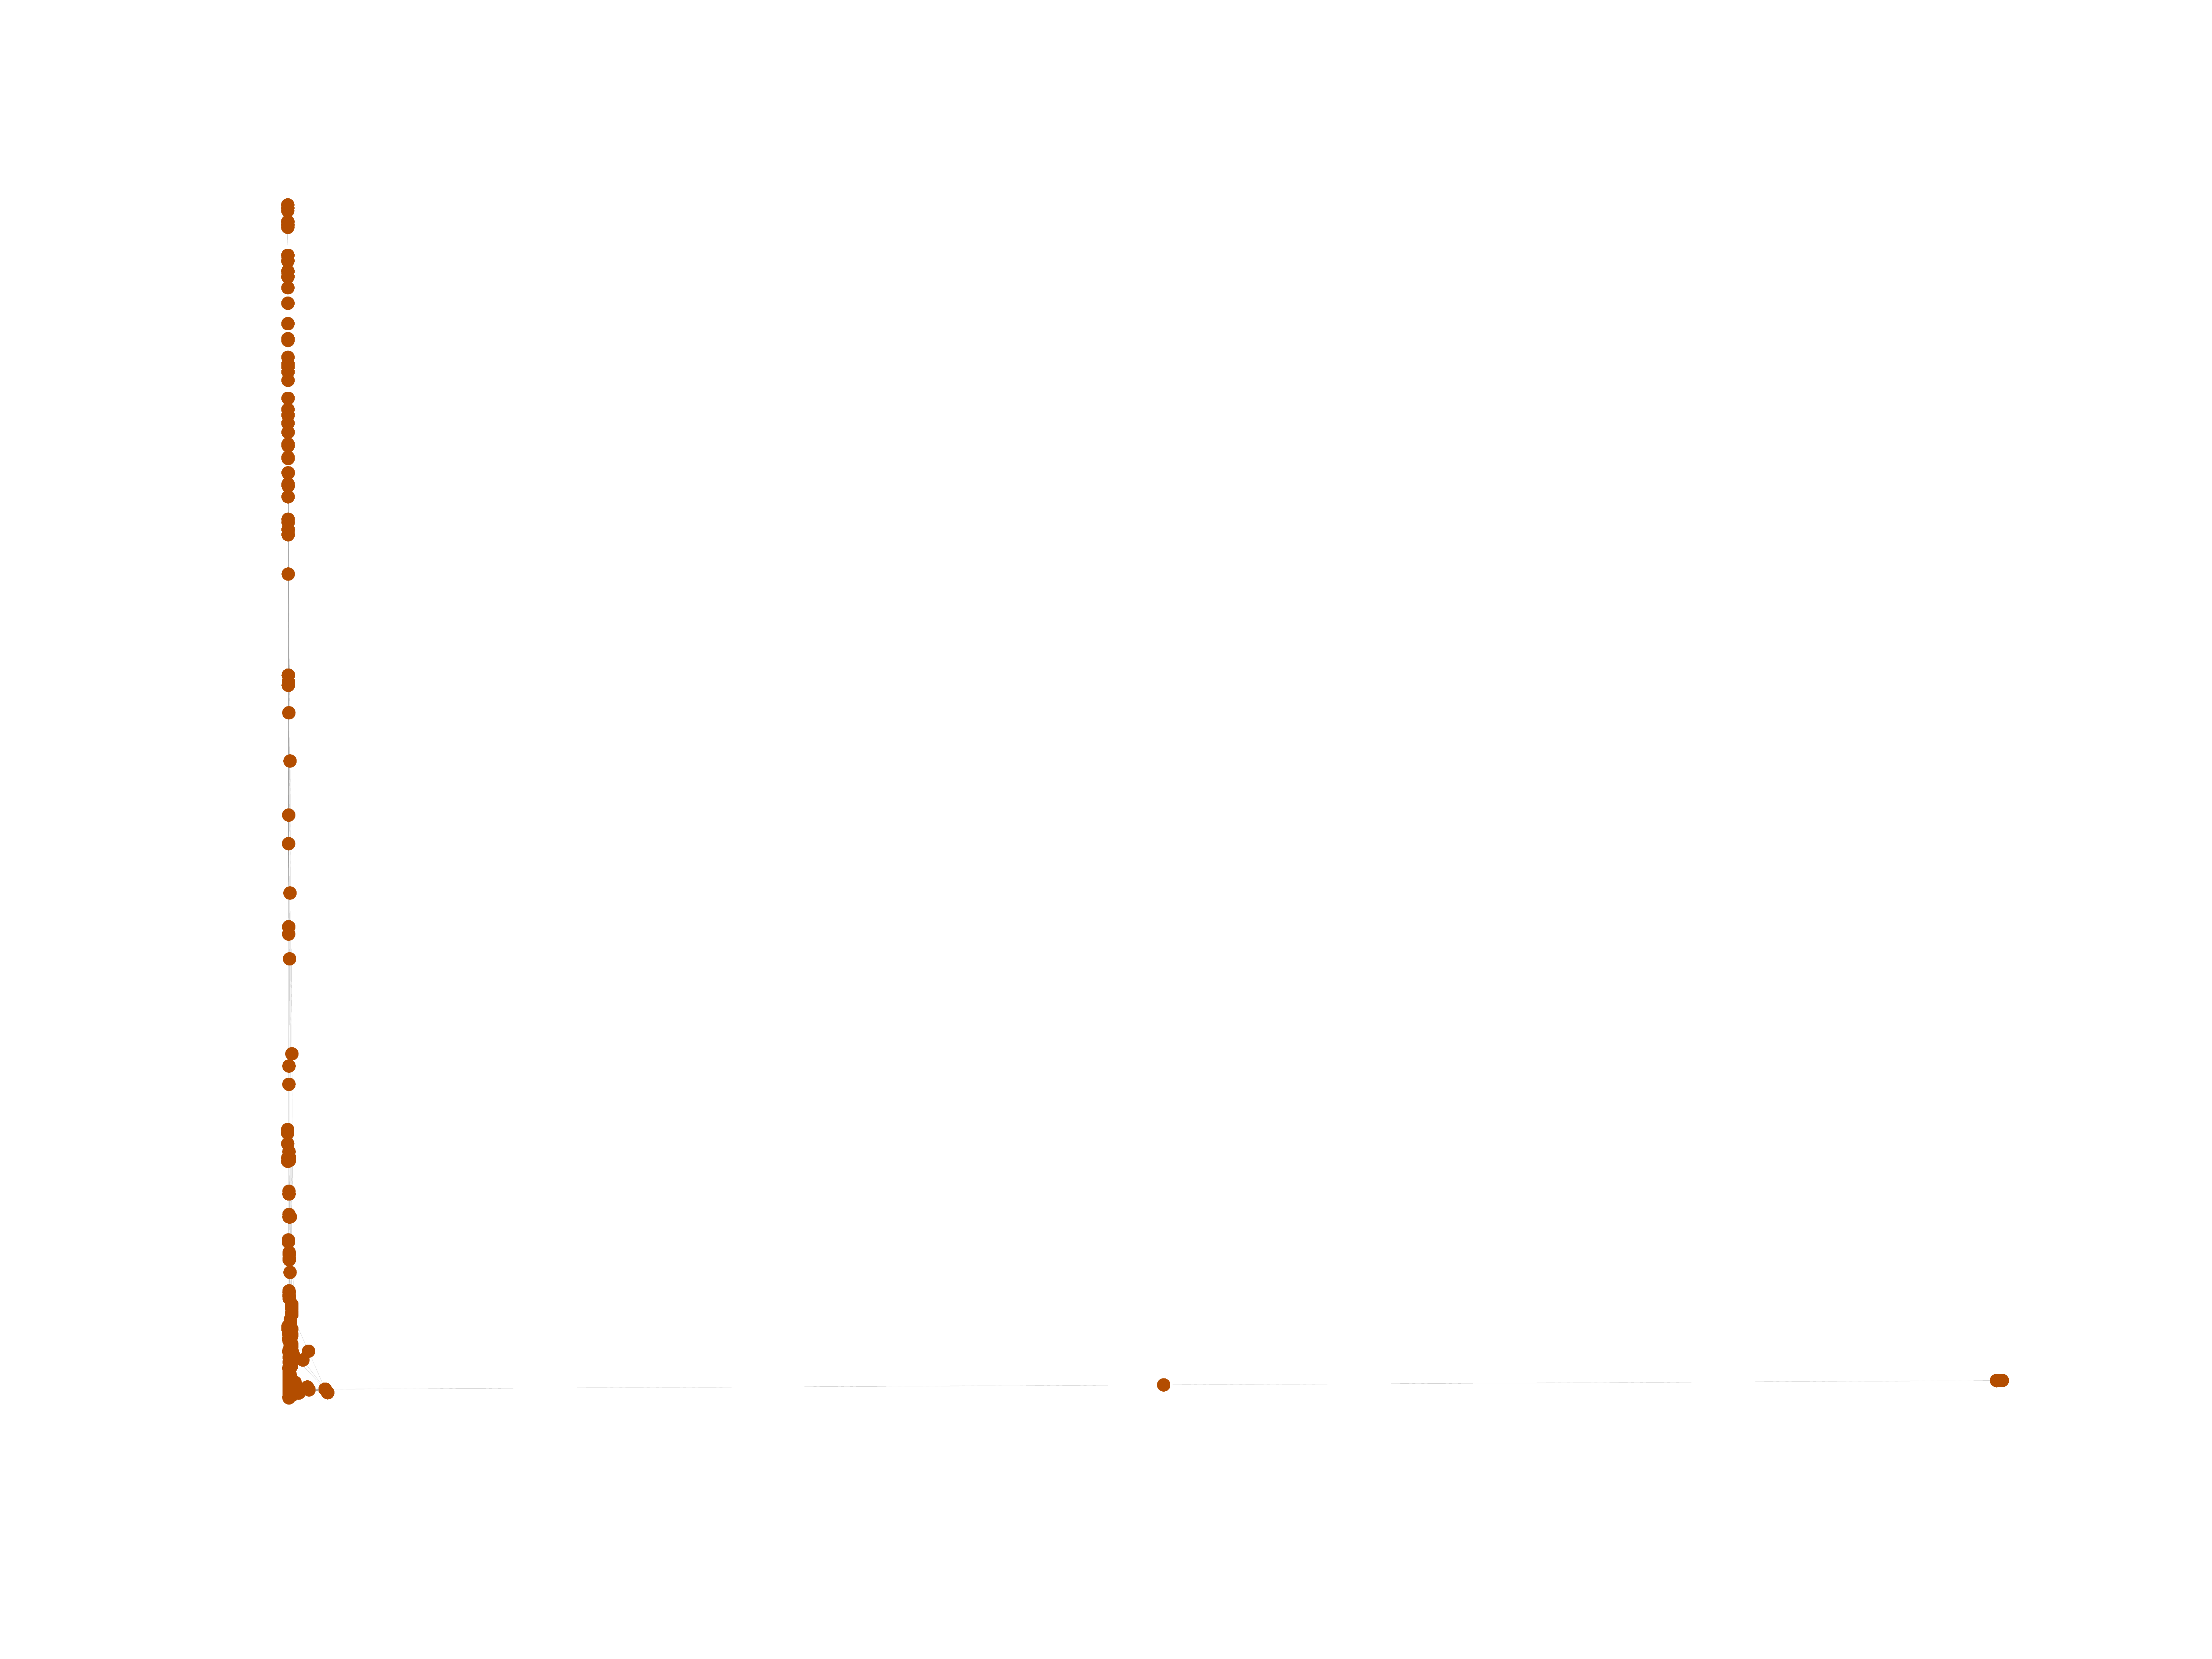
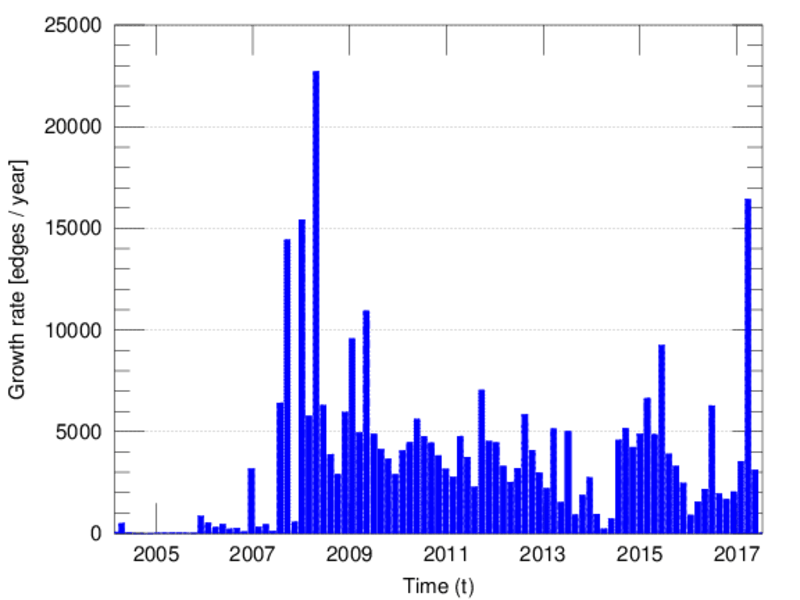
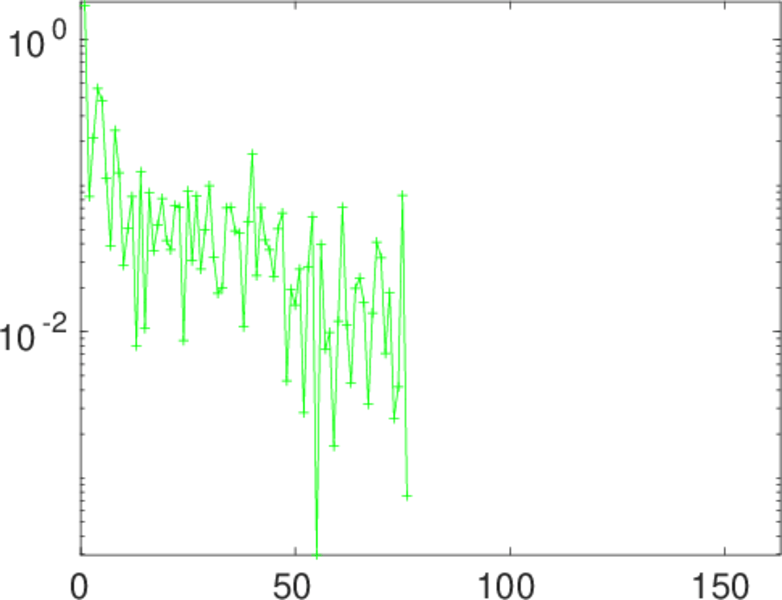
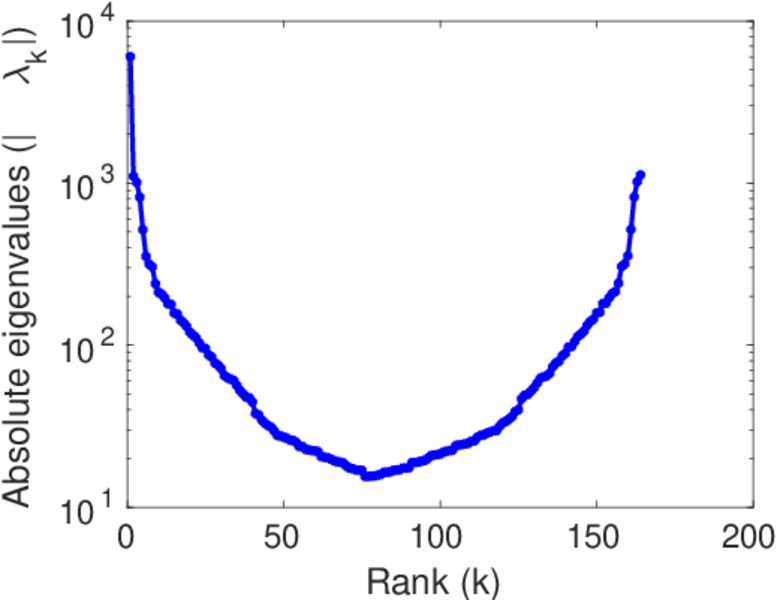
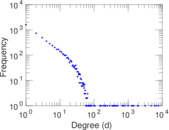
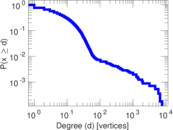
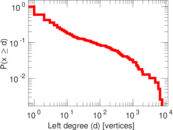
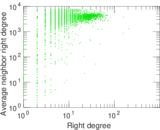
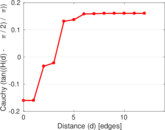
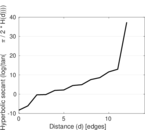
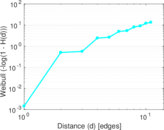
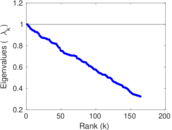
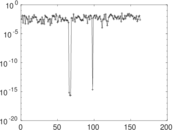
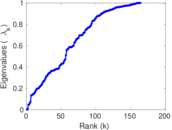
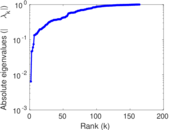
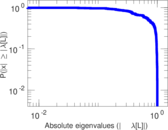
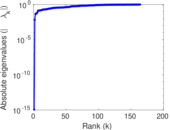
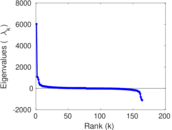
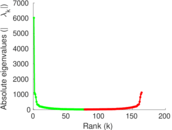
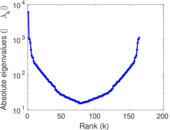
Plots


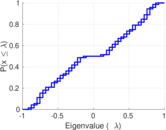


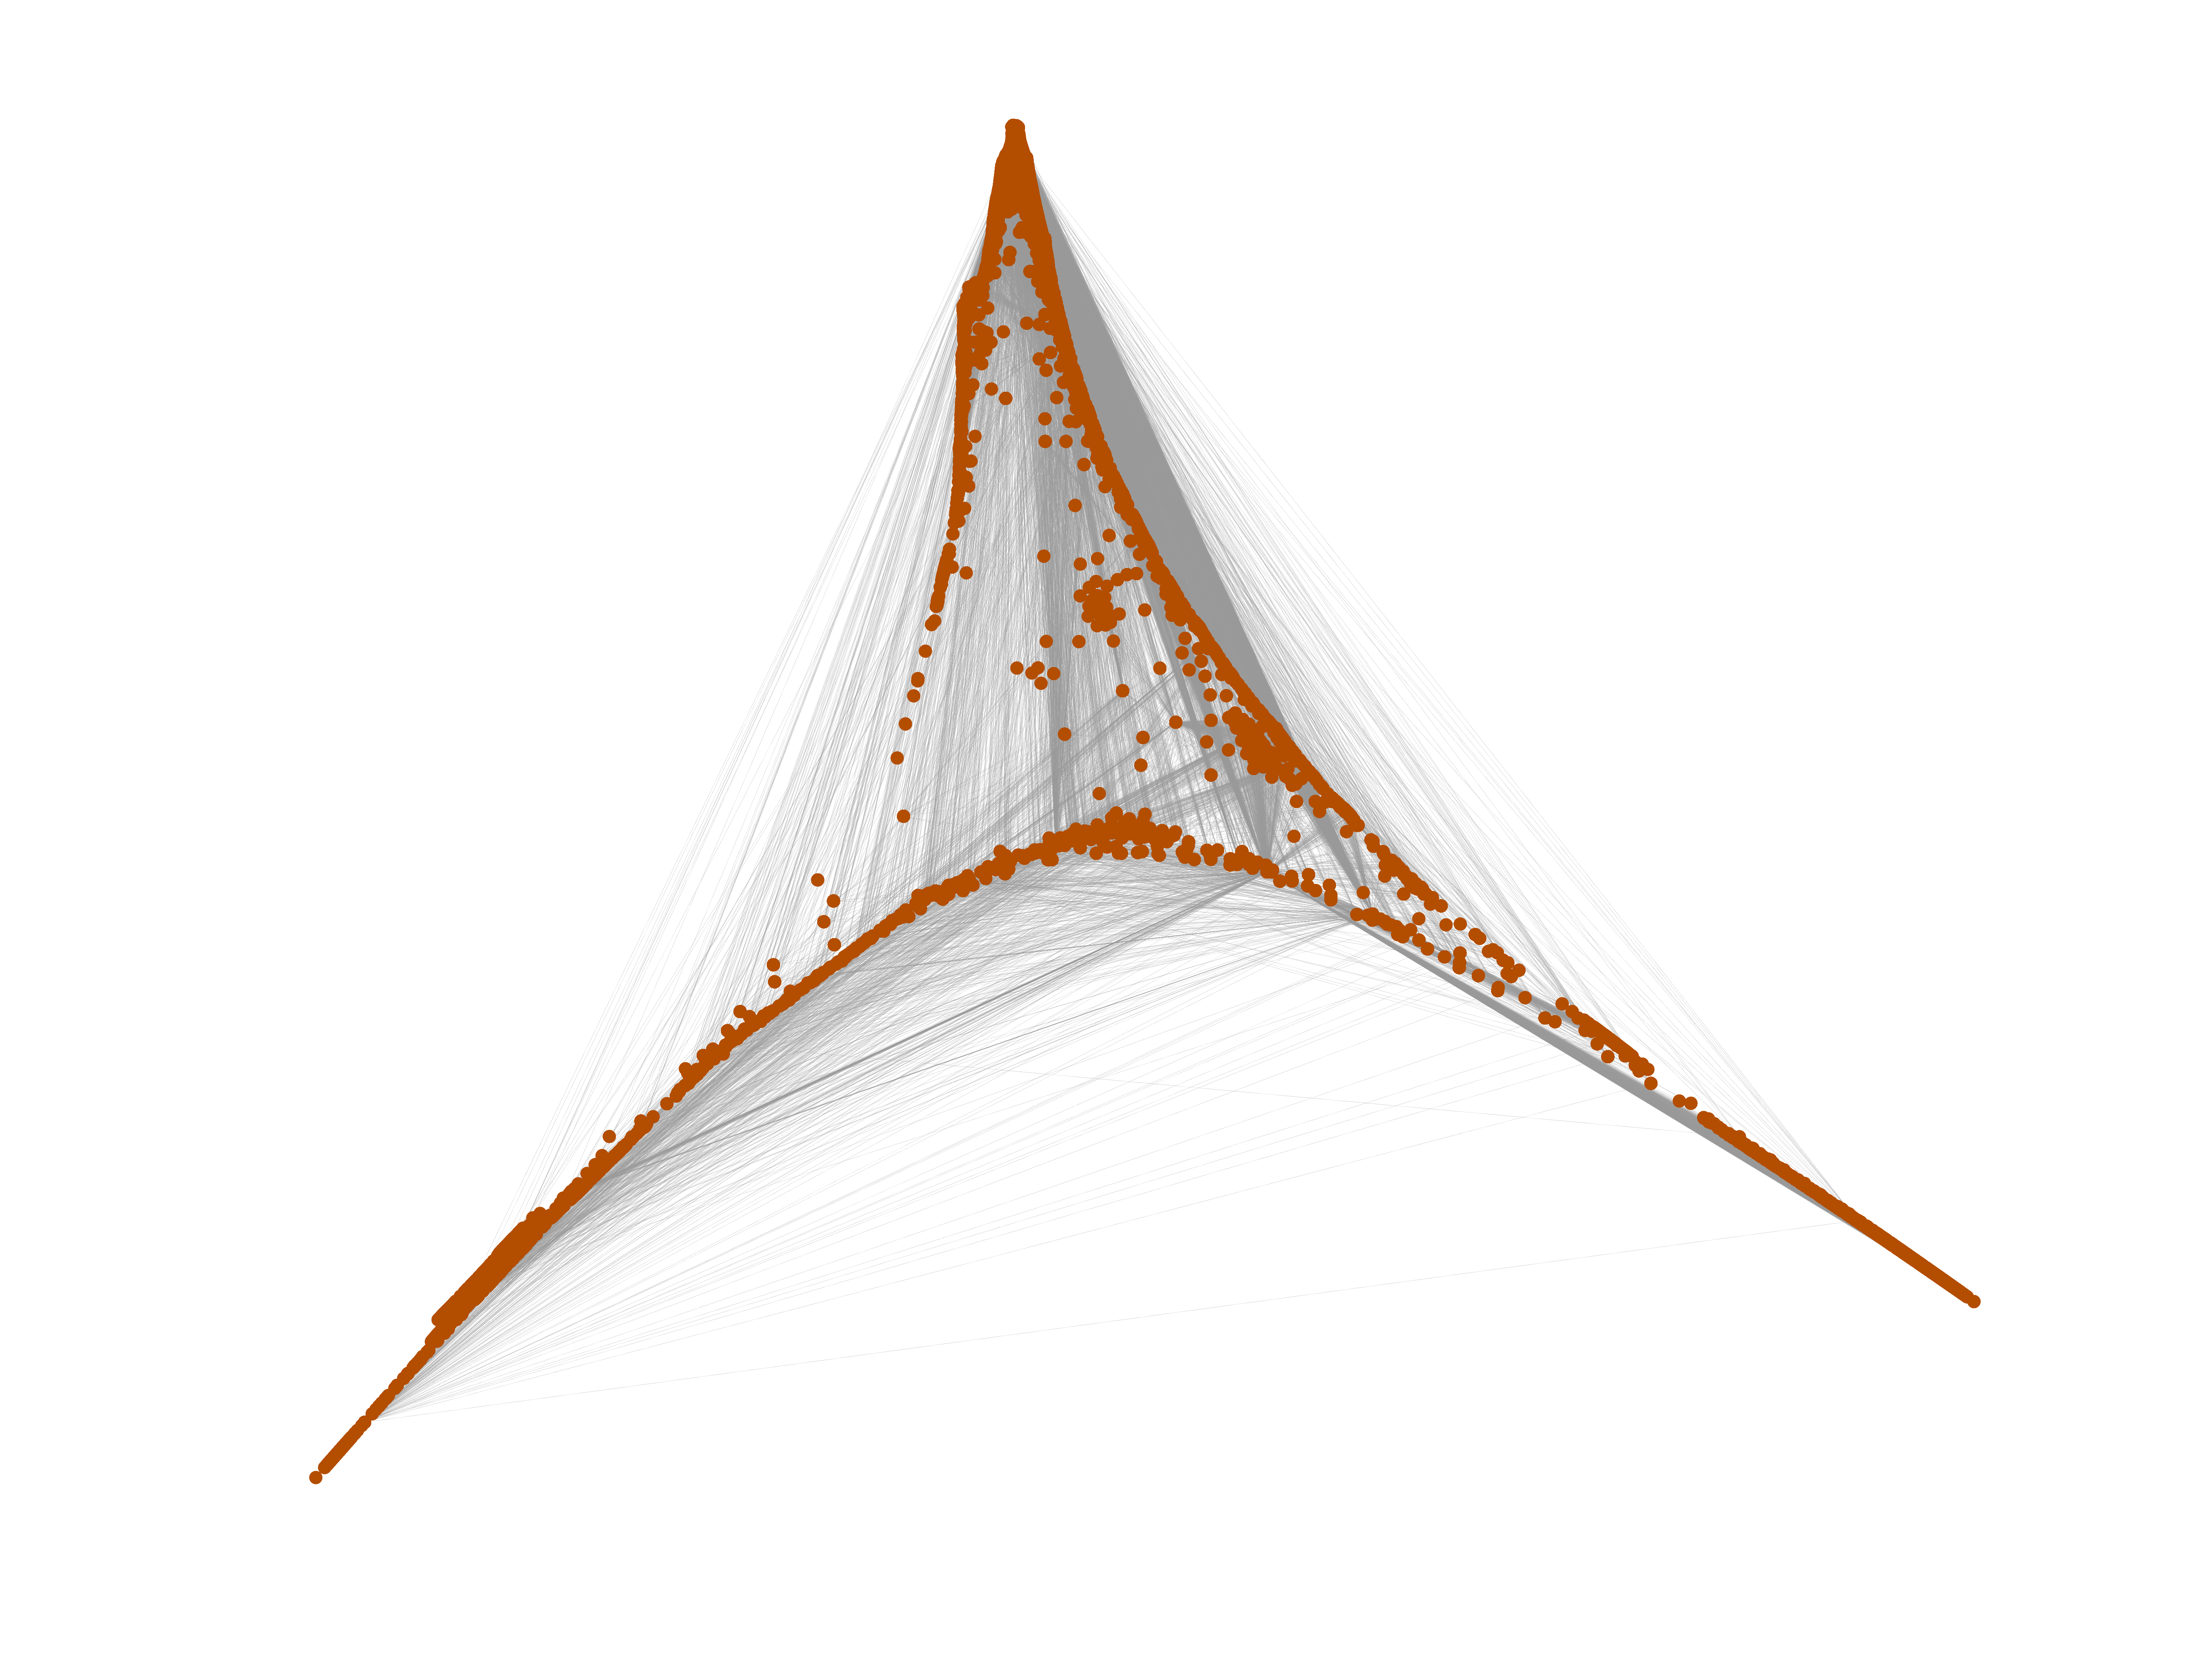
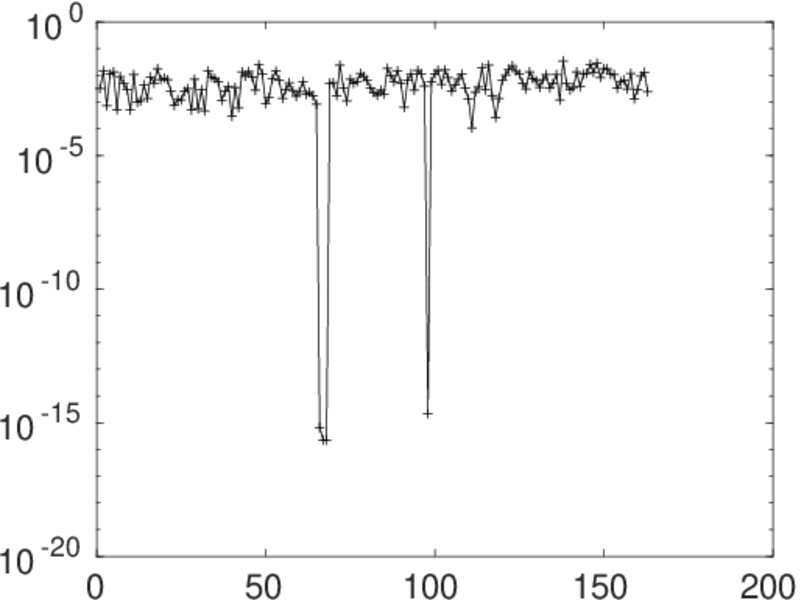
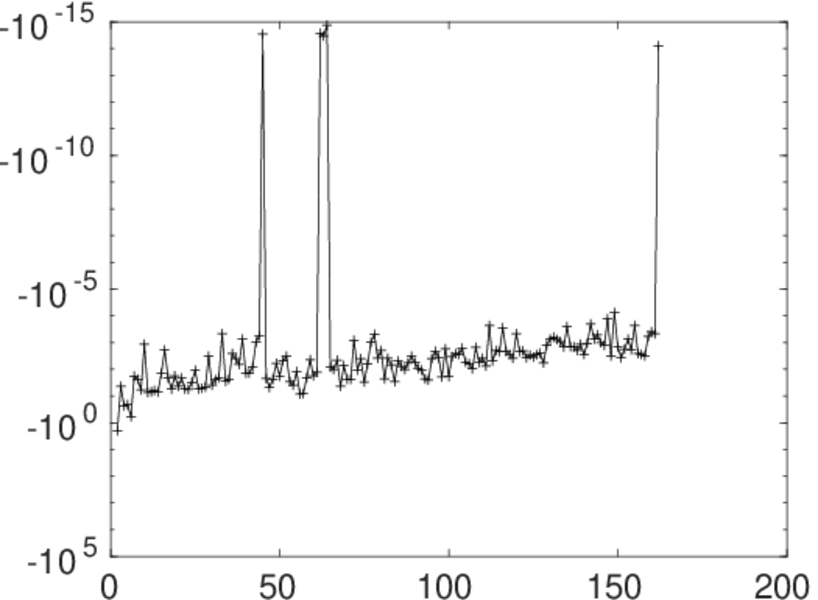
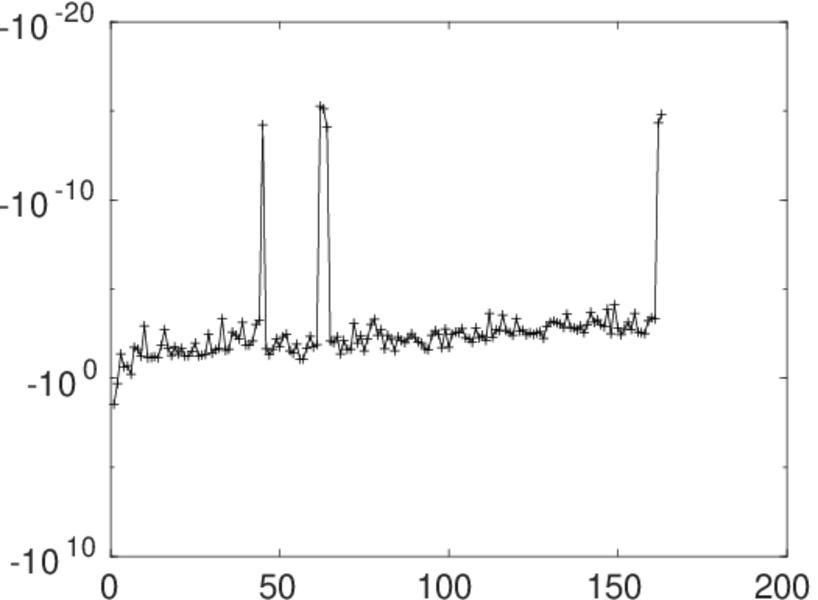
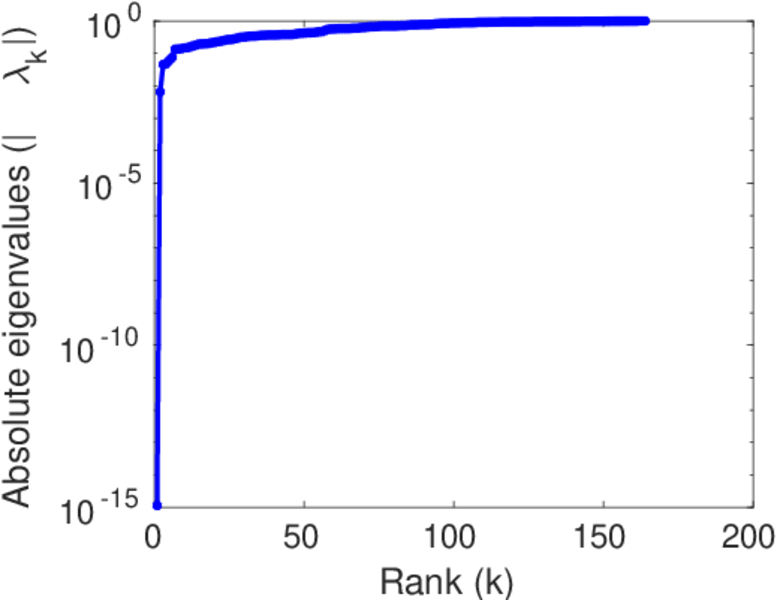
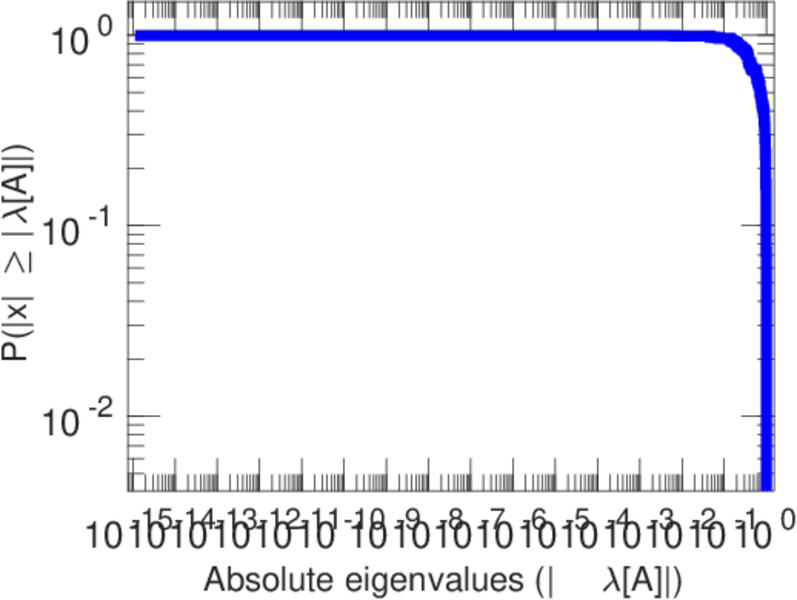
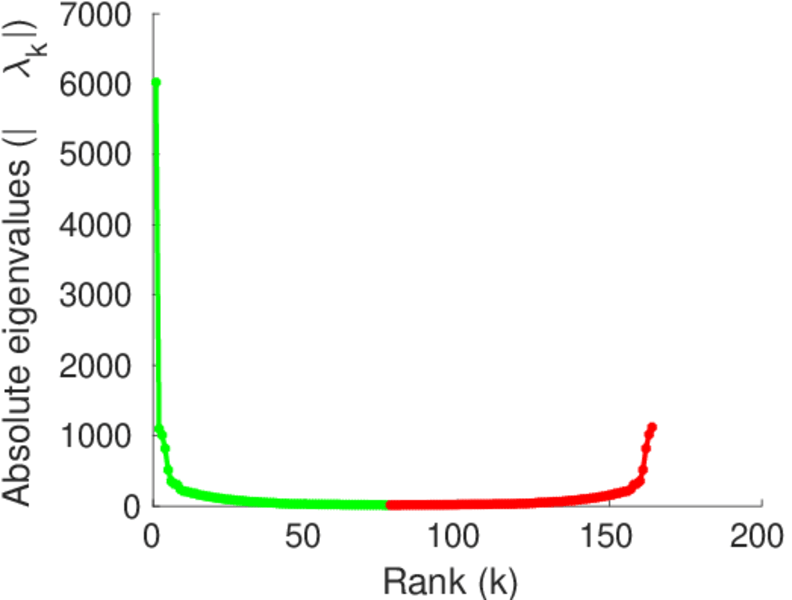
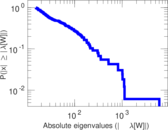
Matrix decompositions plots


Downloads
References
|
[1]
|
Jérôme Kunegis.
KONECT – The Koblenz Network Collection.
In Proc. Int. Conf. on World Wide Web Companion, pages
1343–1350, 2013.
[ http ]
|
|
[2]
|
Wikimedia Foundation.
Wikimedia downloads.
http://dumps.wikimedia.org/, January 2010.
|
 KONECT ‣ Networks ‣
Buy Me a Coffee
KONECT ‣ Networks ‣
Buy Me a Coffee