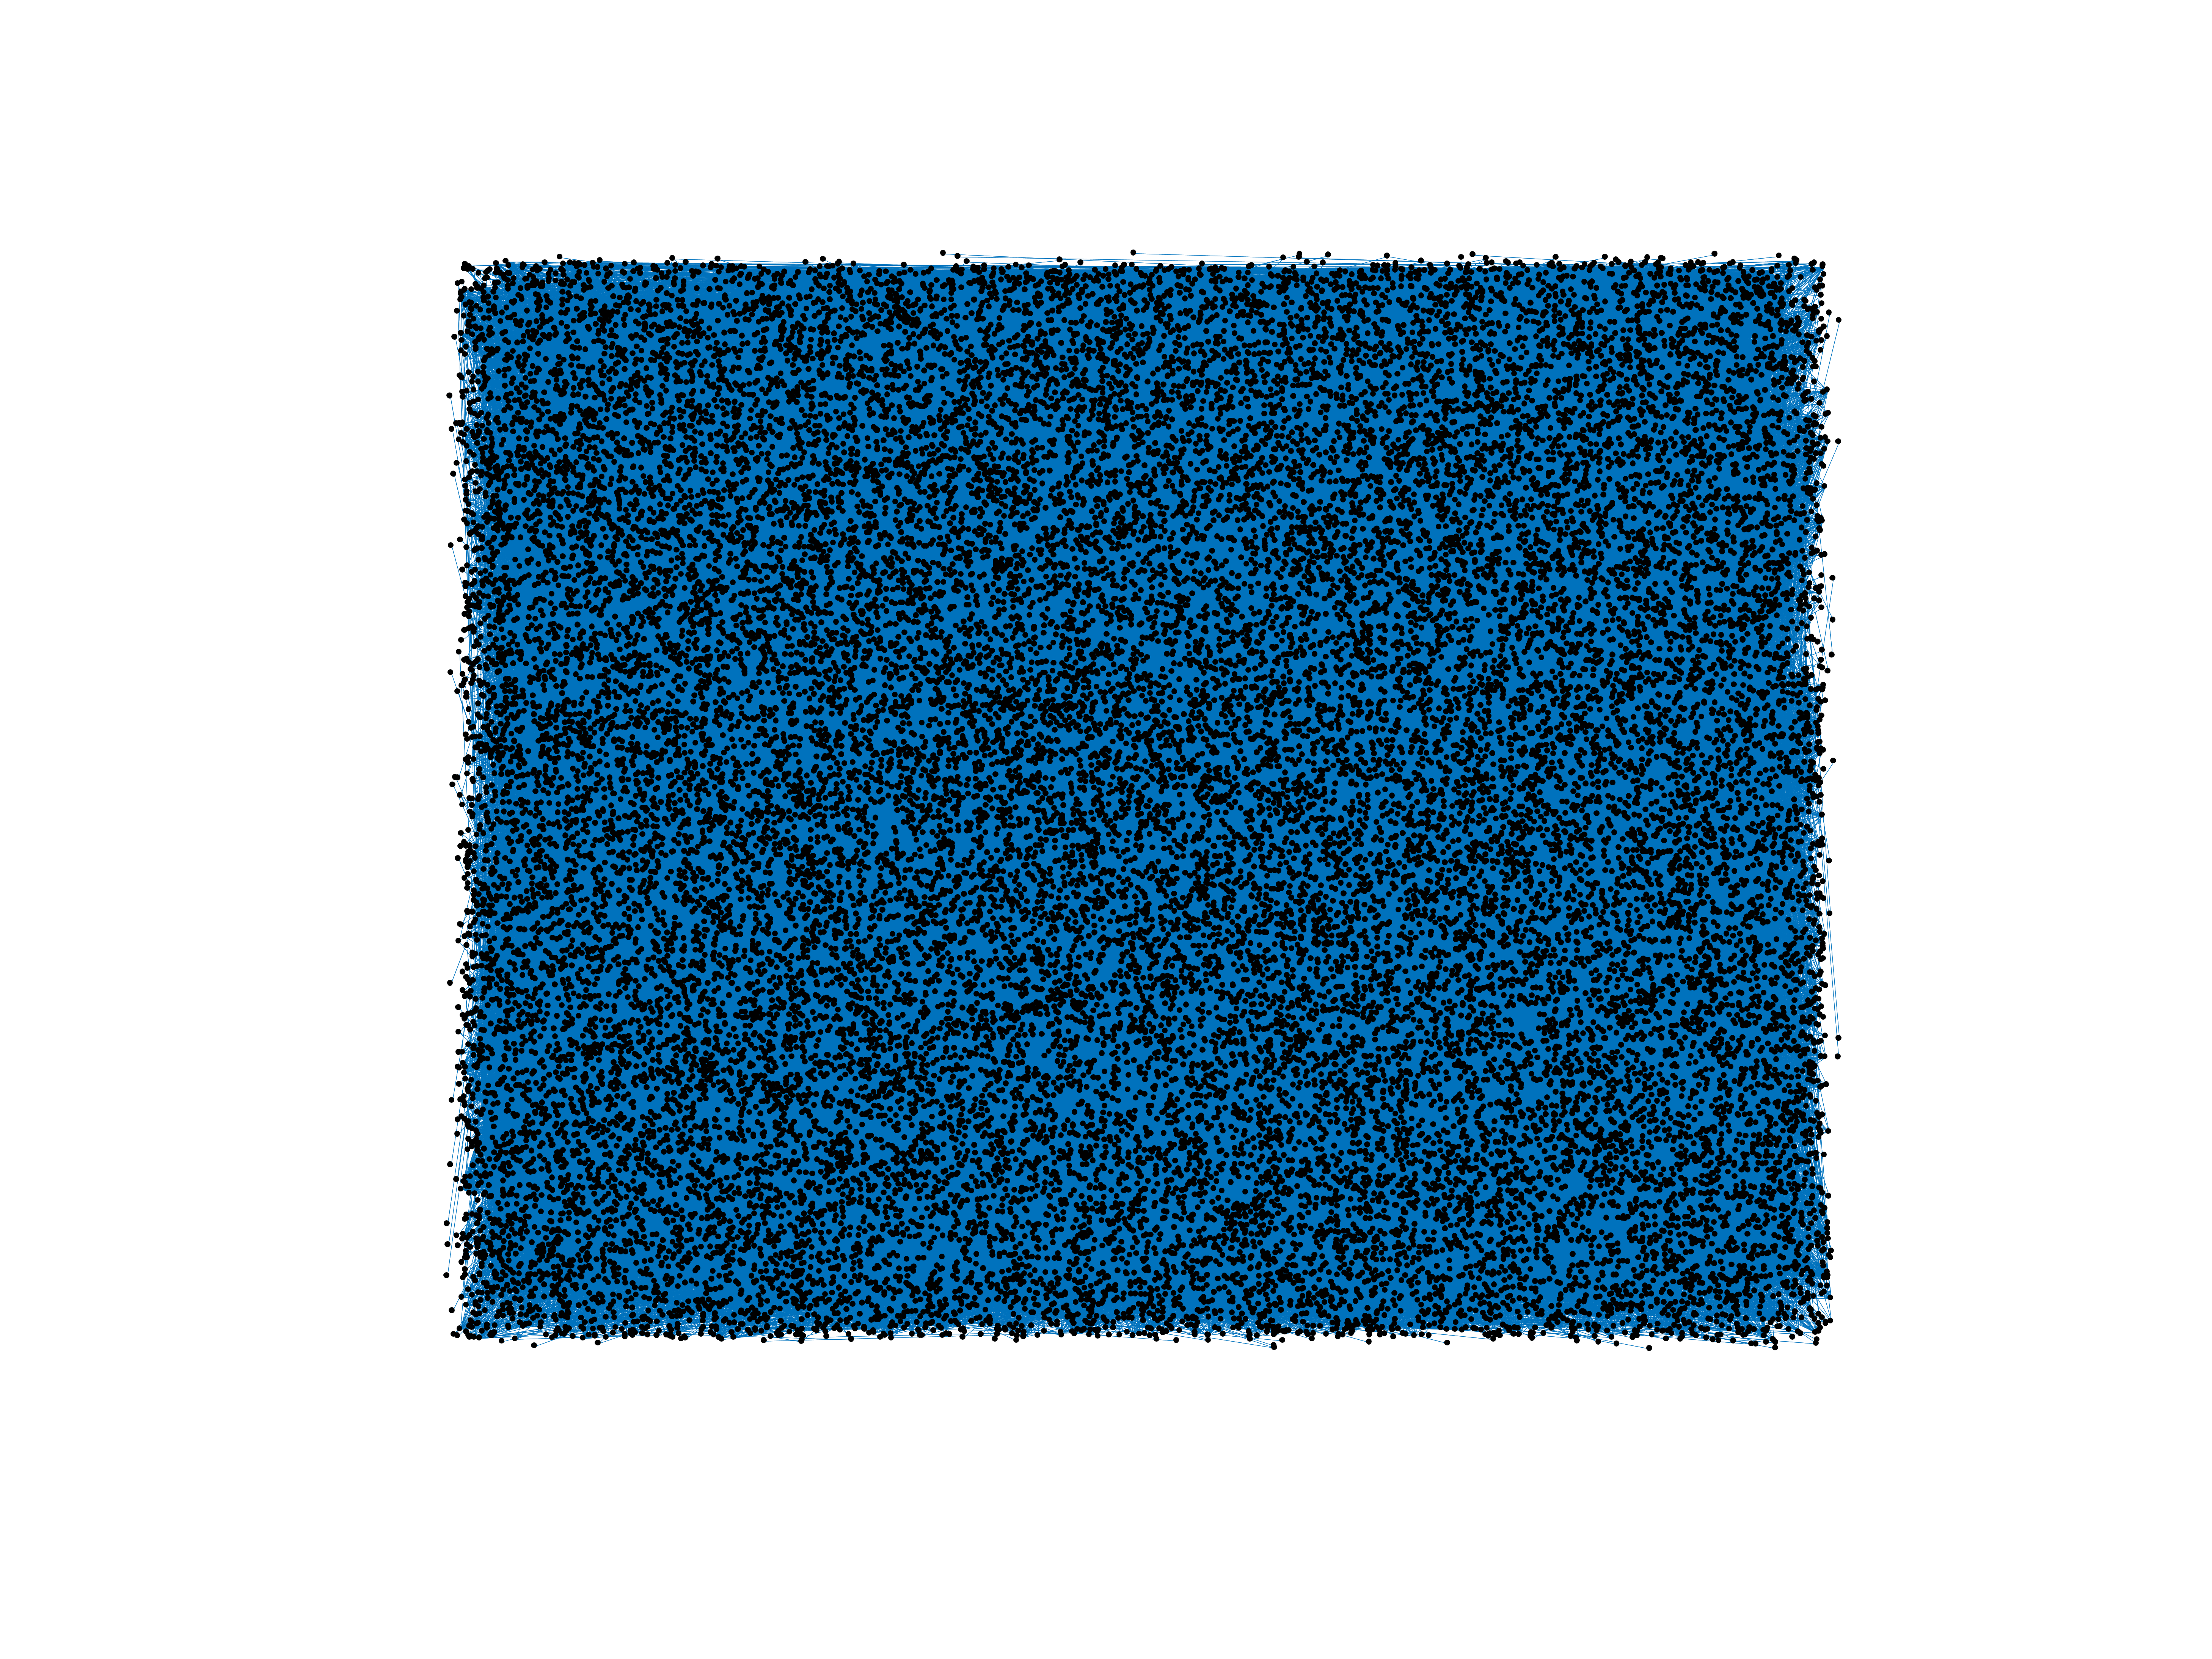
Wikipedia edits (gd)
This is the bipartite edit network of the Scottish Gaelic Wikipedia. It
contains users and pages from the Scottish Gaelic Wikipedia, connected by edit
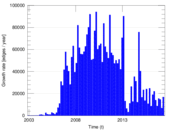
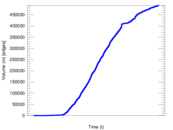
events. Each edge represents an edit. The dataset includes the timestamp of
each edit.
Metadata
Statistics
| Size | n = | 32,651
|
| Left size | n1 = | 2,995
|
| Right size | n2 = | 29,656
|
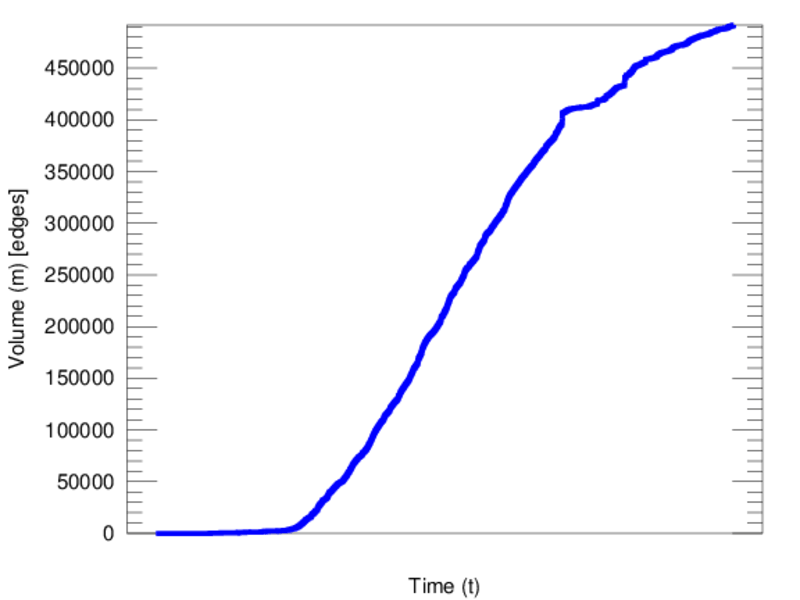
| Volume | m = | 491,755
|
| Unique edge count | m̿ = | 209,969
|
| Wedge count | s = | 448,675,092
|
| Claw count | z = | 987,941,598,069
|
| Cross count | x = | 1,929,952,638,321,431
|
| Square count | q = | 1,615,636,127
|
| 4-Tour count | T4 = | 14,720,281,234
|
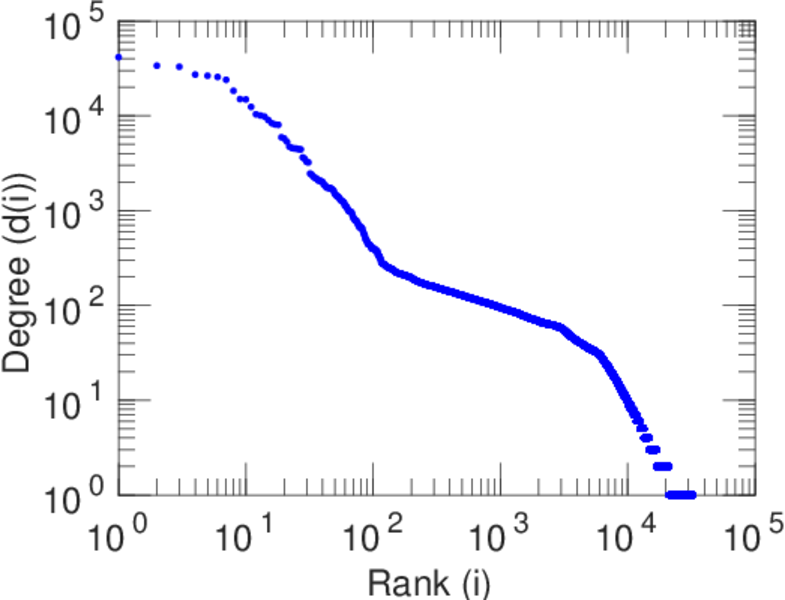
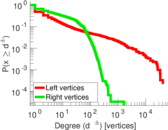
| Maximum degree | dmax = | 41,541
|
| Maximum left degree | d1max = | 41,541
|
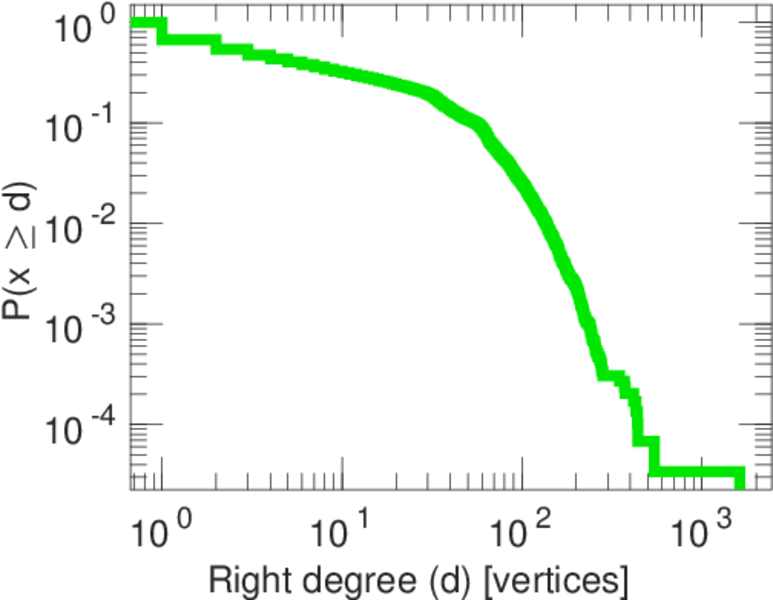
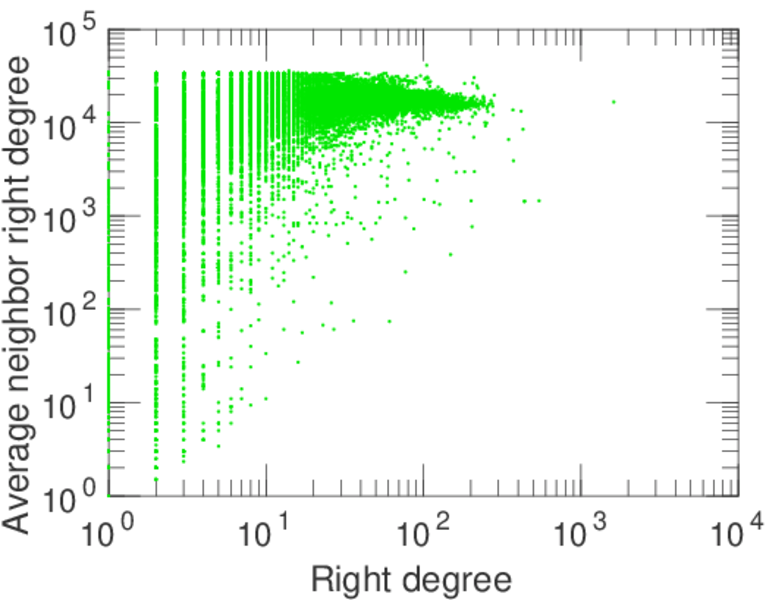
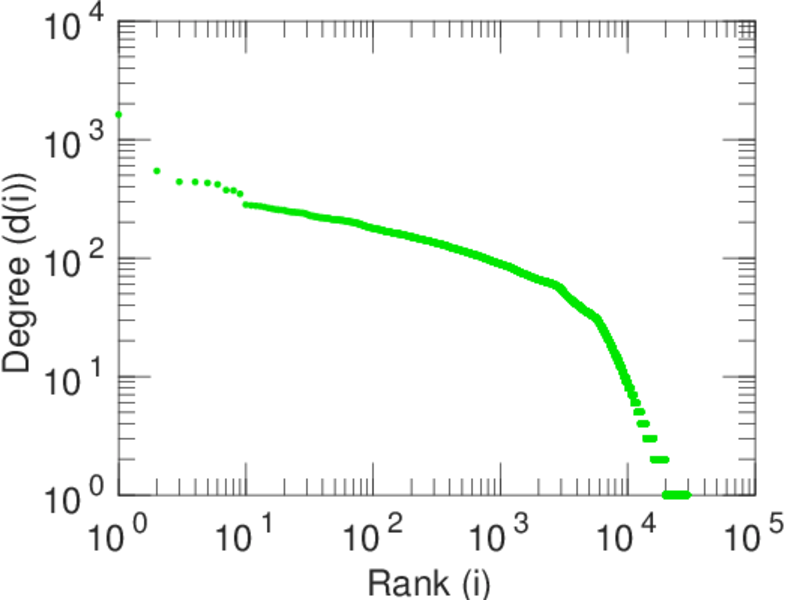
| Maximum right degree | d2max = | 1,622
|
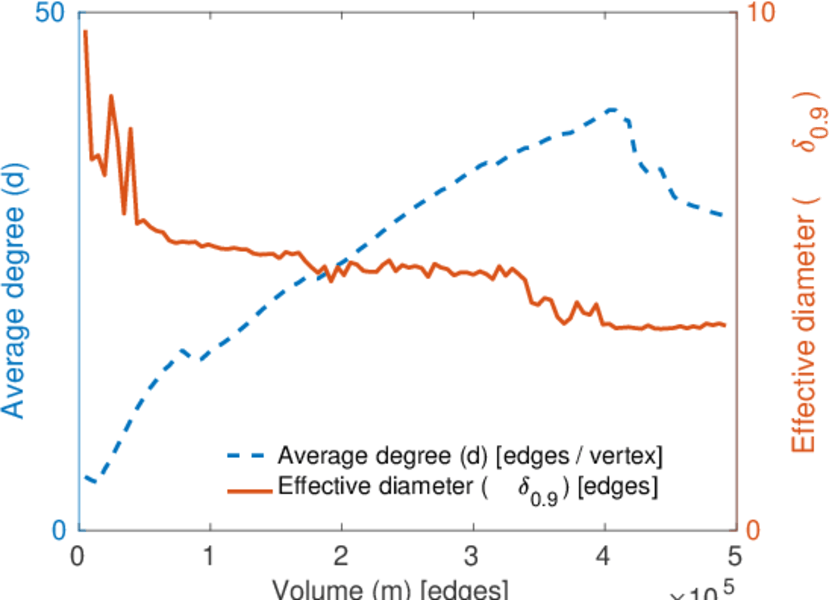
| Average degree | d = | 30.121 9
|
| Average left degree | d1 = | 164.192
|
| Average right degree | d2 = | 16.582 0
|
| Fill | p = | 0.002 363 99
|
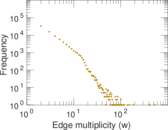
| Average edge multiplicity | m̃ = | 2.342 04
|
| Size of LCC | N = | 31,829
|
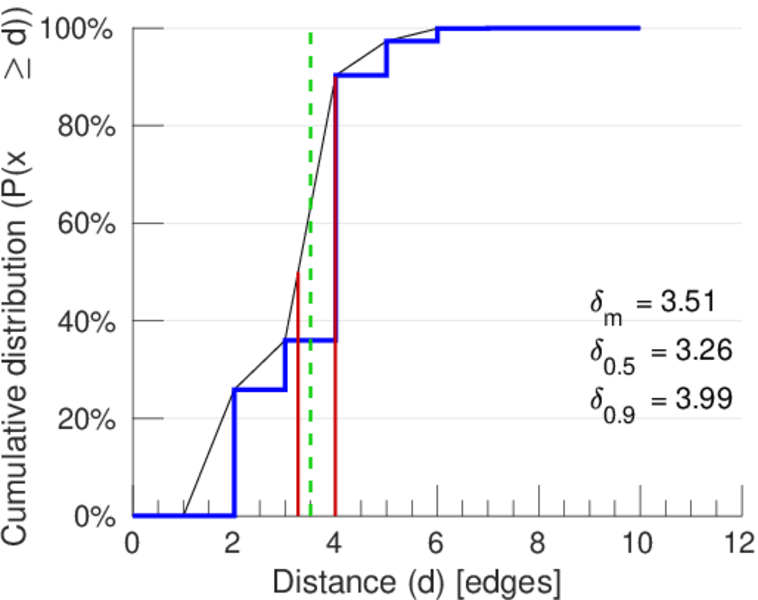
| Diameter | δ = | 13
|
| 50-Percentile effective diameter | δ0.5 = | 3.258 37
|
| 90-Percentile effective diameter | δ0.9 = | 3.994 84
|
| Median distance | δM = | 4
|
| Mean distance | δm = | 3.506 76
|
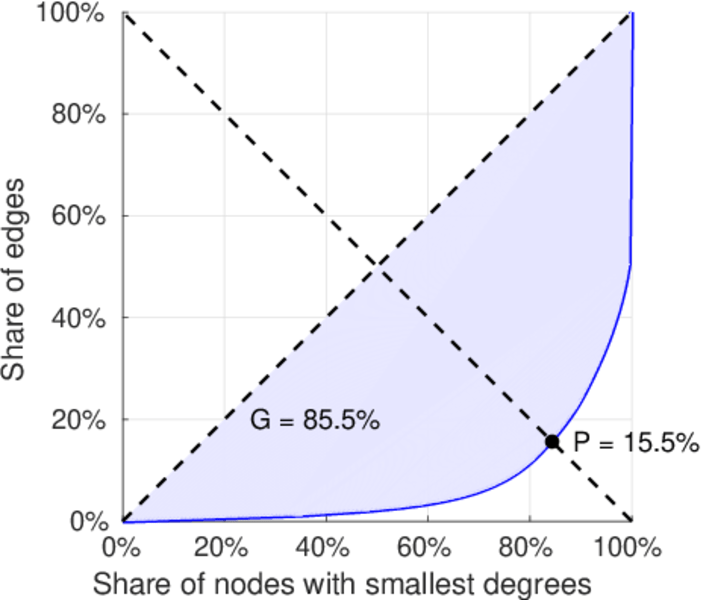
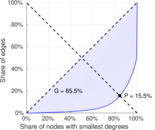
| Gini coefficient | G = | 0.850 459
|
| Balanced inequality ratio | P = | 0.159 061
|
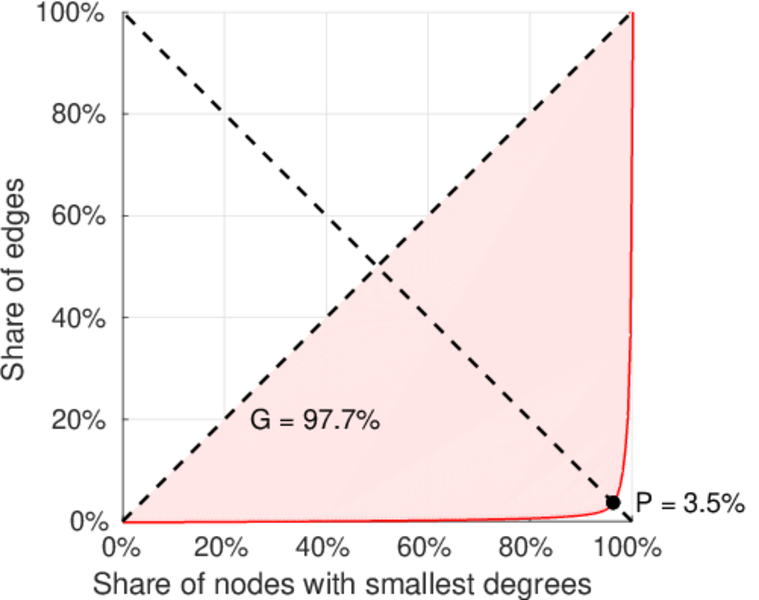
| Left balanced inequality ratio | P1 = | 0.035 068 3
|
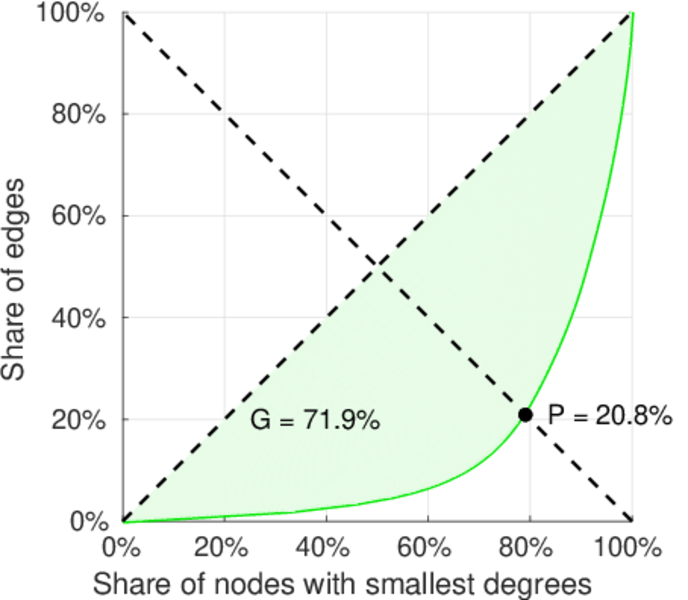
| Right balanced inequality ratio | P2 = | 0.207 536
|
| Relative edge distribution entropy | Her = | 0.742 944
|
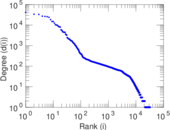
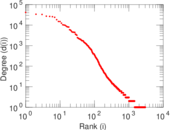
| Power law exponent | γ = | 1.910 24
|
| Tail power law exponent | γt = | 1.631 00
|
| Tail power law exponent with p | γ3 = | 1.631 00
|
| p-value | p = | 0.000 00
|
| Left tail power law exponent with p | γ3,1 = | 1.531 00
|
| Left p-value | p1 = | 0.000 00
|
| Right tail power law exponent with p | γ3,2 = | 6.531 00
|
| Right p-value | p2 = | 0.452 000
|
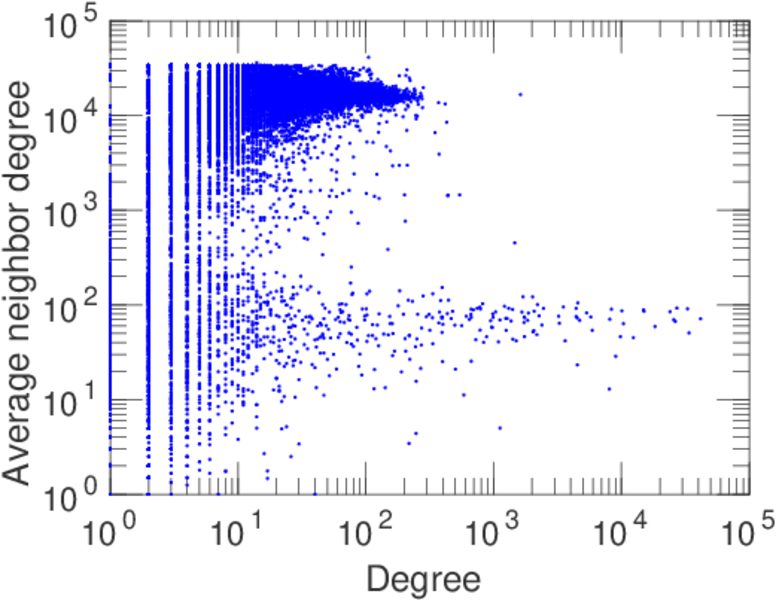
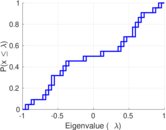
| Degree assortativity | ρ = | −0.190 044
|
| Degree assortativity p-value | pρ = | 0.000 00
|
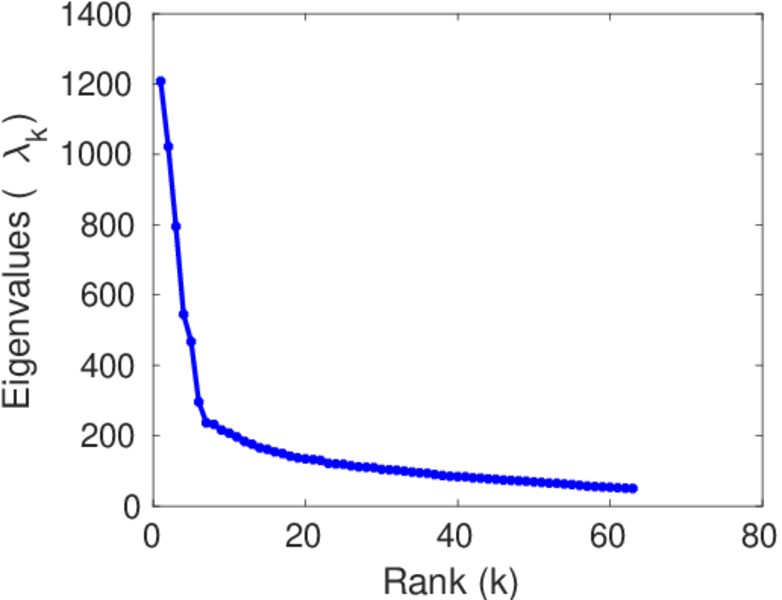
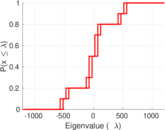
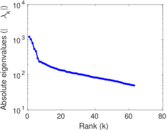
| Spectral norm | α = | 1,207.76
|
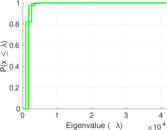
| Algebraic connectivity | a = | 0.046 554 5
|
| Spectral separation | |λ1[A] / λ2[A]| = | 1.181 94
|
| Controllability | C = | 28,447
|
| Relative controllability | Cr = | 0.876 479
|
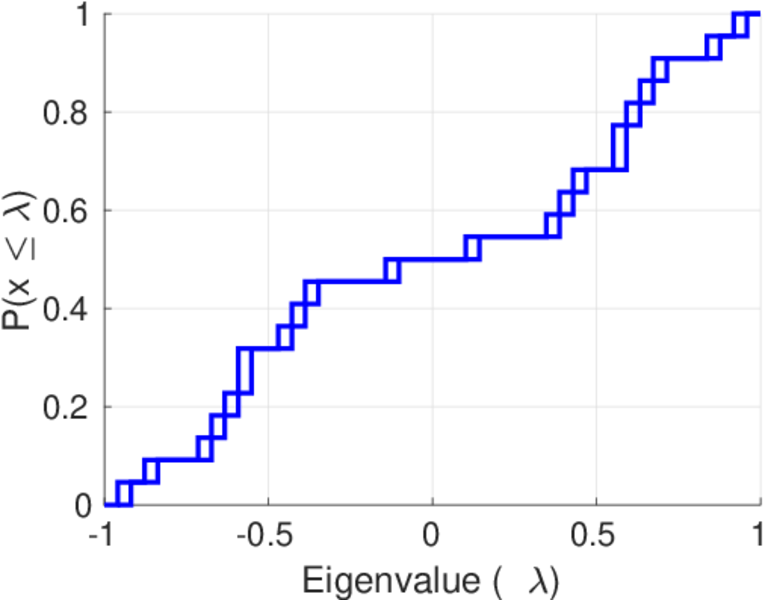
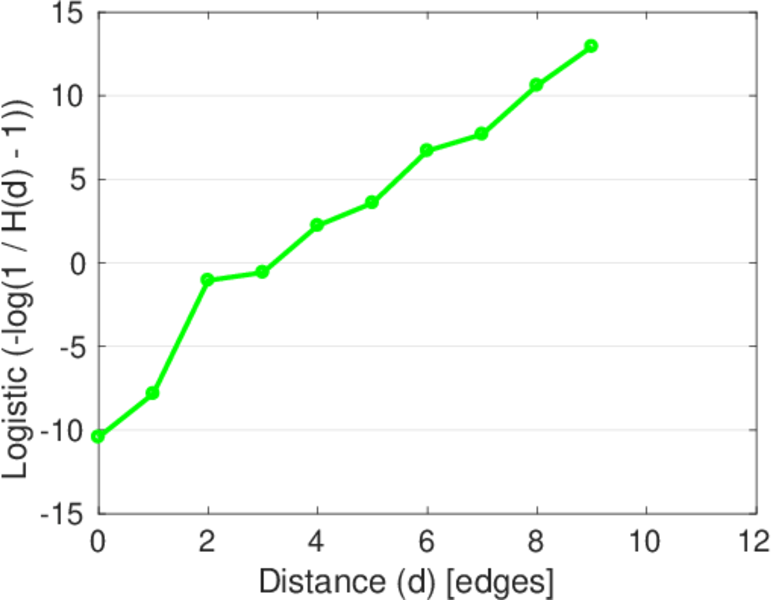
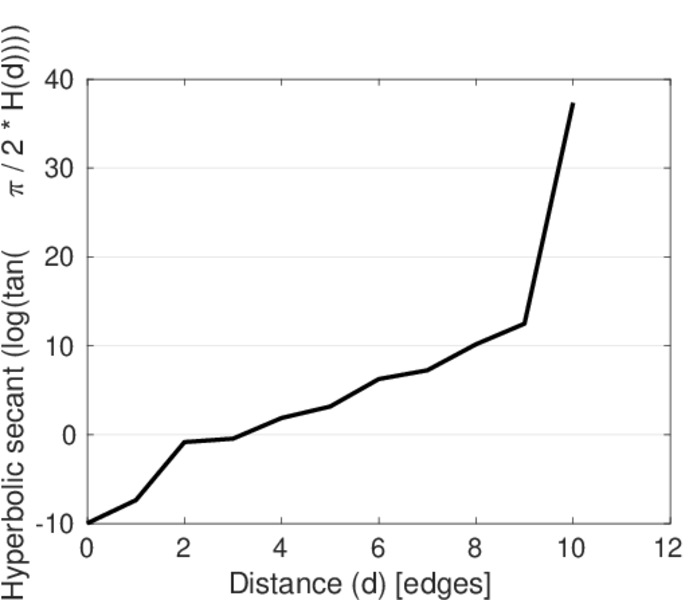
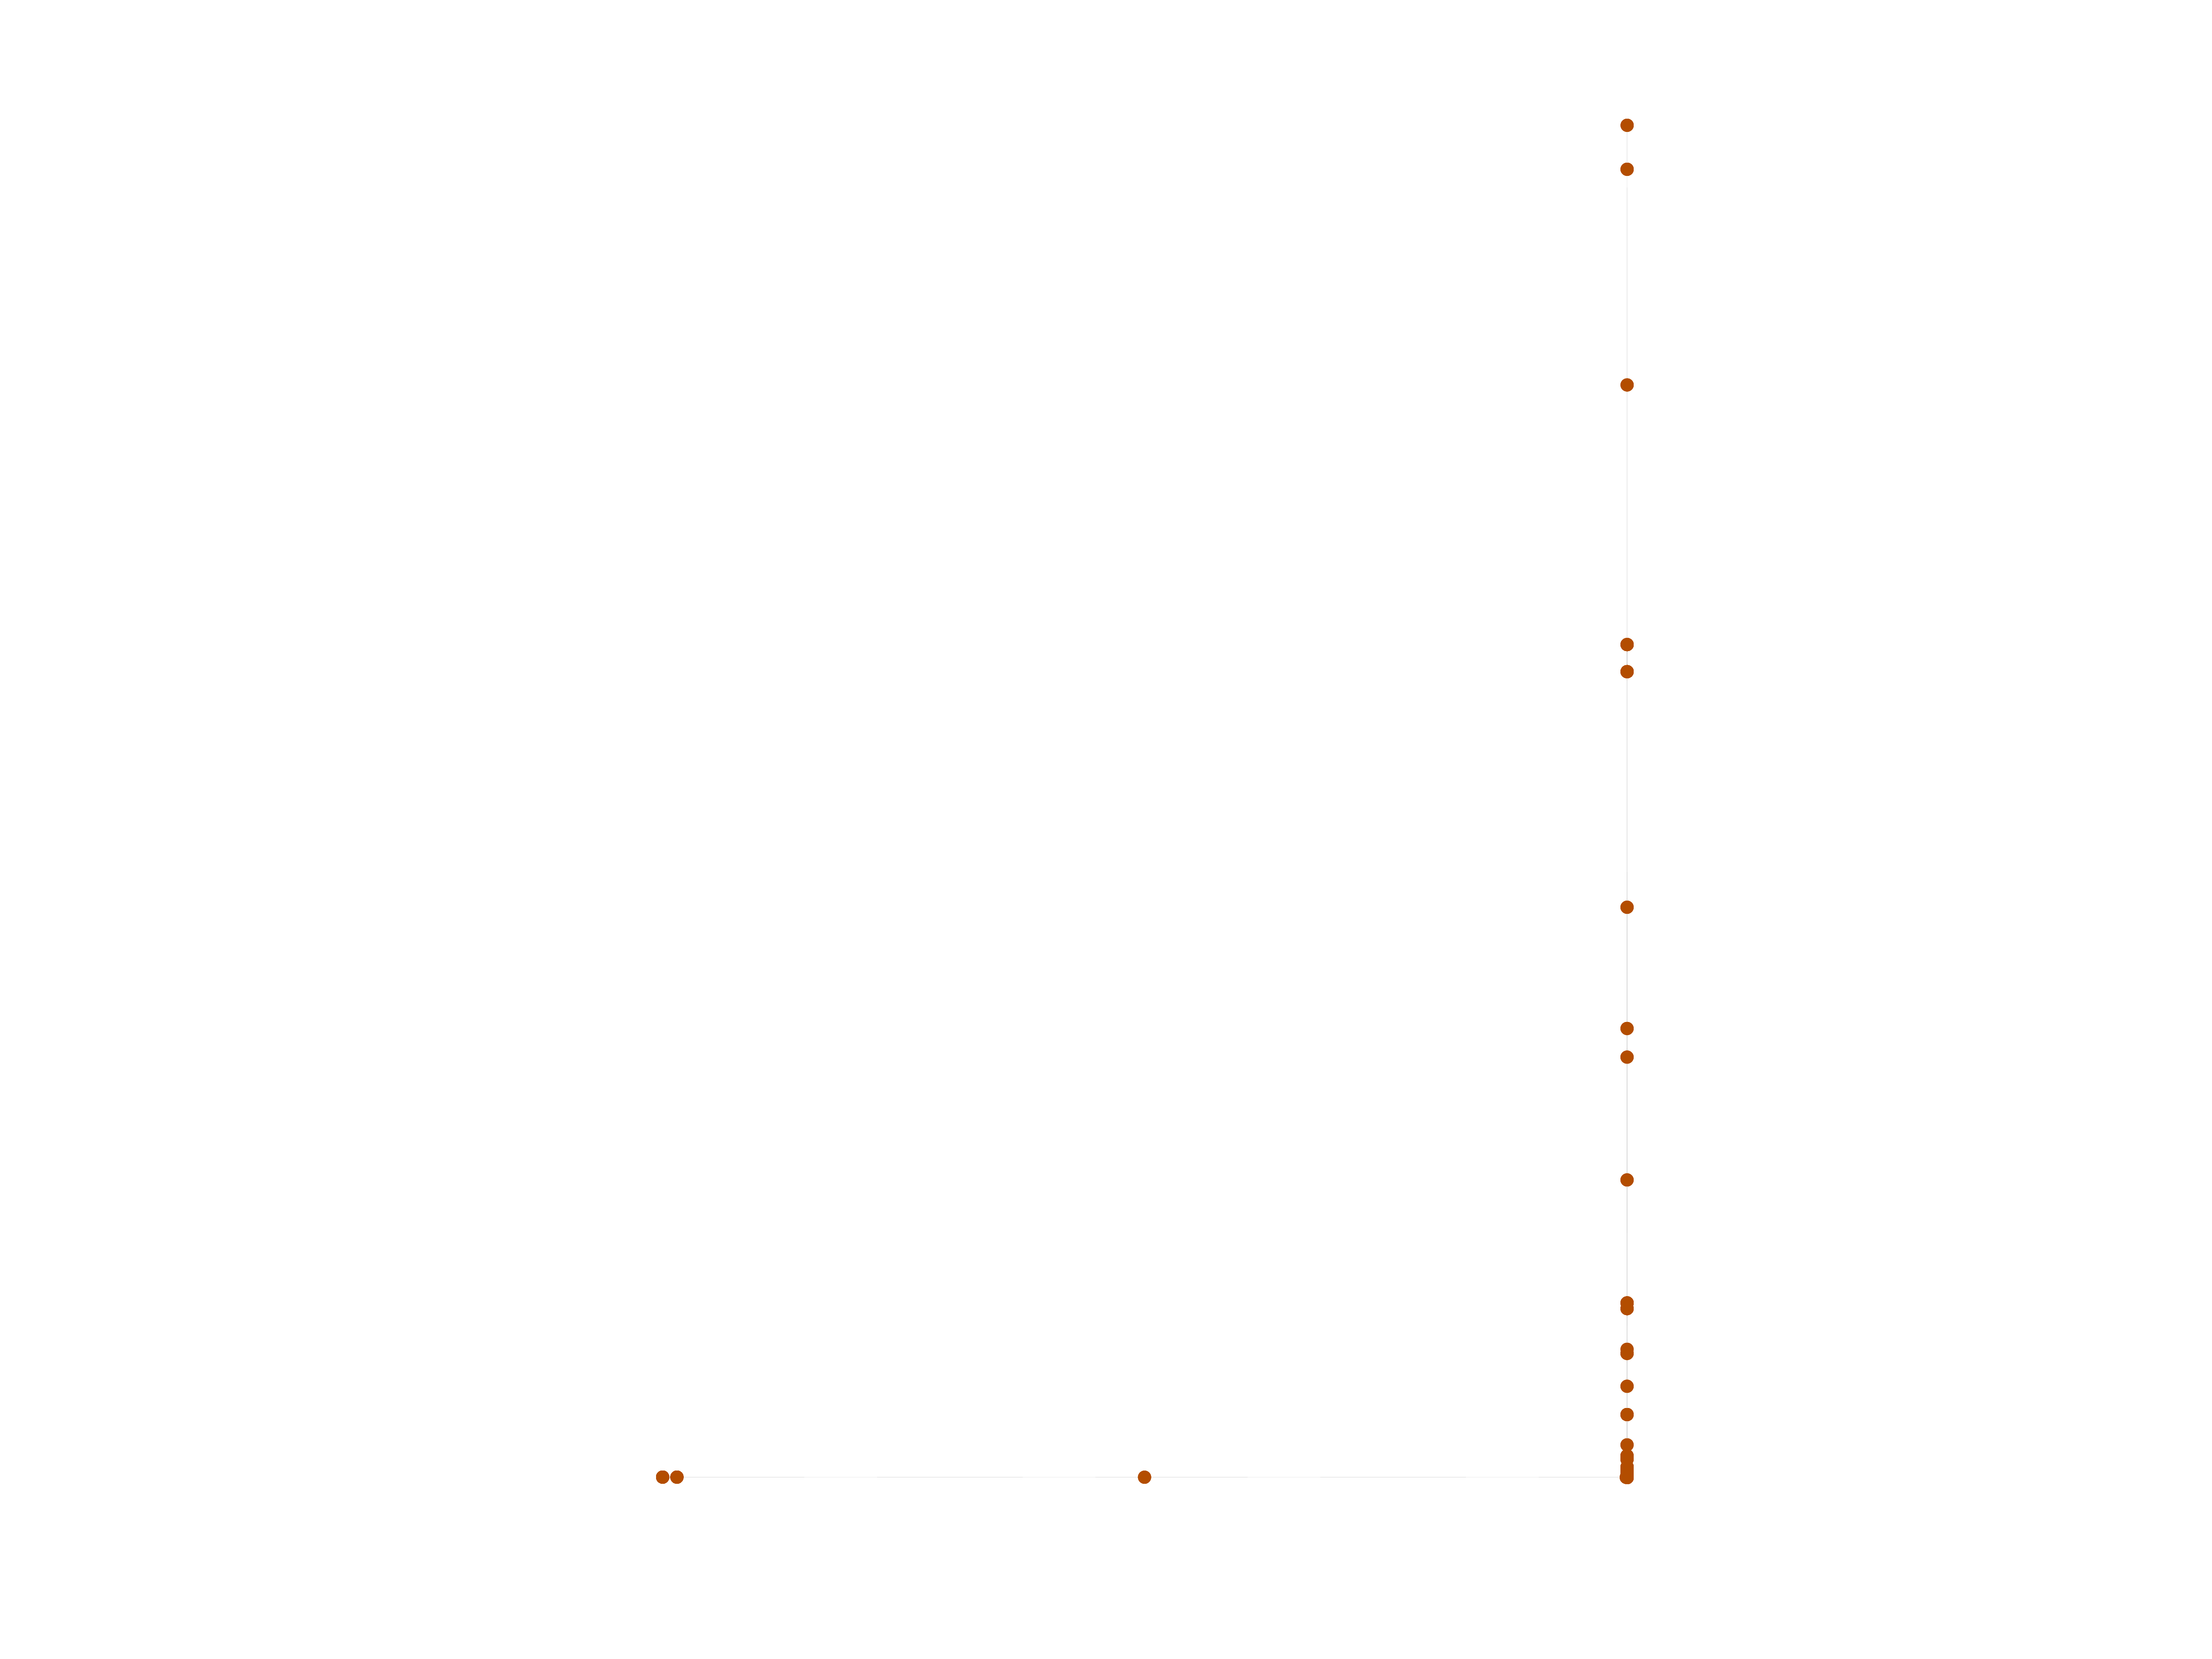
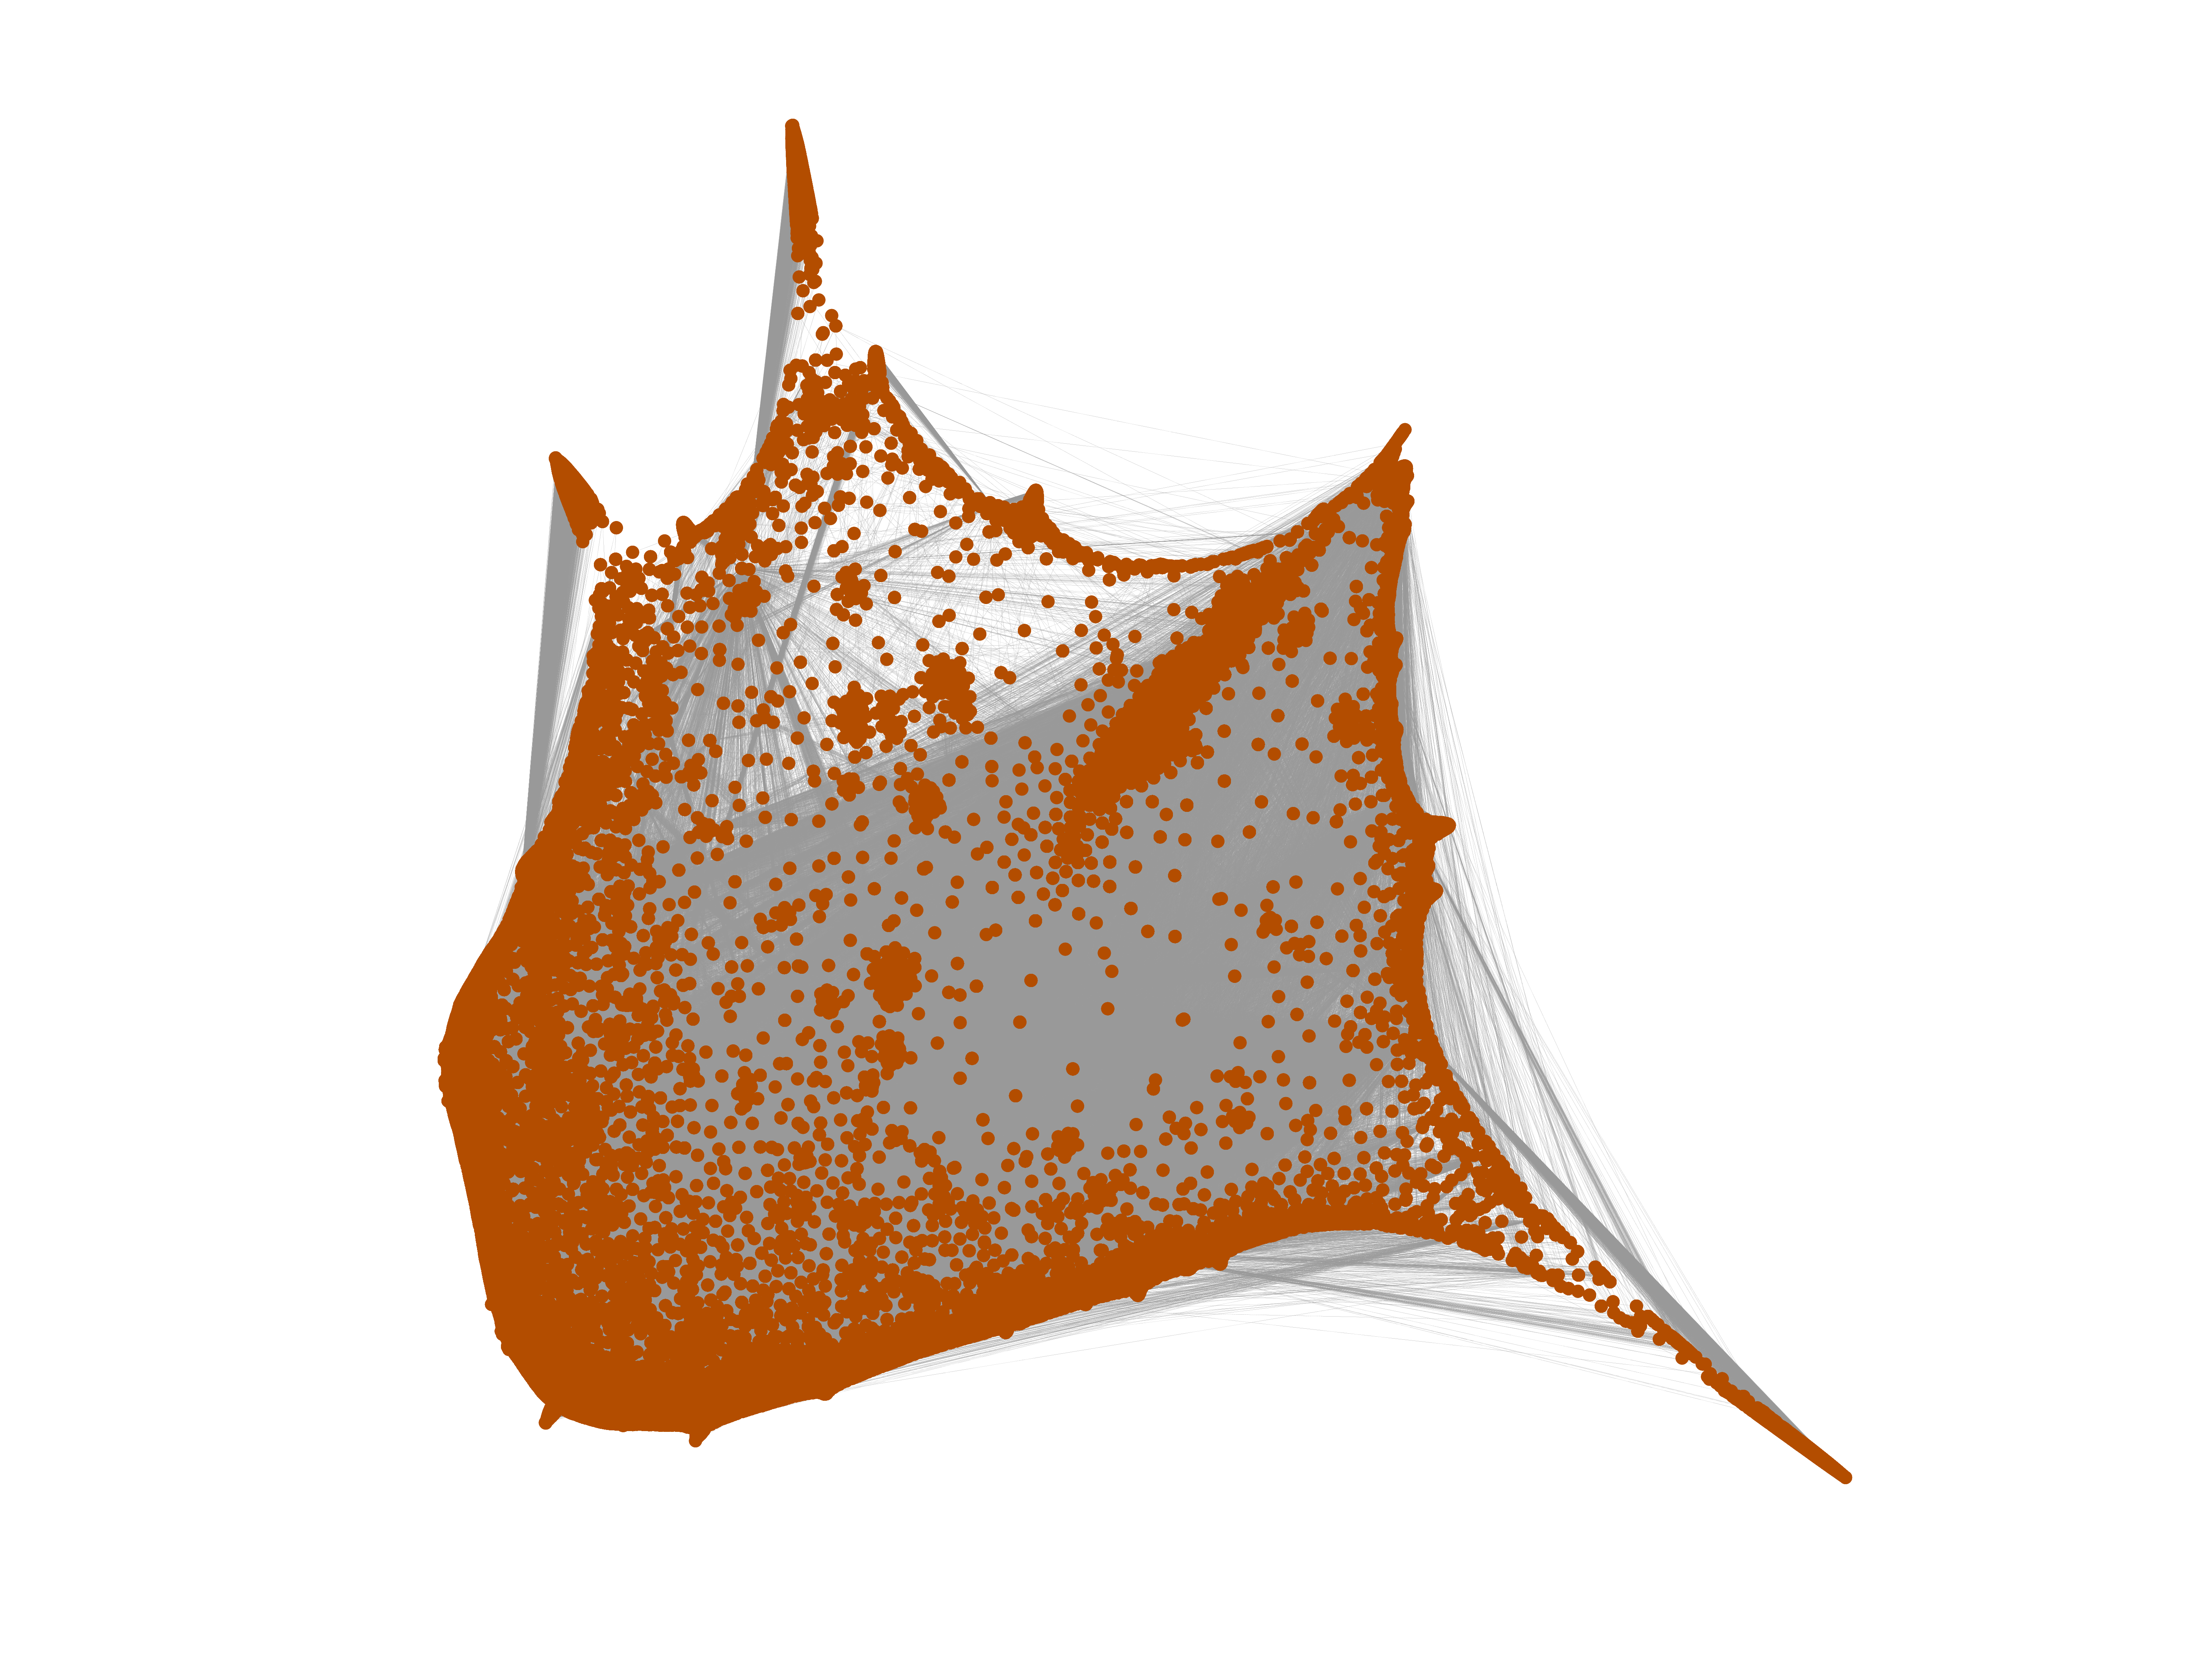
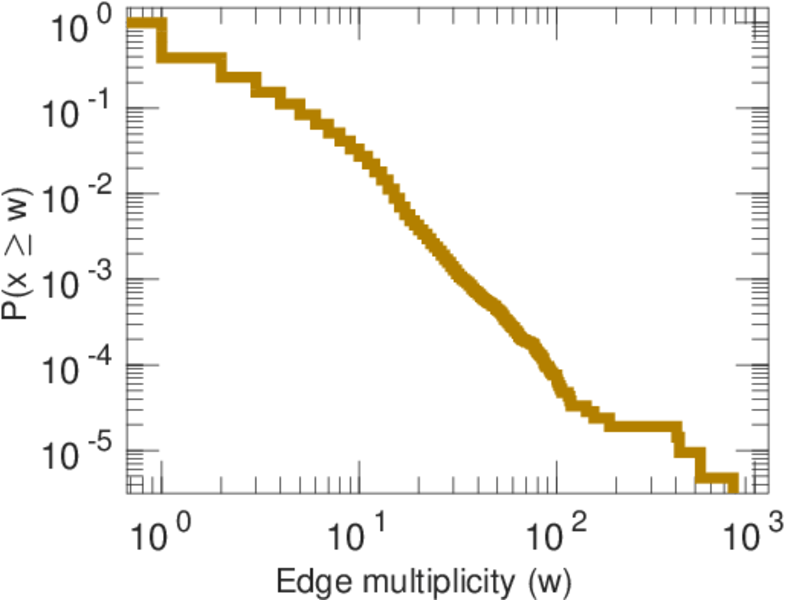
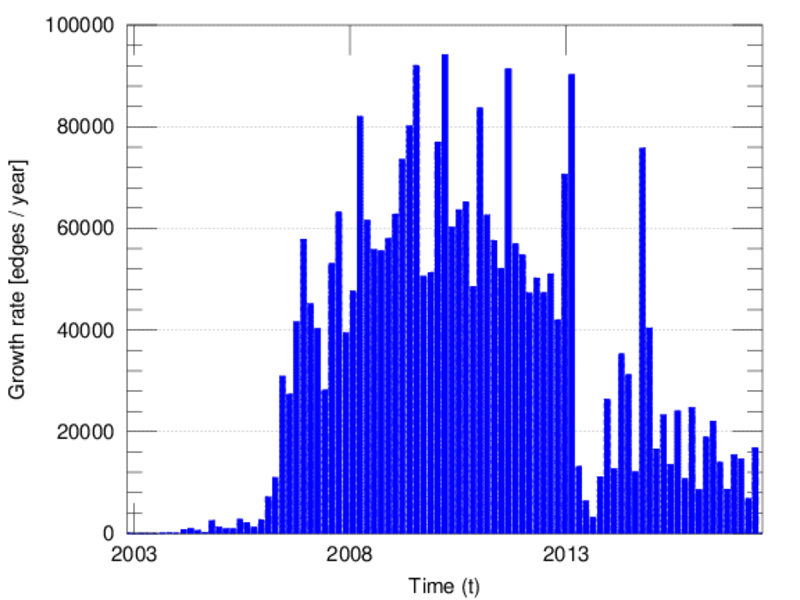
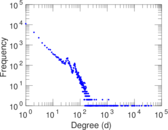
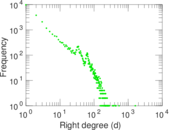
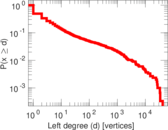
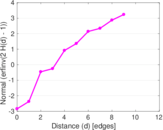
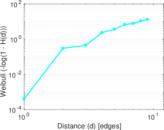
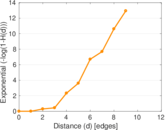
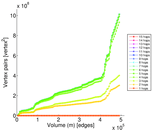
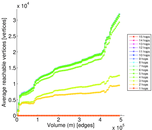
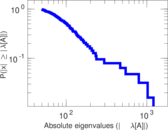
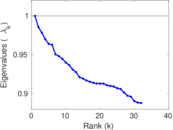
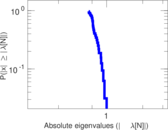
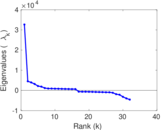
Plots


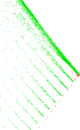

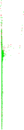


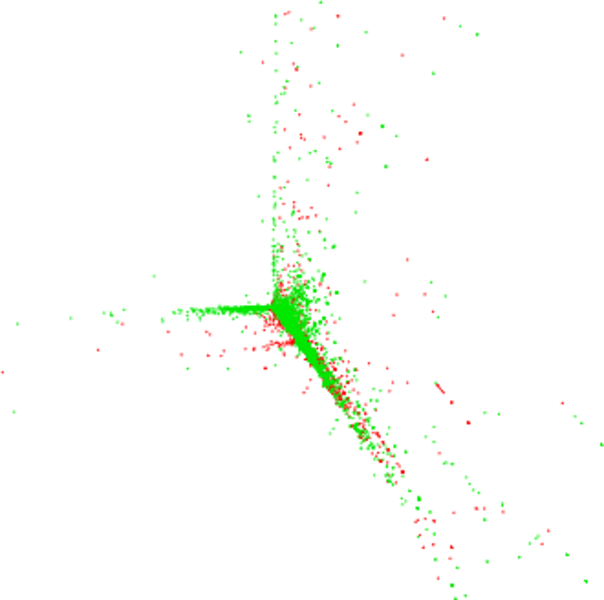
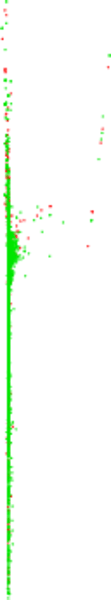
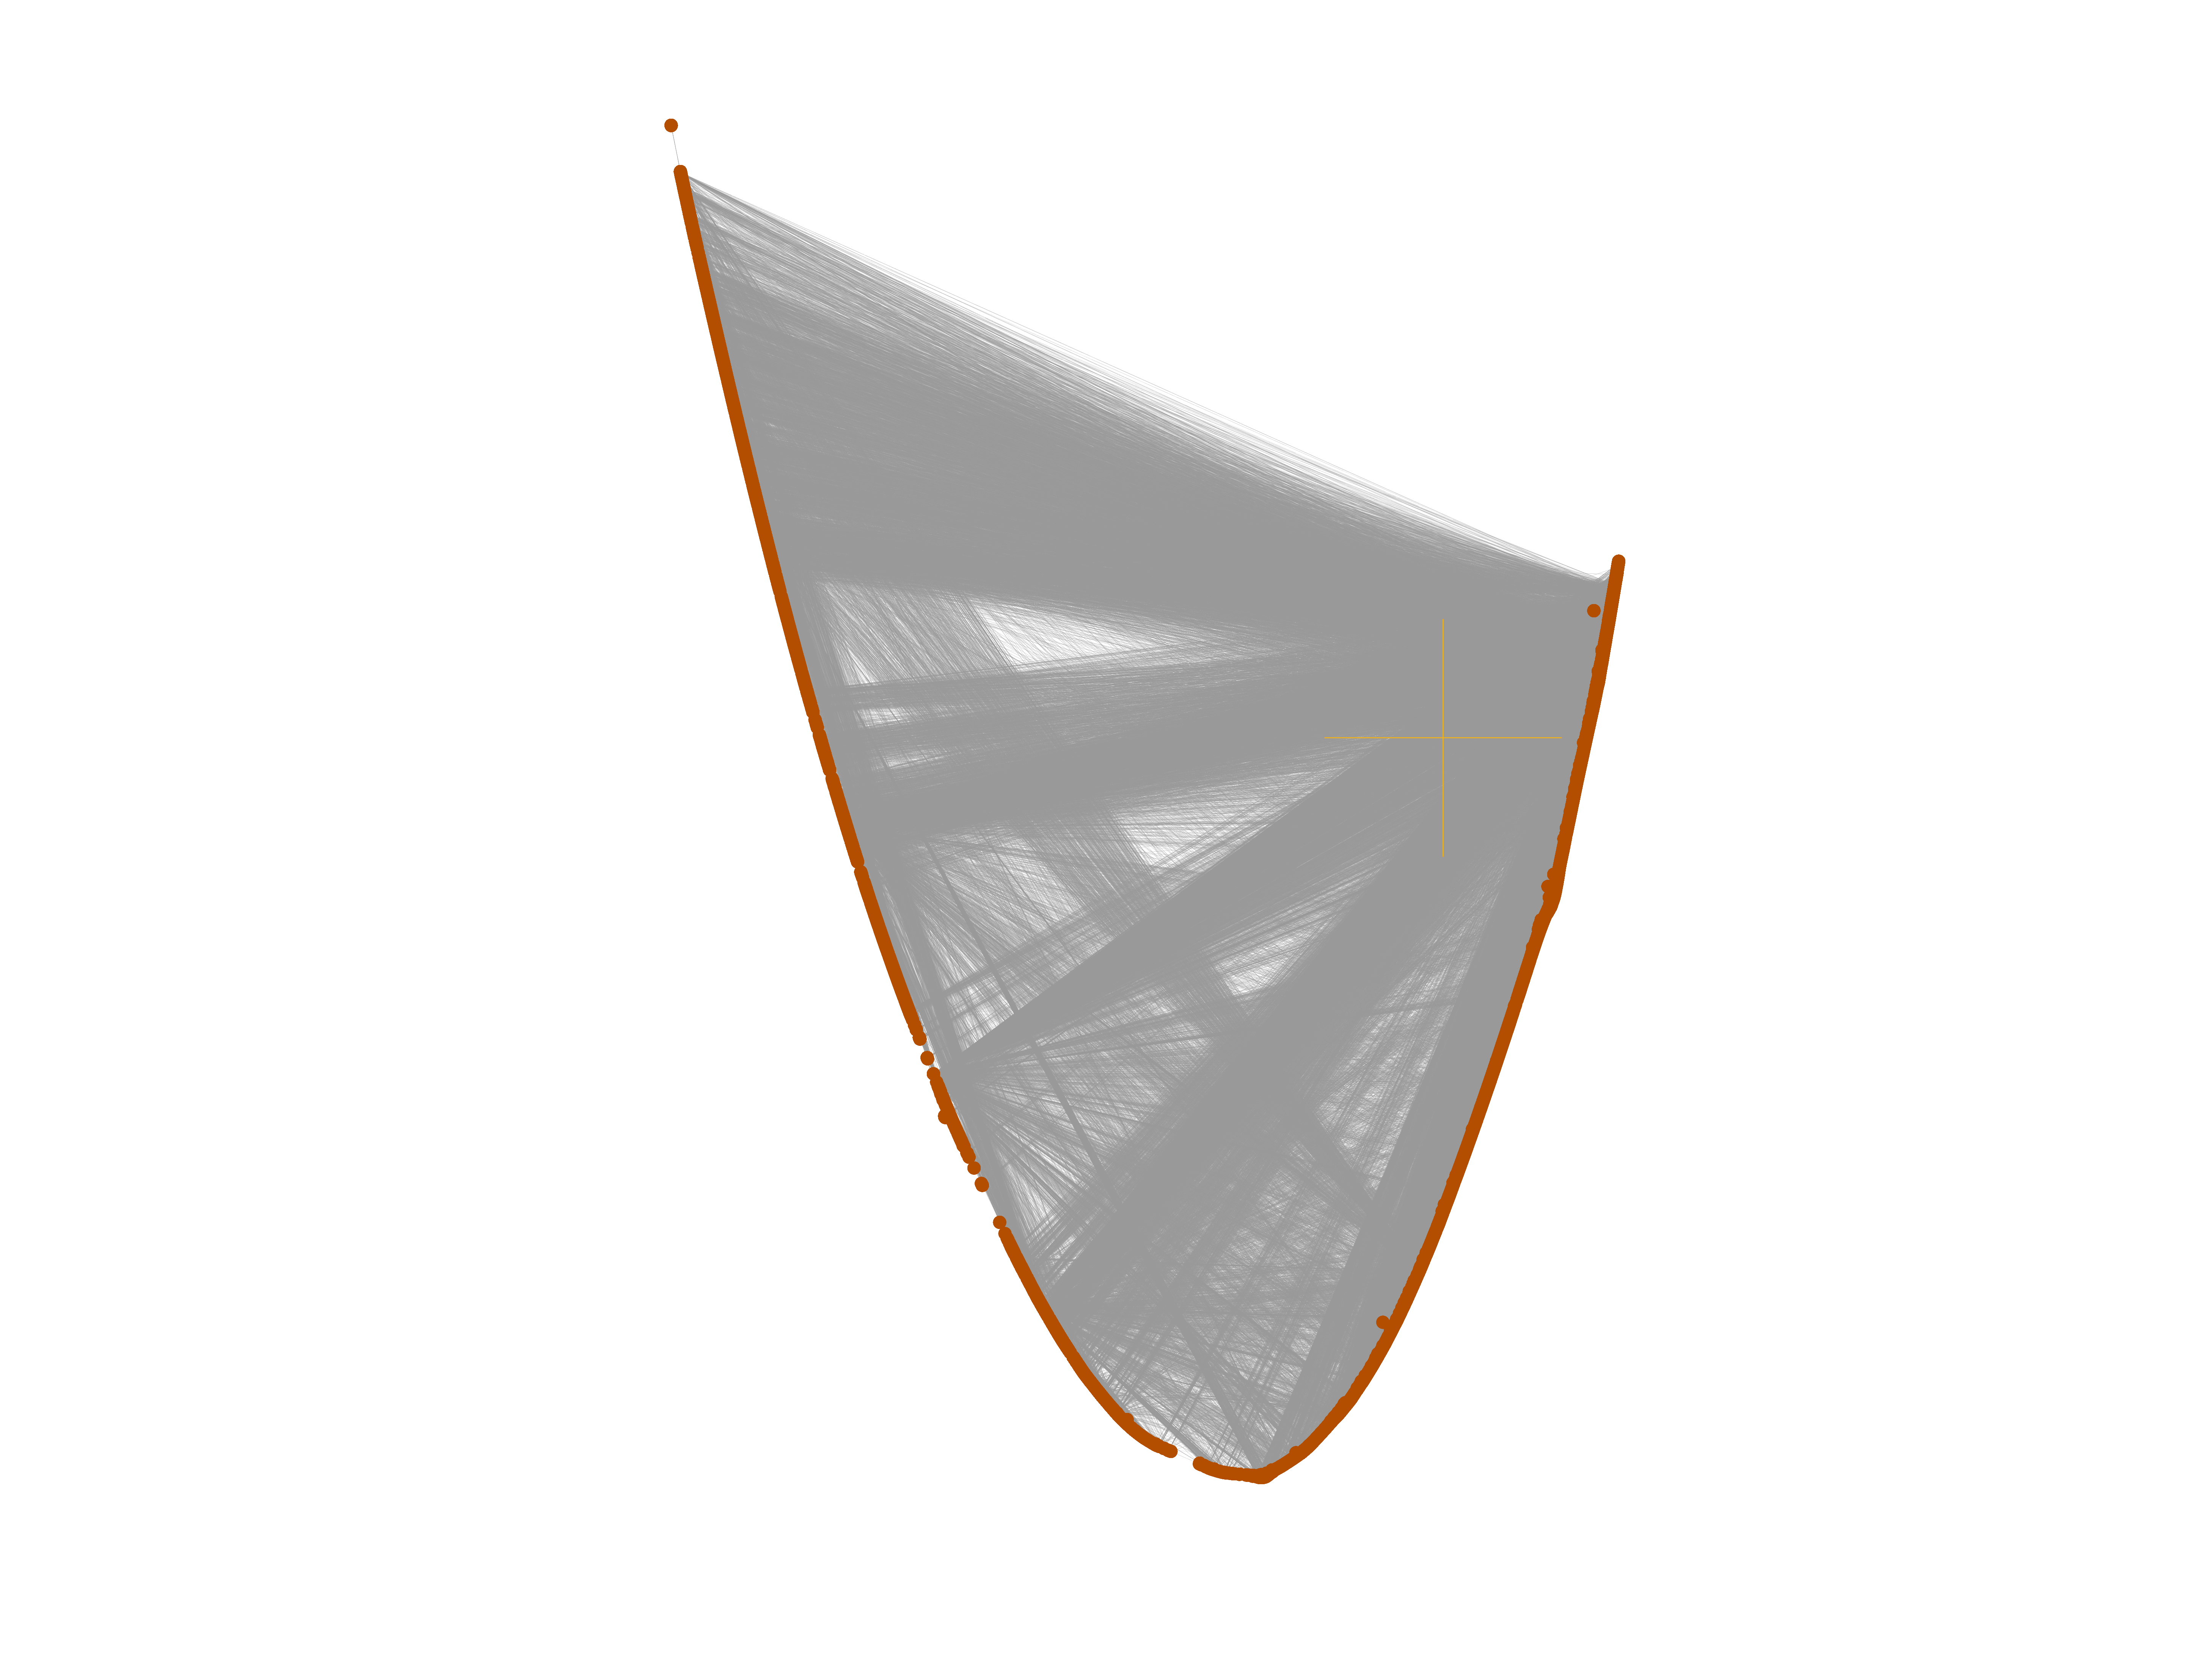
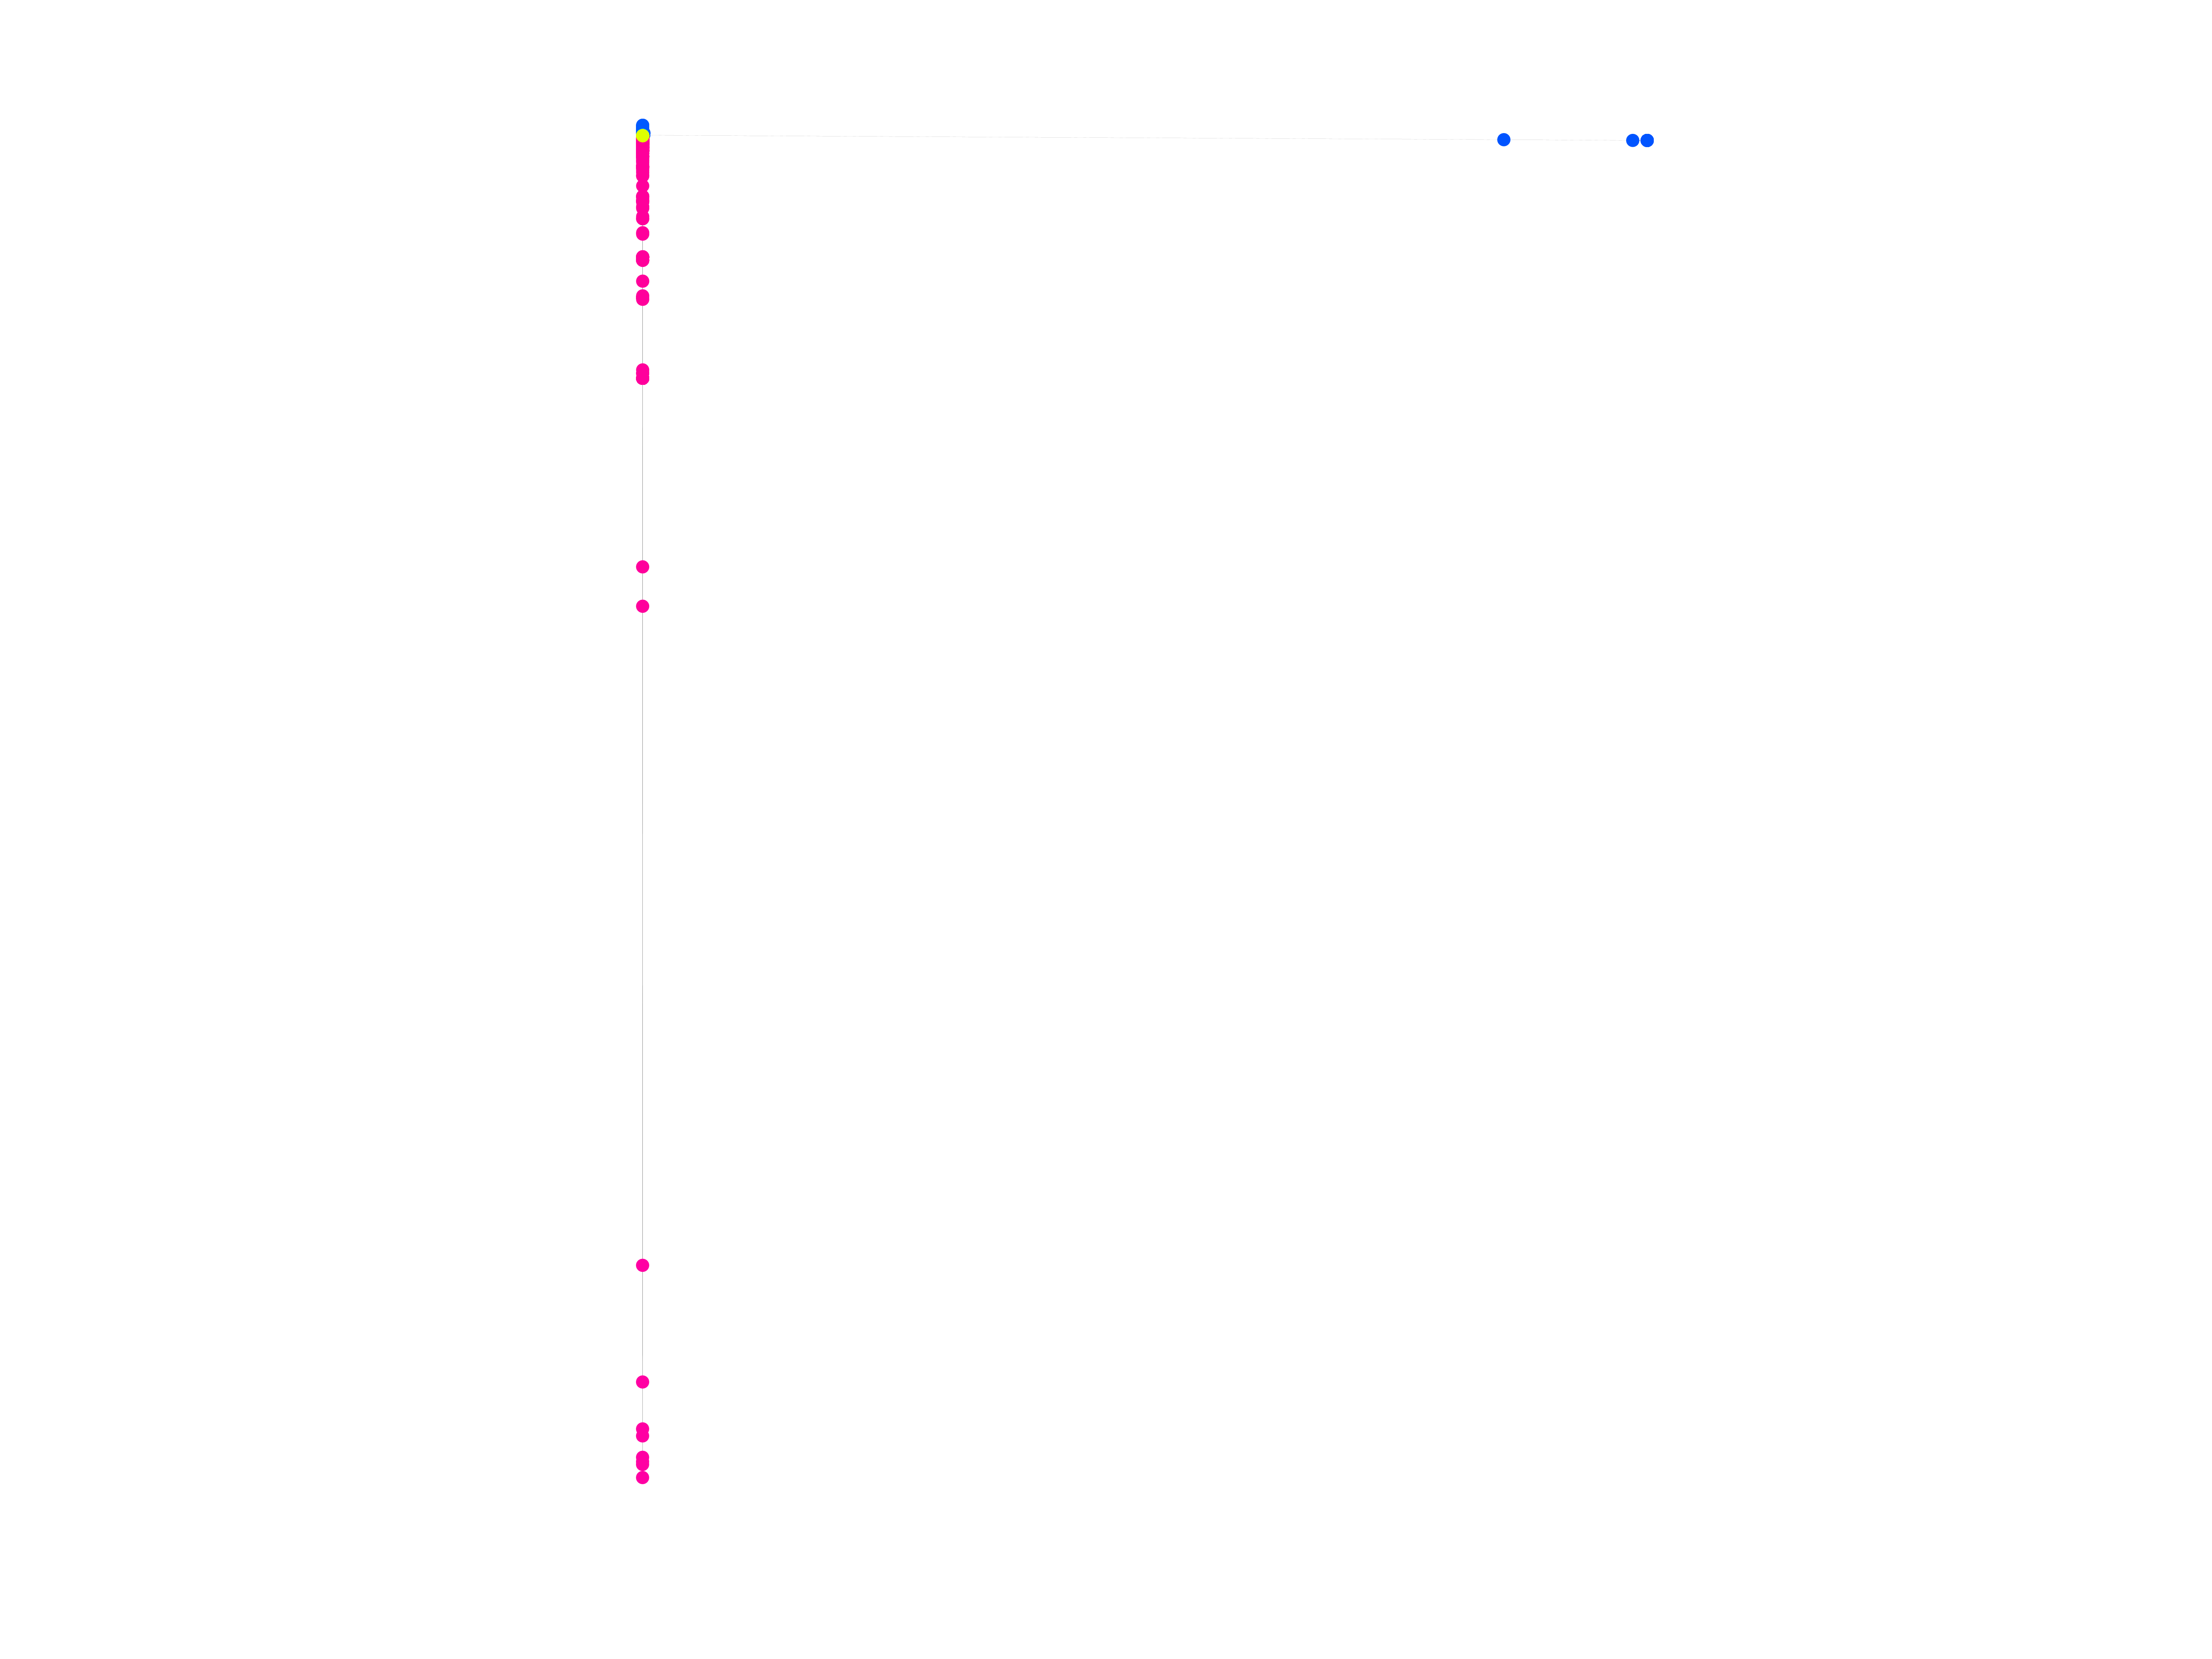
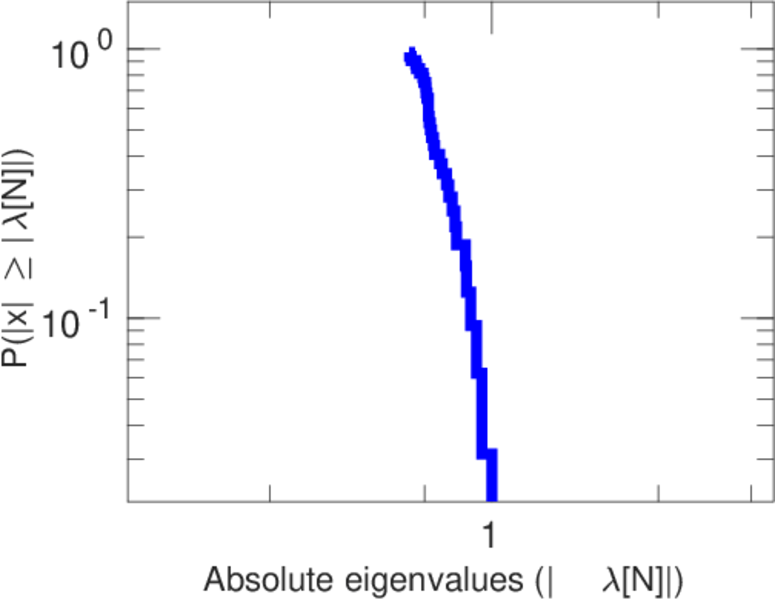
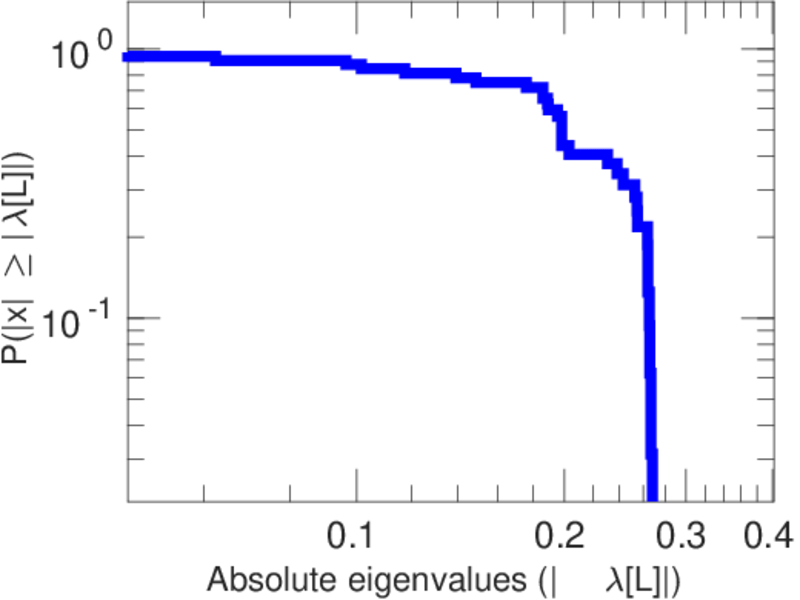
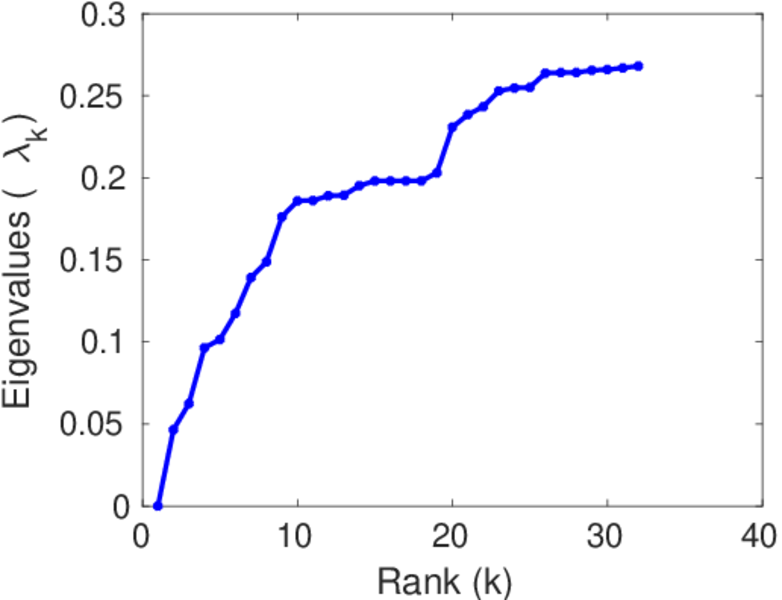
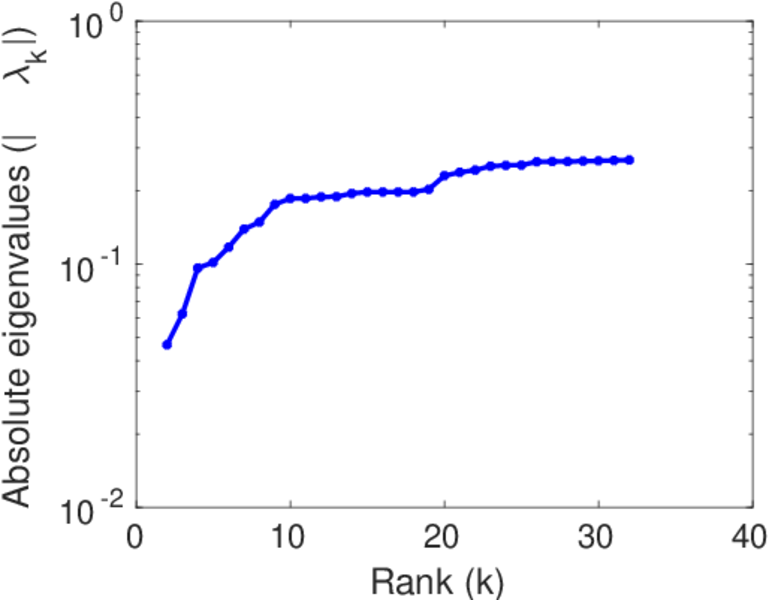
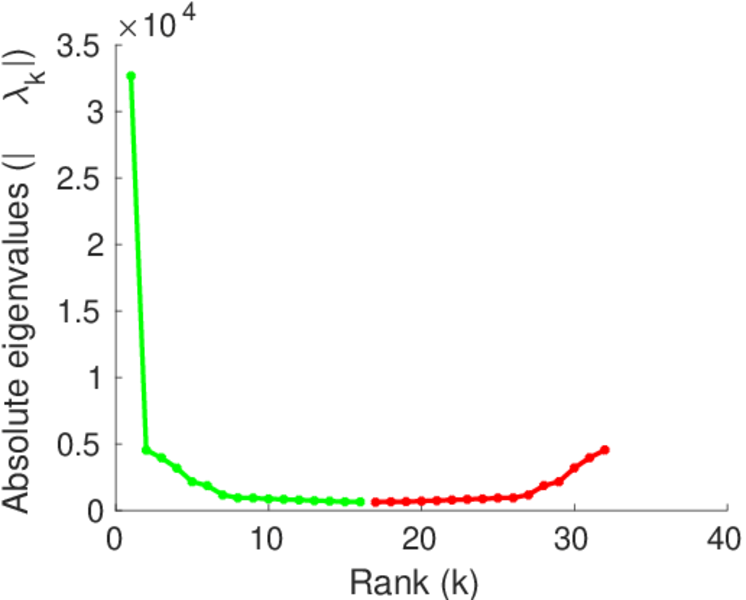
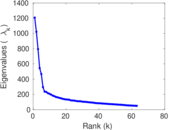
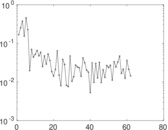
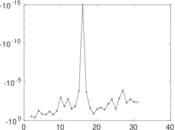
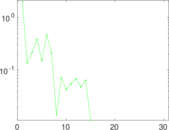
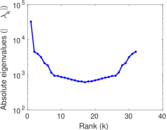
Matrix decompositions plots


Downloads
References
|
[1]
|
Jérôme Kunegis.
KONECT – The Koblenz Network Collection.
In Proc. Int. Conf. on World Wide Web Companion, pages
1343–1350, 2013.
[ http ]
|
|
[2]
|
Wikimedia Foundation.
Wikimedia downloads.
http://dumps.wikimedia.org/, January 2010.
|
 KONECT ‣ Networks ‣
Buy Me a Coffee
KONECT ‣ Networks ‣
Buy Me a Coffee