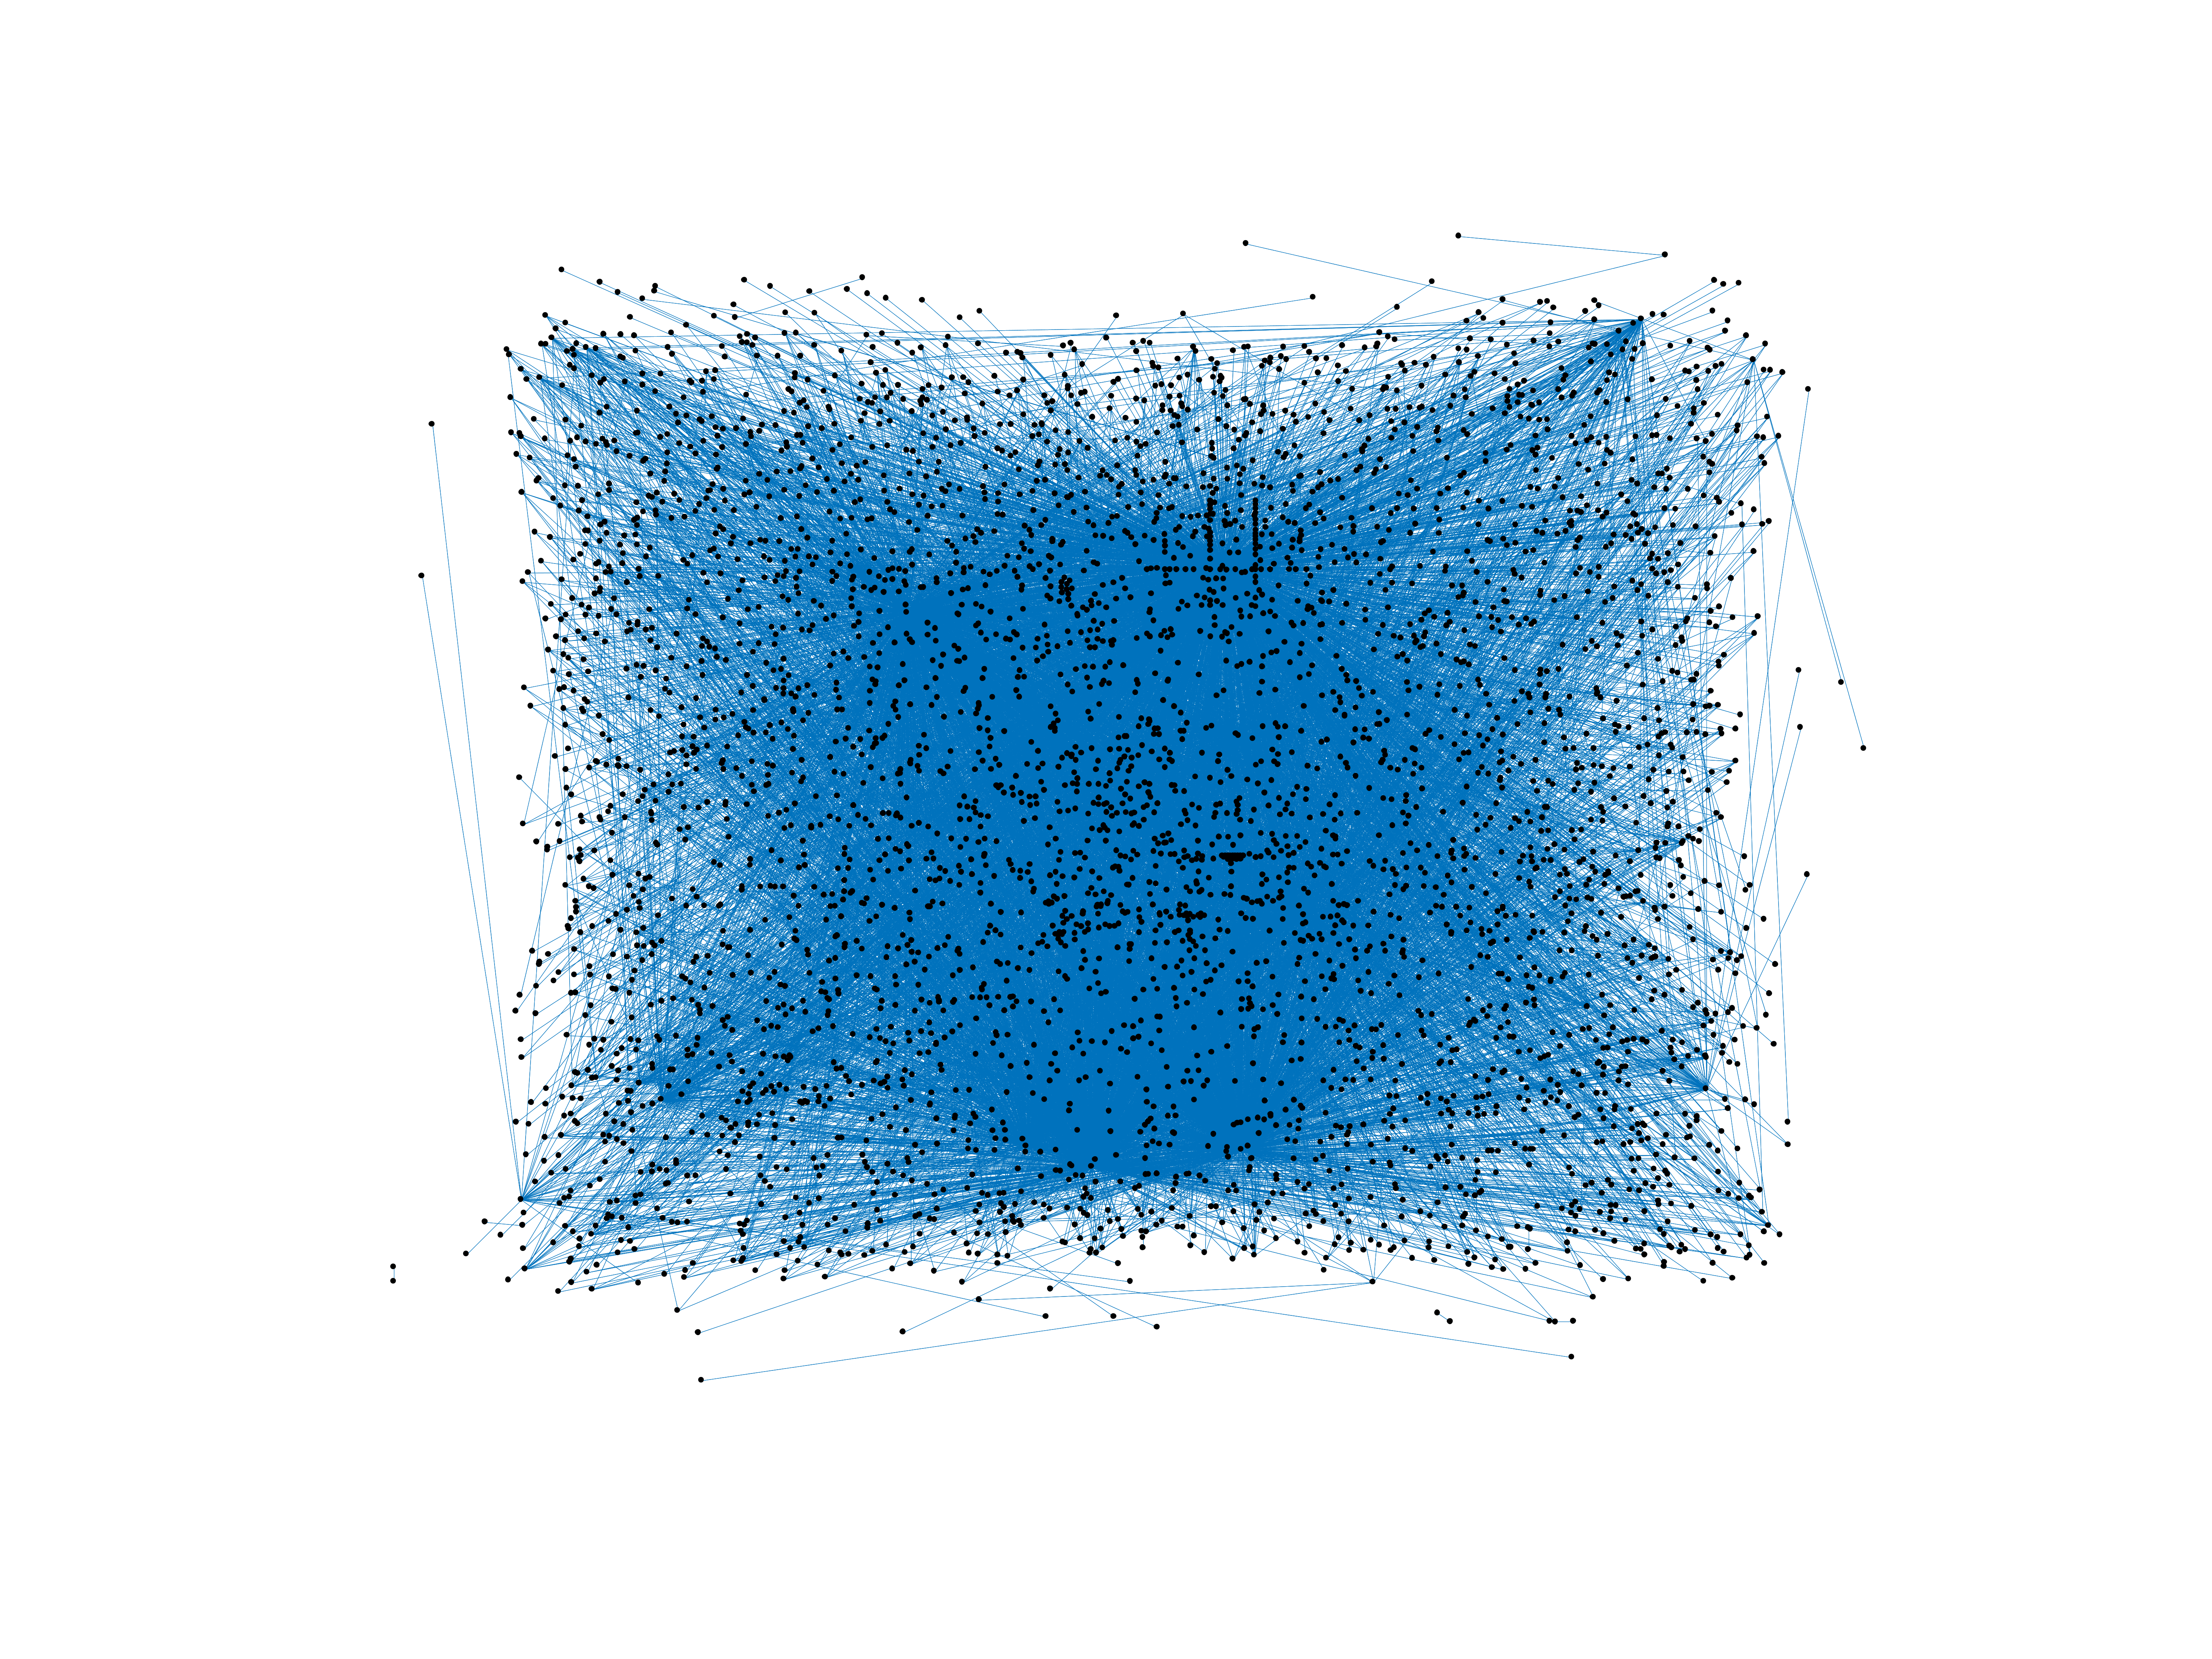
Wiktionary edits (gd)
This is the bipartite edit network of the Scottish Gaelic Wiktionary. It
contains users and pages from the Scottish Gaelic Wiktionary, connected by edit
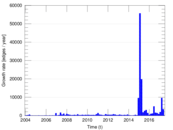
events. Each edge represents an edit. The dataset includes the timestamp of
each edit.
Metadata
Statistics
| Size | n = | 4,377
|
| Left size | n1 = | 235
|
| Right size | n2 = | 4,142
|
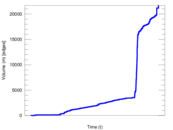
| Volume | m = | 21,686
|
| Unique edge count | m̿ = | 10,349
|
| Wedge count | s = | 6,861,392
|
| Claw count | z = | 4,452,849,151
|
| Cross count | x = | 2,456,002,817,692
|
| Square count | q = | 2,979,460
|
| 4-Tour count | T4 = | 51,302,090
|
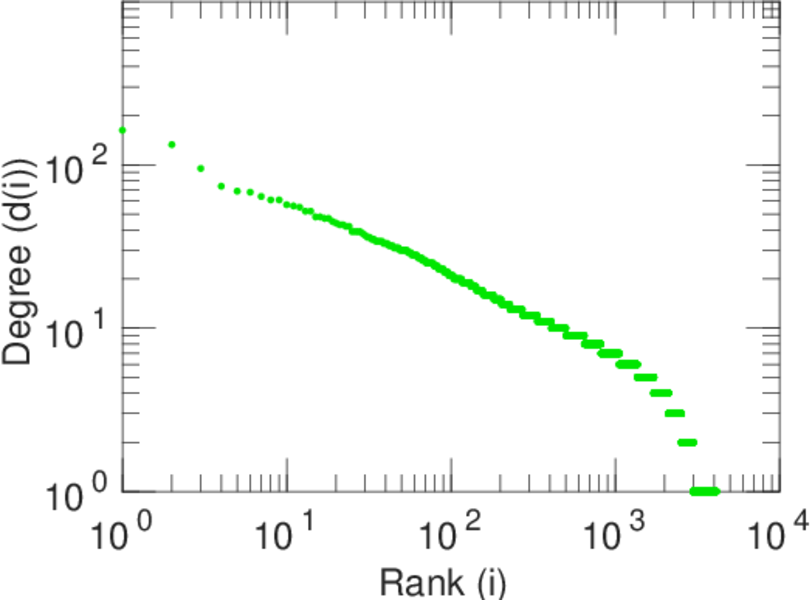
| Maximum degree | dmax = | 6,602
|
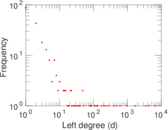
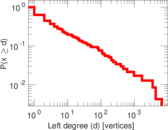
| Maximum left degree | d1max = | 6,602
|
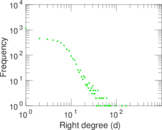
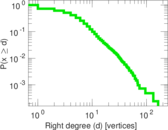
| Maximum right degree | d2max = | 163
|
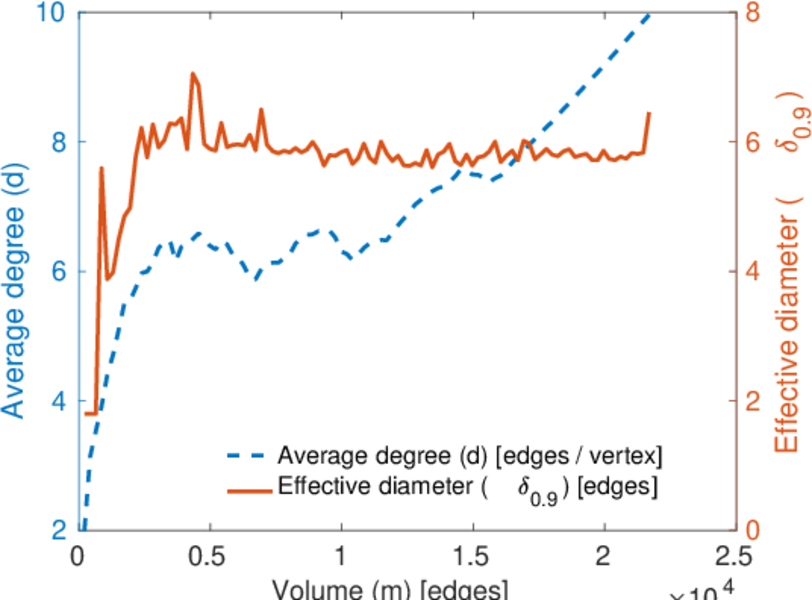
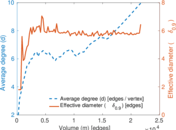
| Average degree | d = | 9.909 07
|
| Average left degree | d1 = | 92.280 9
|
| Average right degree | d2 = | 5.235 63
|
| Fill | p = | 0.010 632 1
|
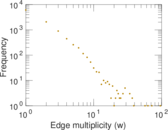
| Average edge multiplicity | m̃ = | 2.095 47
|
| Size of LCC | N = | 4,174
|
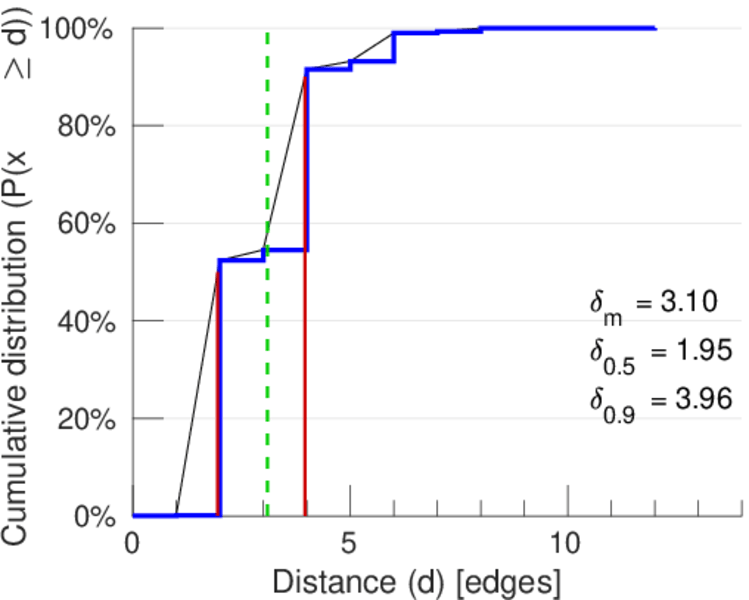
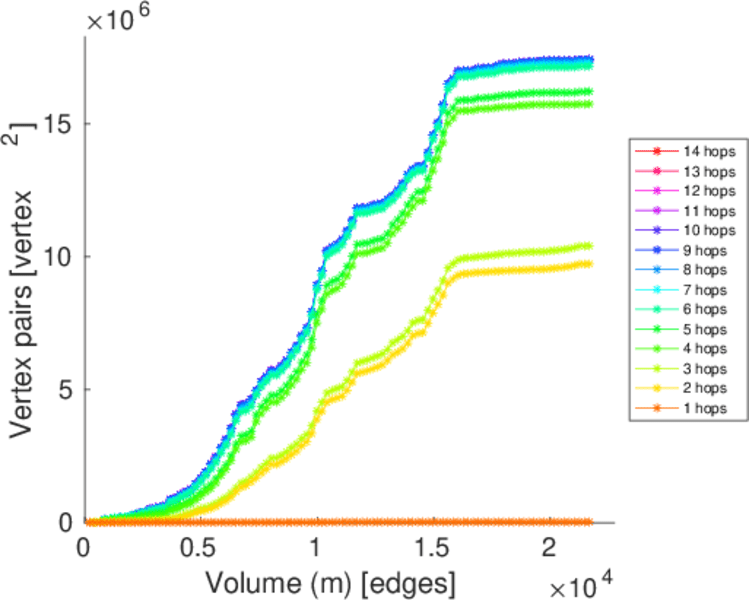
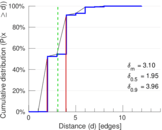
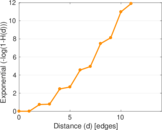
| Diameter | δ = | 13
|
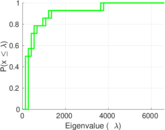
| 50-Percentile effective diameter | δ0.5 = | 1.954 85
|
| 90-Percentile effective diameter | δ0.9 = | 3.958 74
|
| Median distance | δM = | 2
|
| Mean distance | δm = | 3.101 45
|
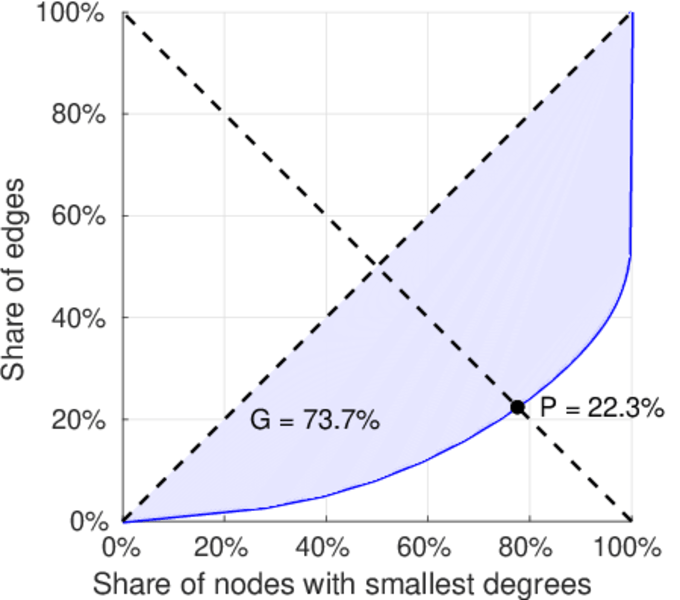
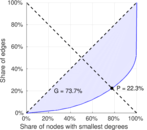
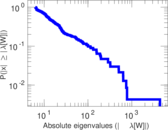
| Gini coefficient | G = | 0.733 059
|
| Balanced inequality ratio | P = | 0.226 344
|
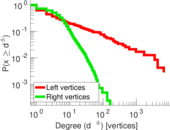
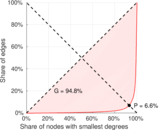
| Left balanced inequality ratio | P1 = | 0.065 987 3
|
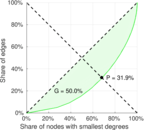
| Right balanced inequality ratio | P2 = | 0.319 100
|
| Relative edge distribution entropy | Her = | 0.724 839
|
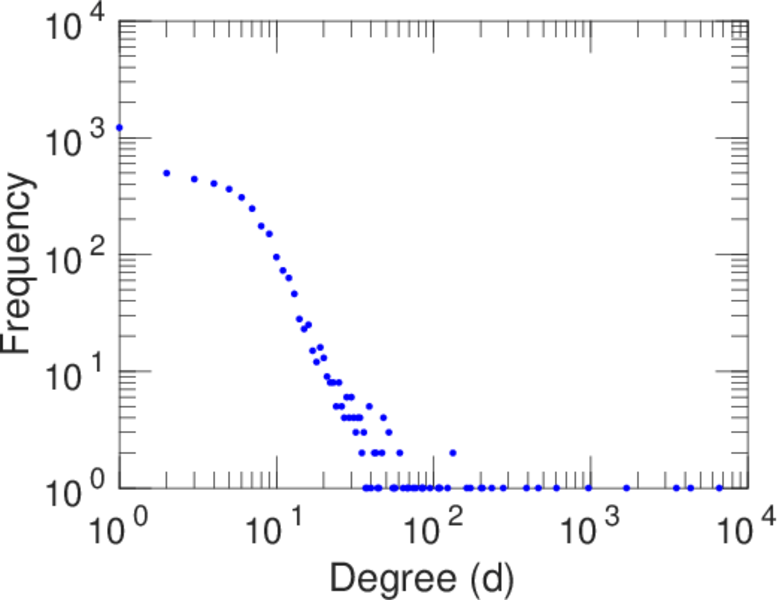
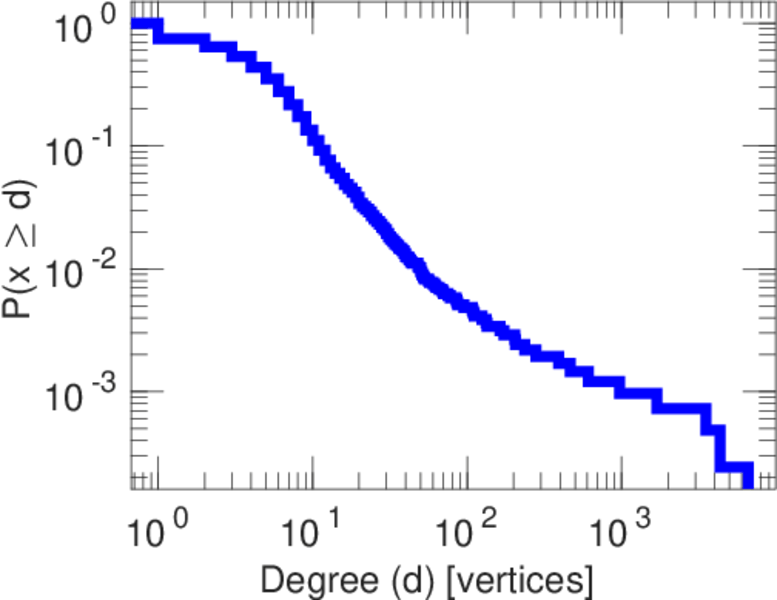
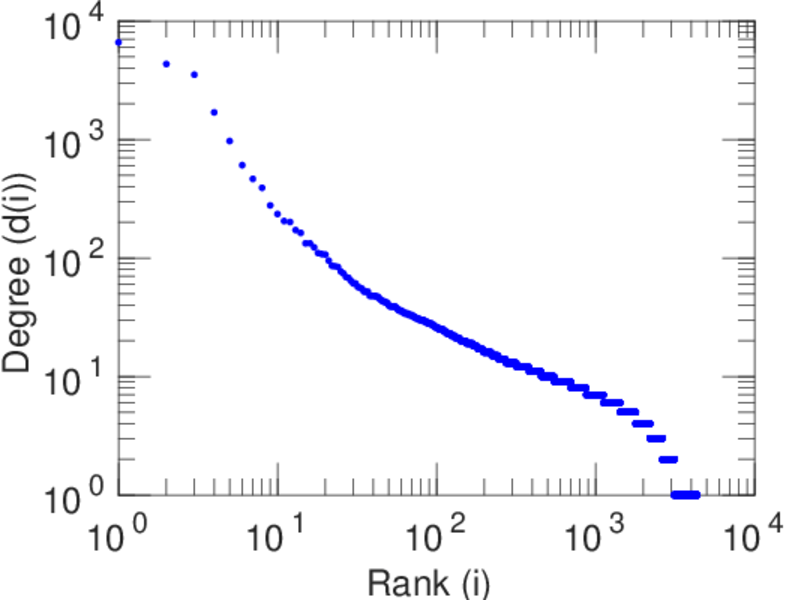
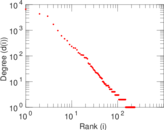
| Power law exponent | γ = | 2.446 49
|
| Tail power law exponent | γt = | 1.631 00
|
| Tail power law exponent with p | γ3 = | 1.631 00
|
| p-value | p = | 0.163 000
|
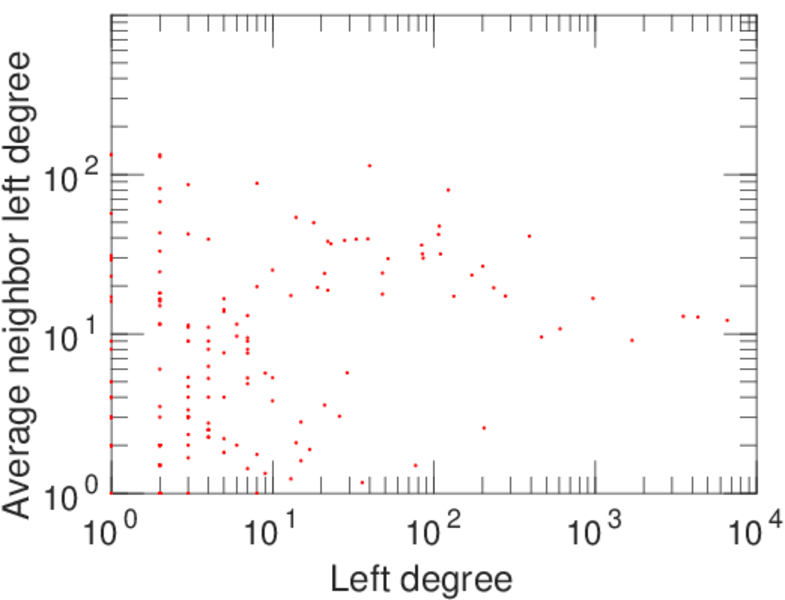
| Left tail power law exponent with p | γ3,1 = | 1.621 00
|
| Left p-value | p1 = | 0.011 000 0
|
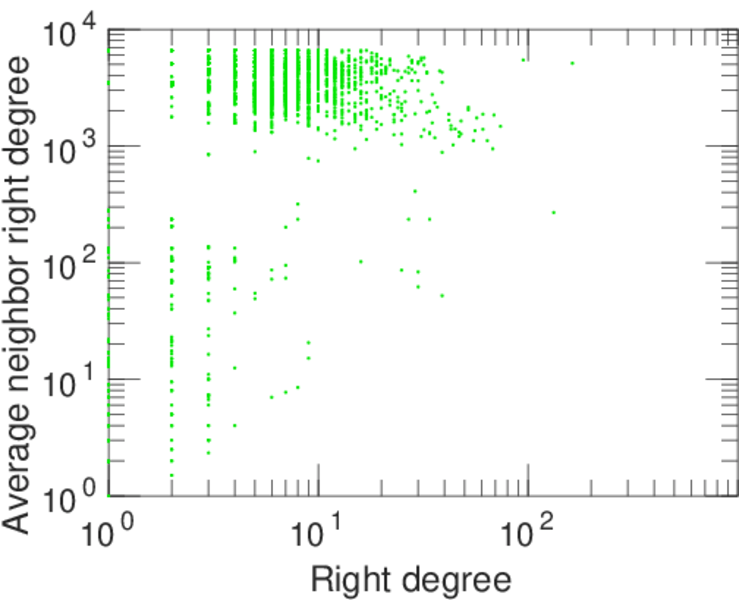
| Right tail power law exponent with p | γ3,2 = | 3.961 00
|
| Right p-value | p2 = | 0.000 00
|
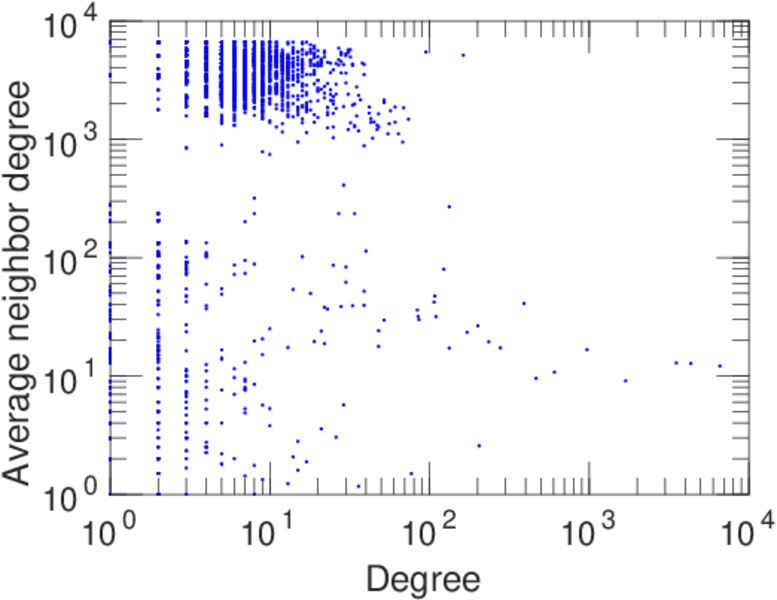
| Degree assortativity | ρ = | −0.364 783
|
| Degree assortativity p-value | pρ = | 3.952 53 × 10−323
|
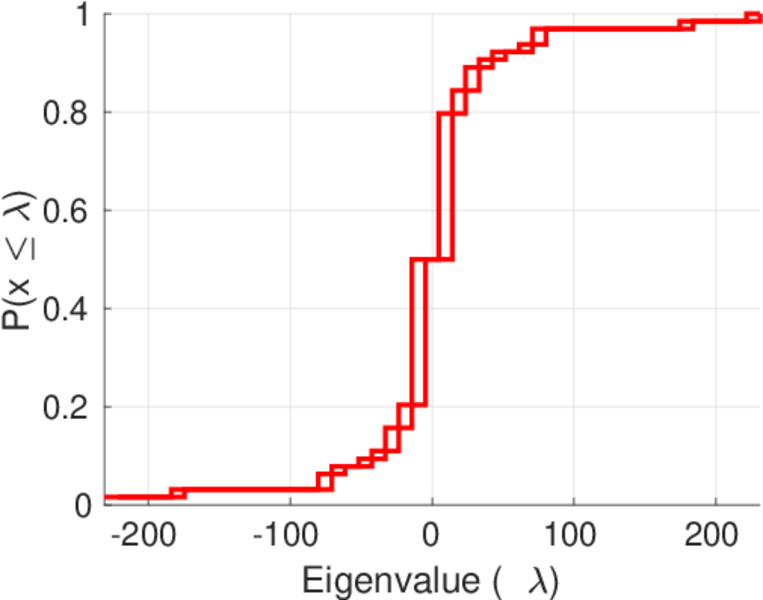
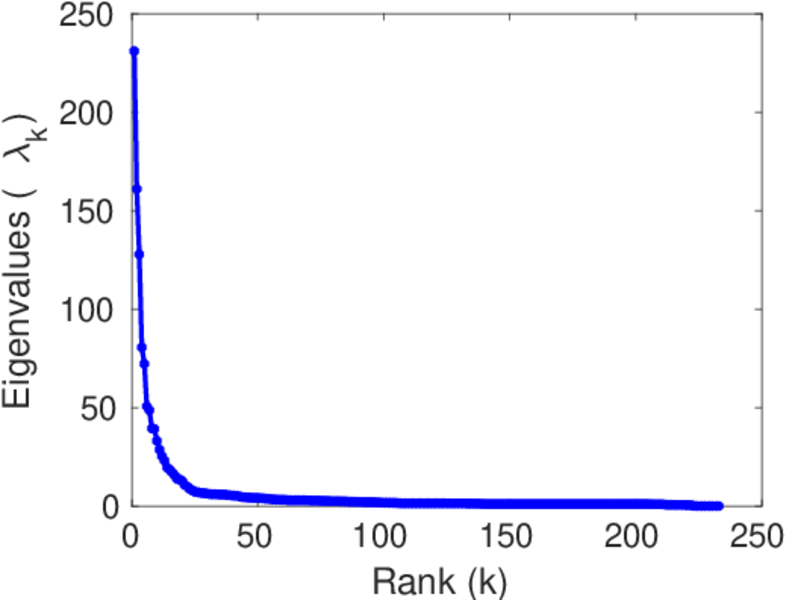
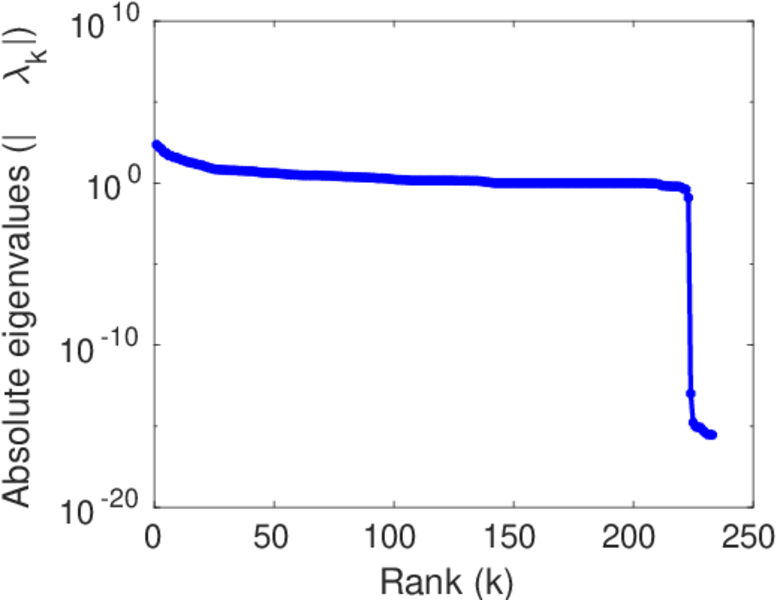
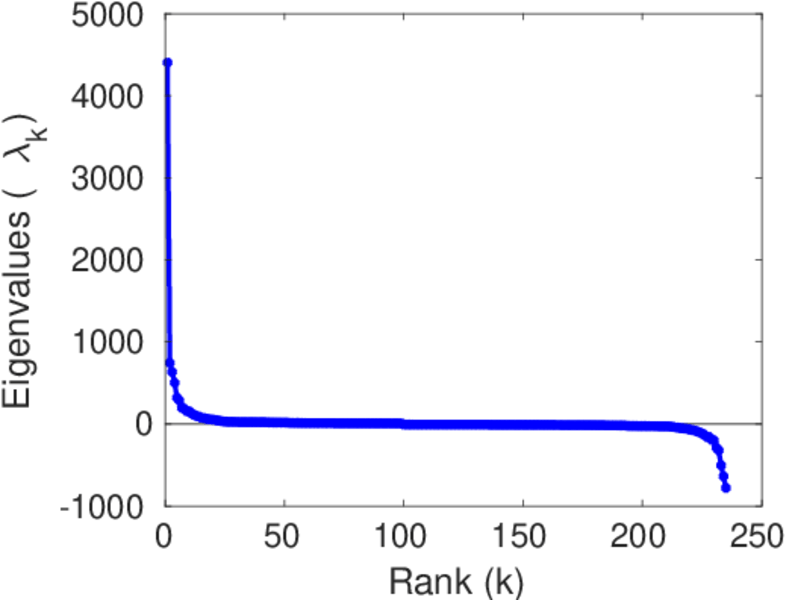
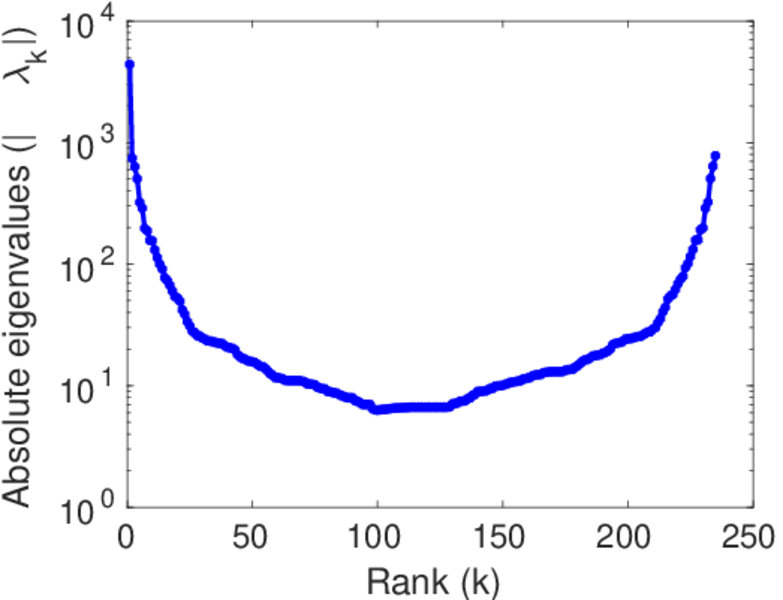
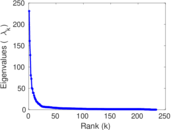
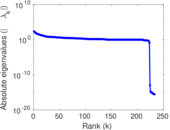
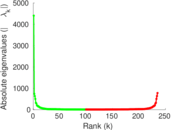
| Spectral norm | α = | 230.986
|
| Algebraic connectivity | a = | 0.037 280 8
|
| Spectral separation | |λ1[A] / λ2[A]| = | 1.434 64
|
| Controllability | C = | 3,910
|
| Relative controllability | Cr = | 0.897 612
|
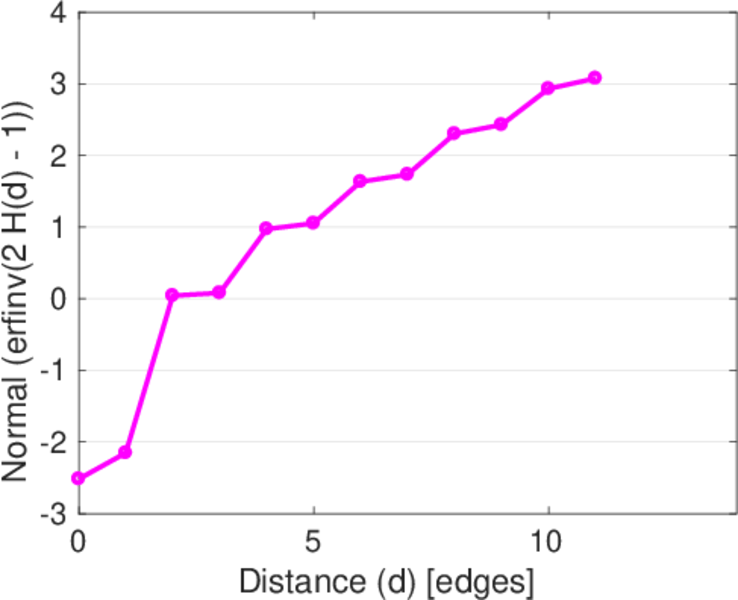
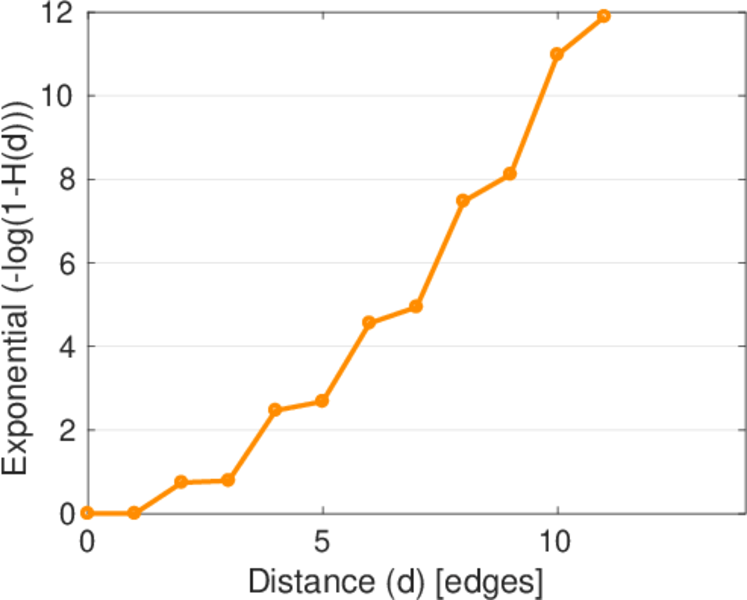
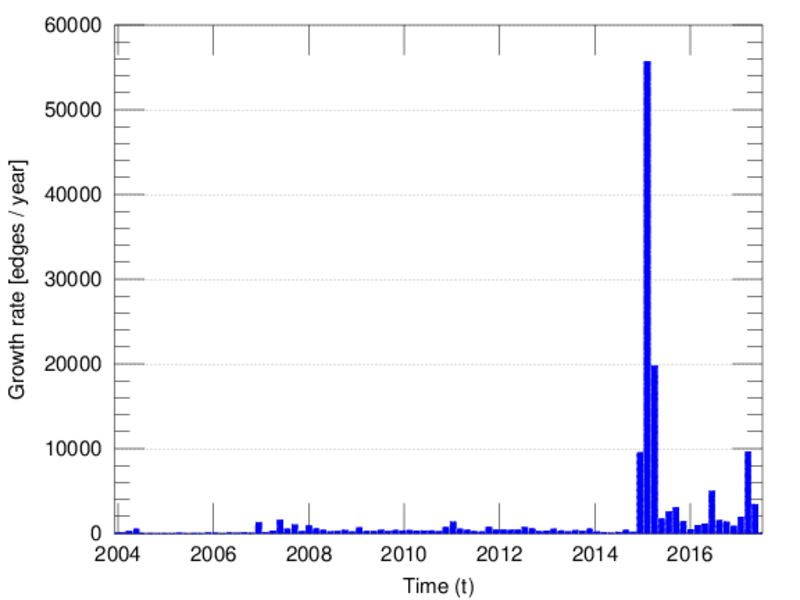
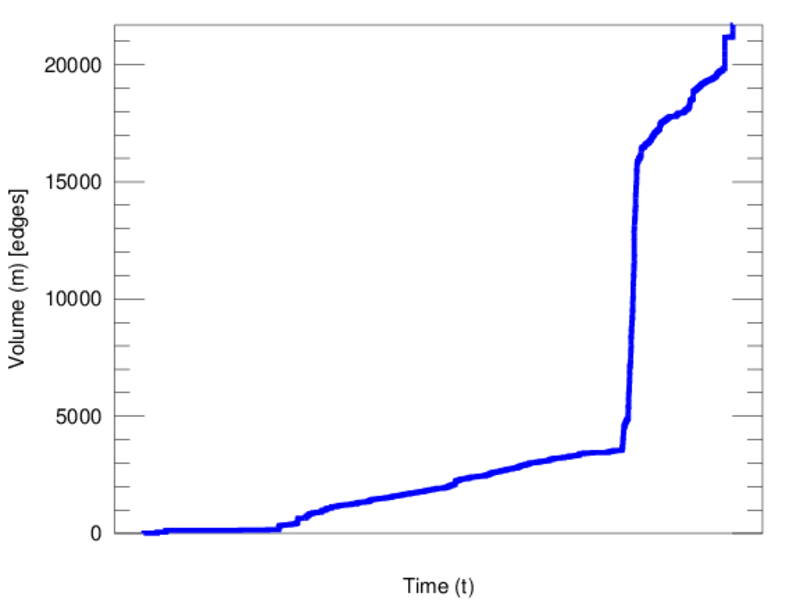
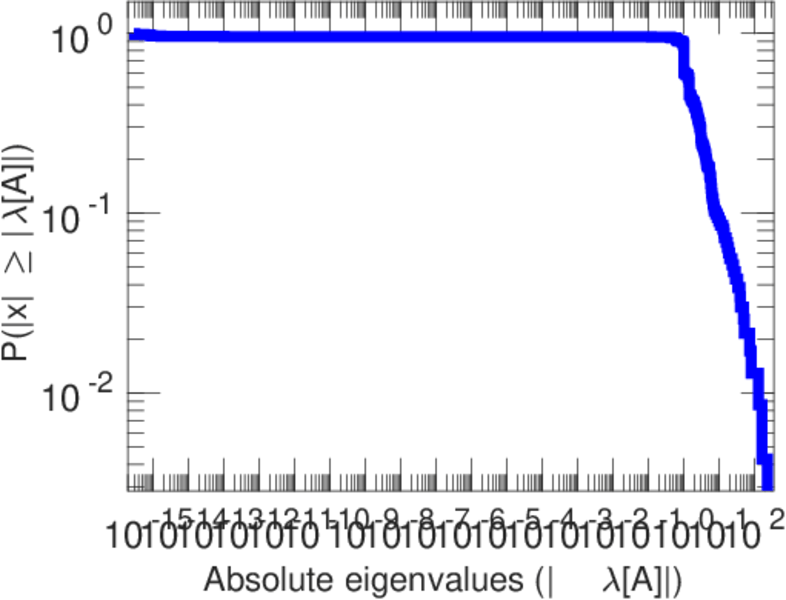
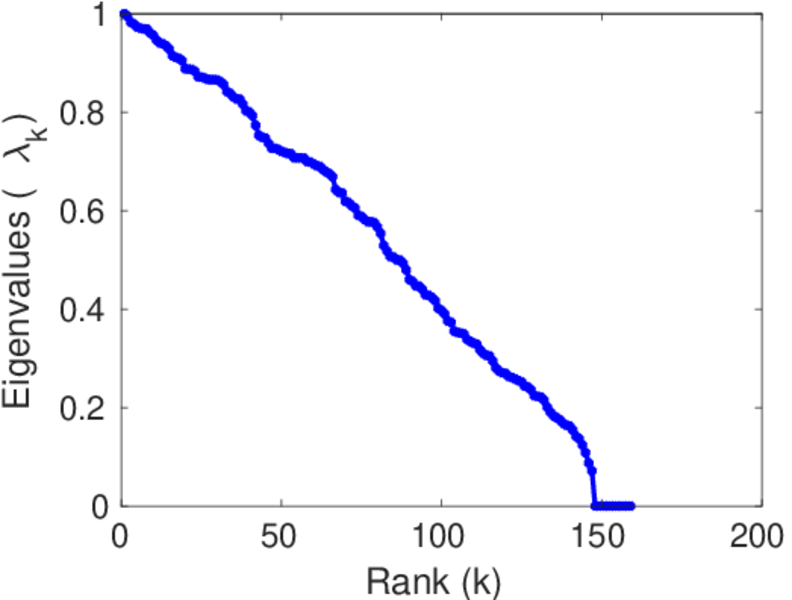
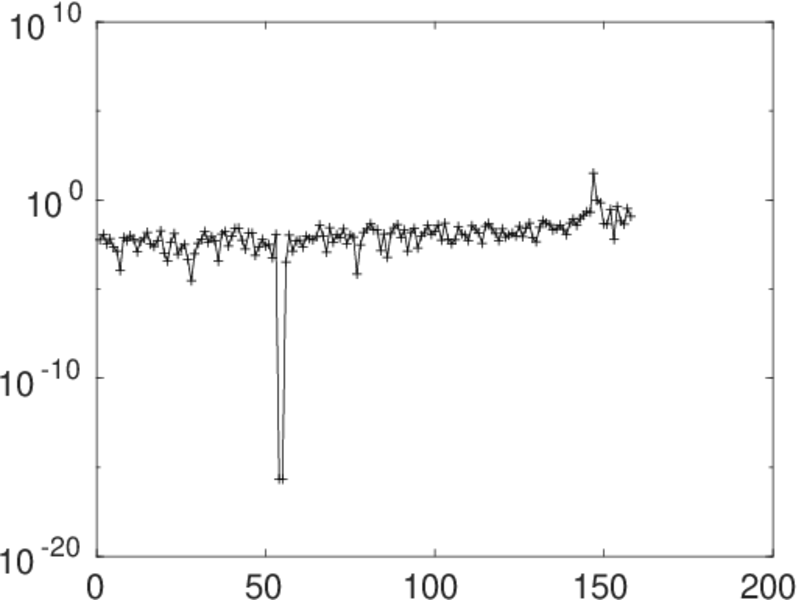
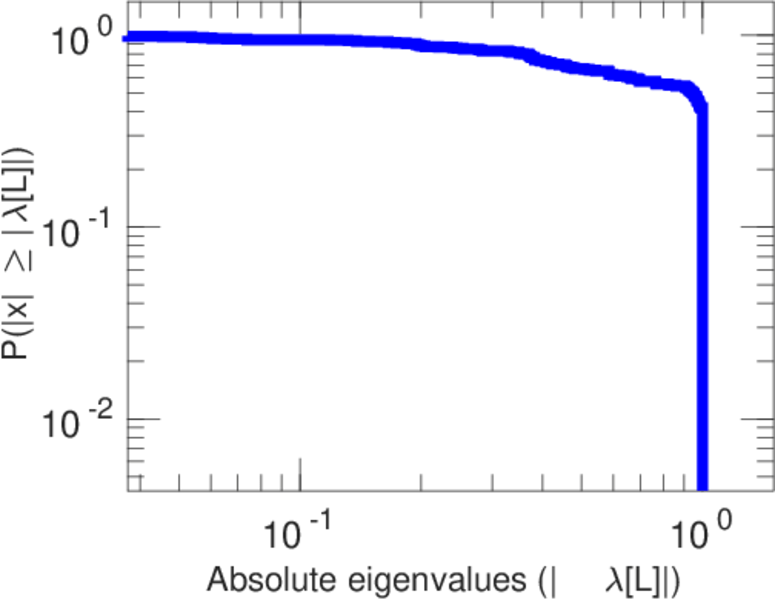
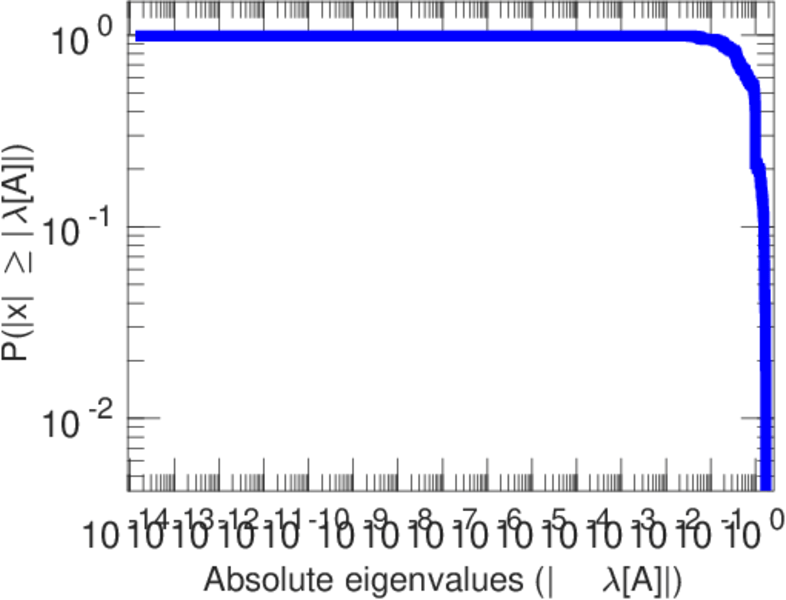
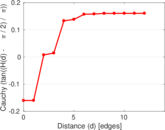
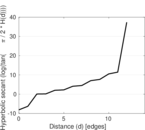
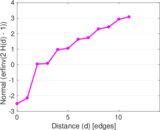
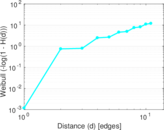
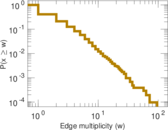
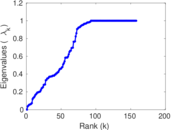
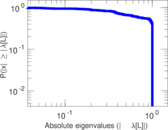
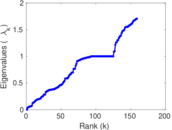
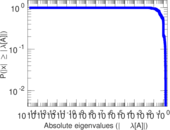
Plots


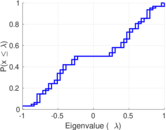


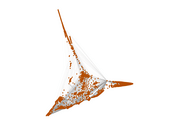

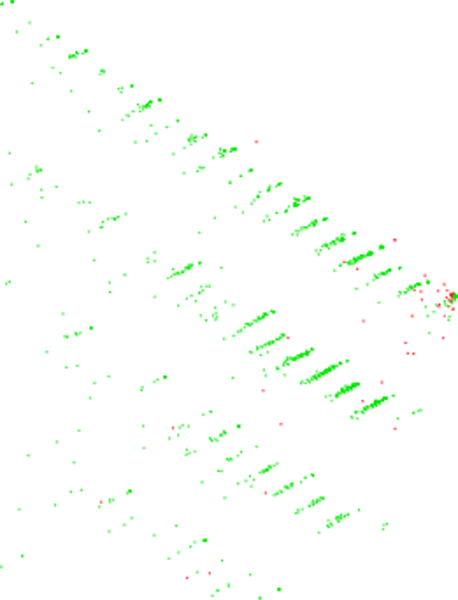
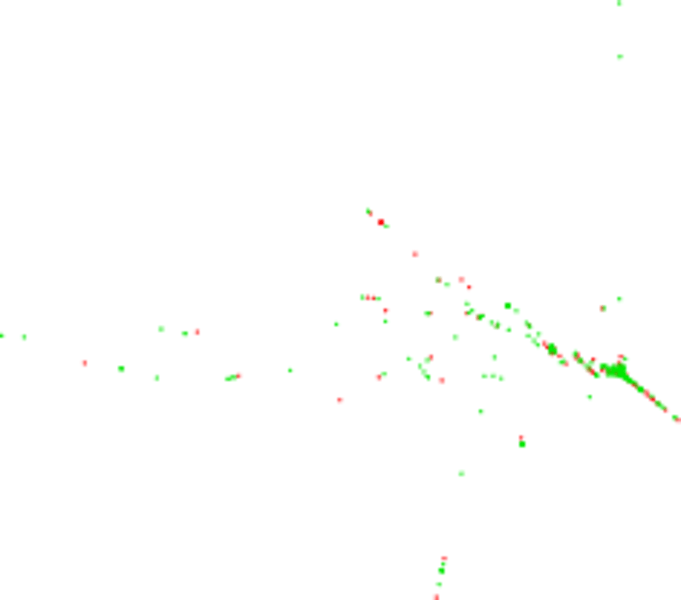
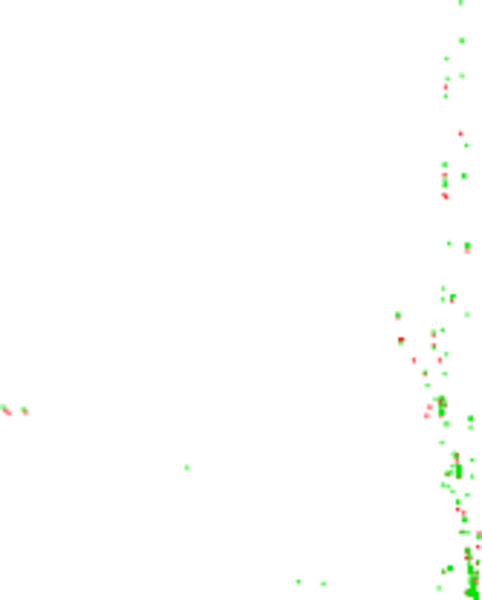
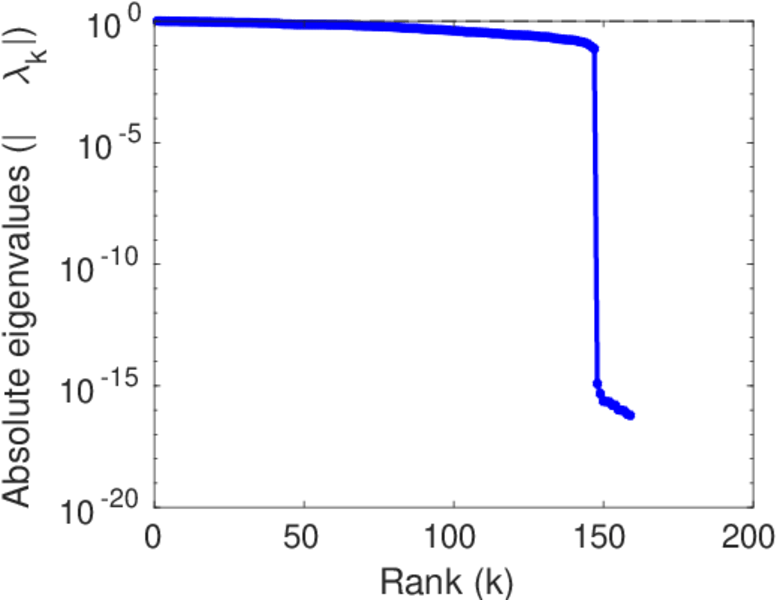
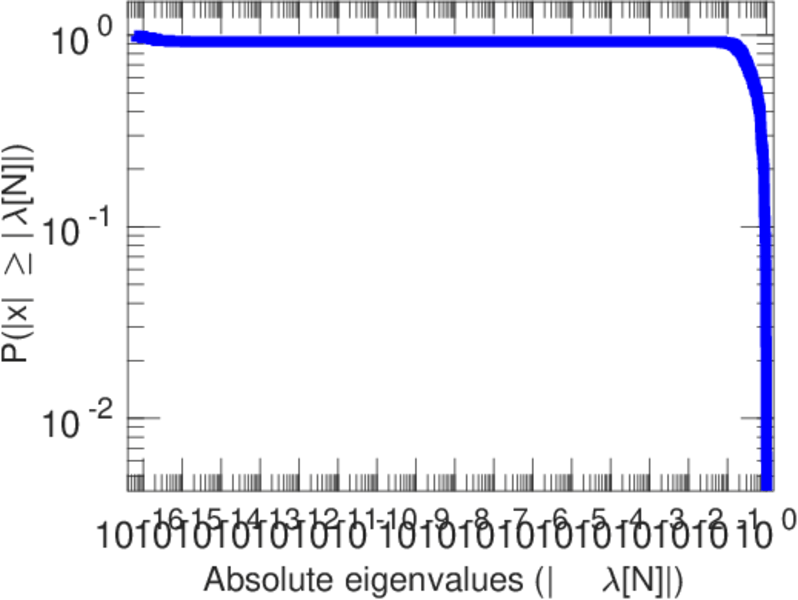
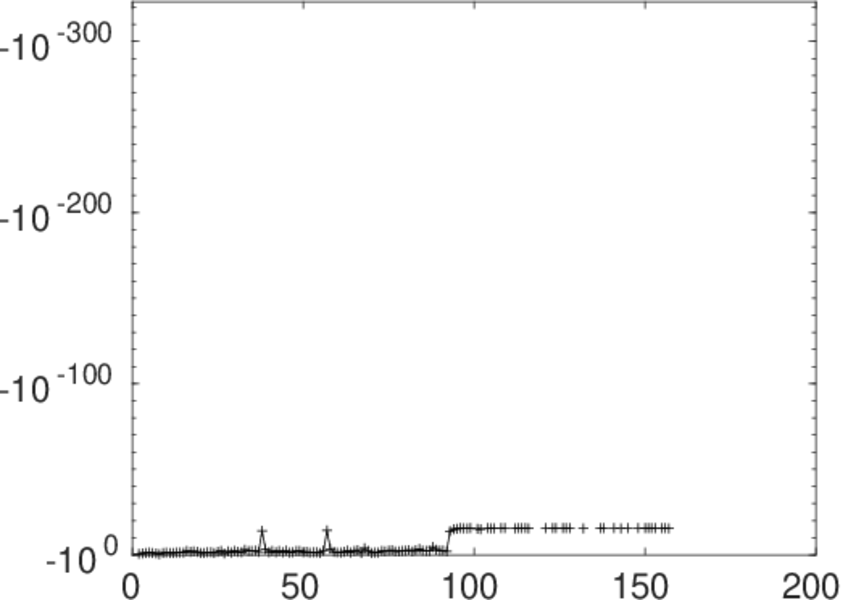
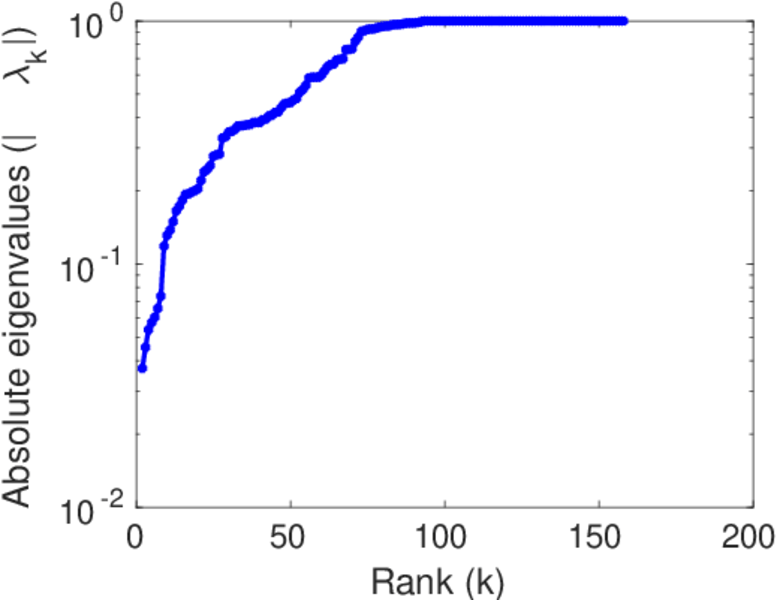
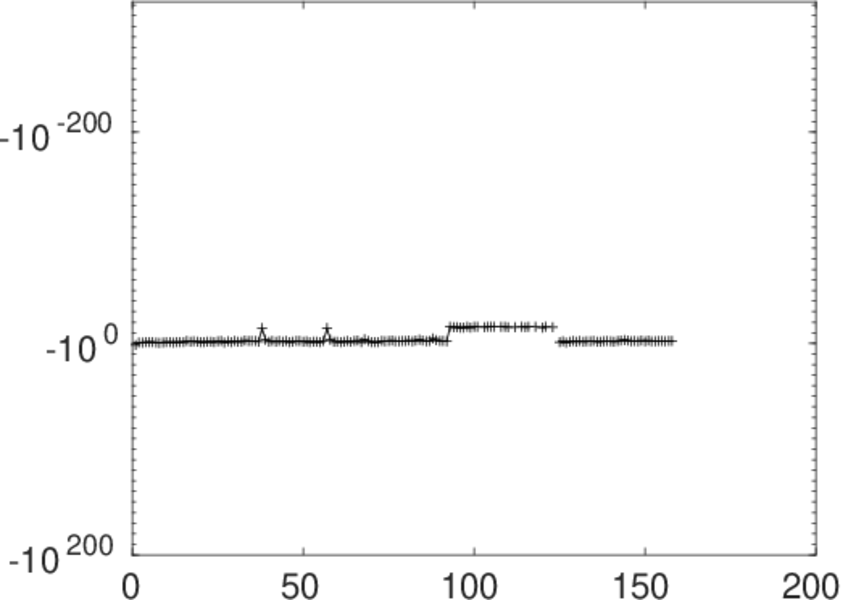
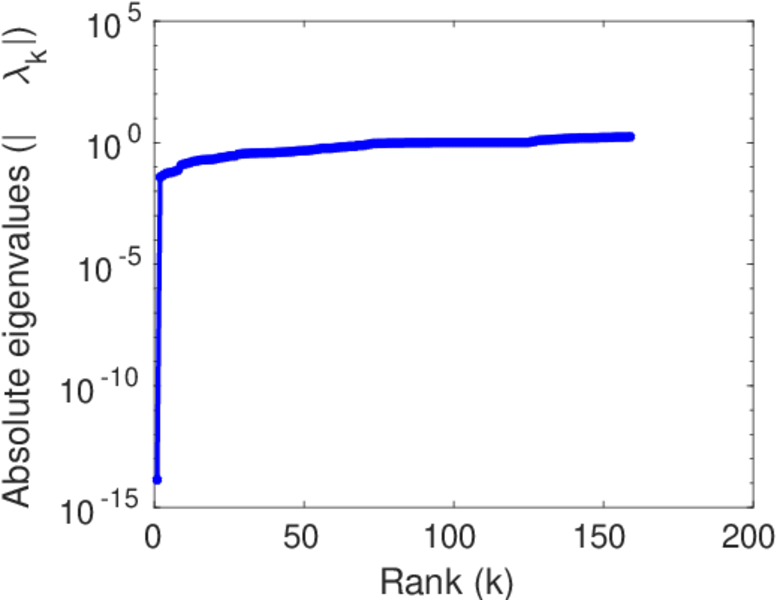
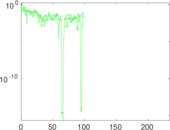
Matrix decompositions plots


Downloads
References
|
[1]
|
Jérôme Kunegis.
KONECT – The Koblenz Network Collection.
In Proc. Int. Conf. on World Wide Web Companion, pages
1343–1350, 2013.
[ http ]
|
|
[2]
|
Wikimedia Foundation.
Wikimedia downloads.
http://dumps.wikimedia.org/, January 2010.
|
 KONECT ‣ Networks ‣
Buy Me a Coffee
KONECT ‣ Networks ‣
Buy Me a Coffee