Wikipedia edits (glk)
This is the bipartite edit network of the Gilaki Wikipedia. It contains users
and pages from the Gilaki Wikipedia, connected by edit events. Each edge
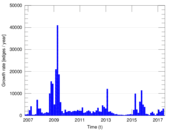
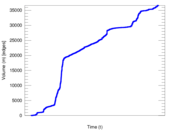
represents an edit. The dataset includes the timestamp of each edit.
Metadata
Statistics
| Size | n = | 12,825
|
| Left size | n1 = | 868
|
| Right size | n2 = | 11,957
|
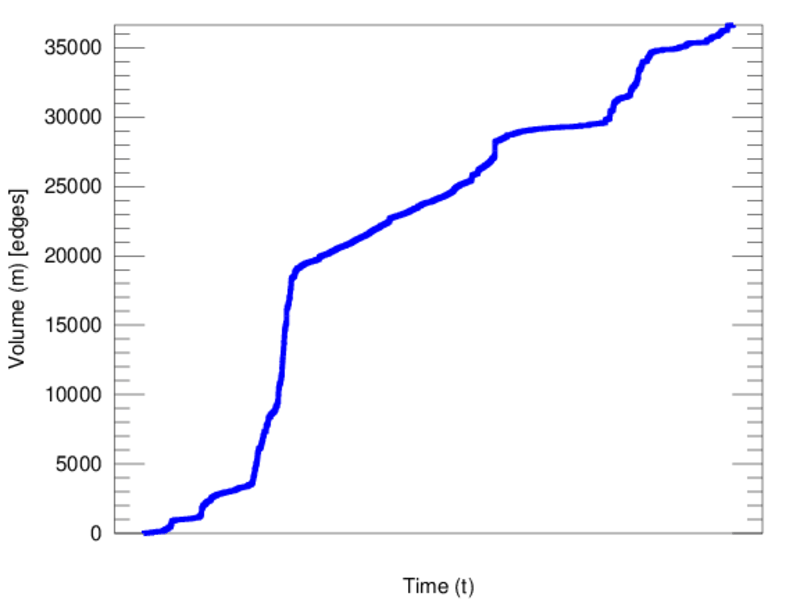
| Volume | m = | 36,620
|
| Unique edge count | m̿ = | 19,180
|
| Wedge count | s = | 28,118,466
|
| Claw count | z = | 57,506,866,552
|
| Cross count | x = | 96,943,064,183,460
|
| Square count | q = | 1,054,969
|
| 4-Tour count | T4 = | 120,970,808
|
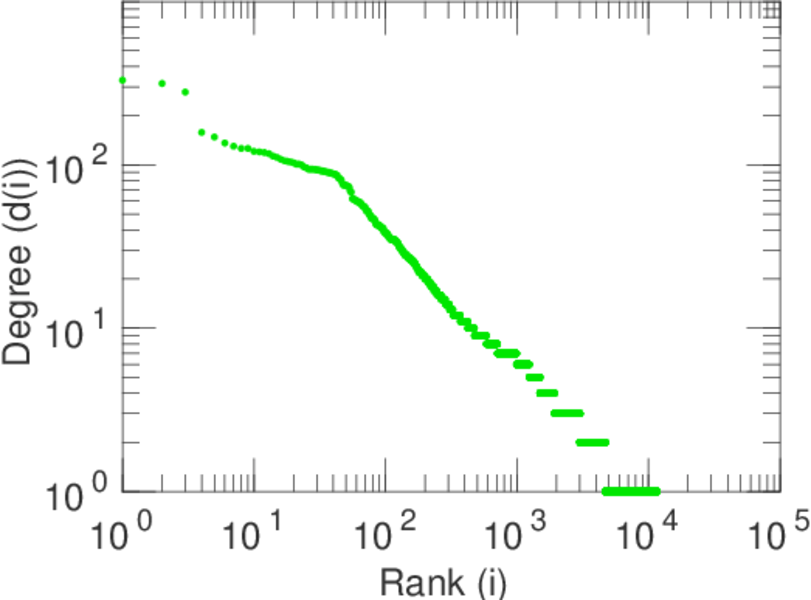
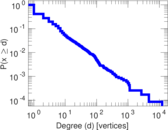
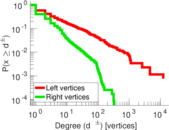
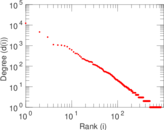
| Maximum degree | dmax = | 12,284
|
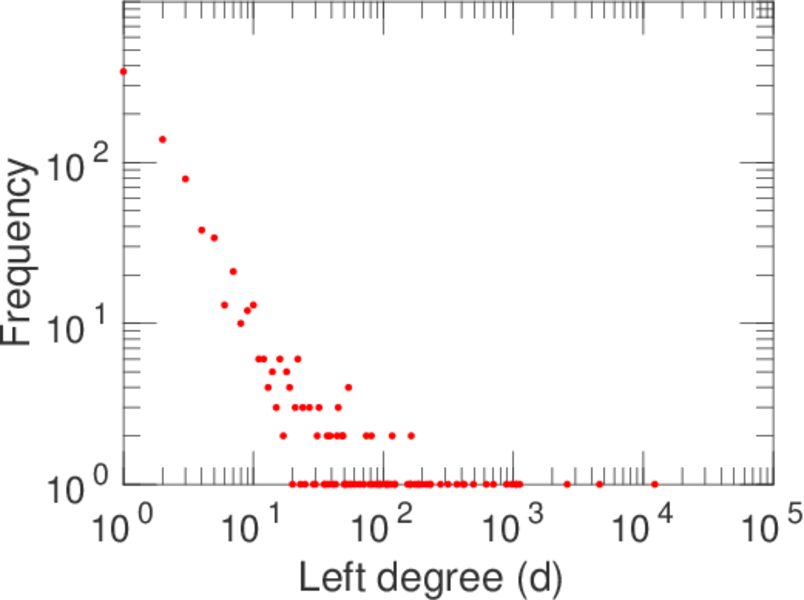
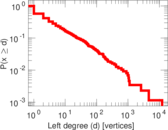
| Maximum left degree | d1max = | 12,284
|
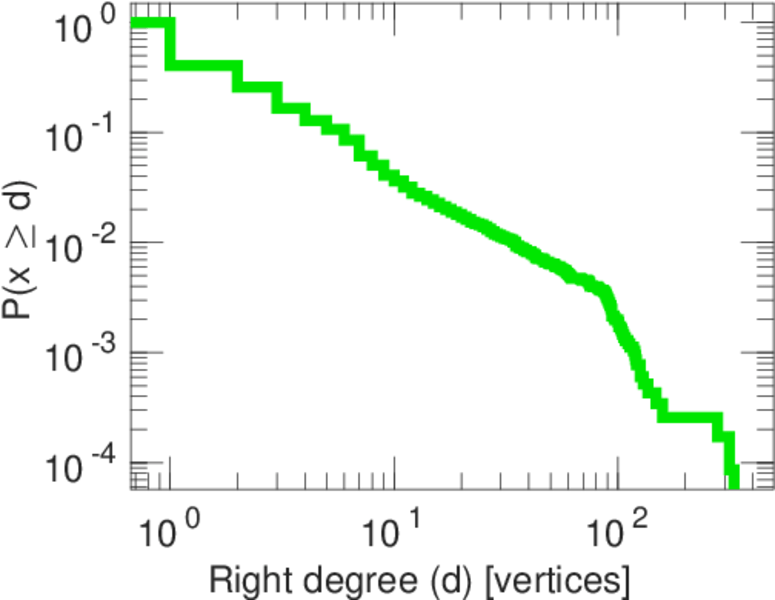
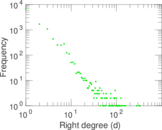
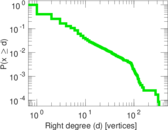
| Maximum right degree | d2max = | 330
|
| Average degree | d = | 5.710 72
|
| Average left degree | d1 = | 42.188 9
|
| Average right degree | d2 = | 3.062 64
|
| Fill | p = | 0.001 848 02
|
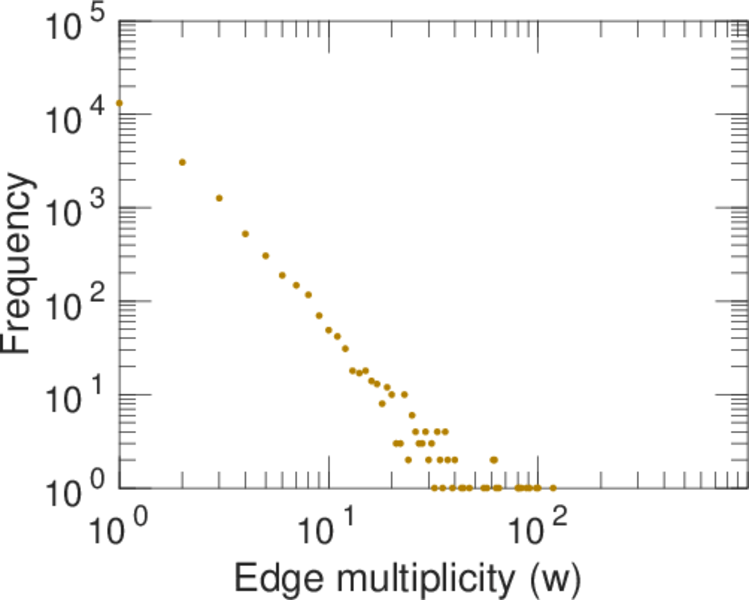
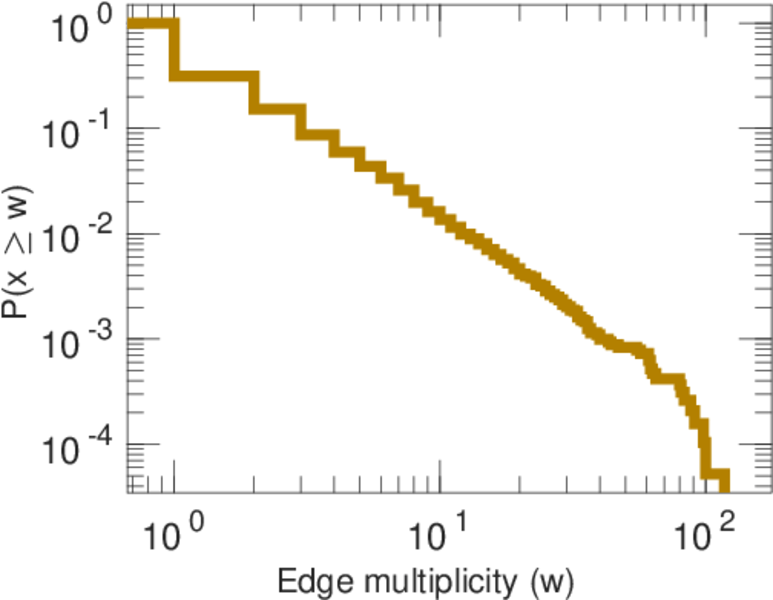
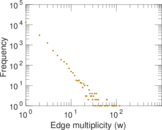
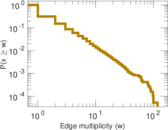
| Average edge multiplicity | m̃ = | 1.909 28
|
| Size of LCC | N = | 11,885
|
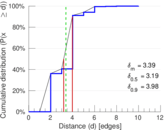
| Diameter | δ = | 12
|
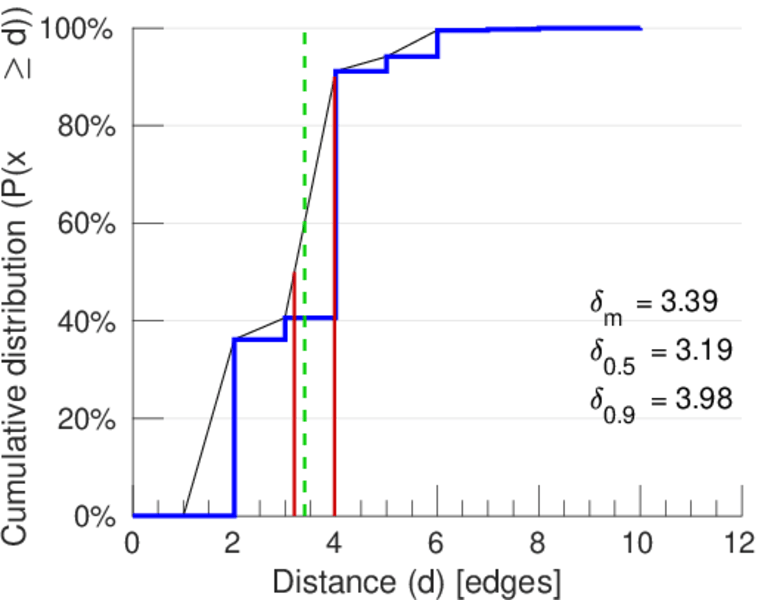
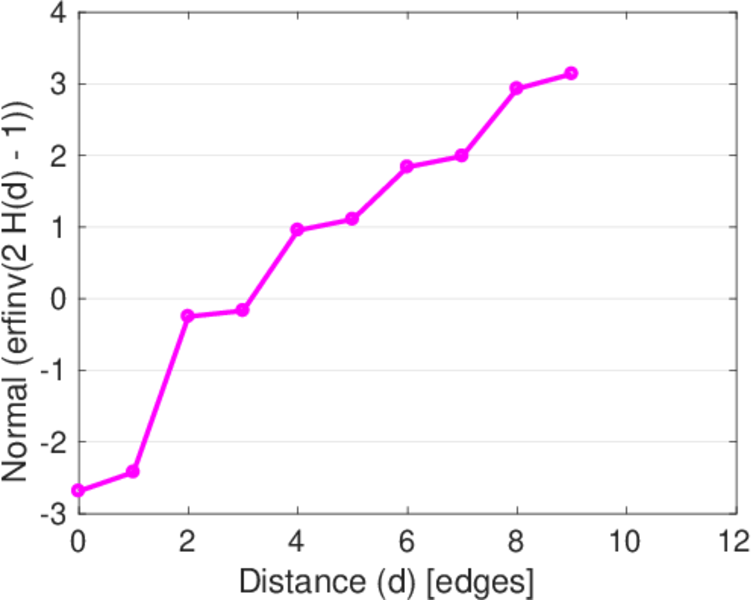
| 50-Percentile effective diameter | δ0.5 = | 3.185 85
|
| 90-Percentile effective diameter | δ0.9 = | 3.977 14
|
| Median distance | δM = | 4
|
| Mean distance | δm = | 3.386 20
|
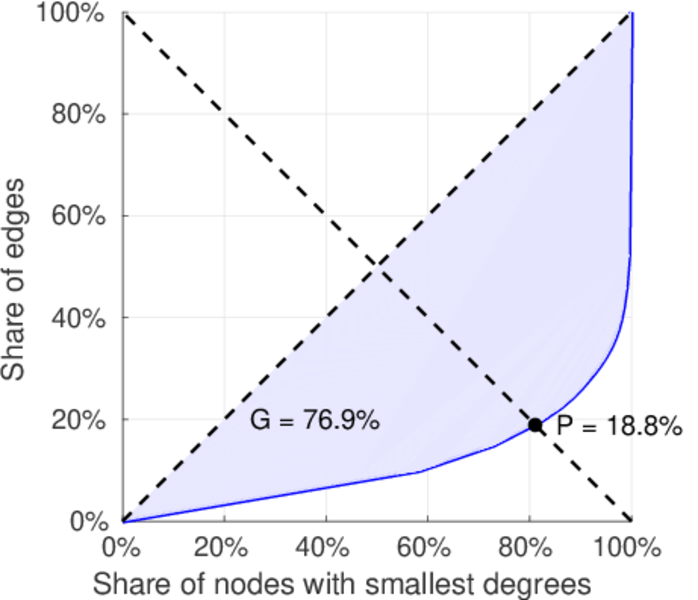
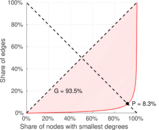
| Gini coefficient | G = | 0.780 335
|
| Balanced inequality ratio | P = | 0.182 755
|
| Left balanced inequality ratio | P1 = | 0.083 342 4
|
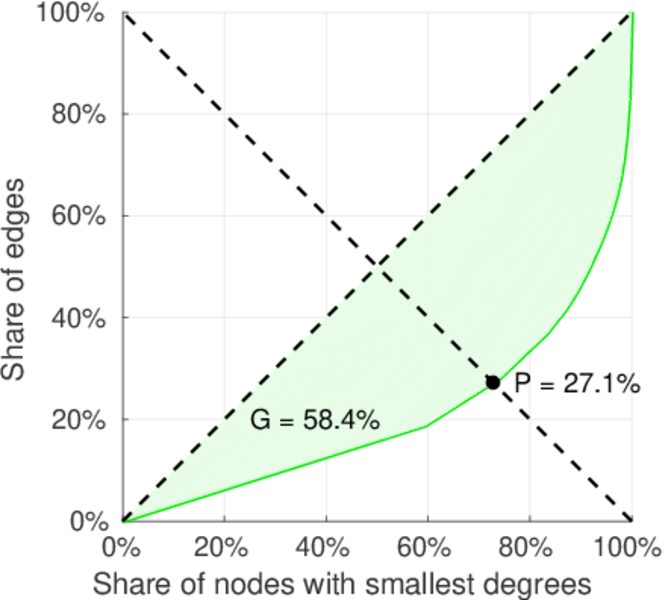
| Right balanced inequality ratio | P2 = | 0.270 836
|
| Relative edge distribution entropy | Her = | 0.725 497
|
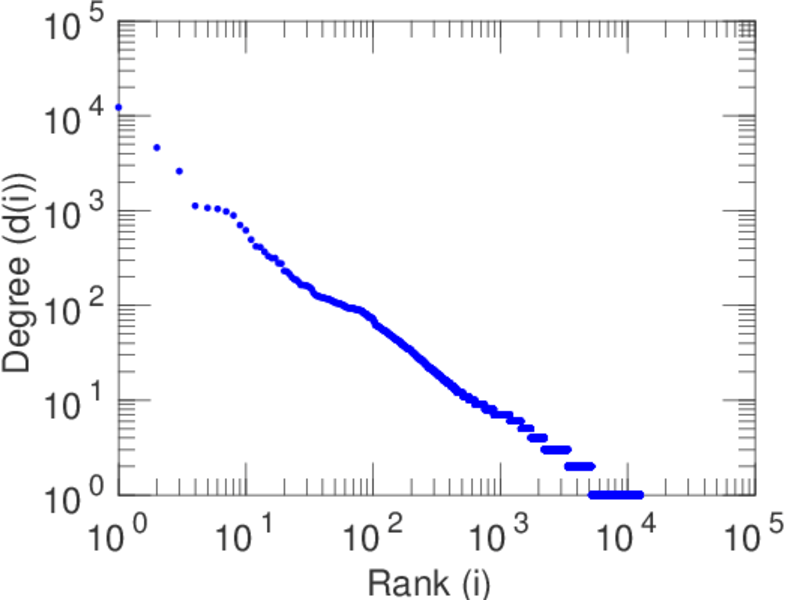
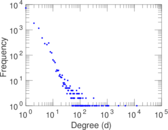
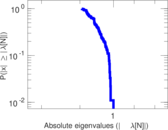
| Power law exponent | γ = | 4.344 42
|
| Tail power law exponent | γt = | 2.471 00
|
| Tail power law exponent with p | γ3 = | 2.471 00
|
| p-value | p = | 0.000 00
|
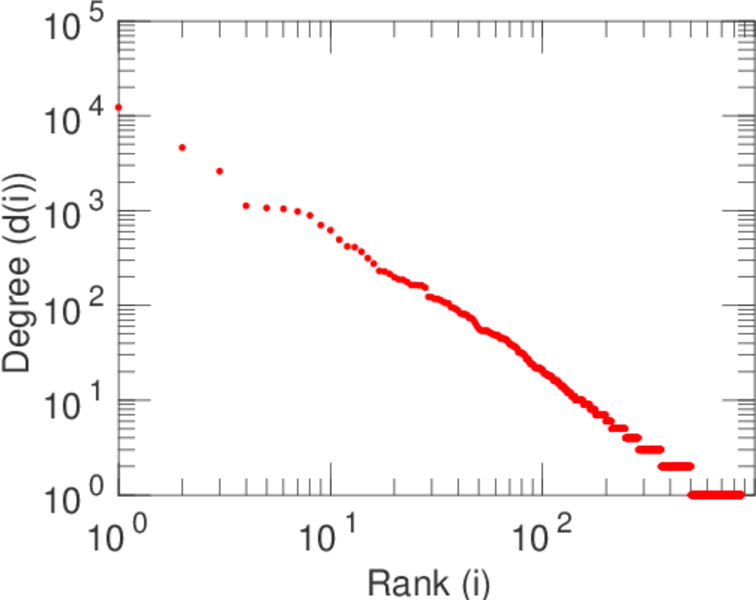
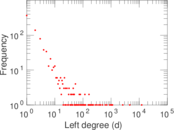
| Left tail power law exponent with p | γ3,1 = | 1.711 00
|
| Left p-value | p1 = | 0.143 000
|
| Right tail power law exponent with p | γ3,2 = | 2.581 00
|
| Right p-value | p2 = | 0.000 00
|
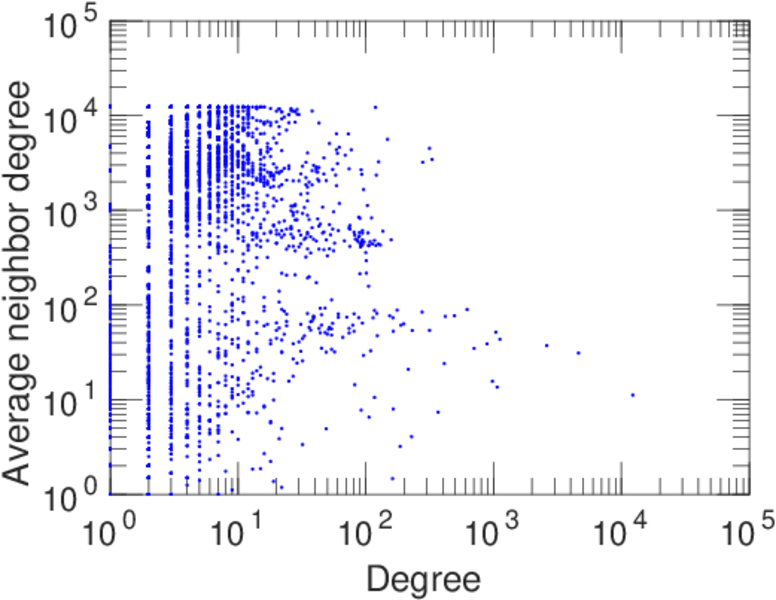
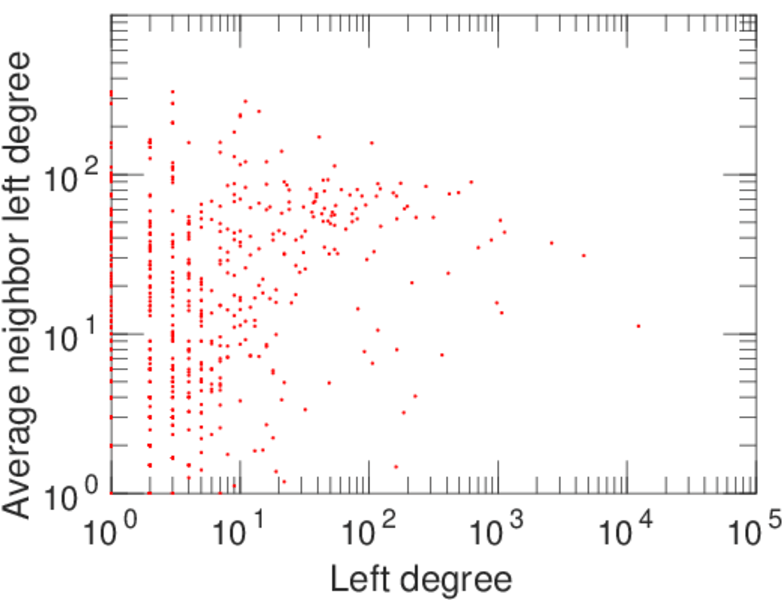
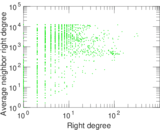
| Degree assortativity | ρ = | −0.396 992
|
| Degree assortativity p-value | pρ = | 0.000 00
|
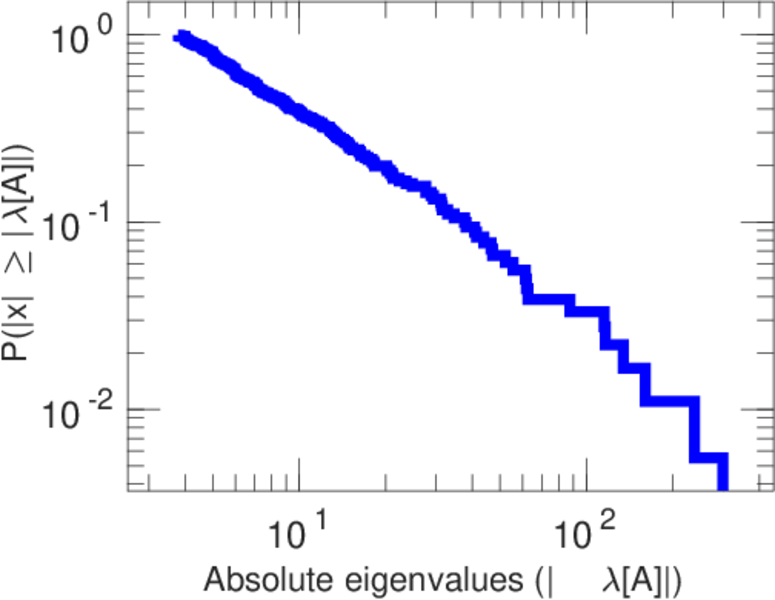
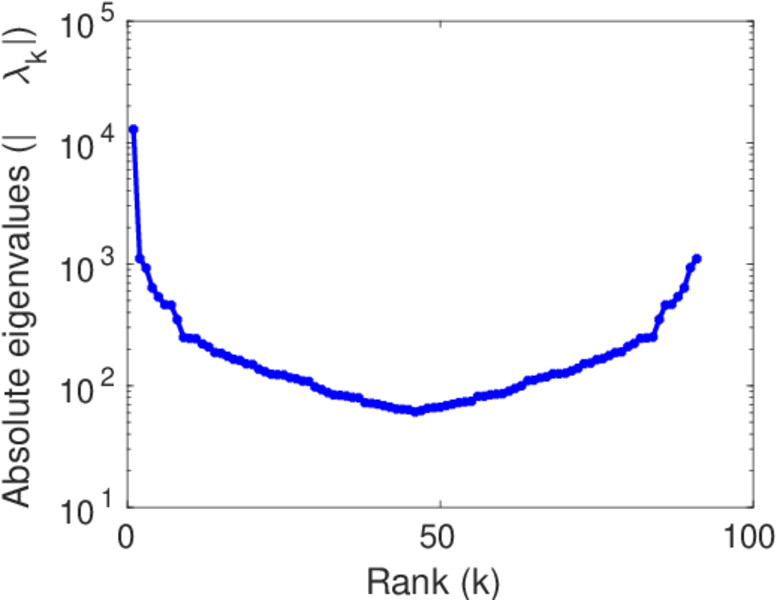
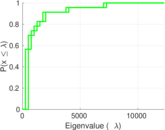
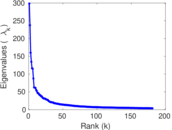
| Spectral norm | α = | 298.292
|
| Algebraic connectivity | a = | 0.048 601 0
|
| Spectral separation | |λ1[A] / λ2[A]| = | 1.256 51
|
| Controllability | C = | 10,860
|
| Relative controllability | Cr = | 0.870 750
|
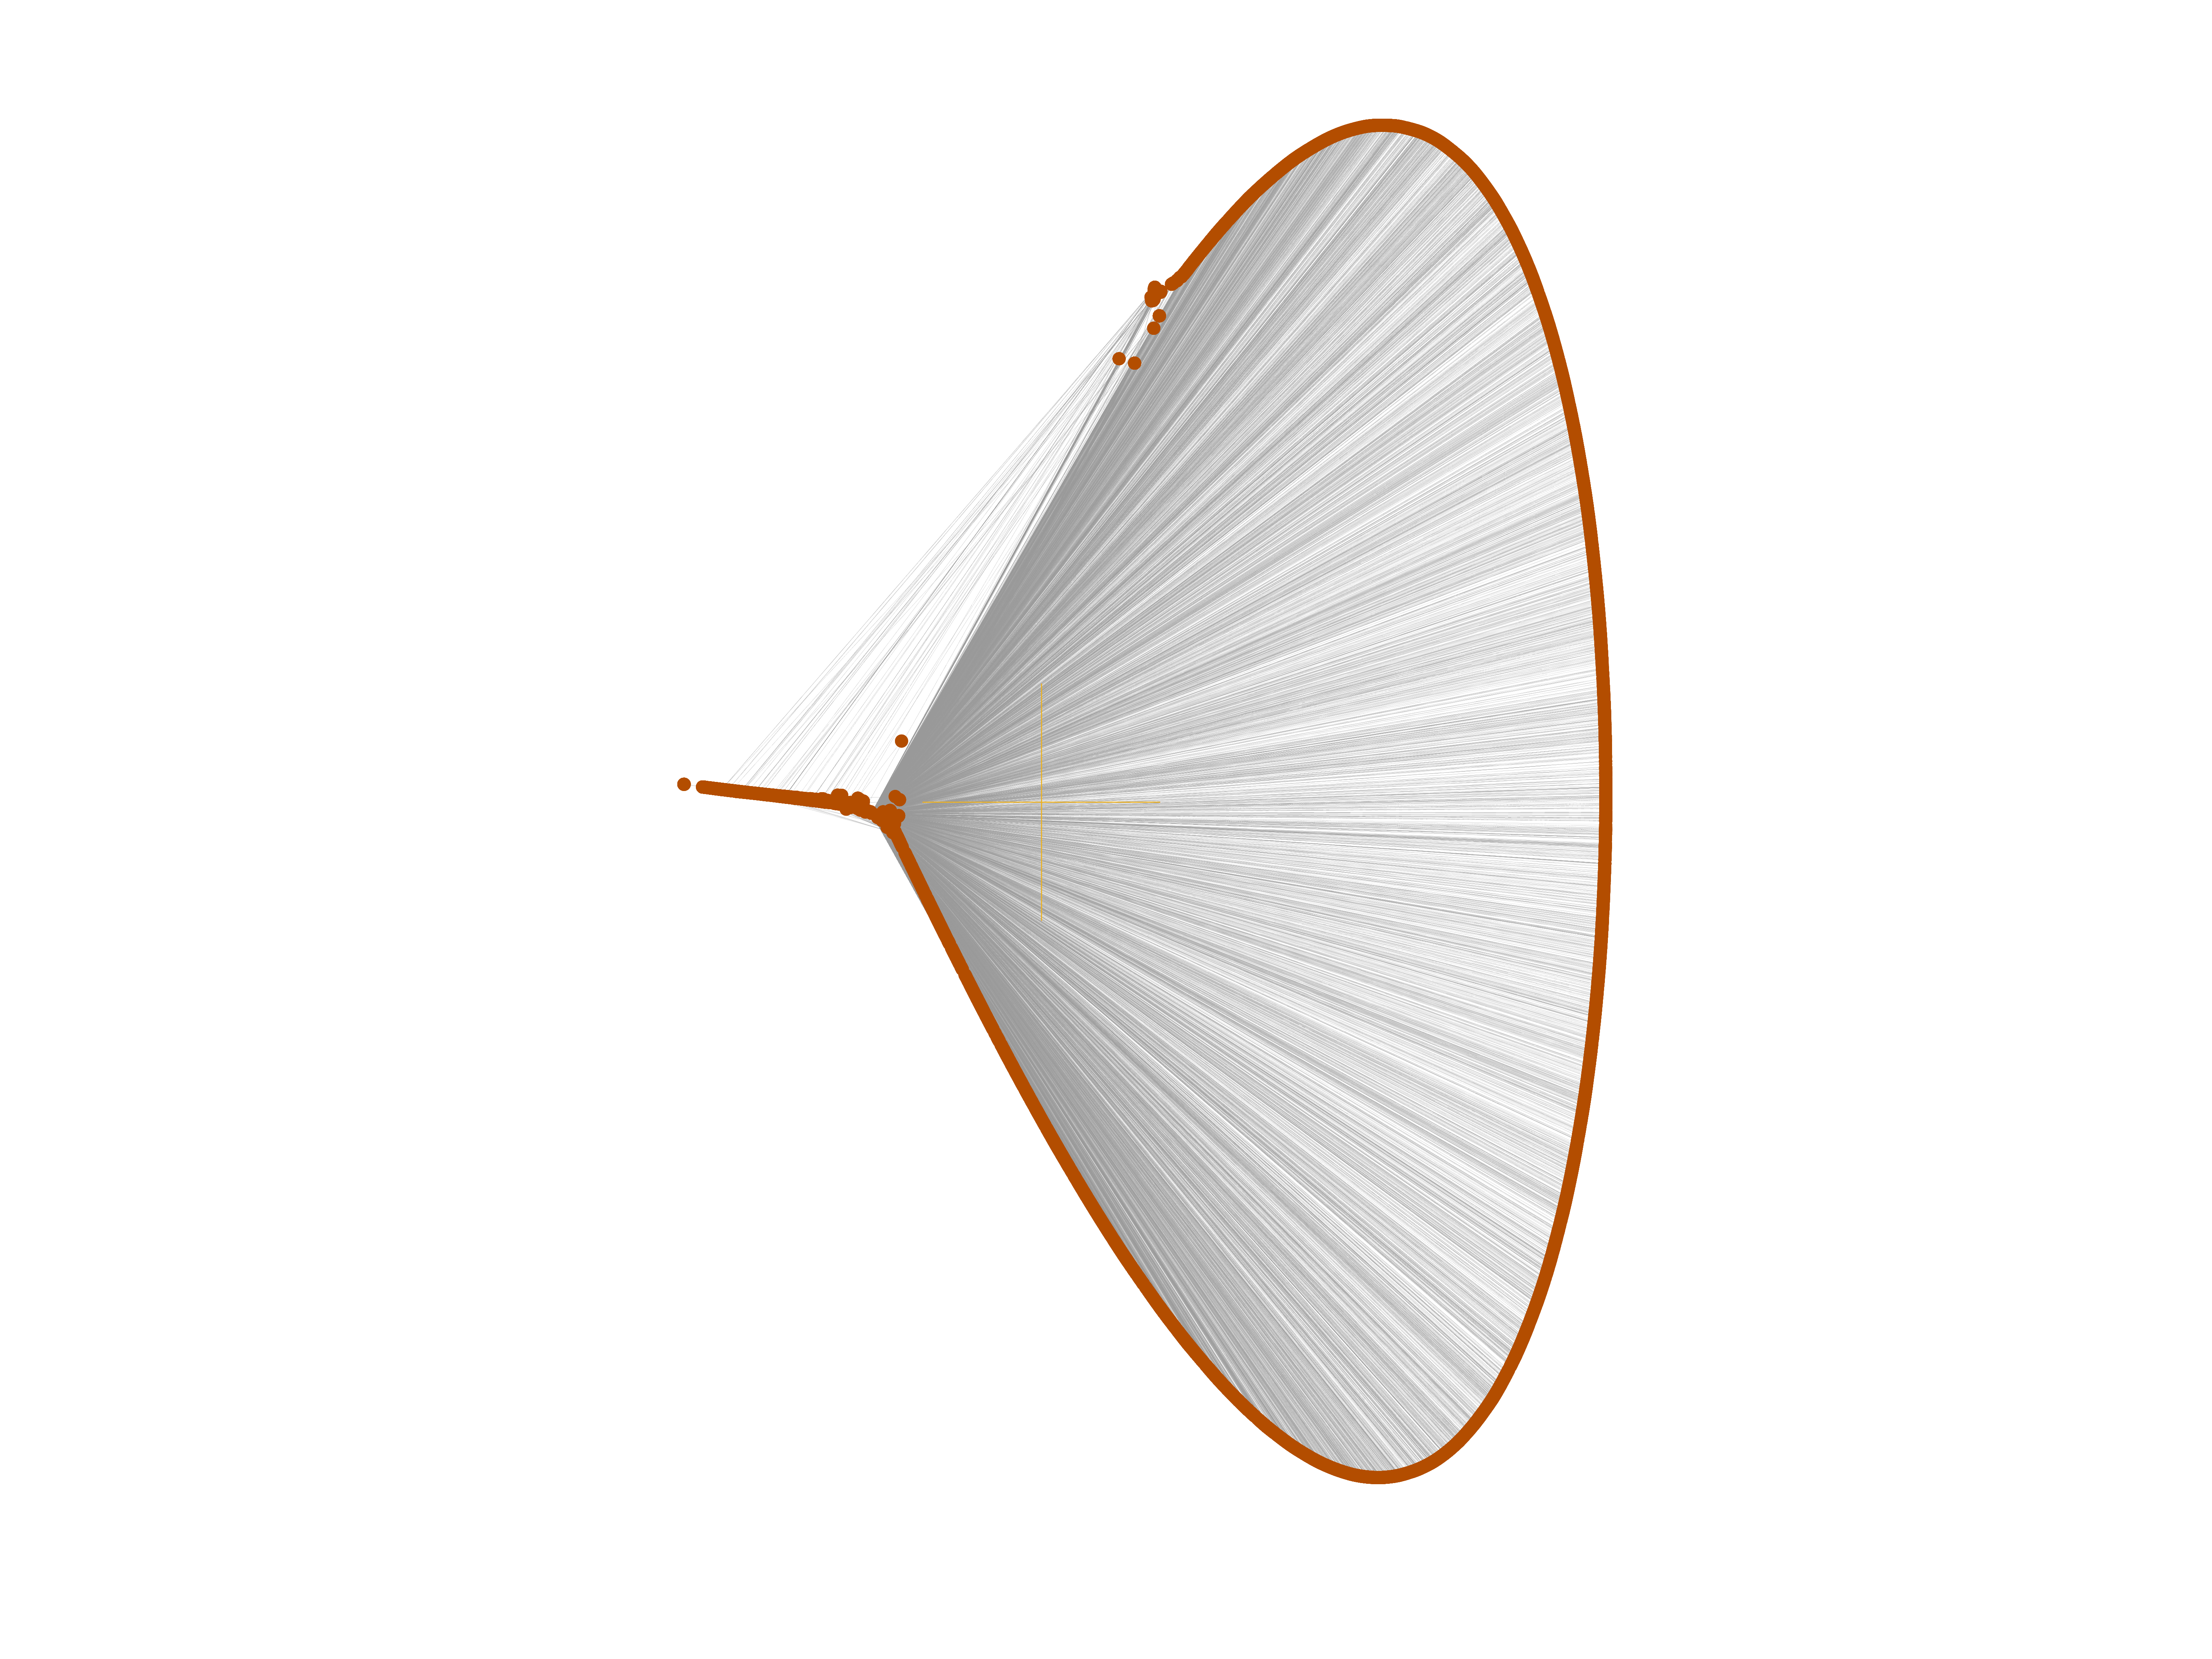
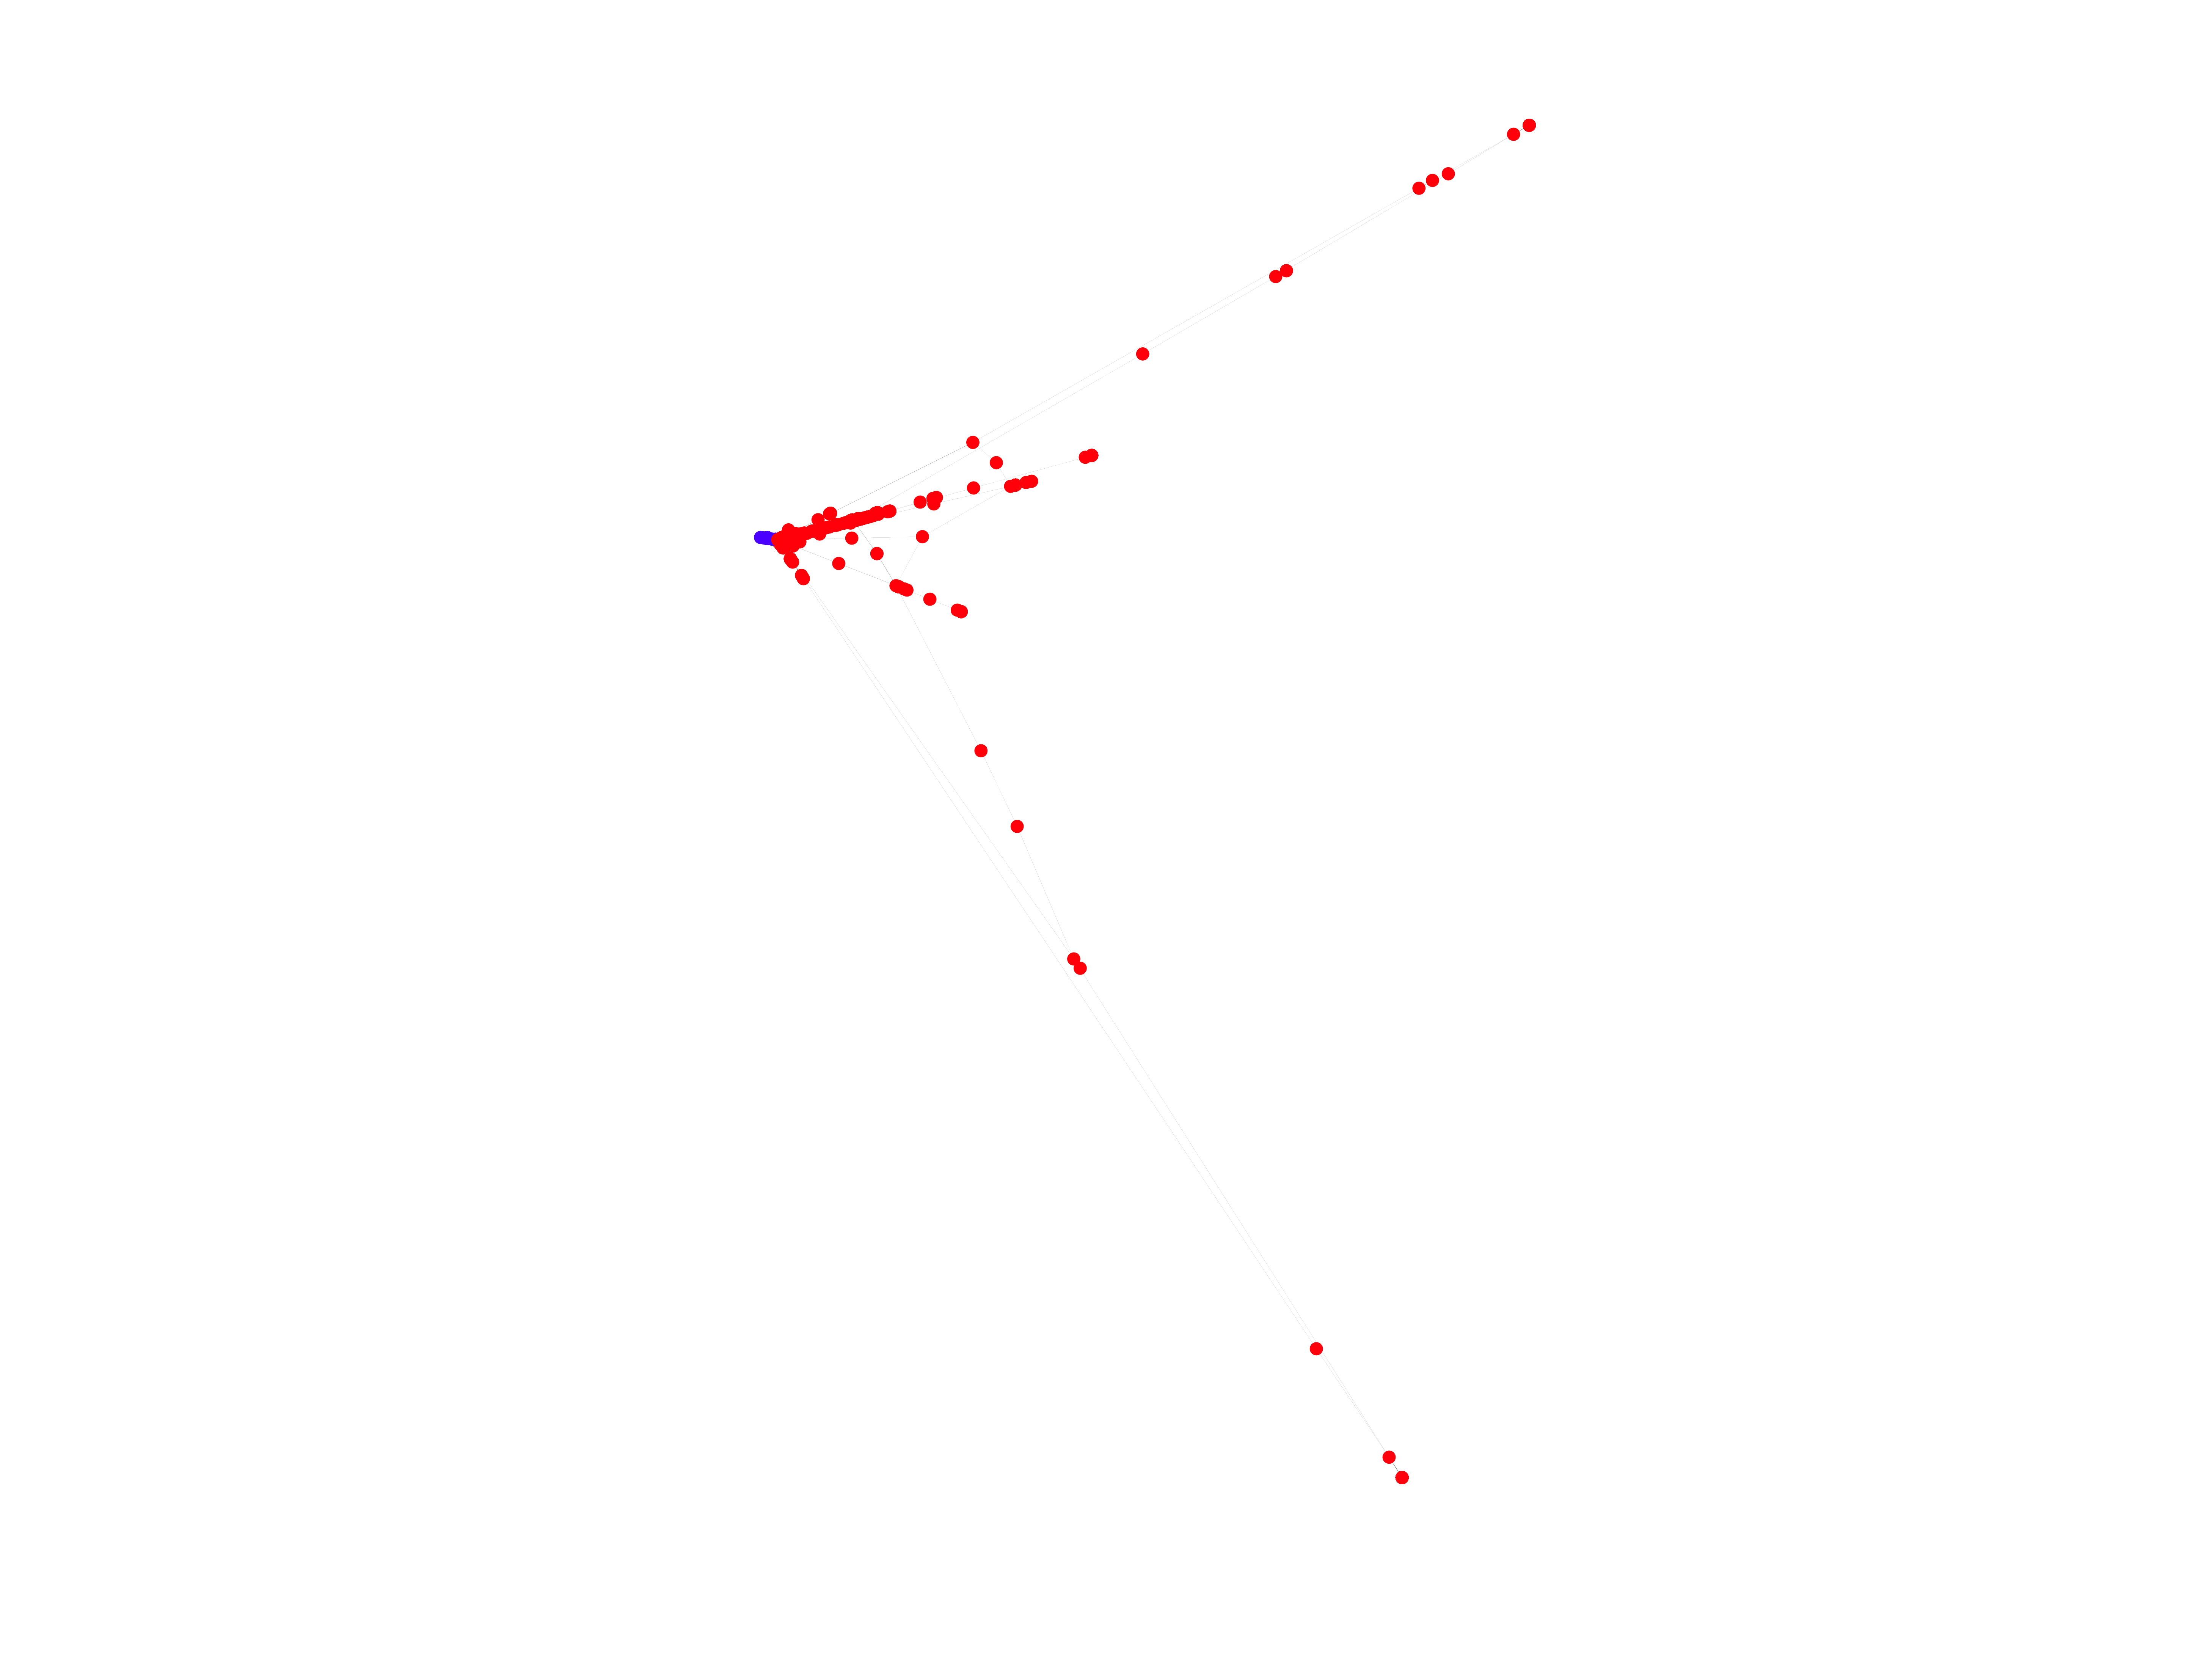
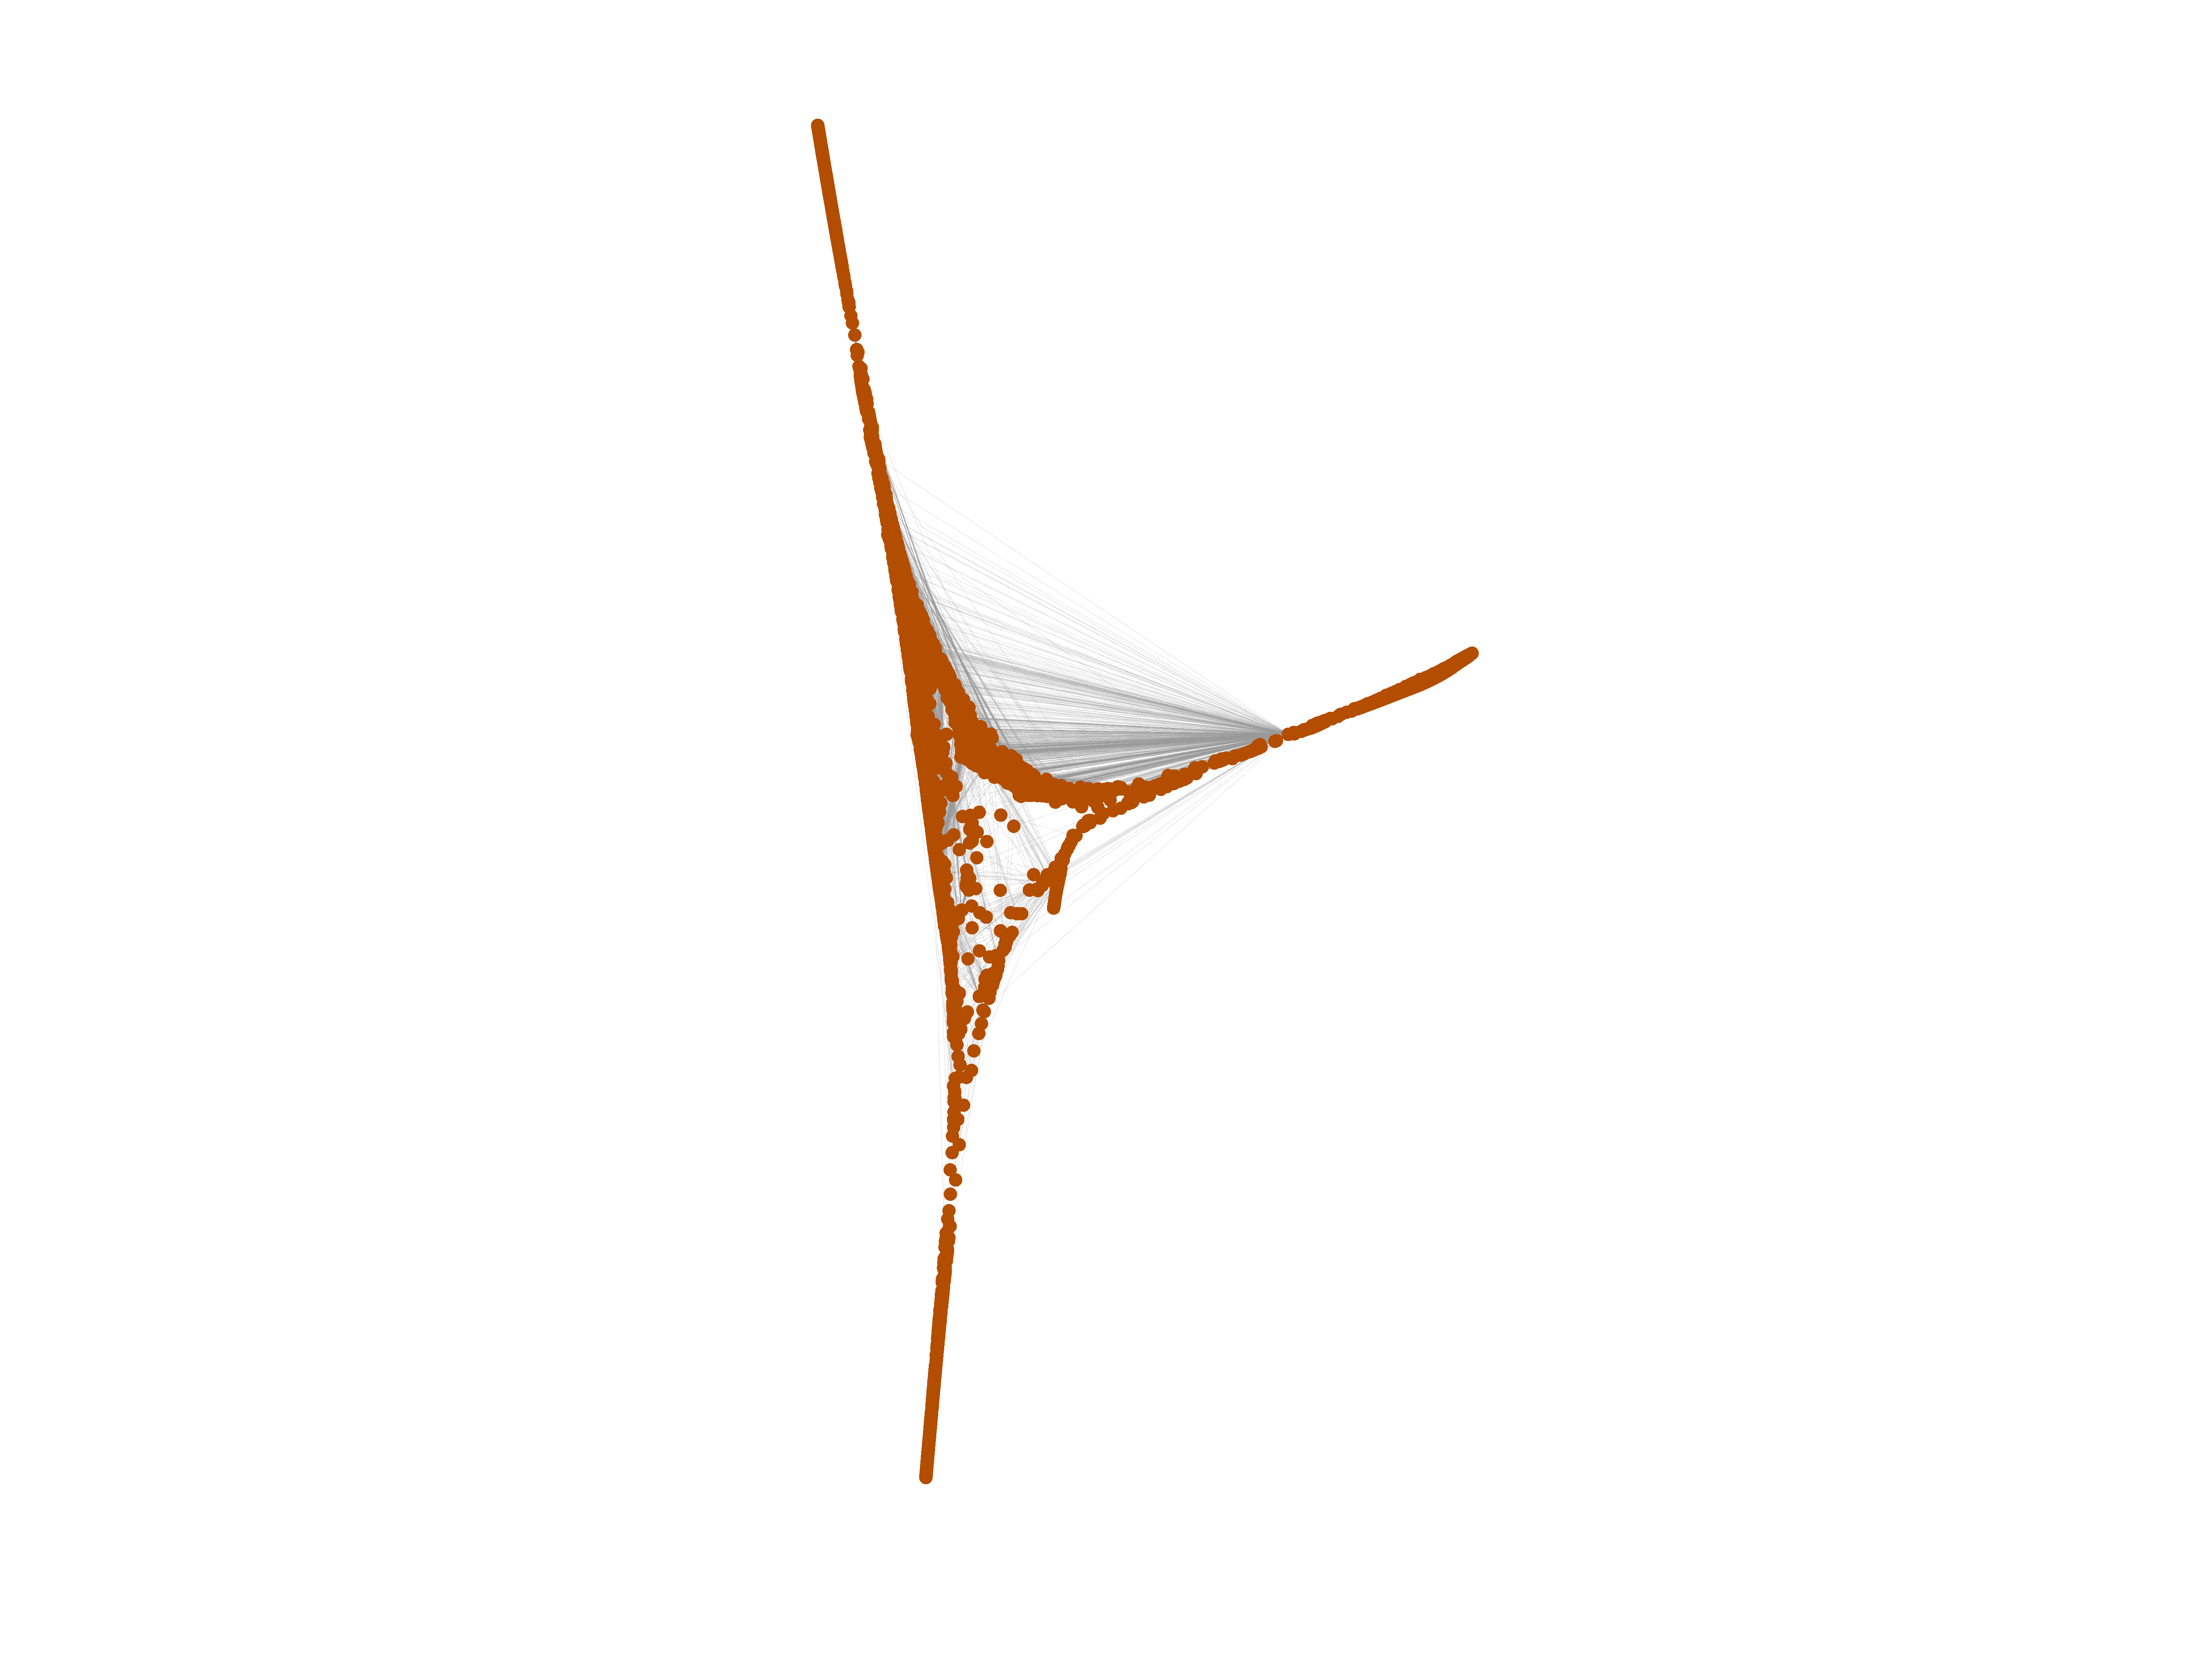
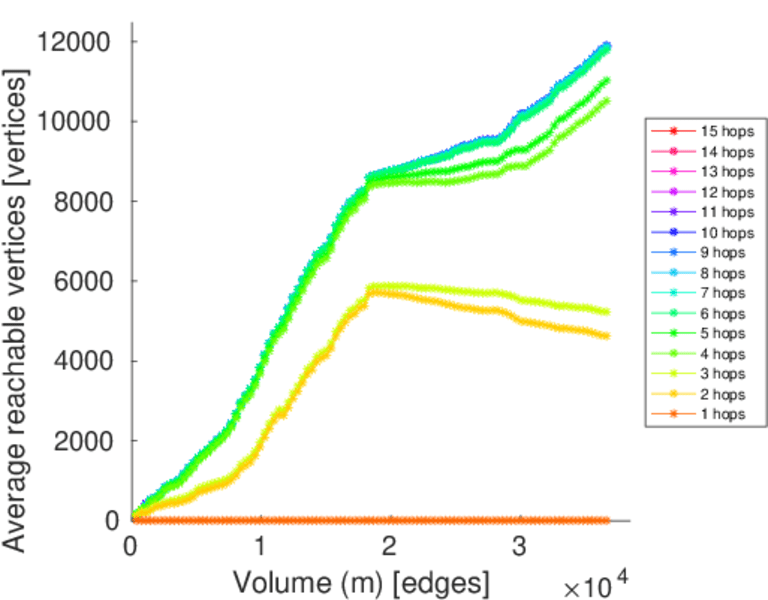
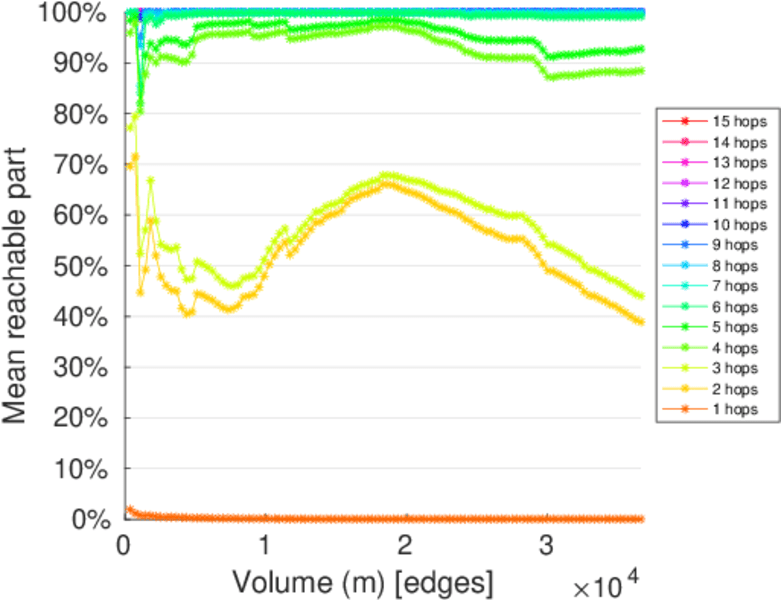
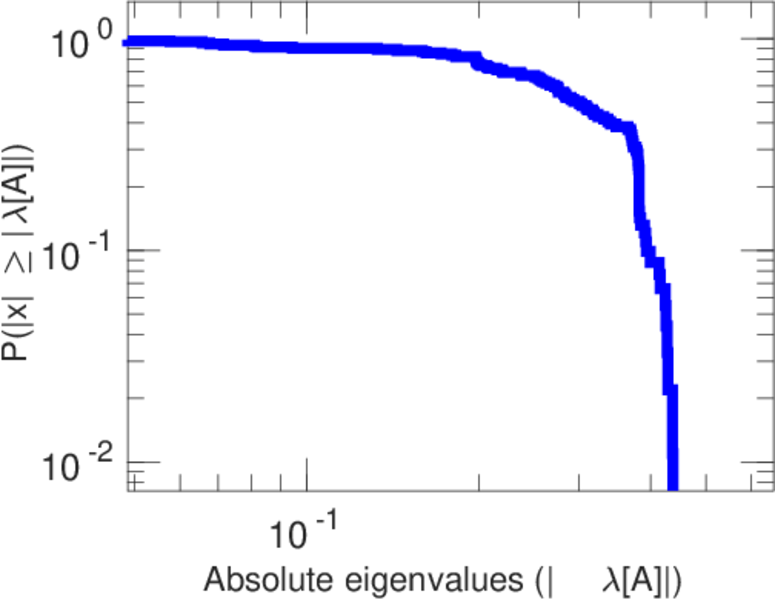
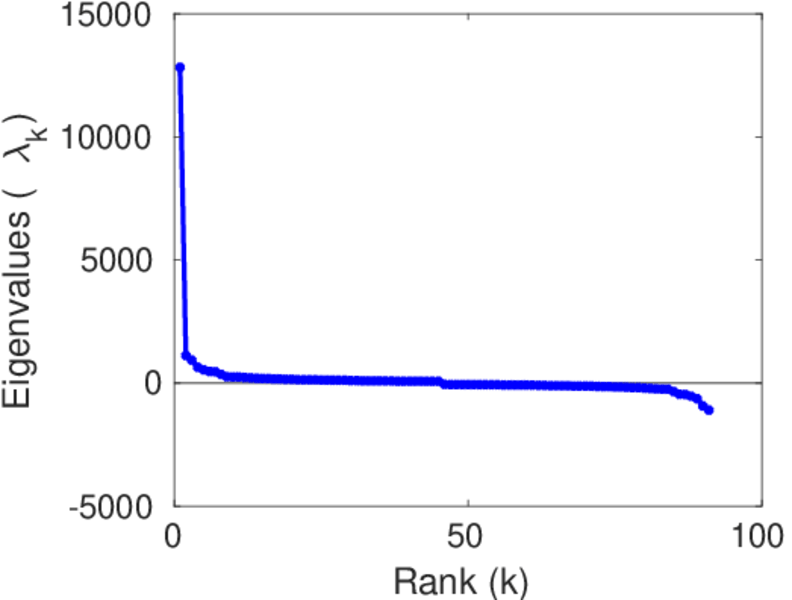
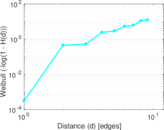
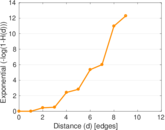
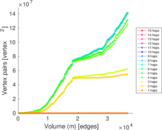
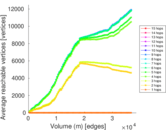
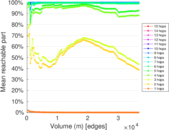
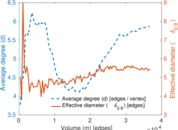
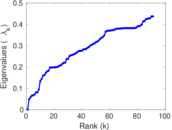
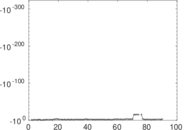
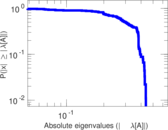
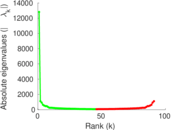
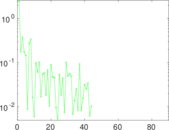
Plots


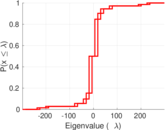
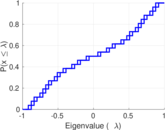
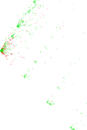
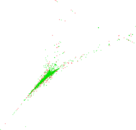


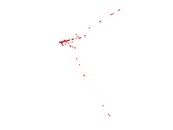

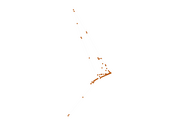

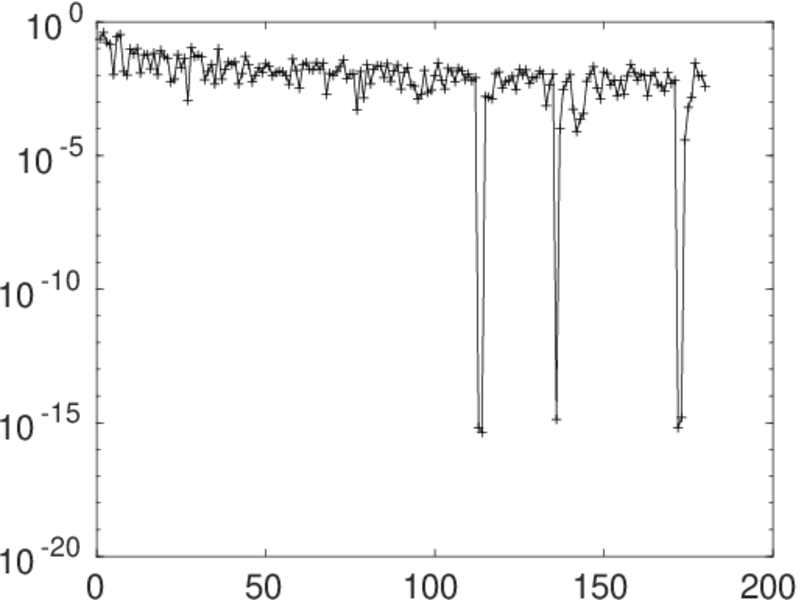
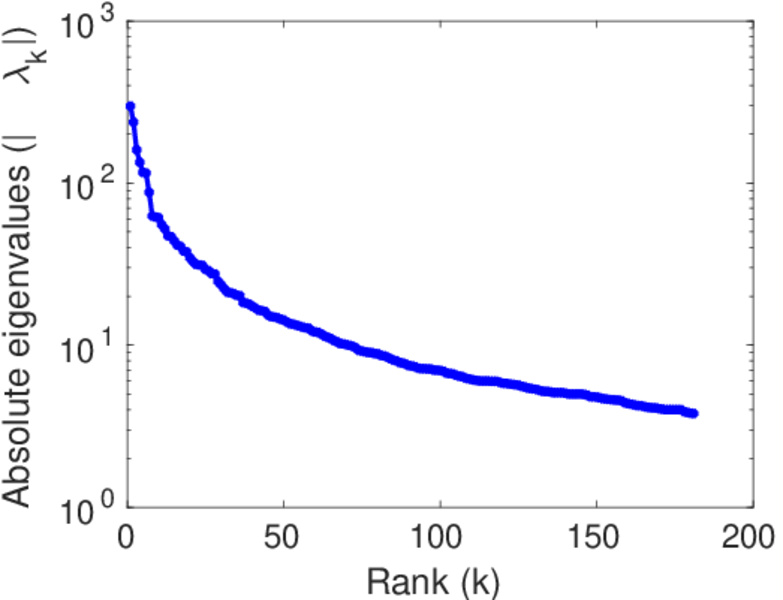
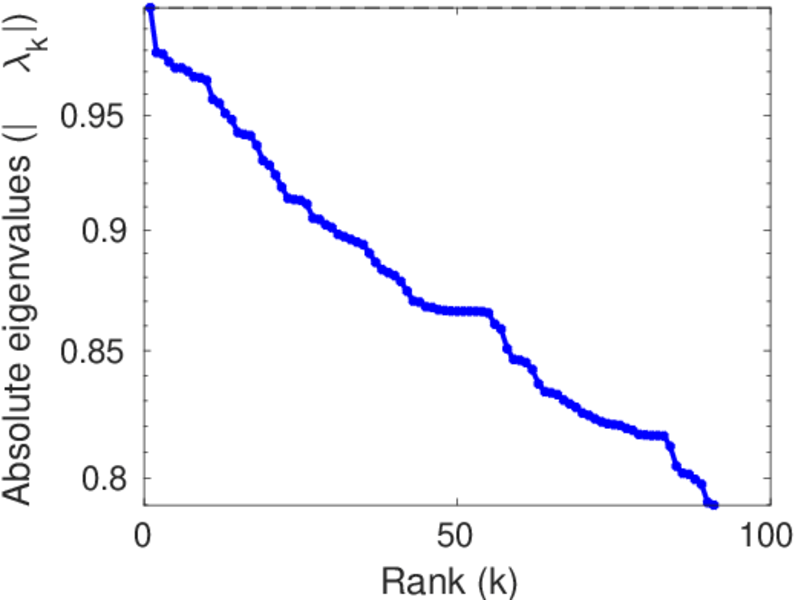
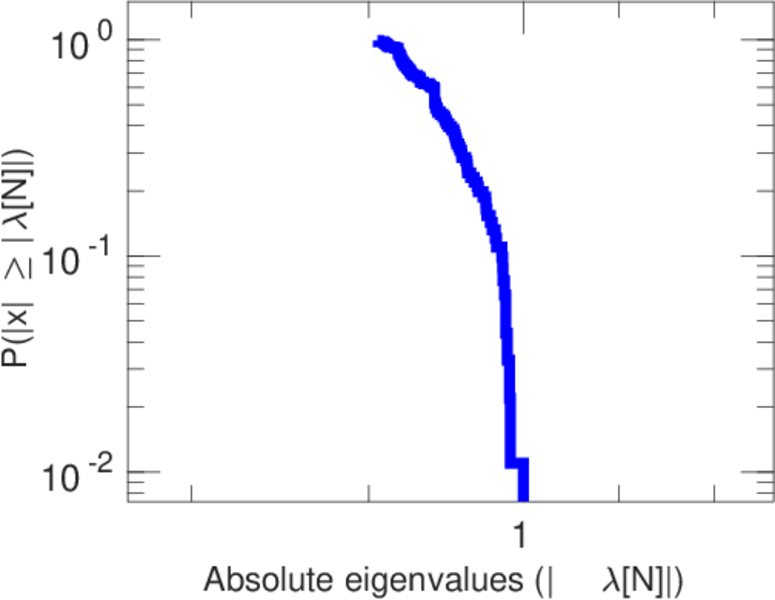
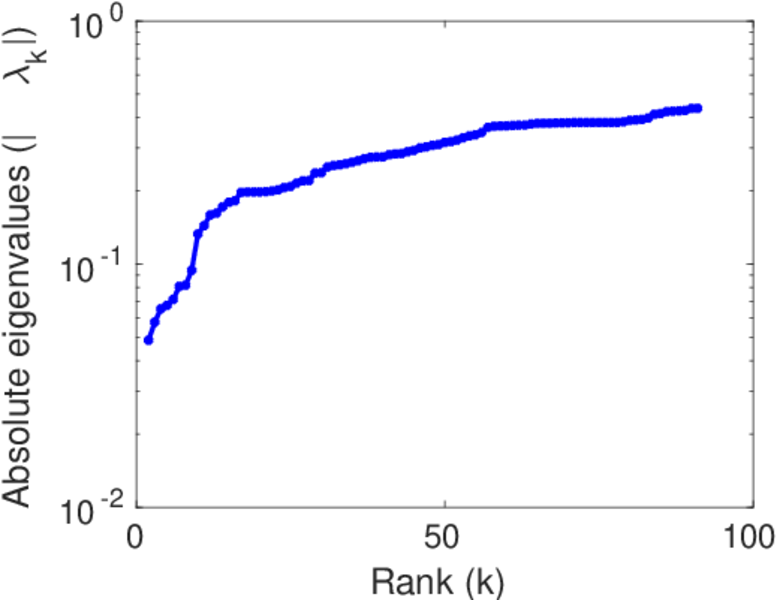
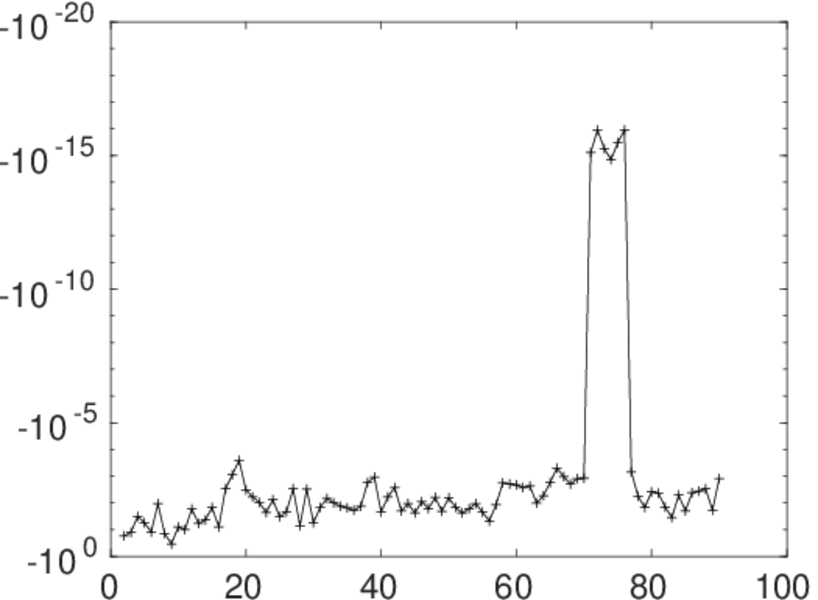
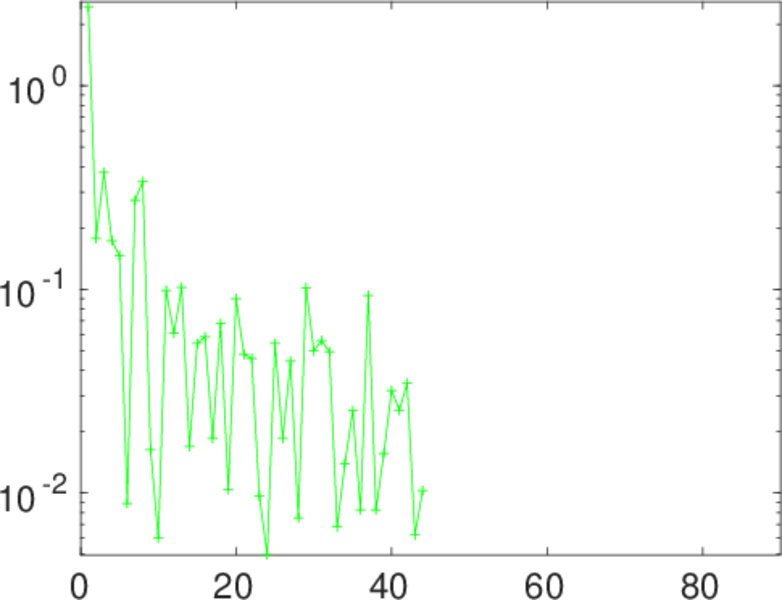
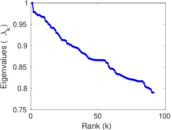
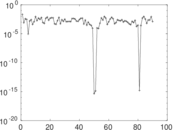
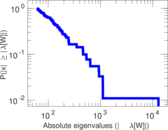
Matrix decompositions plots


Downloads
References
|
[1]
|
Jérôme Kunegis.
KONECT – The Koblenz Network Collection.
In Proc. Int. Conf. on World Wide Web Companion, pages
1343–1350, 2013.
[ http ]
|
|
[2]
|
Wikimedia Foundation.
Wikimedia downloads.
http://dumps.wikimedia.org/, January 2010.
|
 KONECT ‣ Networks ‣
Buy Me a Coffee
KONECT ‣ Networks ‣
Buy Me a Coffee