Wikiquote edits (gl)
This is the bipartite edit network of the Galician Wikiquote. It contains users
and pages from the Galician Wikiquote, connected by edit events. Each edge
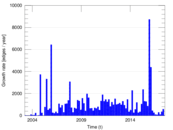
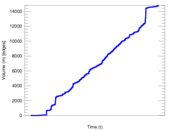
represents an edit. The dataset includes the timestamp of each edit.
Metadata
Statistics
| Size | n = | 3,200
|
| Left size | n1 = | 357
|
| Right size | n2 = | 2,843
|
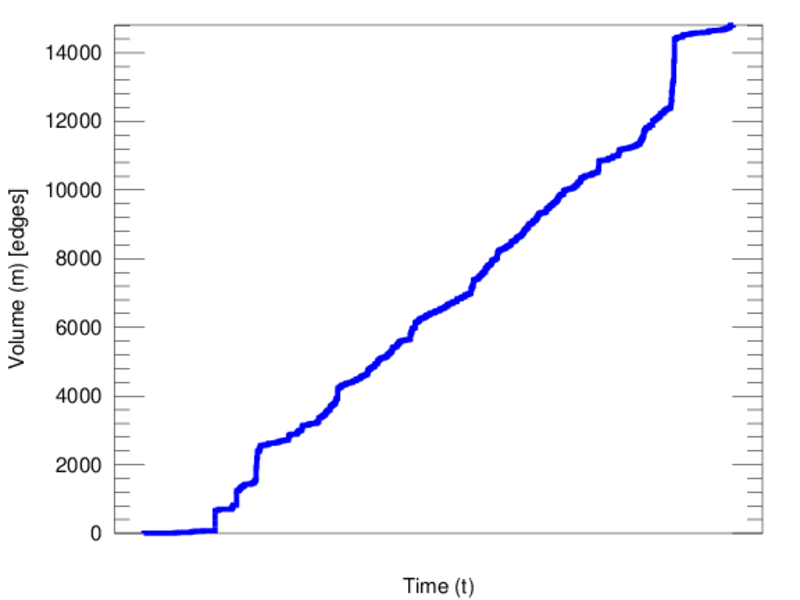
| Volume | m = | 14,807
|
| Unique edge count | m̿ = | 7,648
|
| Wedge count | s = | 1,149,025
|
| Claw count | z = | 191,162,195
|
| Cross count | x = | 28,625,472,005
|
| Square count | q = | 528,863
|
| 4-Tour count | T4 = | 8,847,932
|
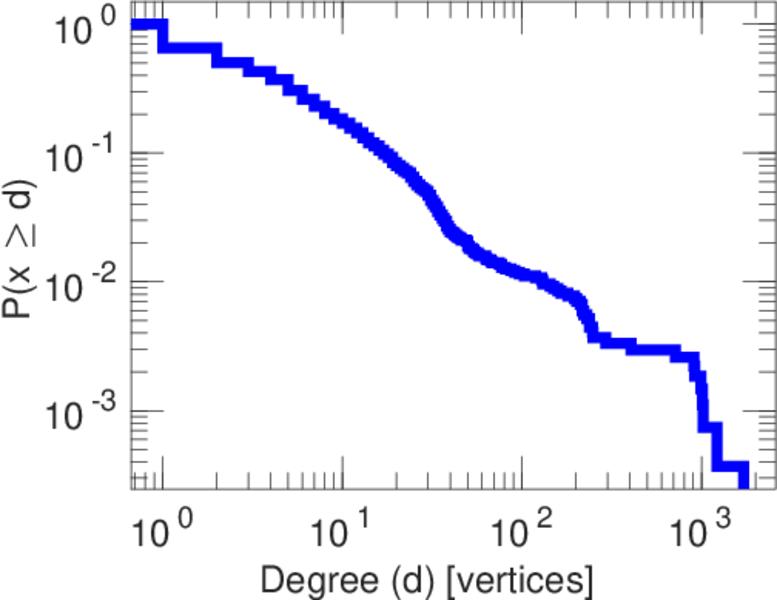
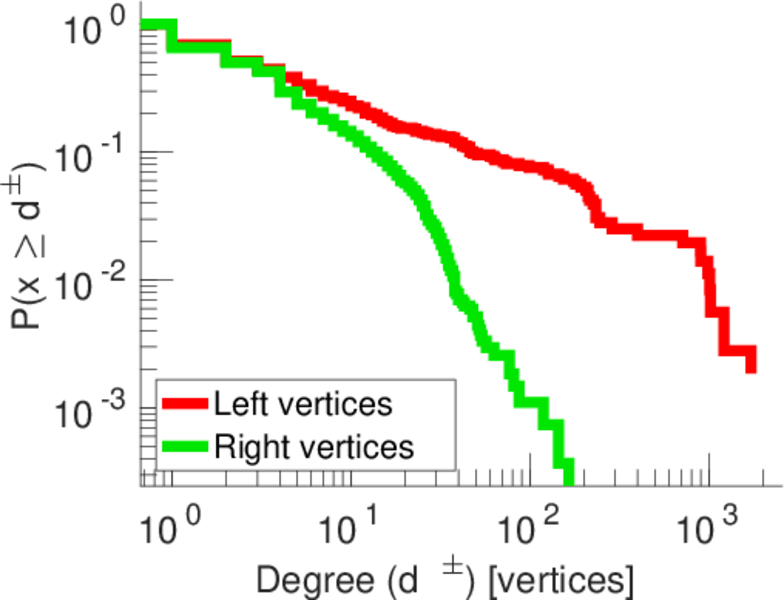
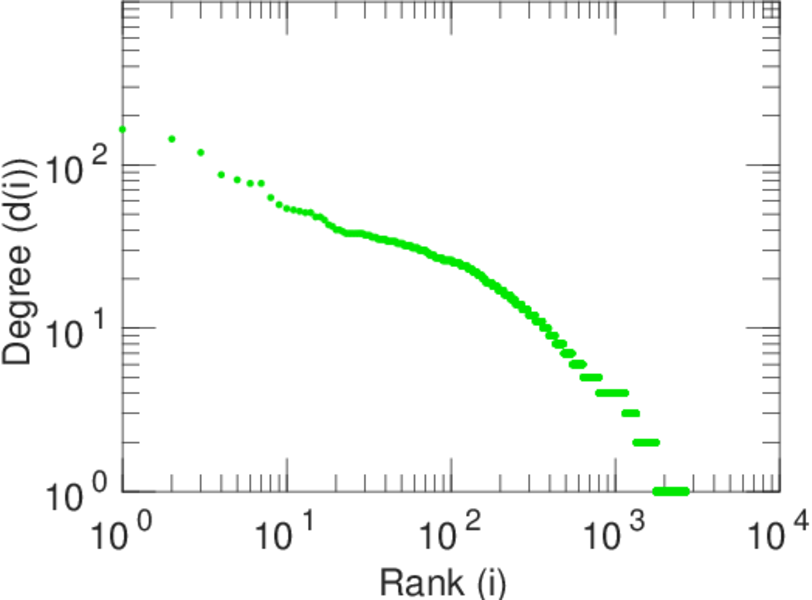
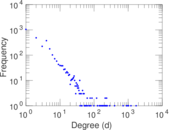
| Maximum degree | dmax = | 1,716
|
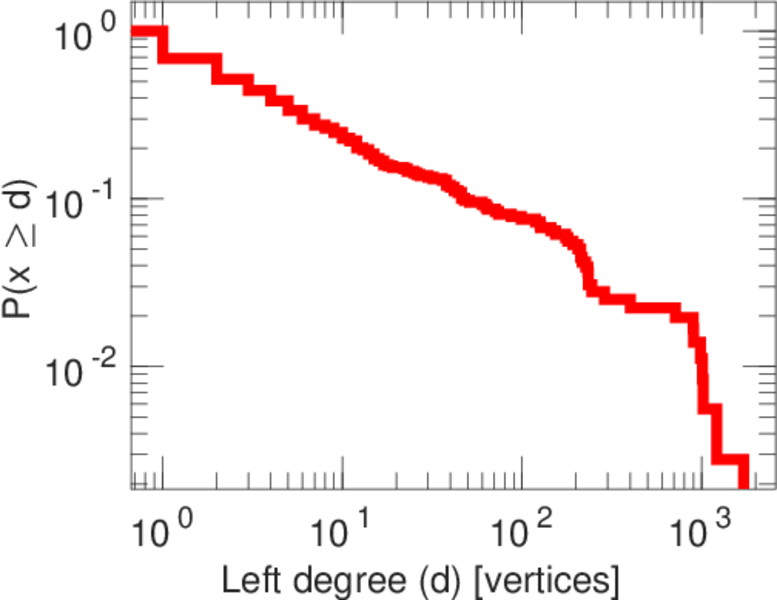
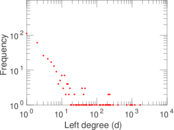
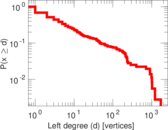
| Maximum left degree | d1max = | 1,716
|
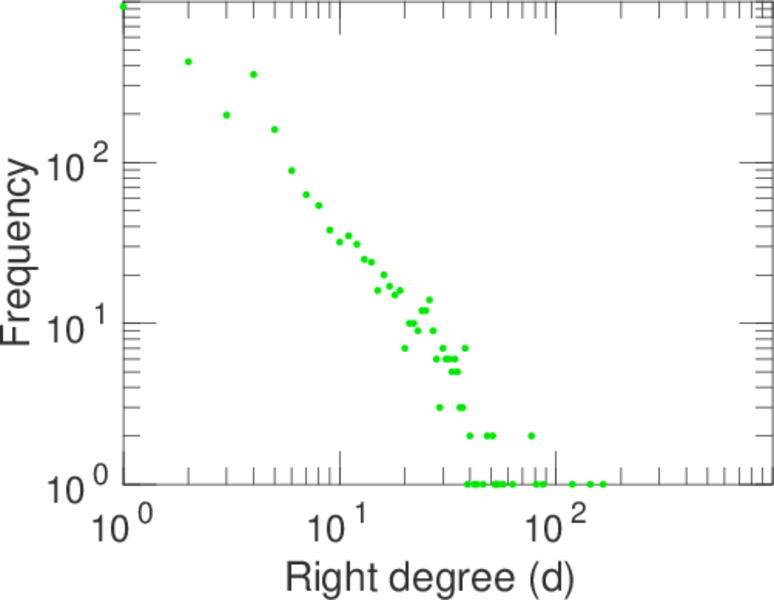
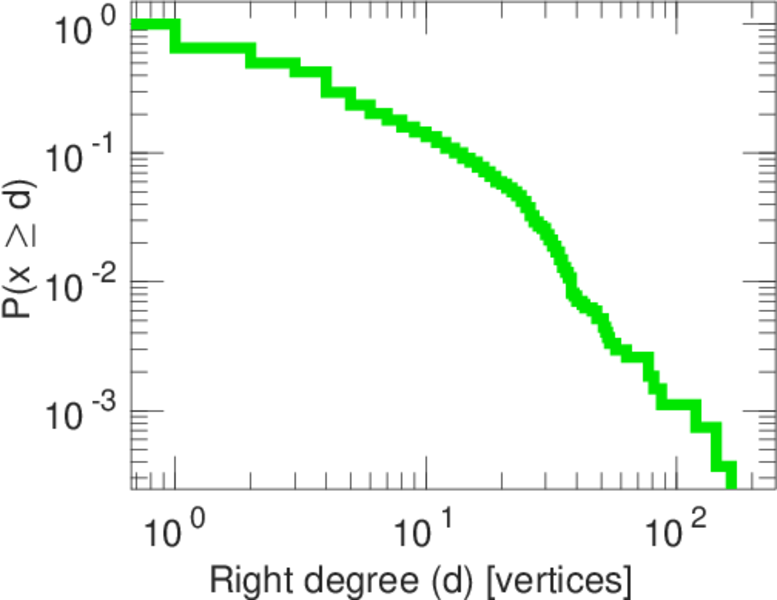
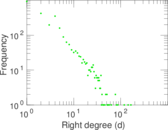
| Maximum right degree | d2max = | 165
|
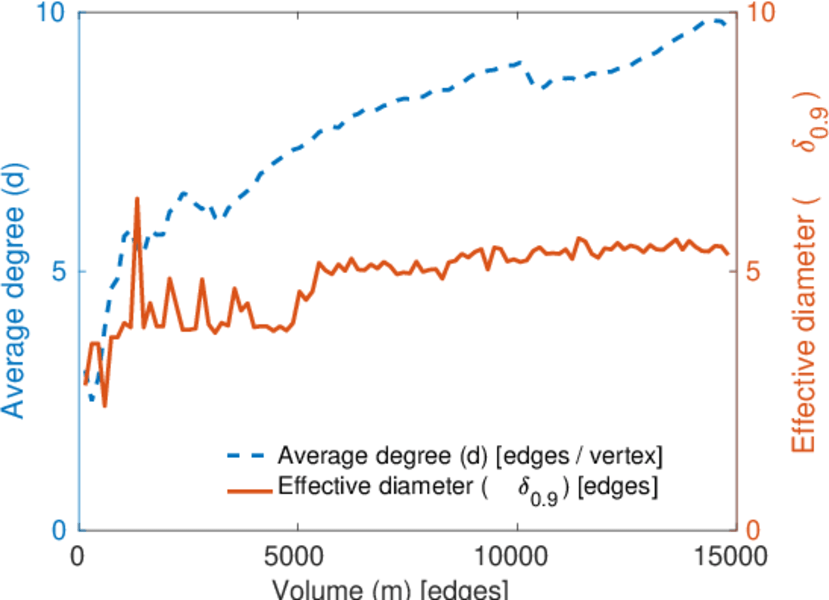
| Average degree | d = | 9.254 37
|
| Average left degree | d1 = | 41.476 2
|
| Average right degree | d2 = | 5.208 23
|
| Fill | p = | 0.007 535 34
|
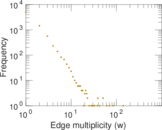
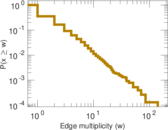
| Average edge multiplicity | m̃ = | 1.936 06
|
| Size of LCC | N = | 2,826
|
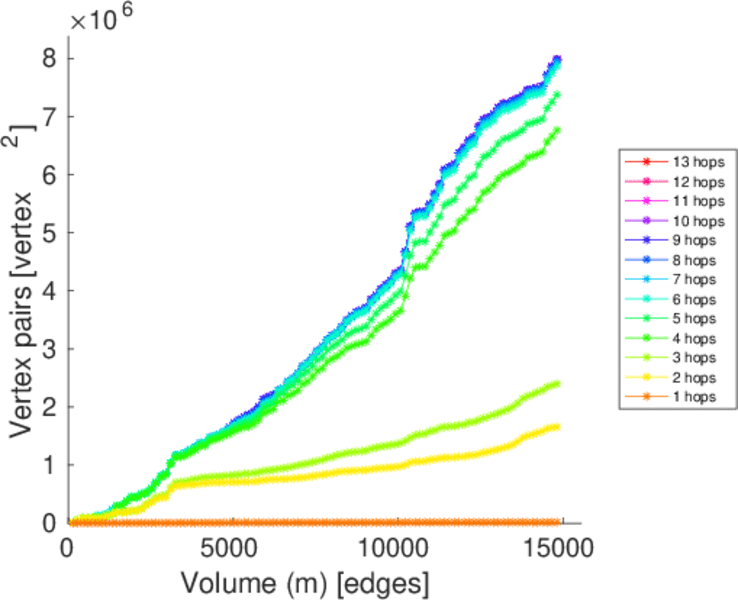
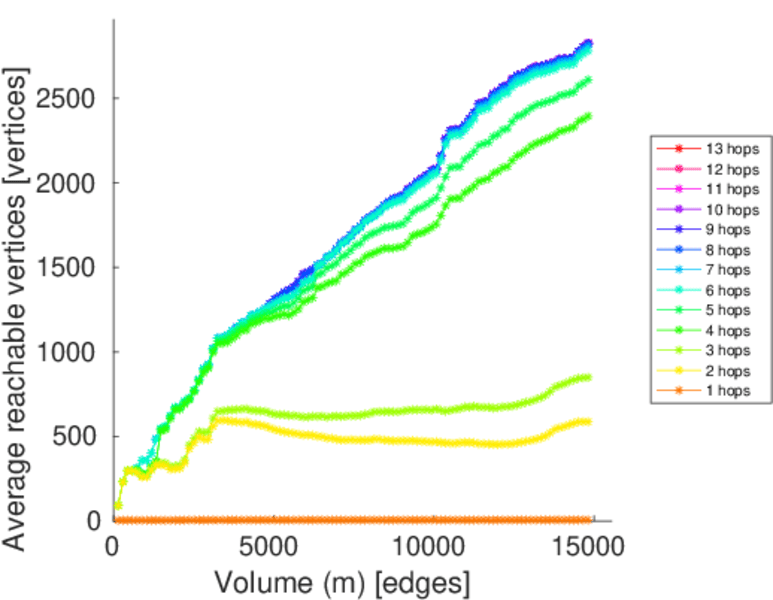
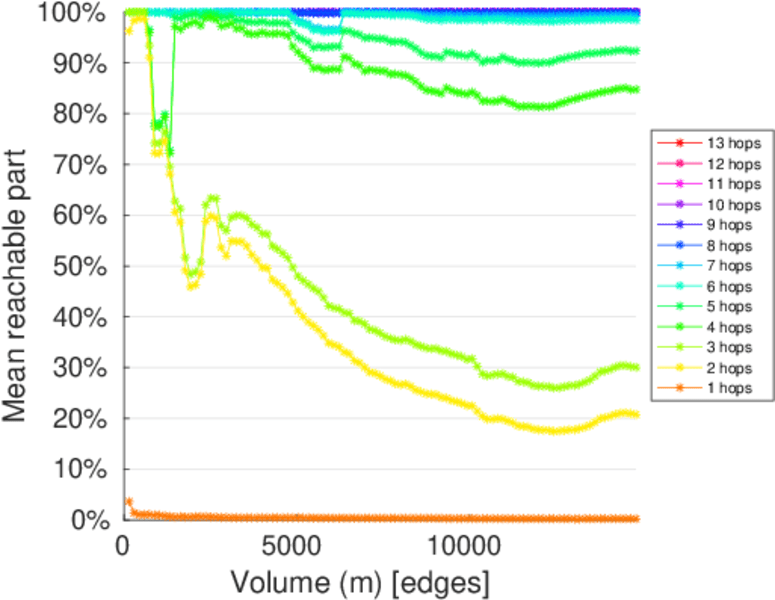
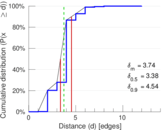
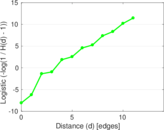
| Diameter | δ = | 13
|
| 50-Percentile effective diameter | δ0.5 = | 3.375 41
|
| 90-Percentile effective diameter | δ0.9 = | 4.544 32
|
| Median distance | δM = | 4
|
| Mean distance | δm = | 3.737 41
|
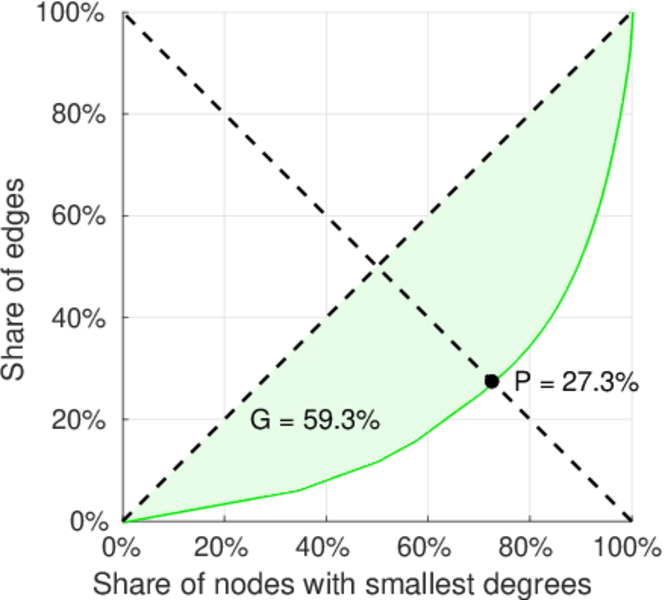
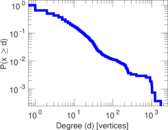
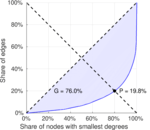
| Gini coefficient | G = | 0.768 769
|
| Balanced inequality ratio | P = | 0.196 934
|
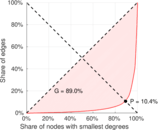
| Left balanced inequality ratio | P1 = | 0.104 410
|
| Right balanced inequality ratio | P2 = | 0.273 249
|
| Relative edge distribution entropy | Her = | 0.800 801
|
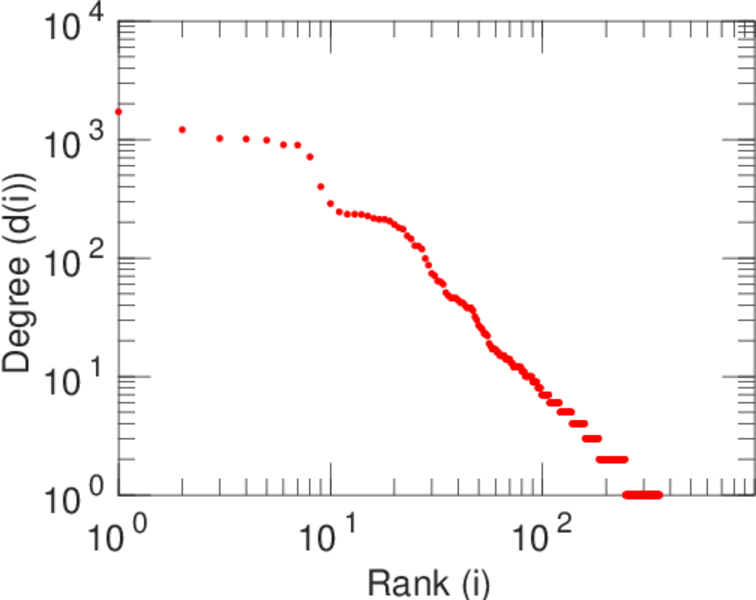
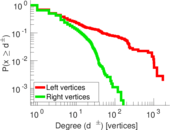
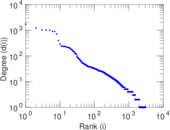
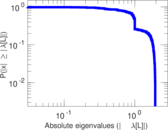
| Power law exponent | γ = | 2.333 90
|
| Tail power law exponent | γt = | 2.171 00
|
| Tail power law exponent with p | γ3 = | 2.171 00
|
| p-value | p = | 0.000 00
|
| Left tail power law exponent with p | γ3,1 = | 1.601 00
|
| Left p-value | p1 = | 0.617 000
|
| Right tail power law exponent with p | γ3,2 = | 8.191 00
|
| Right p-value | p2 = | 0.548 000
|
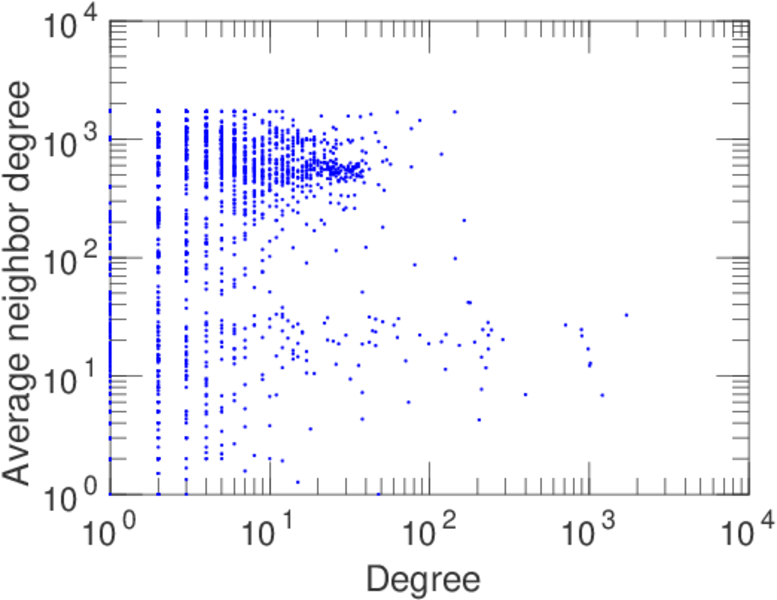
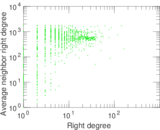
| Degree assortativity | ρ = | −0.297 093
|
| Degree assortativity p-value | pρ = | 1.164 06 × 10−155
|
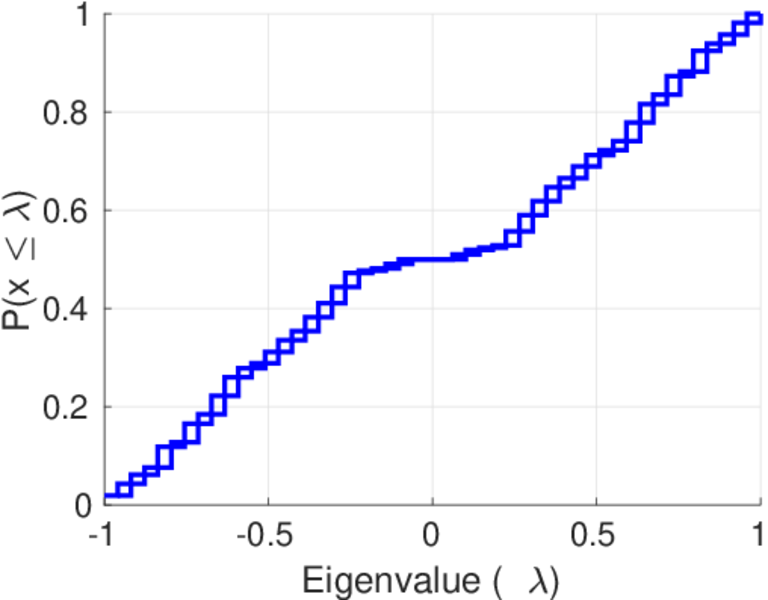
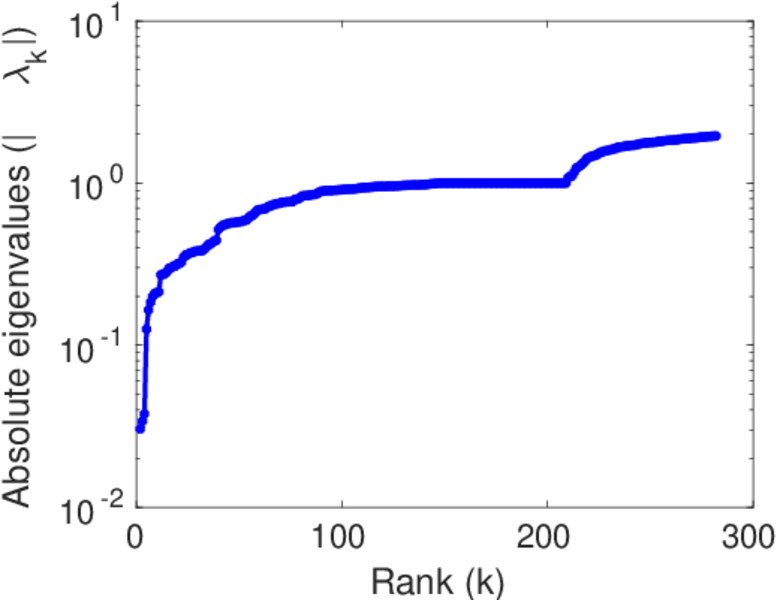
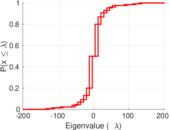
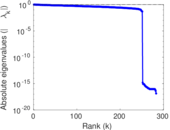
| Spectral norm | α = | 203.540
|
| Algebraic connectivity | a = | 0.030 424 2
|
| Spectral separation | |λ1[A] / λ2[A]| = | 1.988 43
|
| Controllability | C = | 2,405
|
| Relative controllability | Cr = | 0.786 719
|
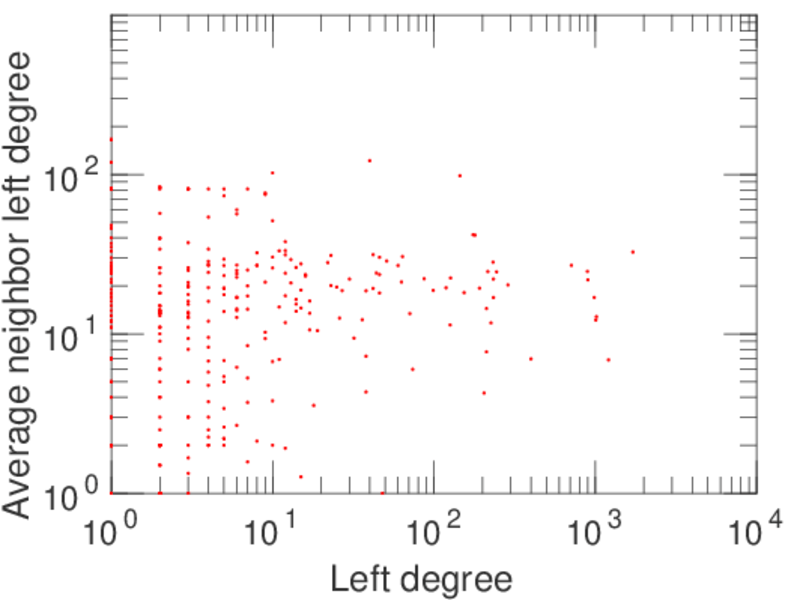
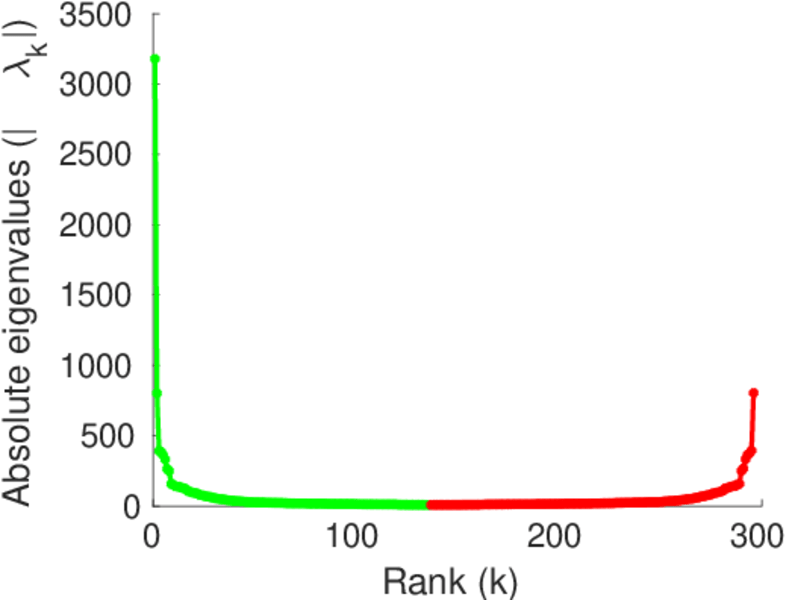
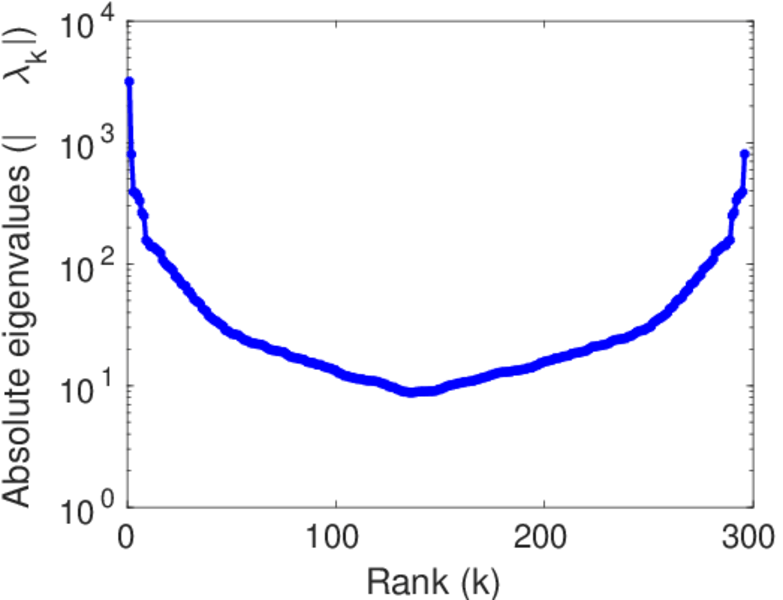
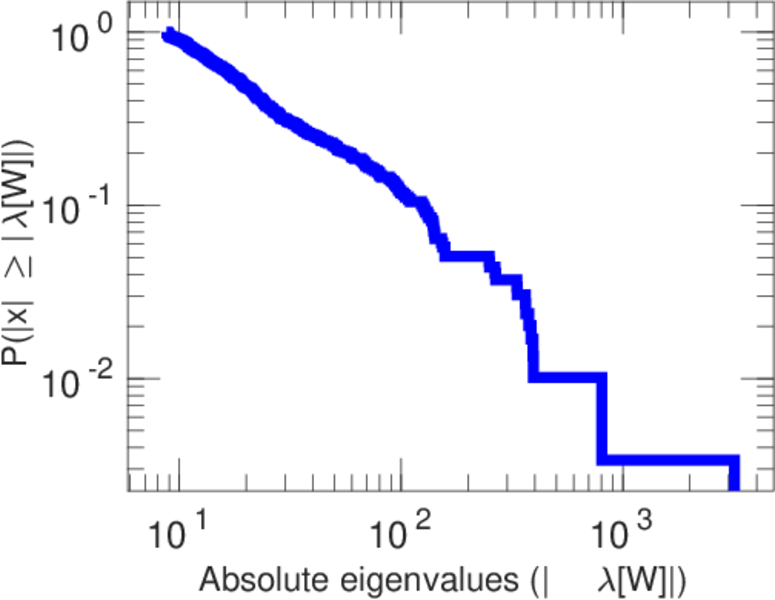
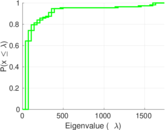
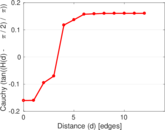
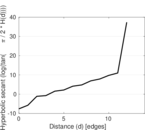
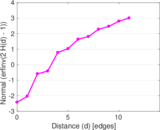
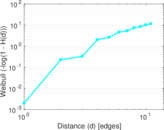
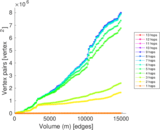
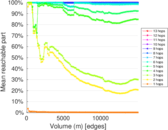
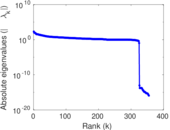
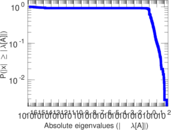
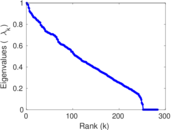
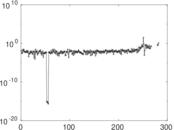
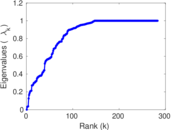
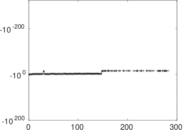
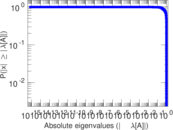
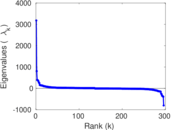
Plots
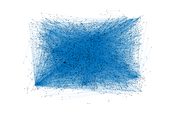


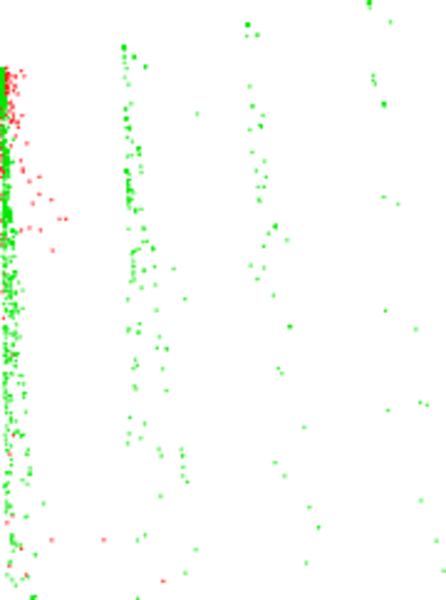
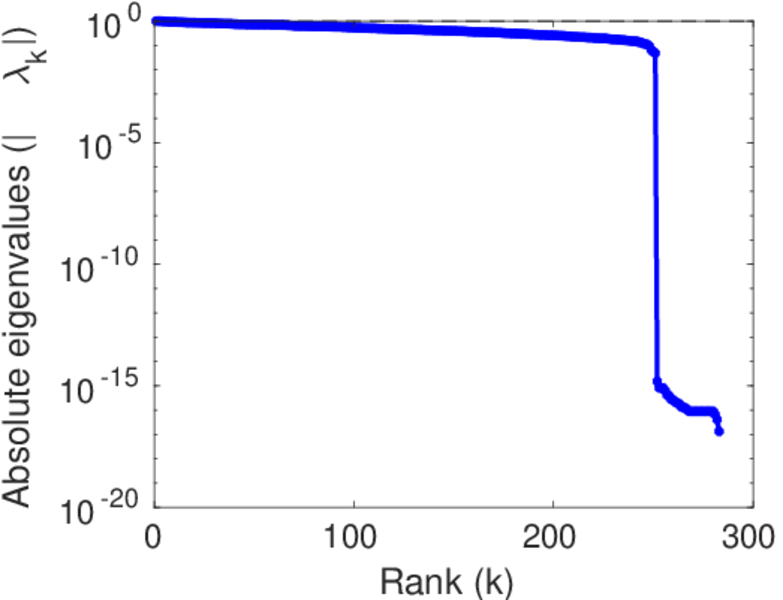
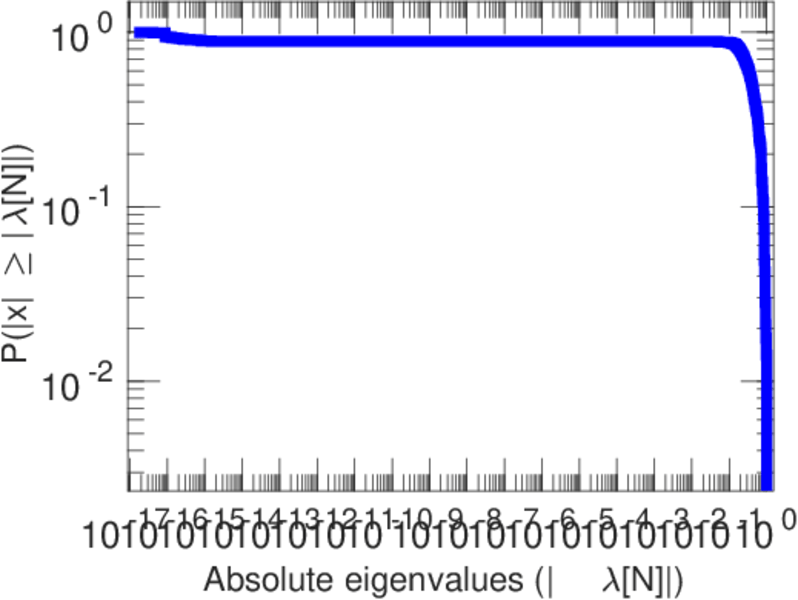
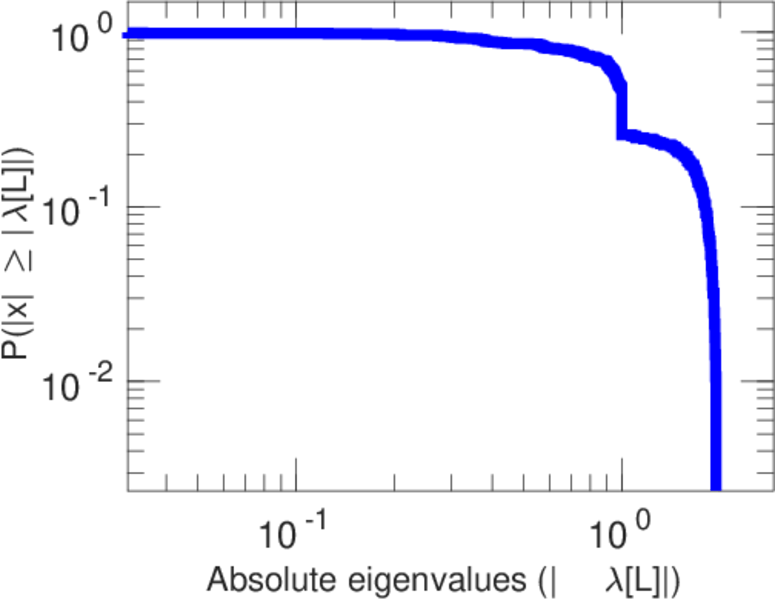
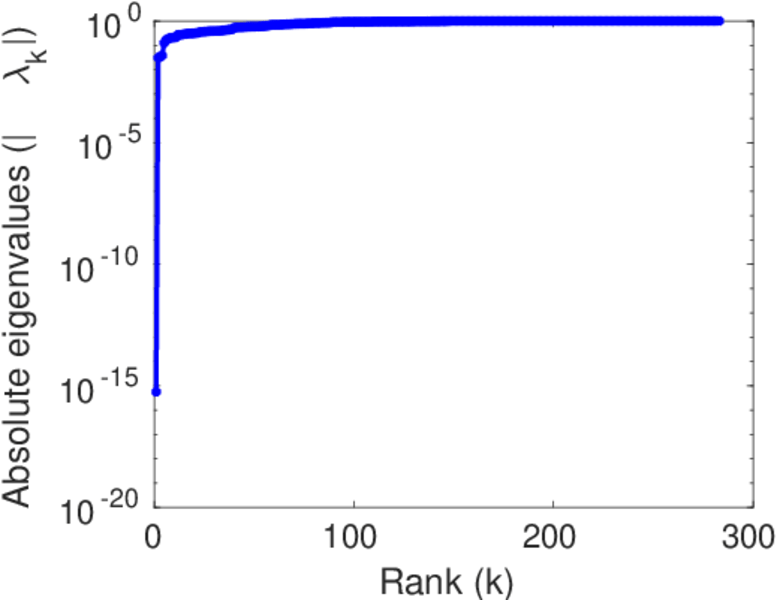
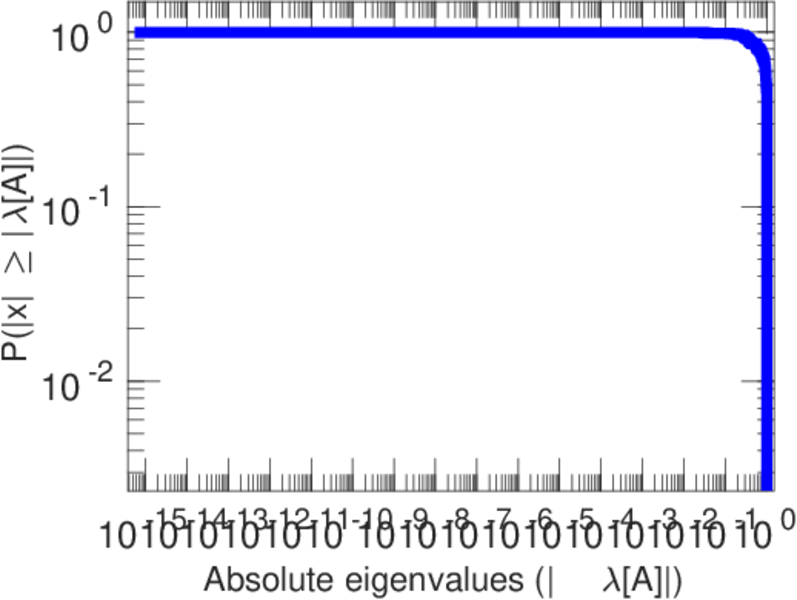
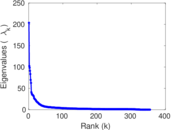
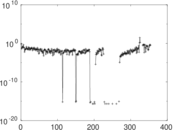
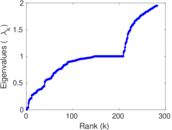
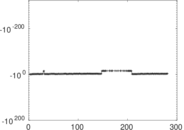
Matrix decompositions plots


Downloads
References
|
[1]
|
Jérôme Kunegis.
KONECT – The Koblenz Network Collection.
In Proc. Int. Conf. on World Wide Web Companion, pages
1343–1350, 2013.
[ http ]
|
|
[2]
|
Wikimedia Foundation.
Wikimedia downloads.
http://dumps.wikimedia.org/, January 2010.
|
 KONECT ‣ Networks ‣
Buy Me a Coffee
KONECT ‣ Networks ‣
Buy Me a Coffee