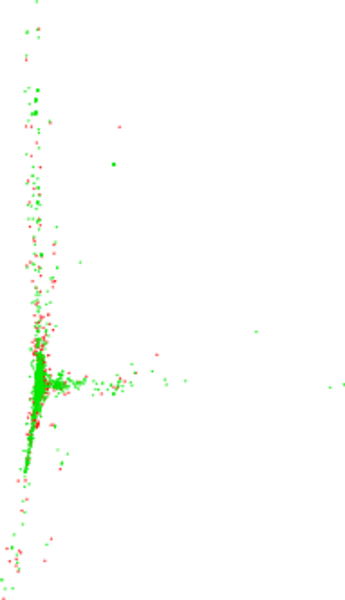
Wikipedia edits (gn)
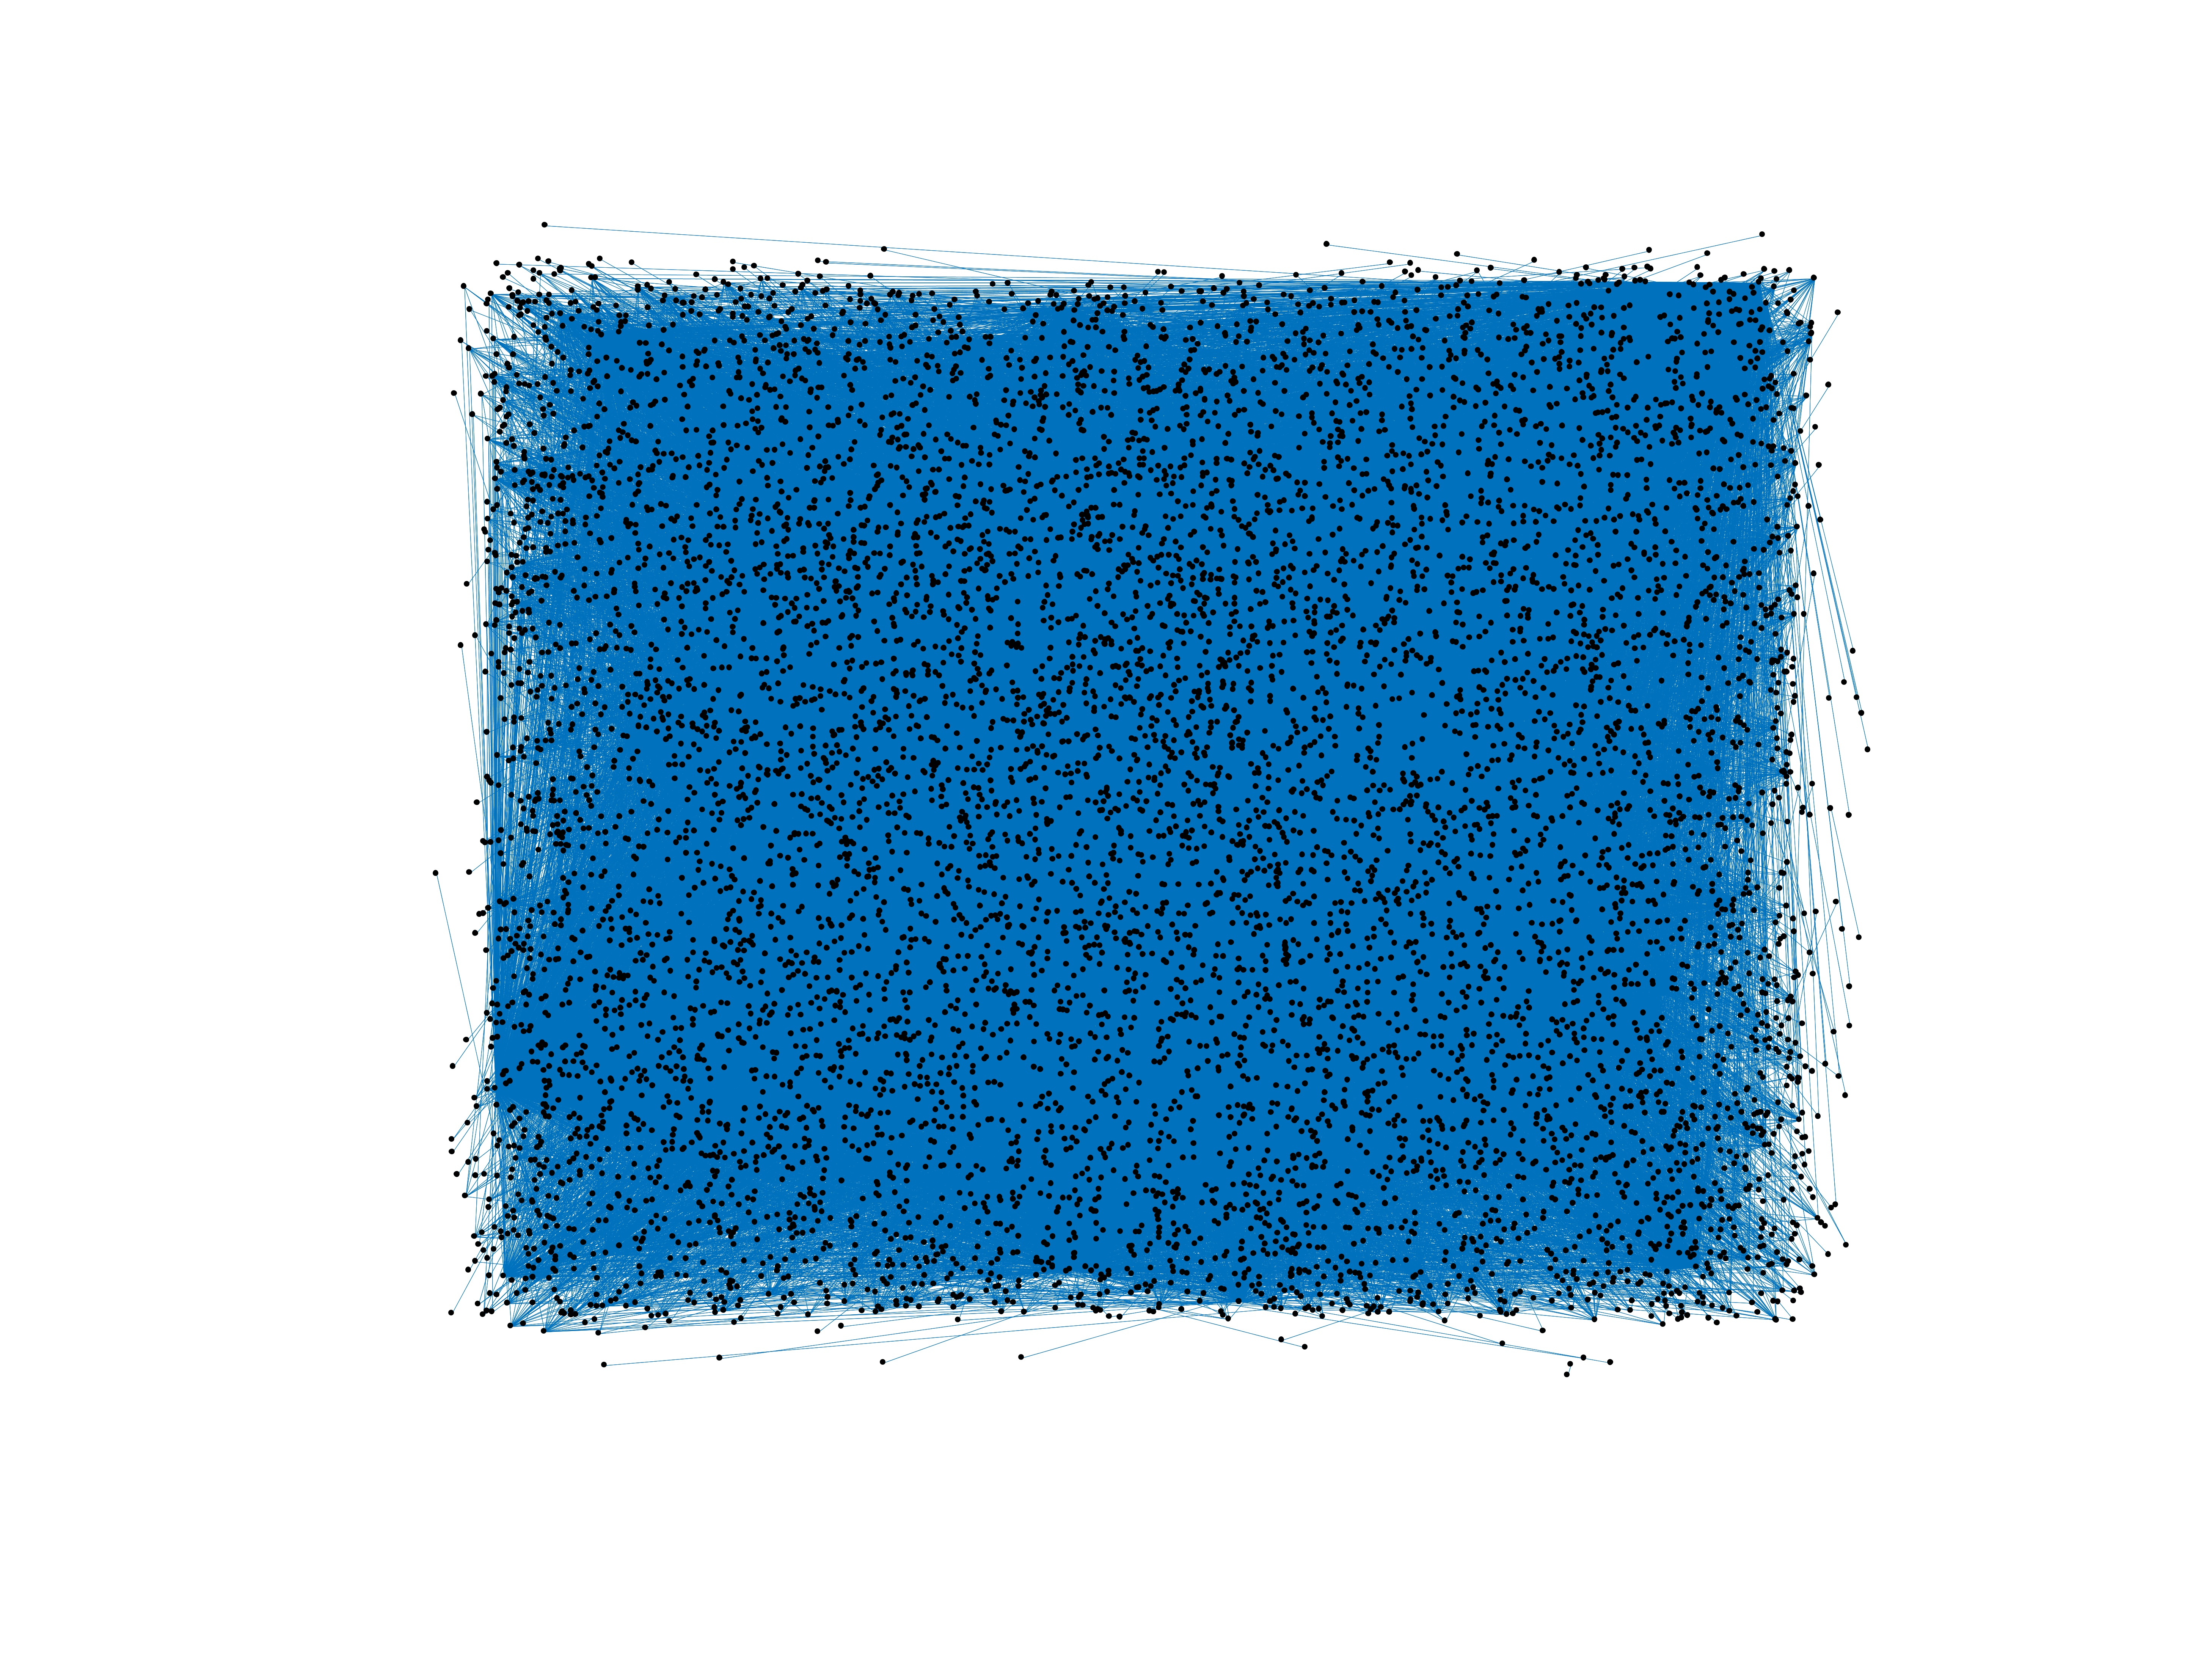
This is the bipartite edit network of the Guarani Wikipedia. It contains users
and pages from the Guarani Wikipedia, connected by edit events. Each edge
represents an edit. The dataset includes the timestamp of each edit.
Metadata
Statistics
| Size | n = | 8,568
|
| Left size | n1 = | 1,063
|
| Right size | n2 = | 7,505
|
| Volume | m = | 91,541
|
| Unique edge count | m̿ = | 42,664
|
| Wedge count | s = | 25,335,887
|
| Claw count | z = | 18,323,921,216
|
| Cross count | x = | 12,610,534,328,234
|
| Square count | q = | 63,075,790
|
| 4-Tour count | T4 = | 606,080,032
|
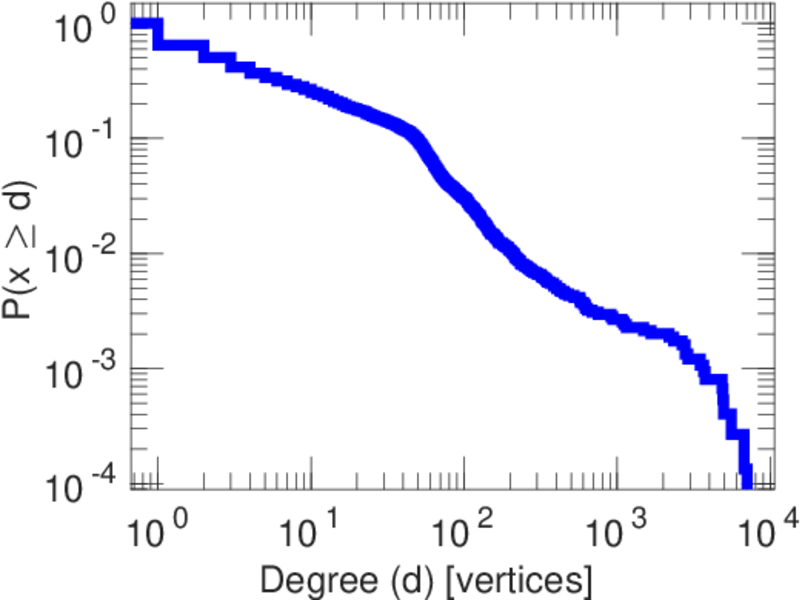
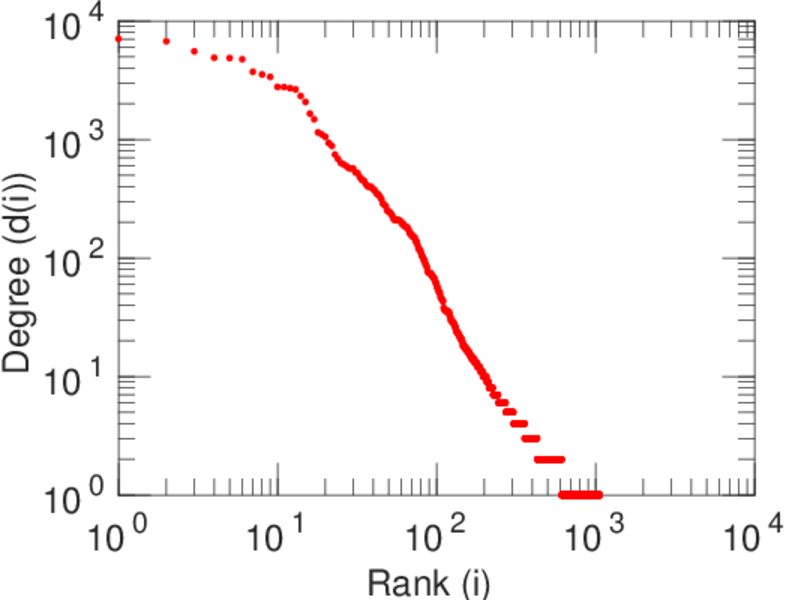
| Maximum degree | dmax = | 7,068
|
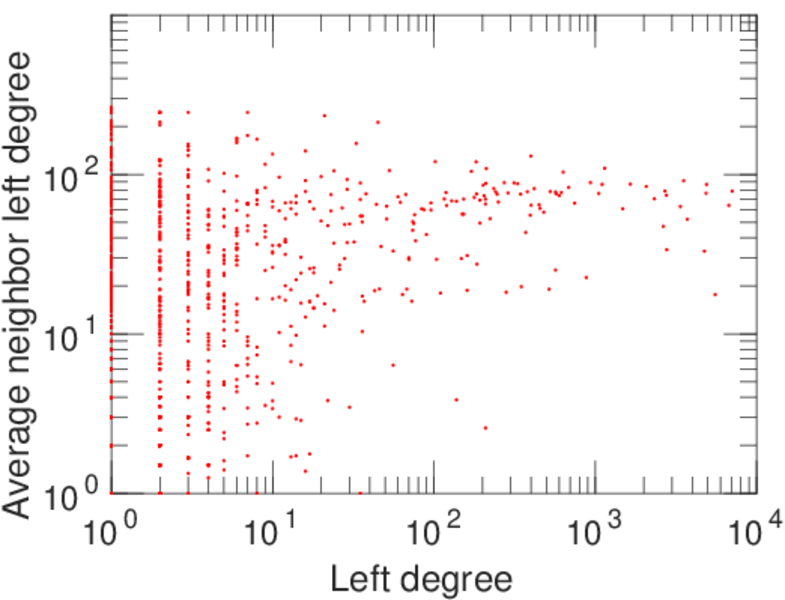
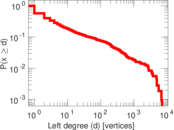
| Maximum left degree | d1max = | 7,068
|
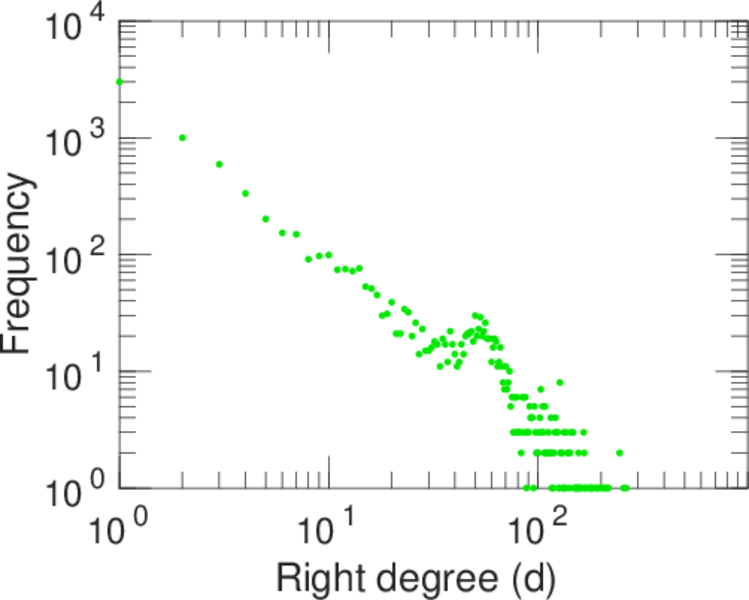
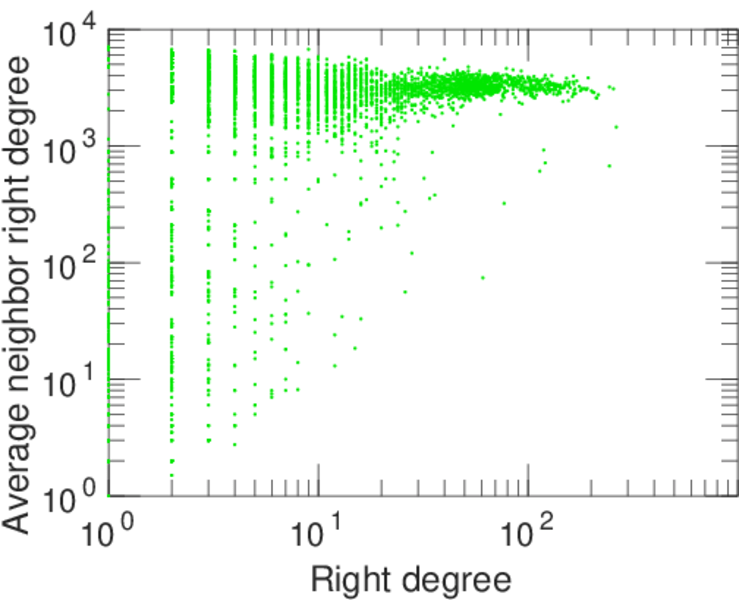
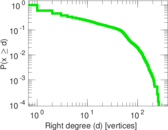
| Maximum right degree | d2max = | 264
|
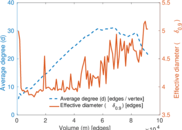
| Average degree | d = | 21.368 1
|
| Average left degree | d1 = | 86.115 7
|
| Average right degree | d2 = | 12.197 3
|
| Fill | p = | 0.005 347 83
|
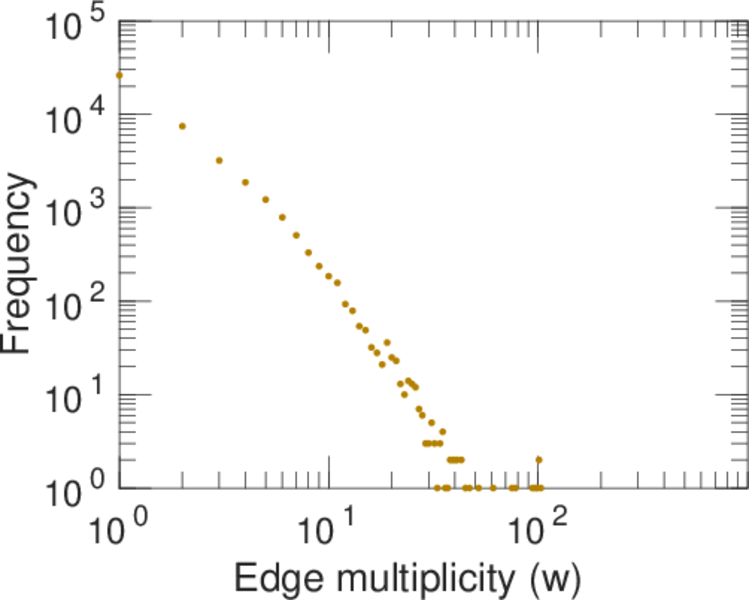
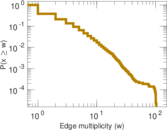
| Average edge multiplicity | m̃ = | 2.145 63
|
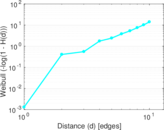
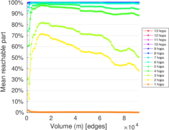
| Size of LCC | N = | 7,914
|
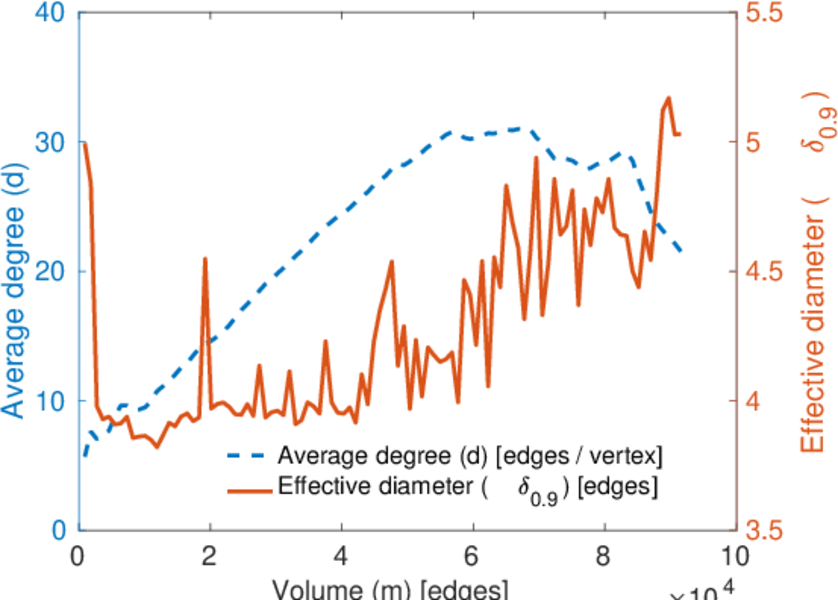
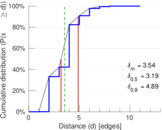
| Diameter | δ = | 12
|
| 50-Percentile effective diameter | δ0.5 = | 3.193 15
|
| 90-Percentile effective diameter | δ0.9 = | 4.891 80
|
| Median distance | δM = | 4
|
| Mean distance | δm = | 3.538 68
|
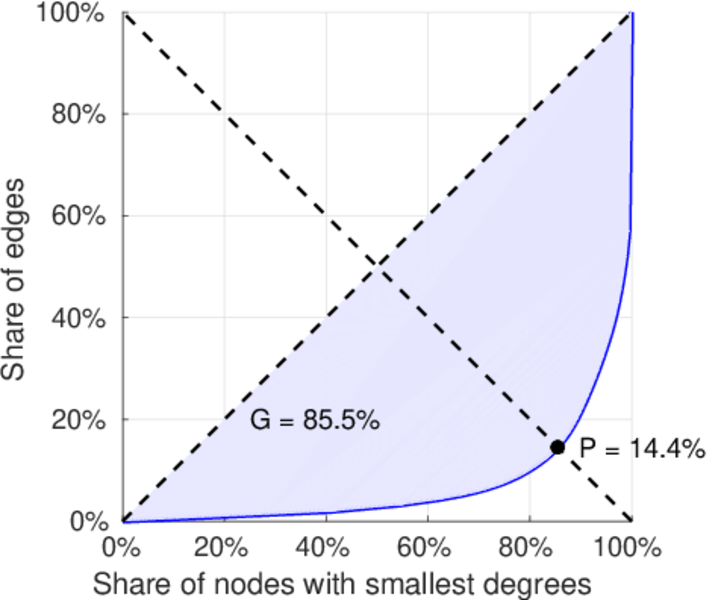
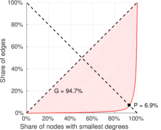
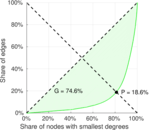
| Gini coefficient | G = | 0.851 937
|
| Balanced inequality ratio | P = | 0.148 185
|
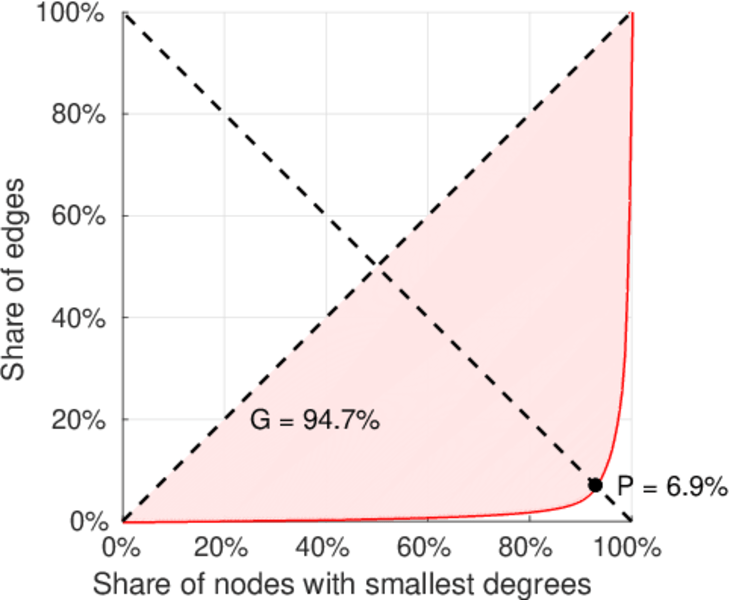
| Left balanced inequality ratio | P1 = | 0.069 225 8
|
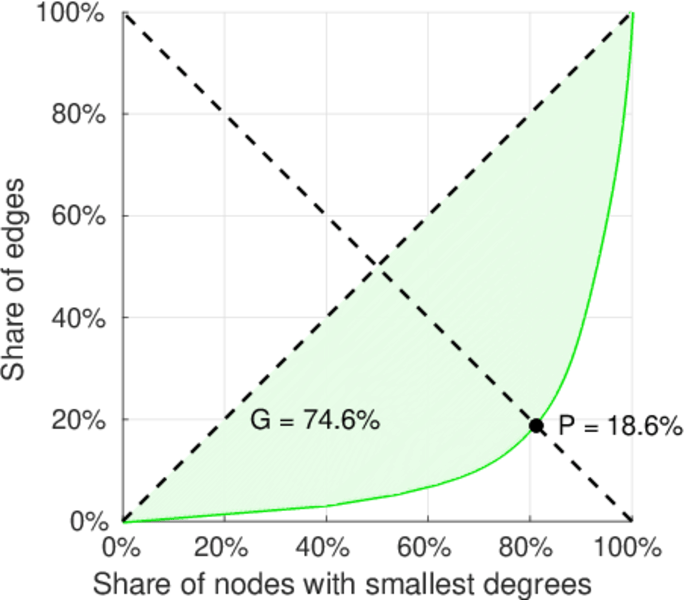
| Right balanced inequality ratio | P2 = | 0.186 157
|
| Relative edge distribution entropy | Her = | 0.765 559
|
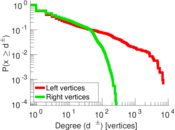
| Power law exponent | γ = | 2.051 69
|
| Tail power law exponent | γt = | 1.701 00
|
| Tail power law exponent with p | γ3 = | 1.701 00
|
| p-value | p = | 0.000 00
|
| Left tail power law exponent with p | γ3,1 = | 1.681 00
|
| Left p-value | p1 = | 0.000 00
|
| Right tail power law exponent with p | γ3,2 = | 5.851 00
|
| Right p-value | p2 = | 0.035 000 0
|
| Degree assortativity | ρ = | −0.356 766
|
| Degree assortativity p-value | pρ = | 0.000 00
|
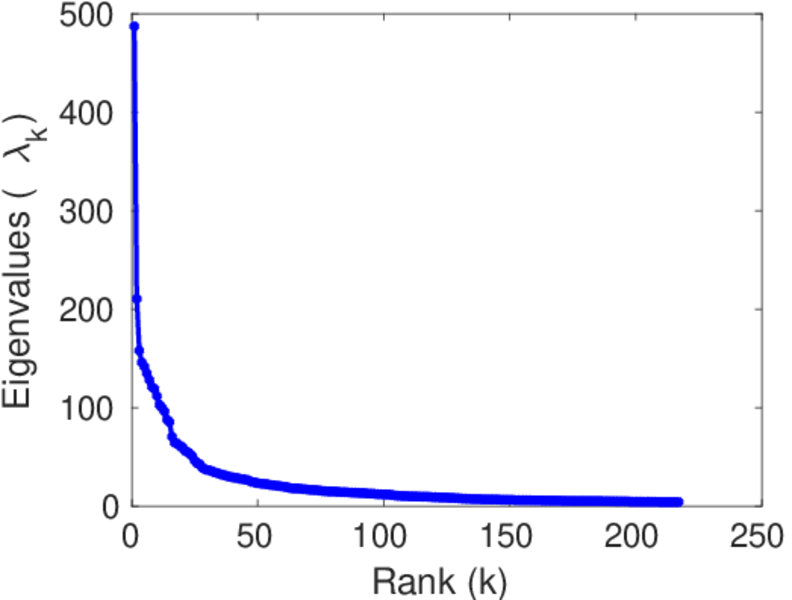
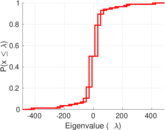
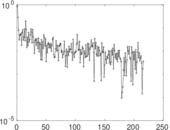
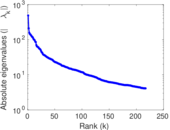
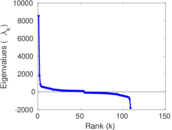
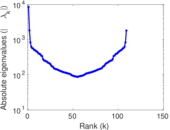
| Spectral norm | α = | 487.089
|
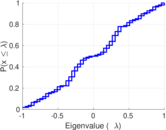
| Algebraic connectivity | a = | 0.049 143 2
|
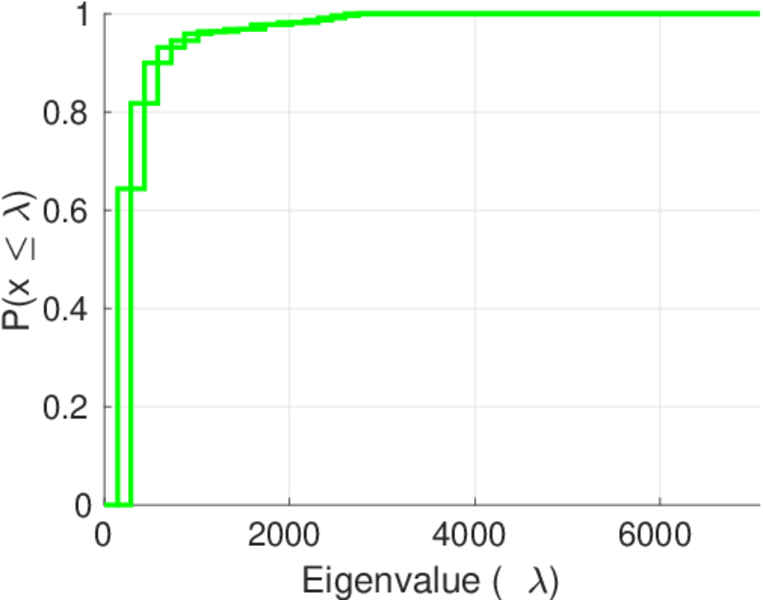
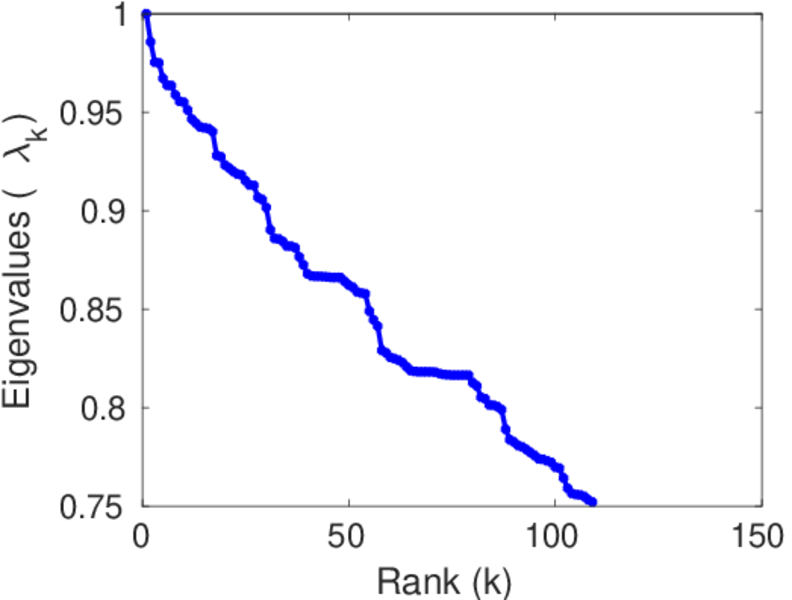
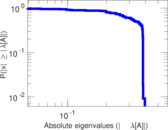
| Spectral separation | |λ1[A] / λ2[A]| = | 2.314 11
|
| Controllability | C = | 6,515
|
| Relative controllability | Cr = | 0.766 200
|
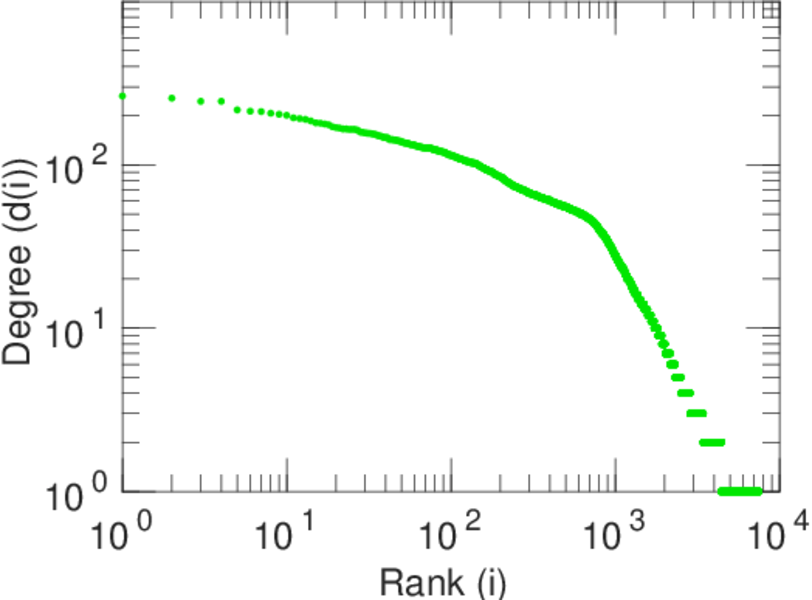
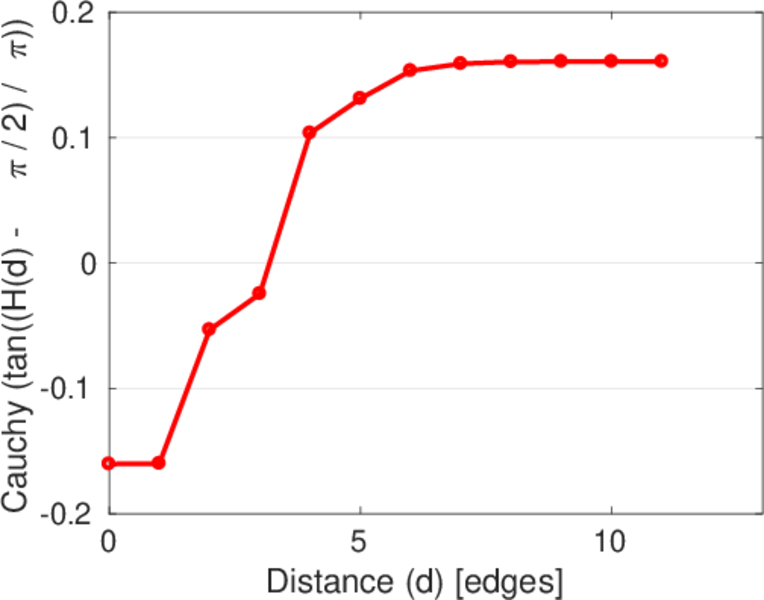
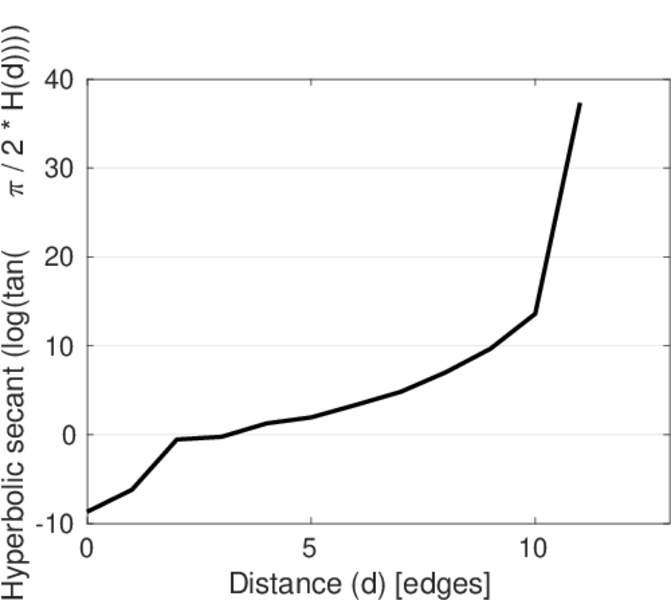
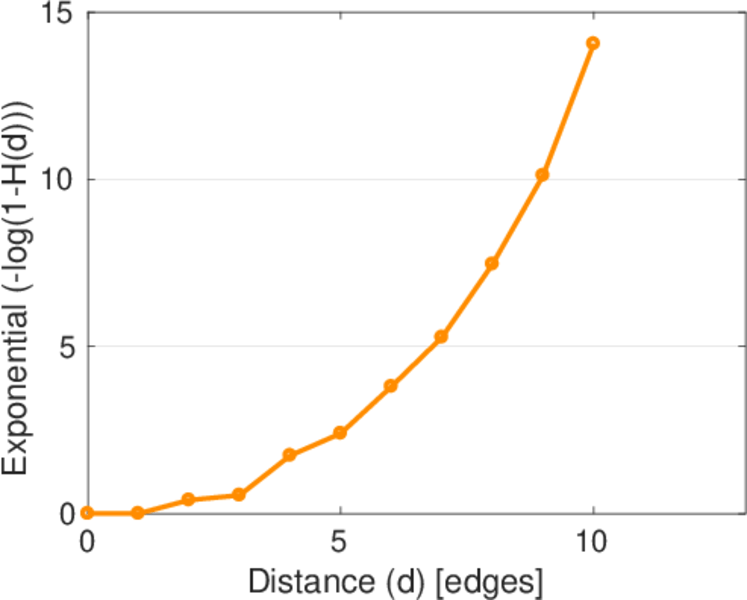
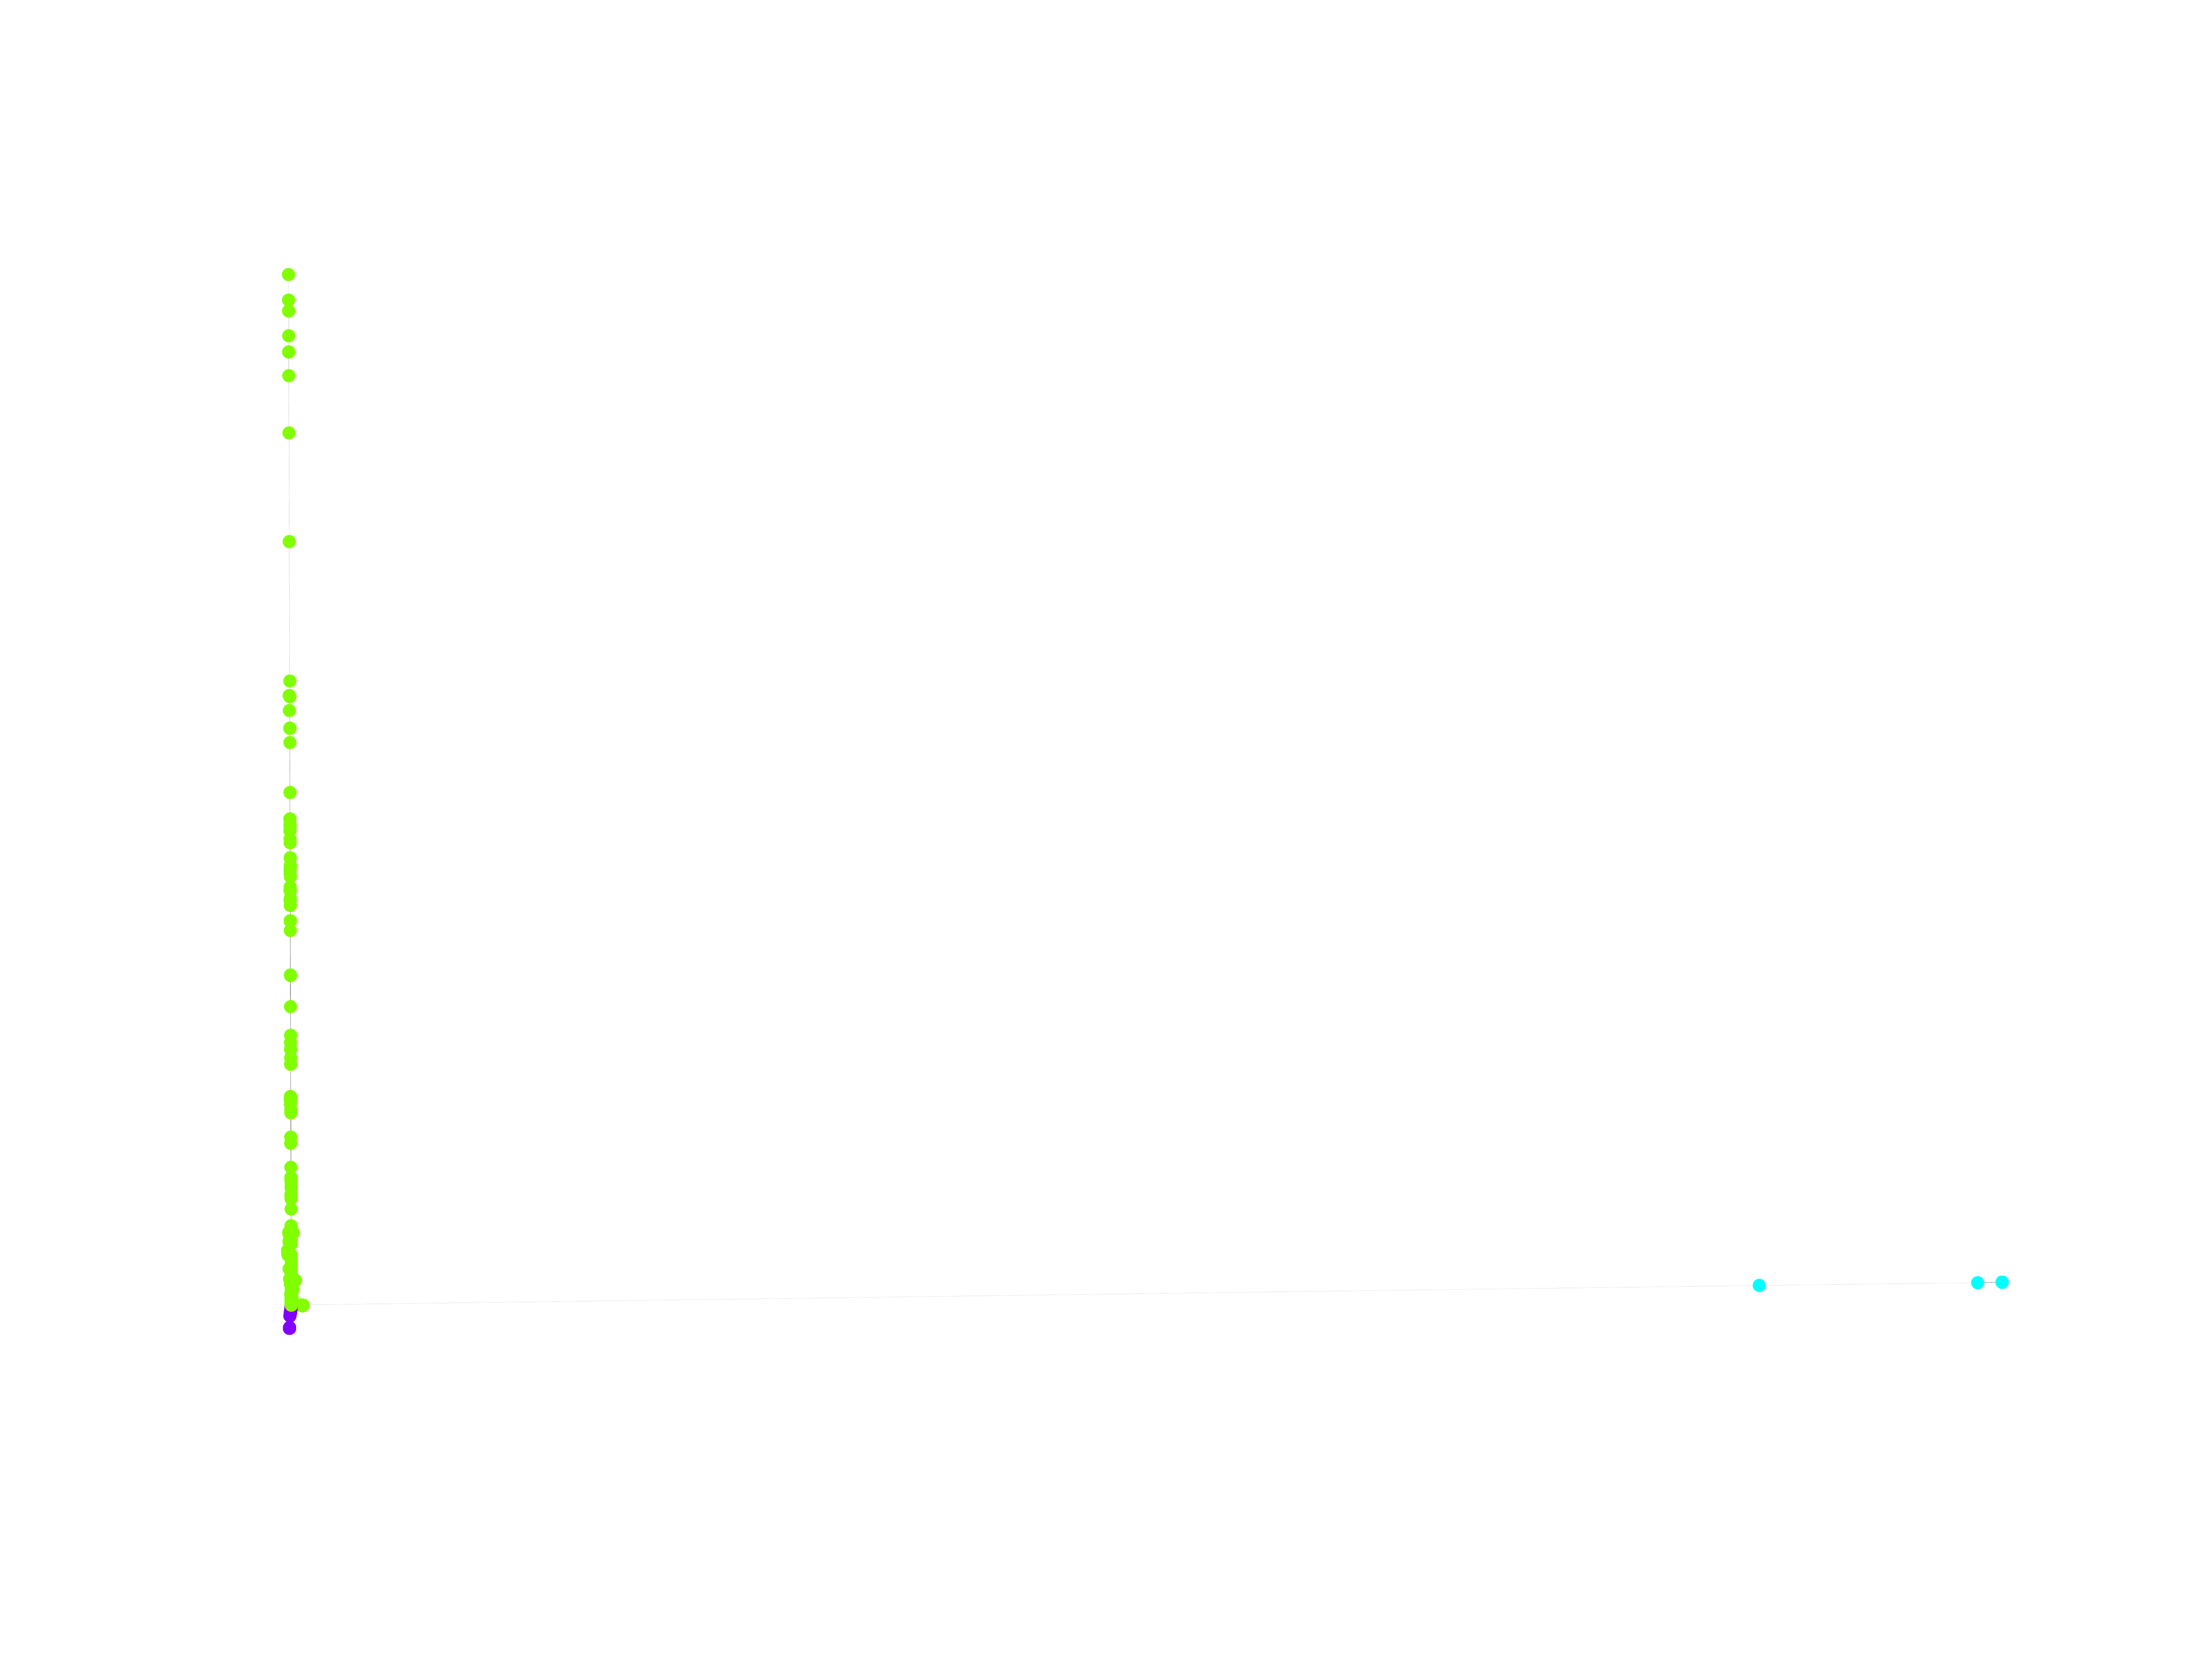
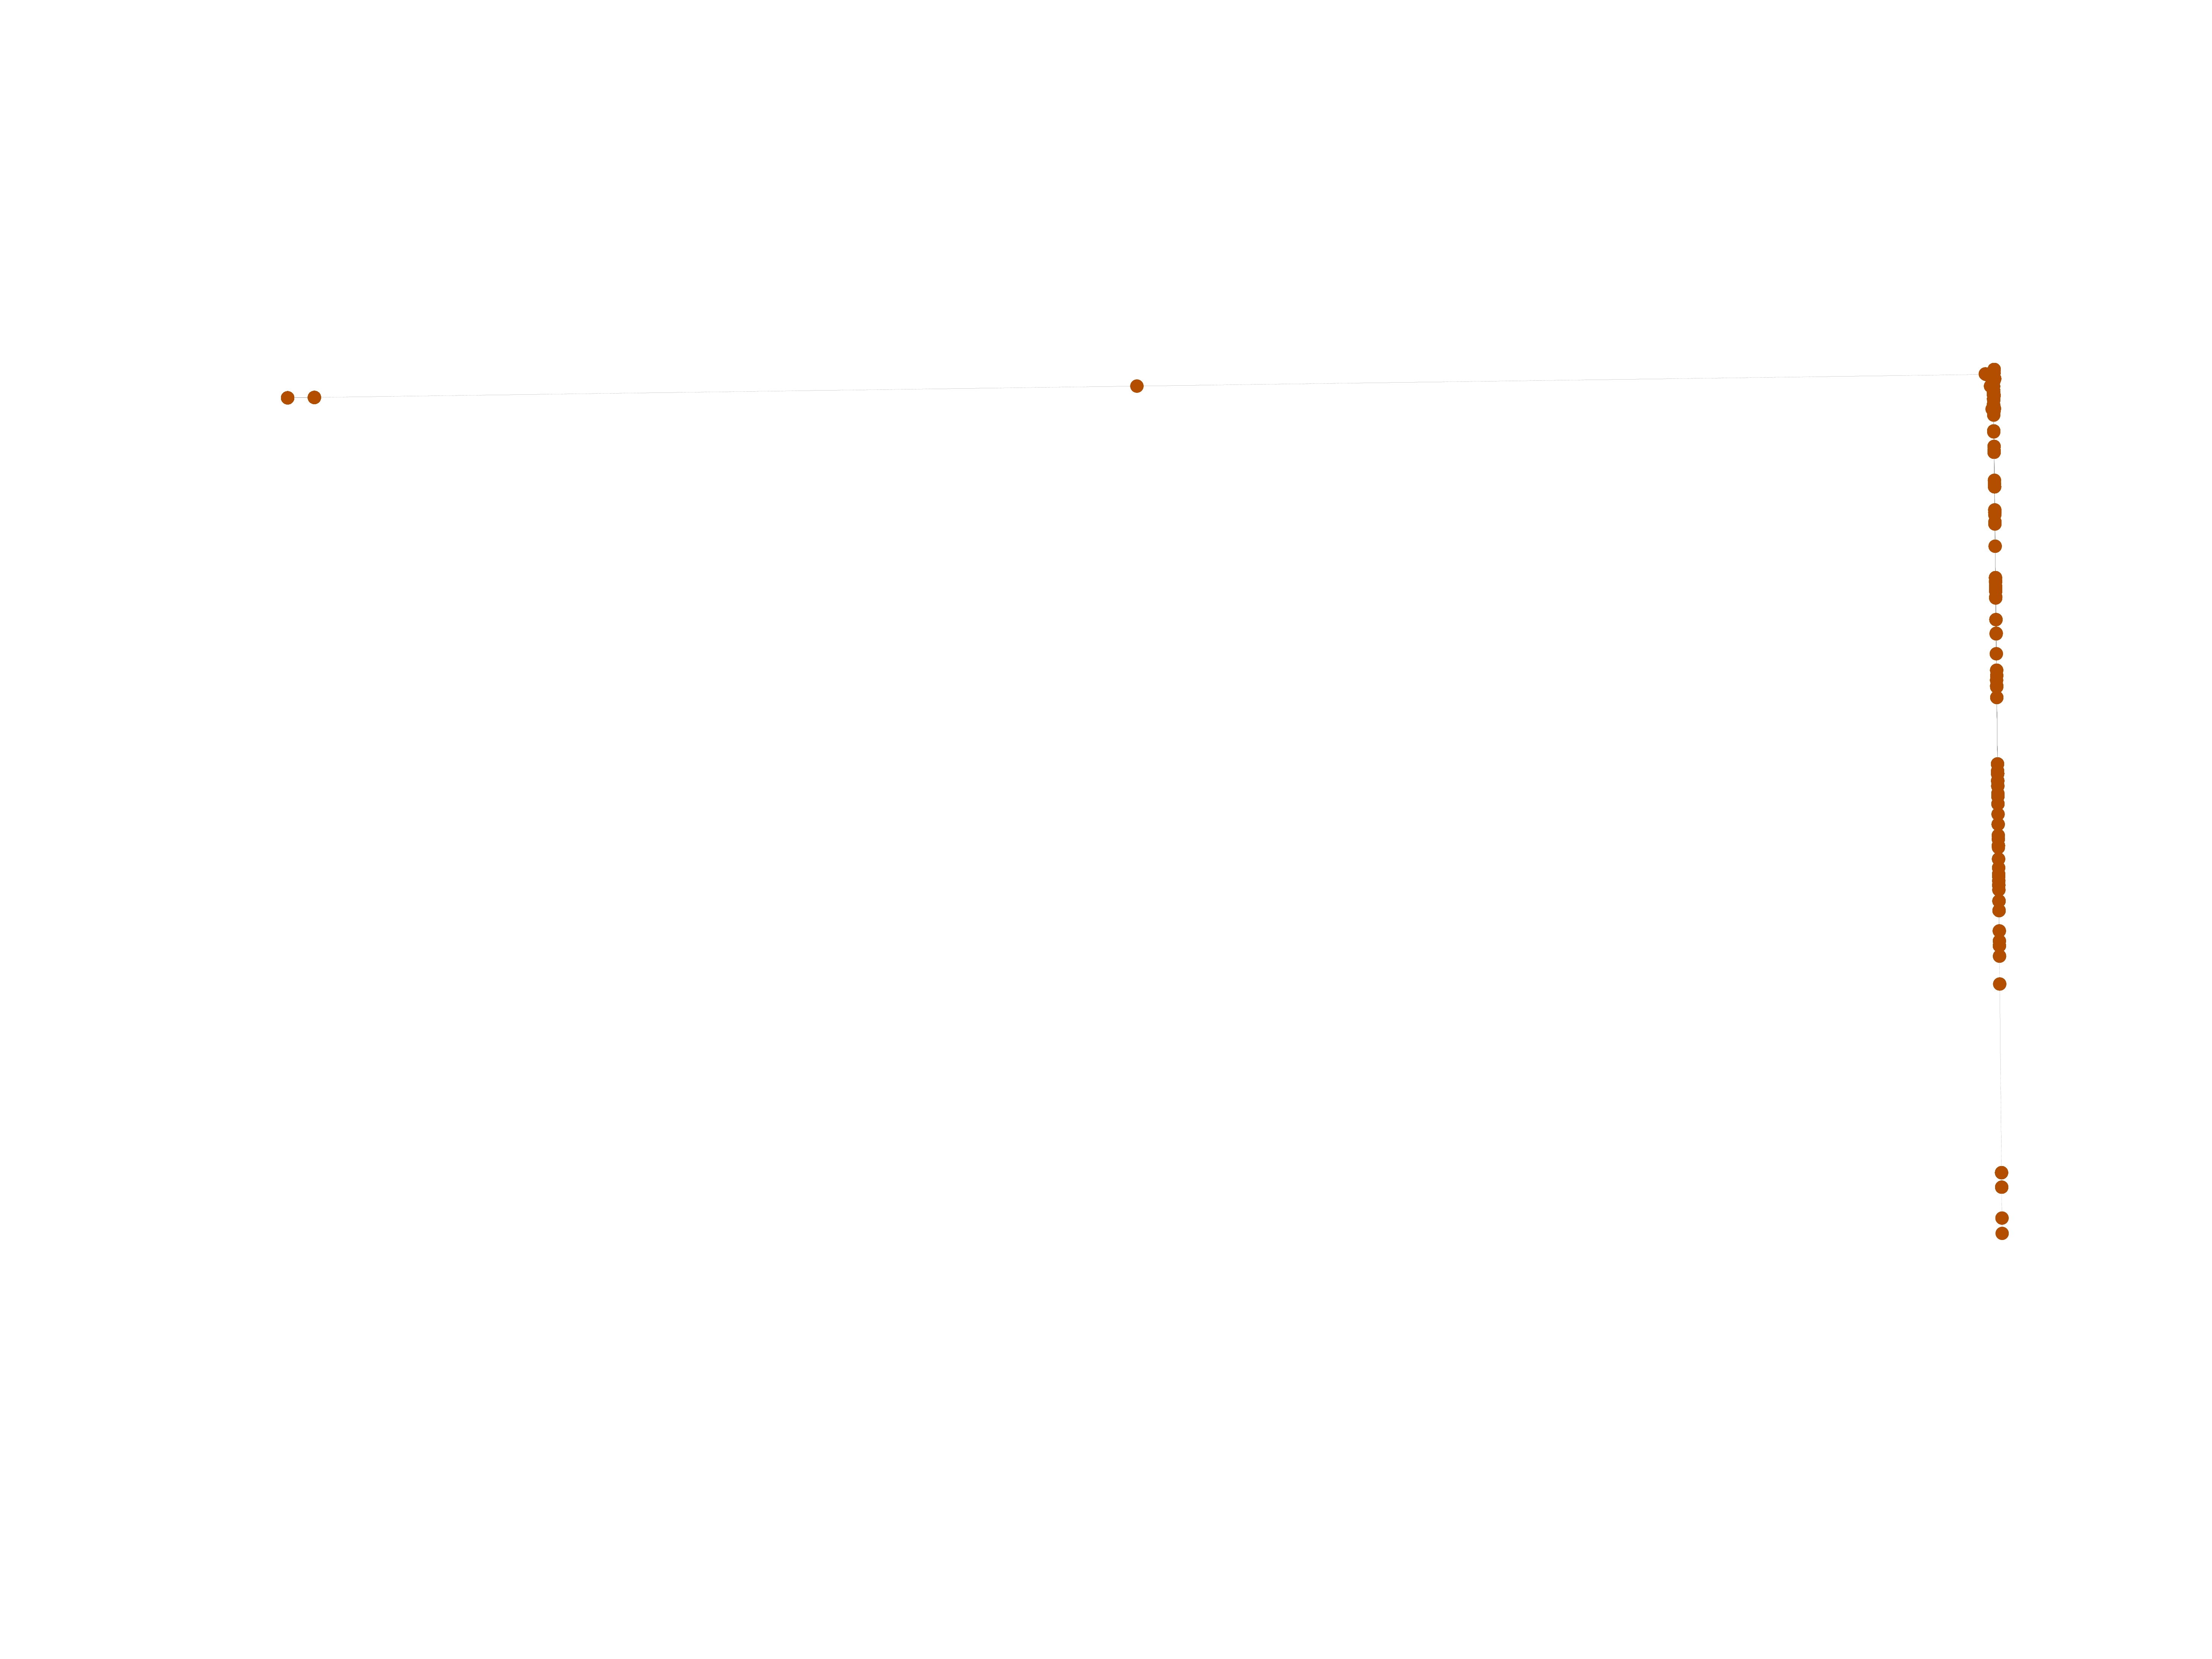
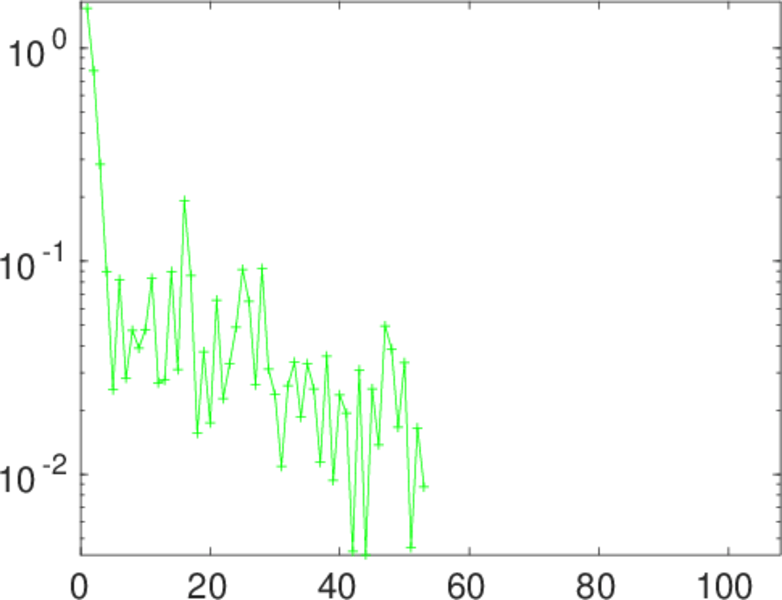
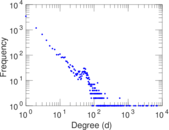
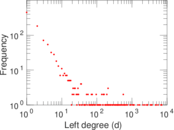
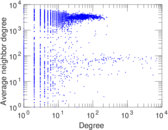
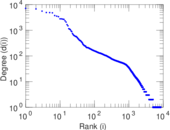
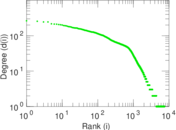
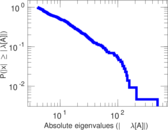
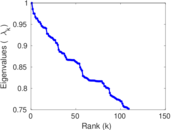
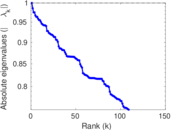
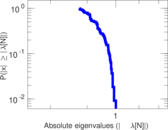
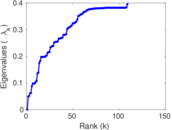
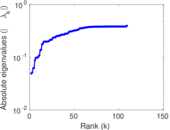
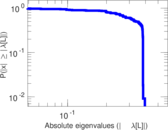
Plots


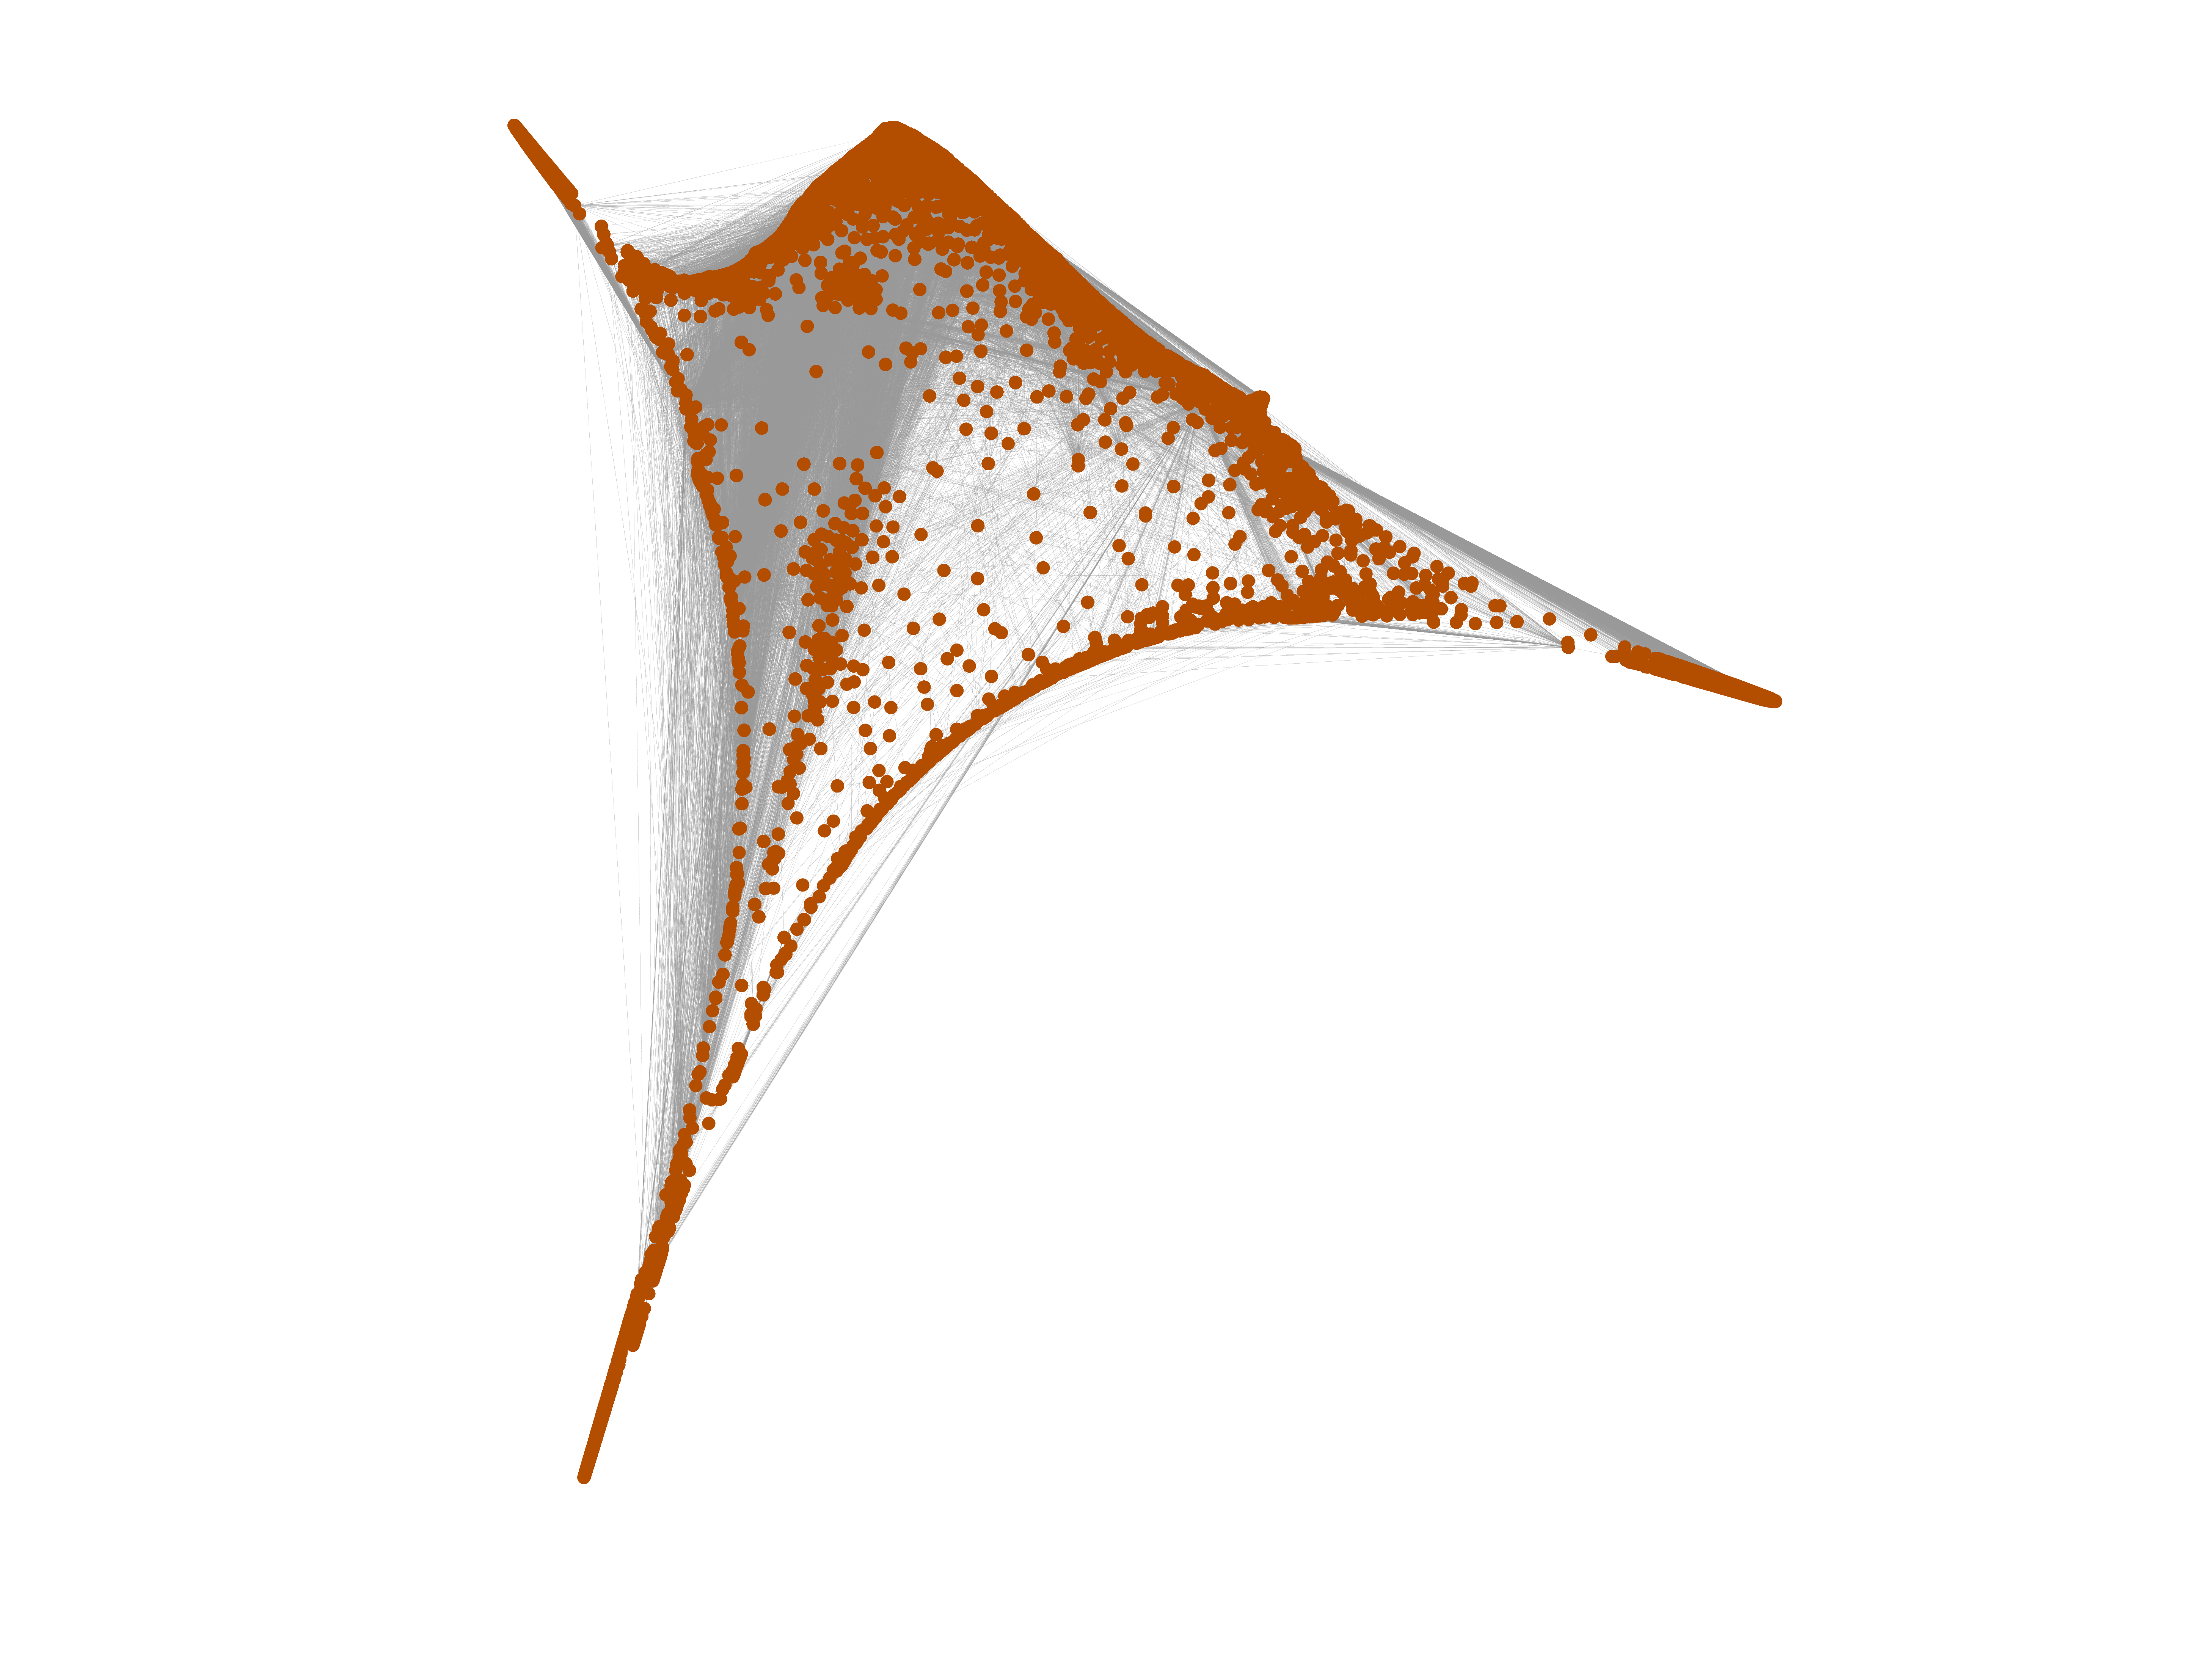
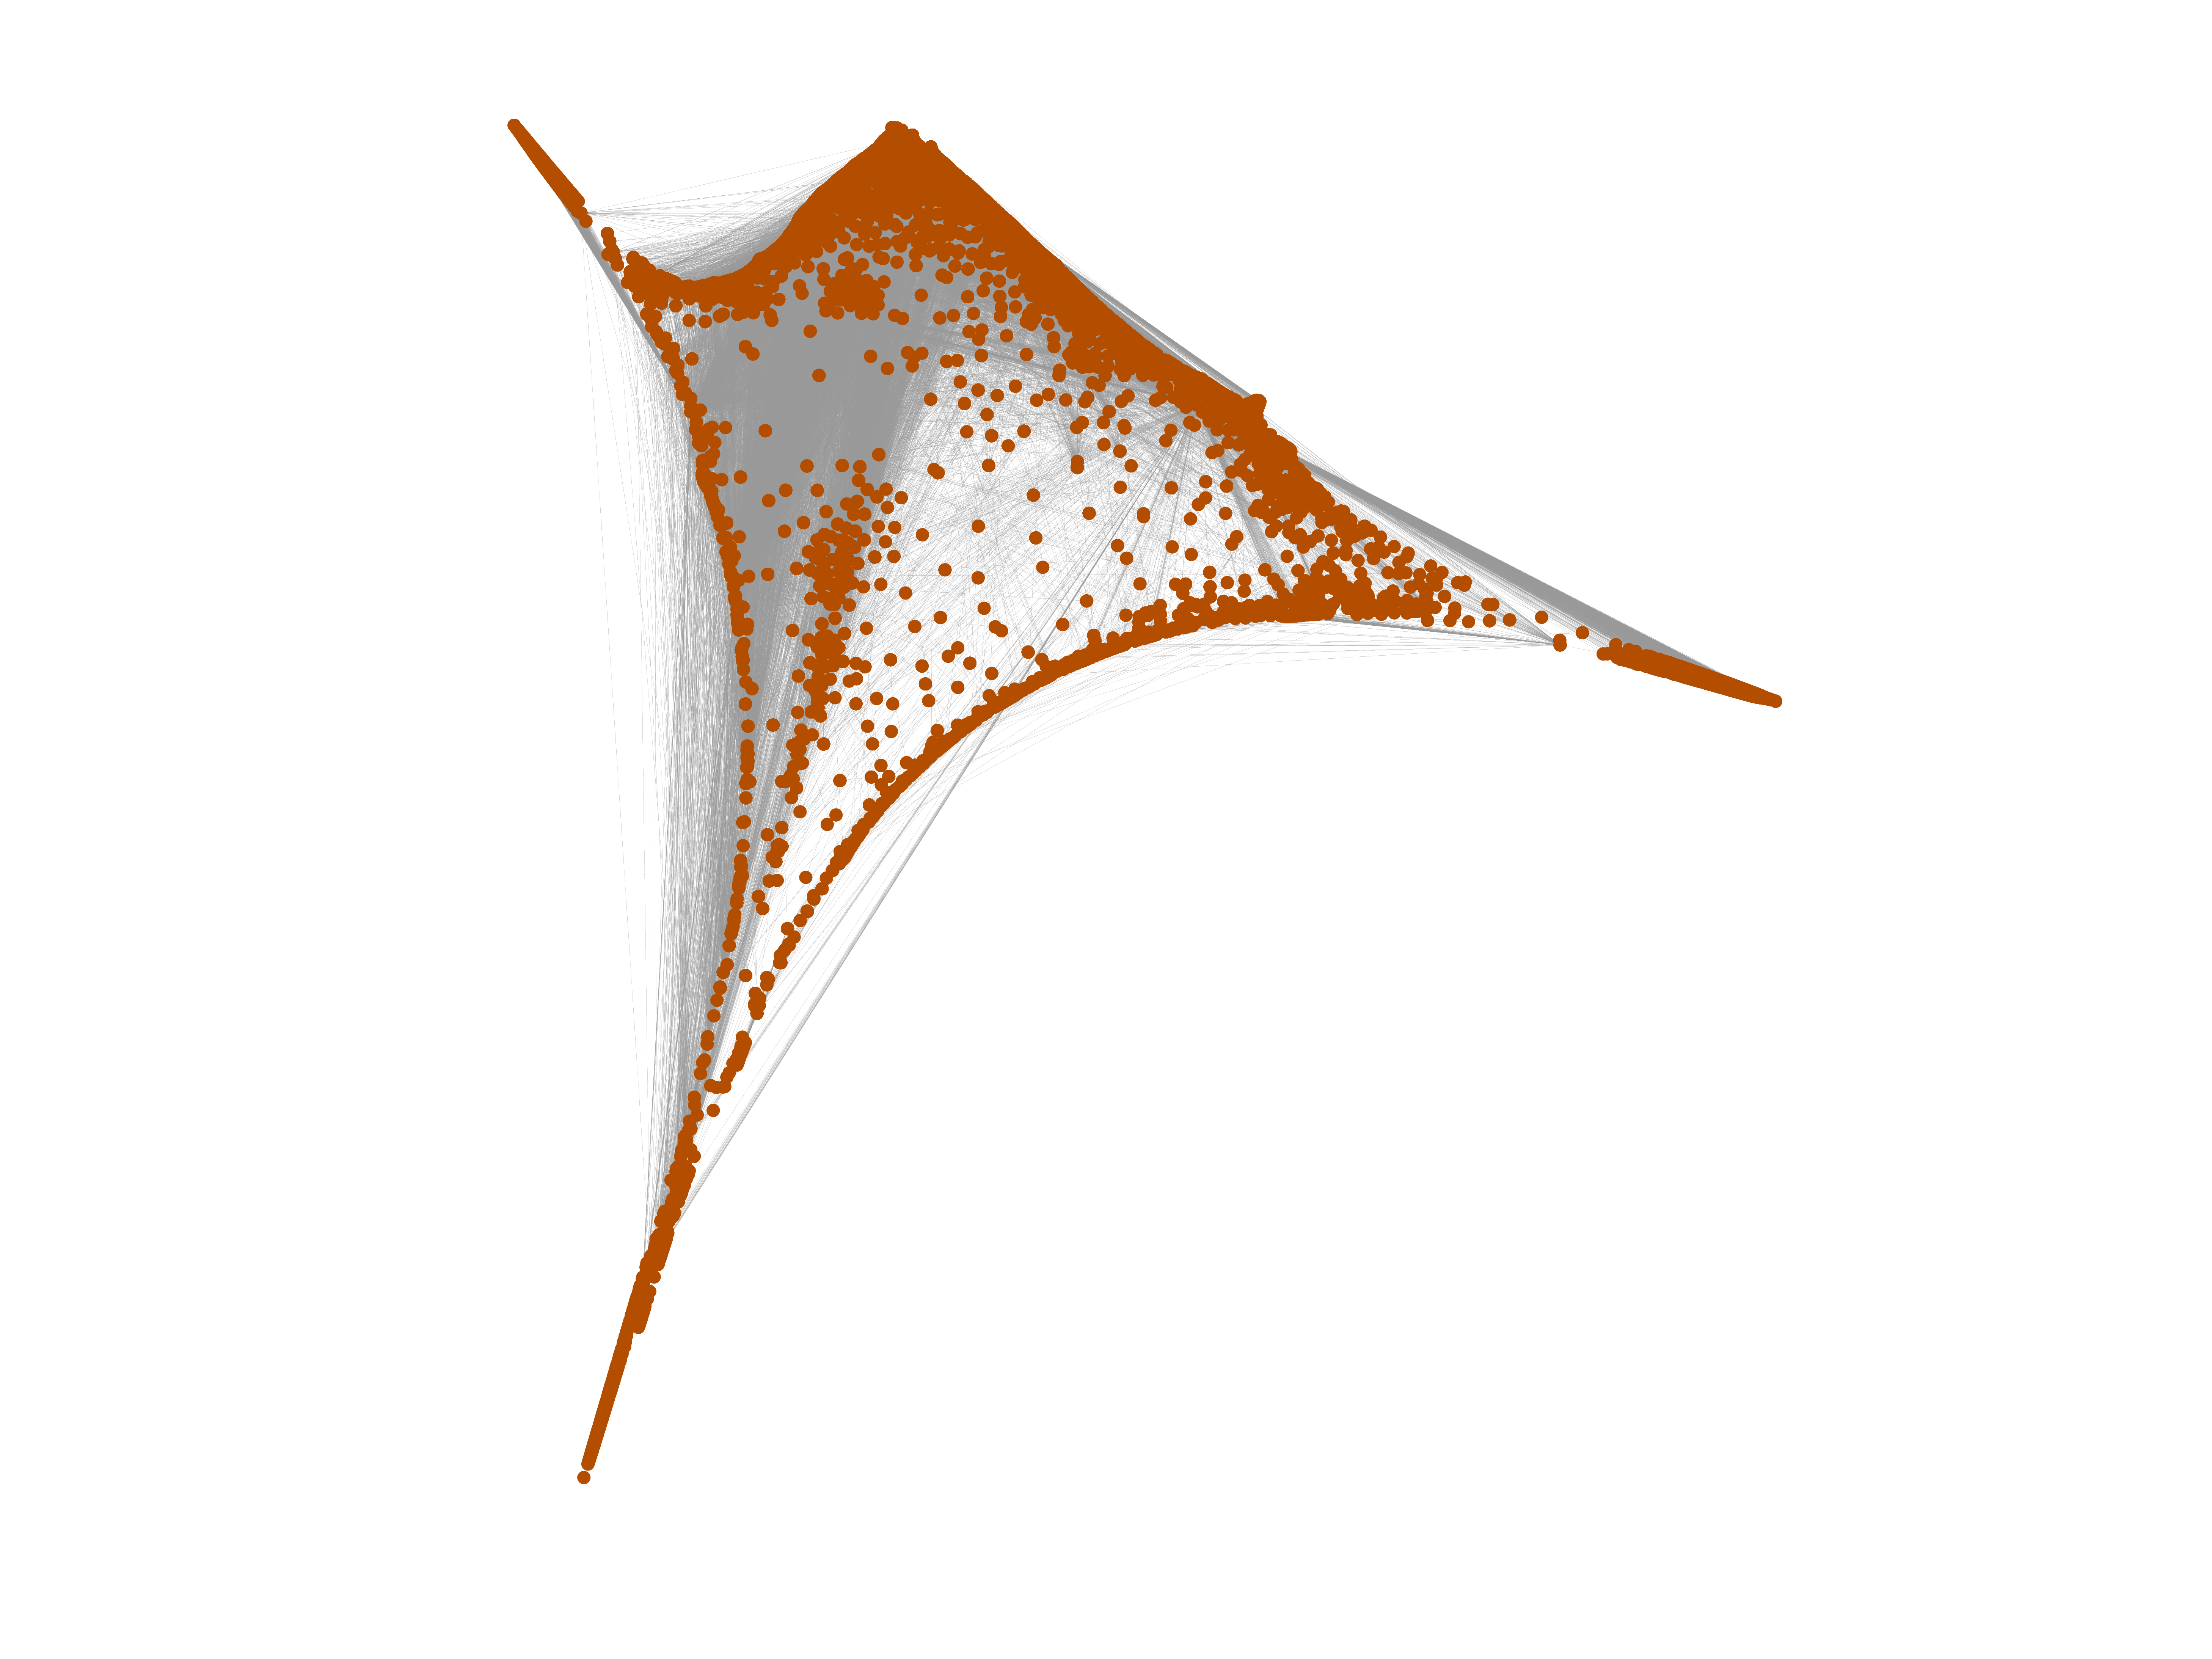
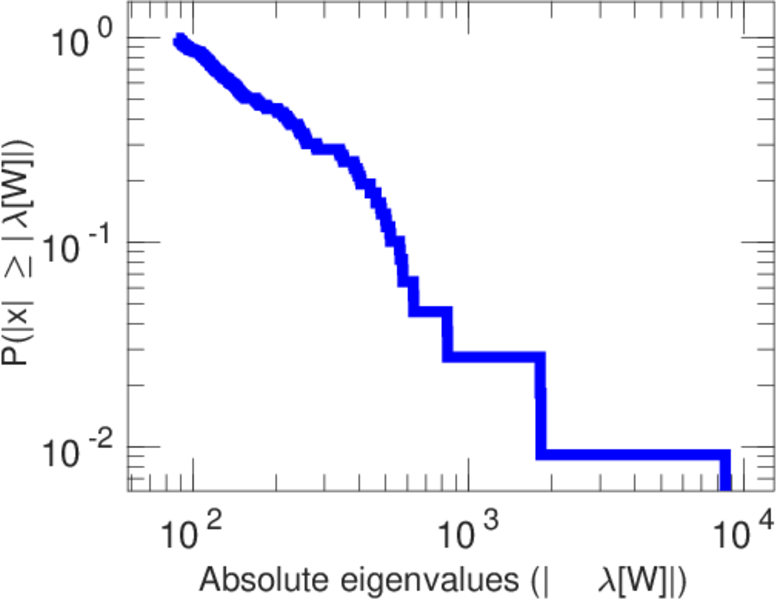
Matrix decompositions plots


Downloads
References
|
[1]
|
Jérôme Kunegis.
KONECT – The Koblenz Network Collection.
In Proc. Int. Conf. on World Wide Web Companion, pages
1343–1350, 2013.
[ http ]
|
|
[2]
|
Wikimedia Foundation.
Wikimedia downloads.
http://dumps.wikimedia.org/, January 2010.
|
 KONECT ‣ Networks ‣
Buy Me a Coffee
KONECT ‣ Networks ‣
Buy Me a Coffee