Wiktionary edits (gn)
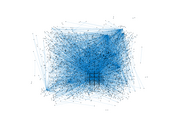
This is the bipartite edit network of the Guarani Wiktionary. It contains users
and pages from the Guarani Wiktionary, connected by edit events. Each edge
represents an edit. The dataset includes the timestamp of each edit.
Metadata
Statistics
| Size | n = | 2,678
|
| Left size | n1 = | 204
|
| Right size | n2 = | 2,474
|
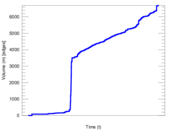
| Volume | m = | 6,691
|
| Unique edge count | m̿ = | 3,903
|
| Wedge count | s = | 1,607,259
|
| Claw count | z = | 852,101,253
|
| Cross count | x = | 362,195,123,896
|
| Square count | q = | 151,208
|
| 4-Tour count | T4 = | 7,646,978
|
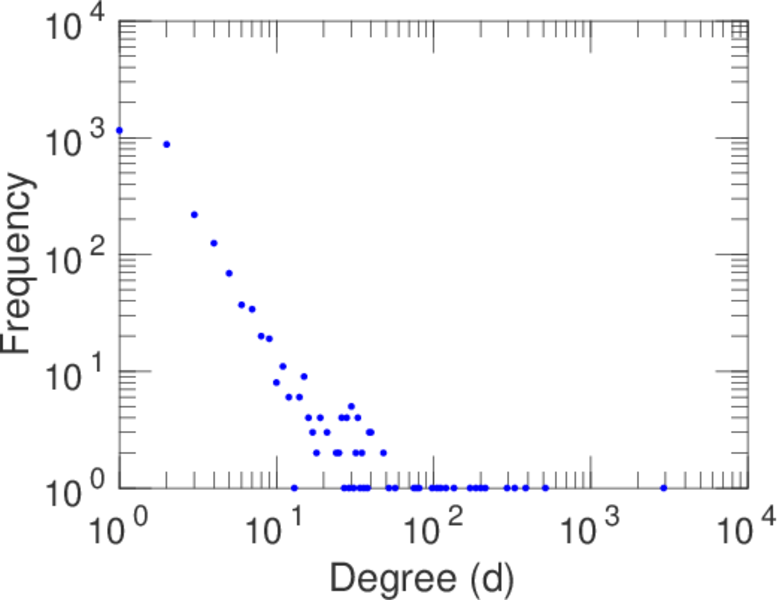
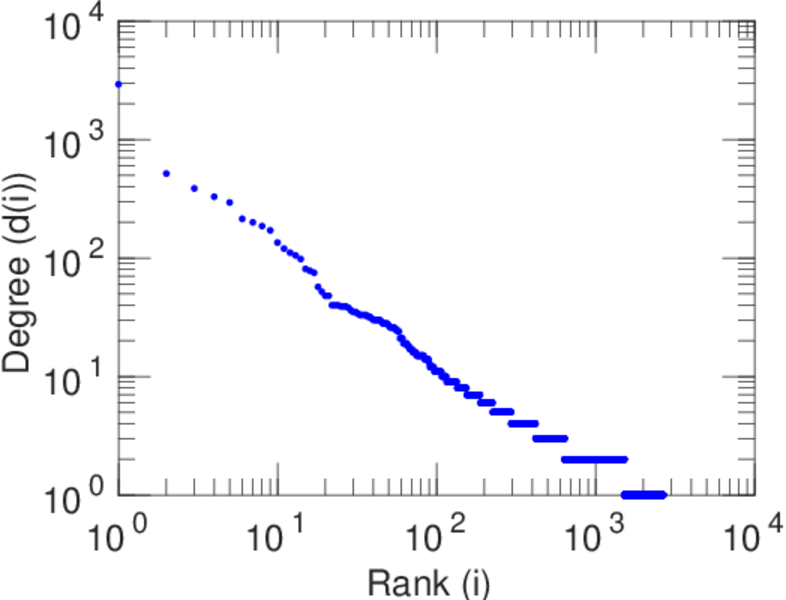
| Maximum degree | dmax = | 2,922
|
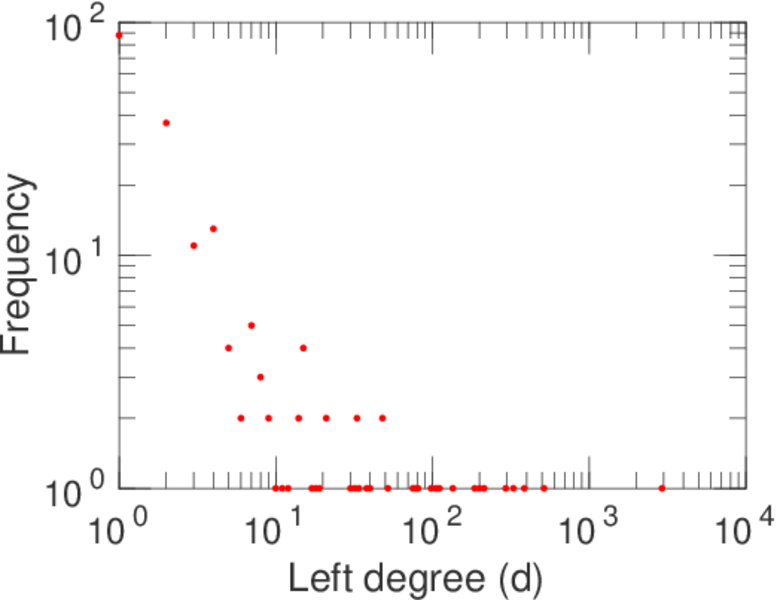
| Maximum left degree | d1max = | 2,922
|
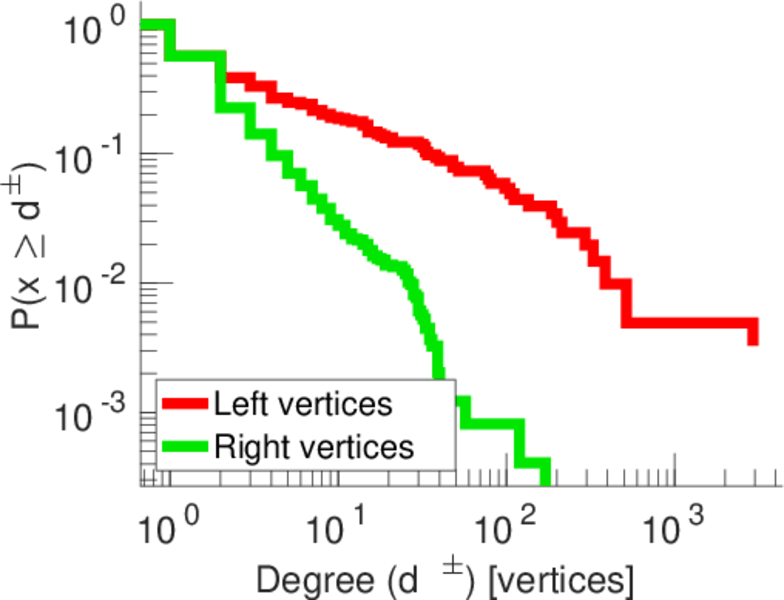
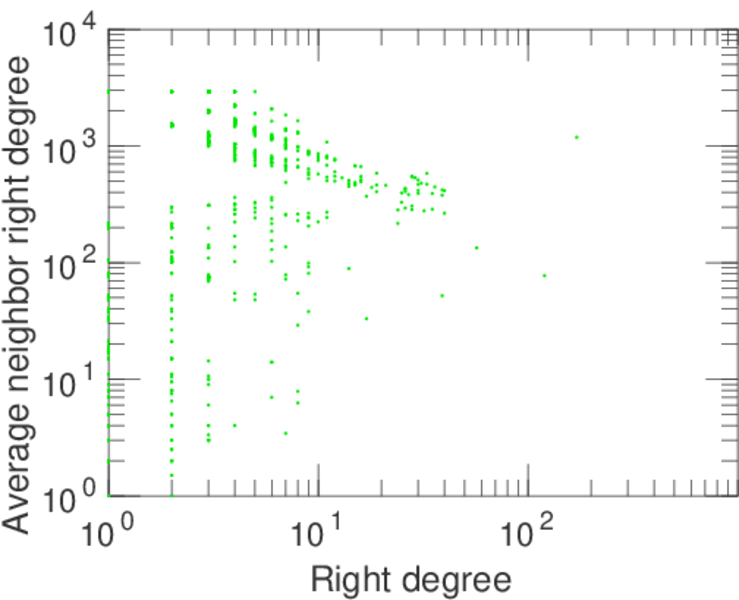
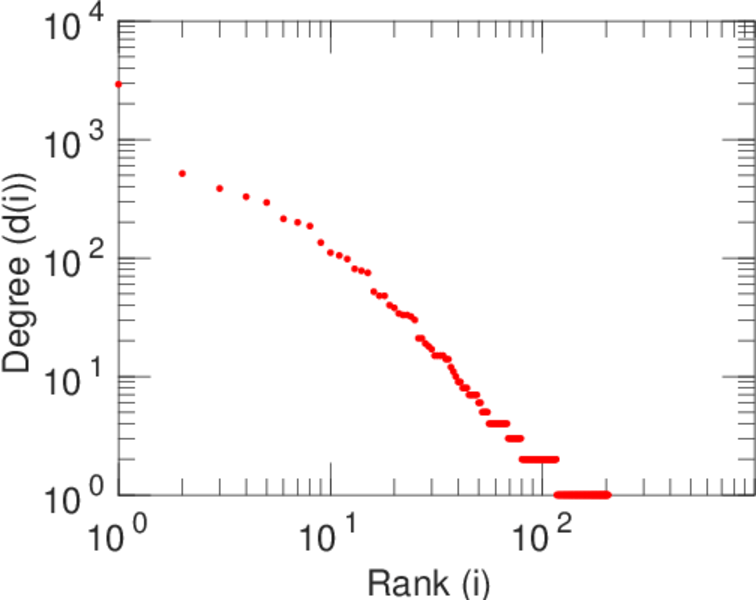
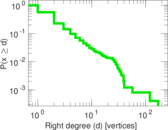
| Maximum right degree | d2max = | 171
|
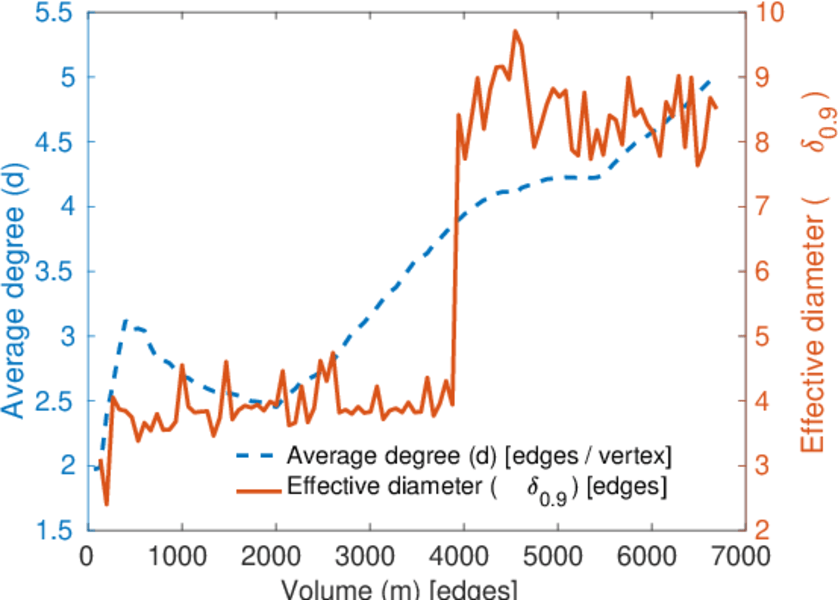
| Average degree | d = | 4.997 01
|
| Average left degree | d1 = | 32.799 0
|
| Average right degree | d2 = | 2.704 53
|
| Fill | p = | 0.007 733 37
|
| Average edge multiplicity | m̃ = | 1.714 32
|
| Size of LCC | N = | 2,342
|
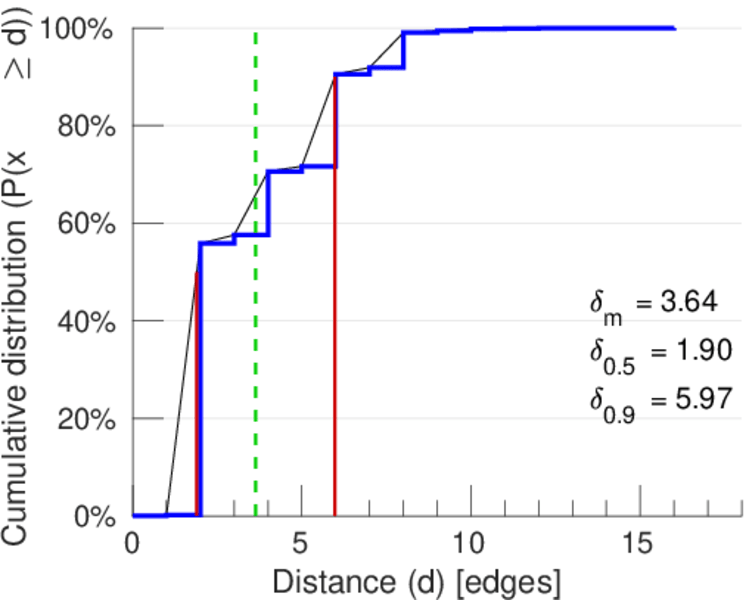
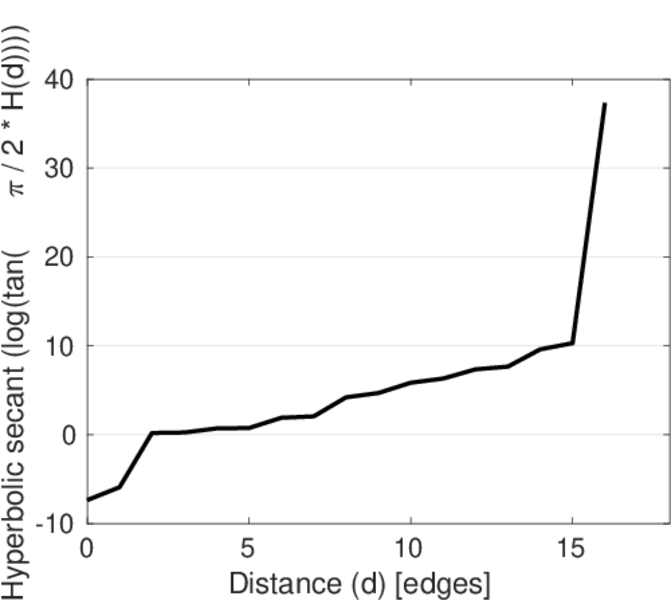
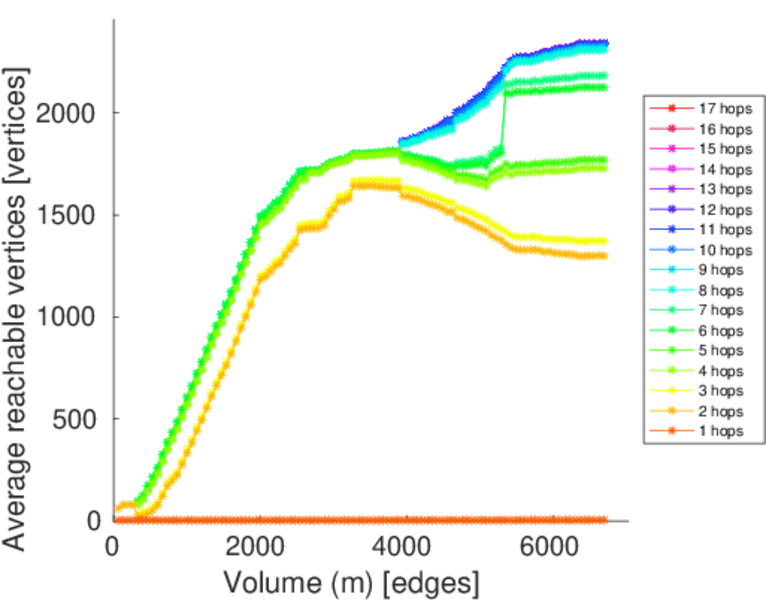
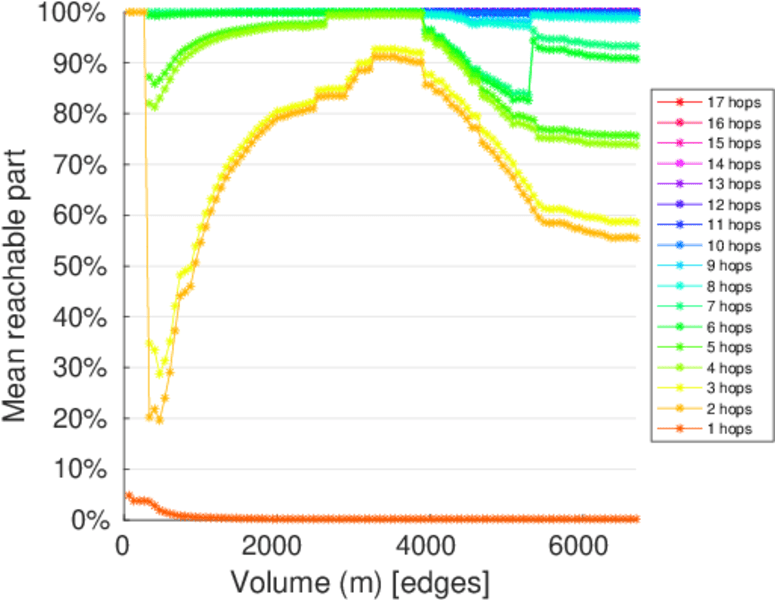
| Diameter | δ = | 17
|
| 50-Percentile effective diameter | δ0.5 = | 1.895 21
|
| 90-Percentile effective diameter | δ0.9 = | 5.972 87
|
| Median distance | δM = | 2
|
| Mean distance | δm = | 3.636 65
|
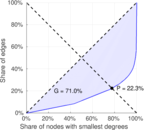
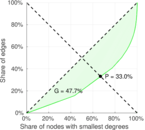
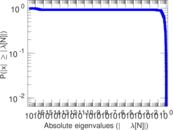
| Gini coefficient | G = | 0.713 634
|
| Balanced inequality ratio | P = | 0.224 256
|
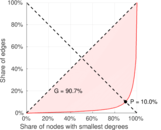
| Left balanced inequality ratio | P1 = | 0.099 835 6
|
| Right balanced inequality ratio | P2 = | 0.330 294
|
| Relative edge distribution entropy | Her = | 0.737 605
|
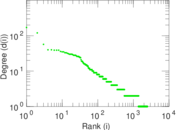
| Power law exponent | γ = | 4.302 99
|
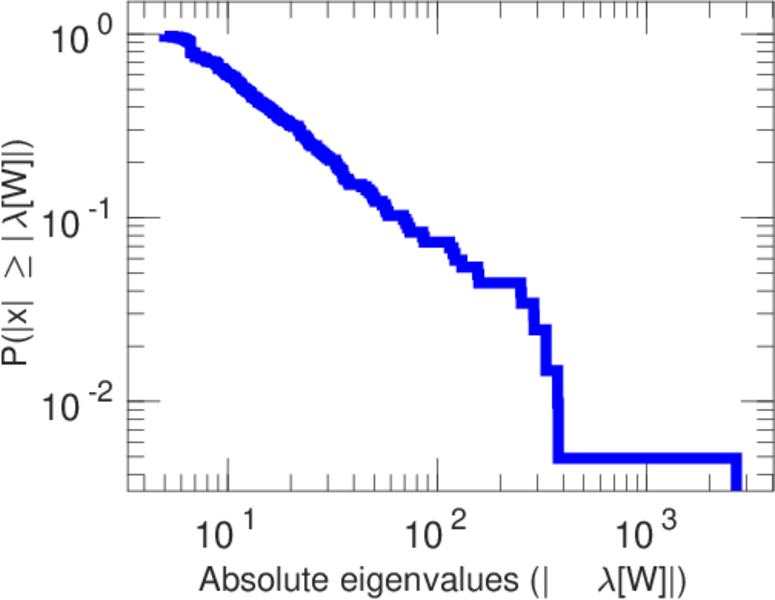
| Tail power law exponent | γt = | 2.461 00
|
| Tail power law exponent with p | γ3 = | 2.461 00
|
| p-value | p = | 0.000 00
|
| Left tail power law exponent with p | γ3,1 = | 1.721 00
|
| Left p-value | p1 = | 0.051 000 0
|
| Right tail power law exponent with p | γ3,2 = | 2.621 00
|
| Right p-value | p2 = | 0.000 00
|
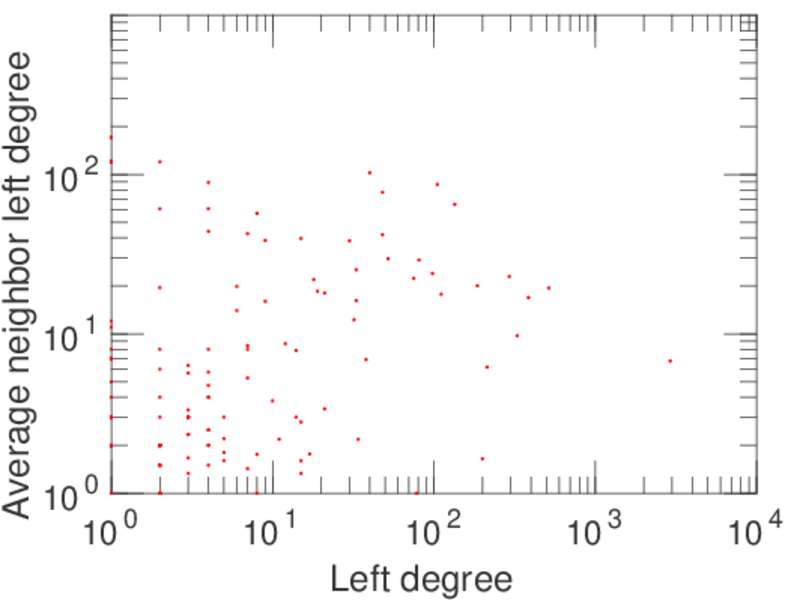
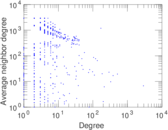
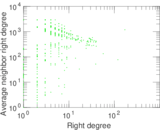
| Degree assortativity | ρ = | −0.400 050
|
| Degree assortativity p-value | pρ = | 5.887 82 × 10−150
|
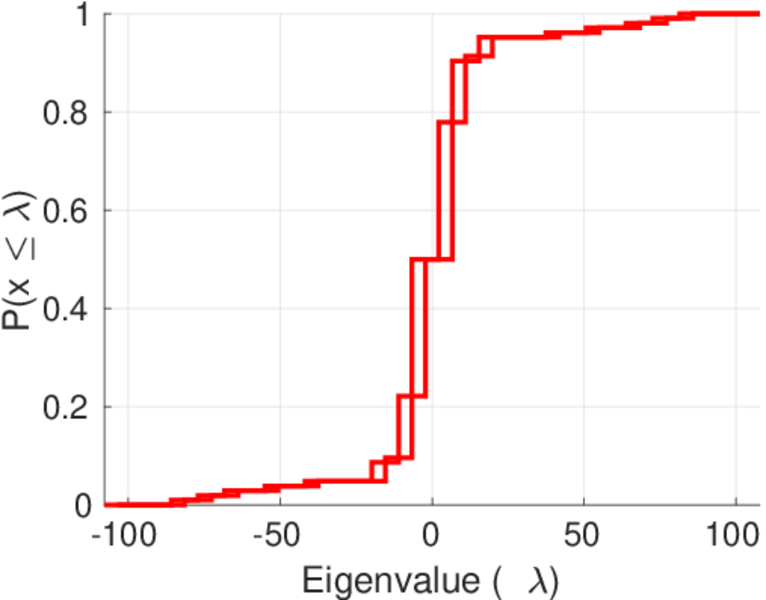
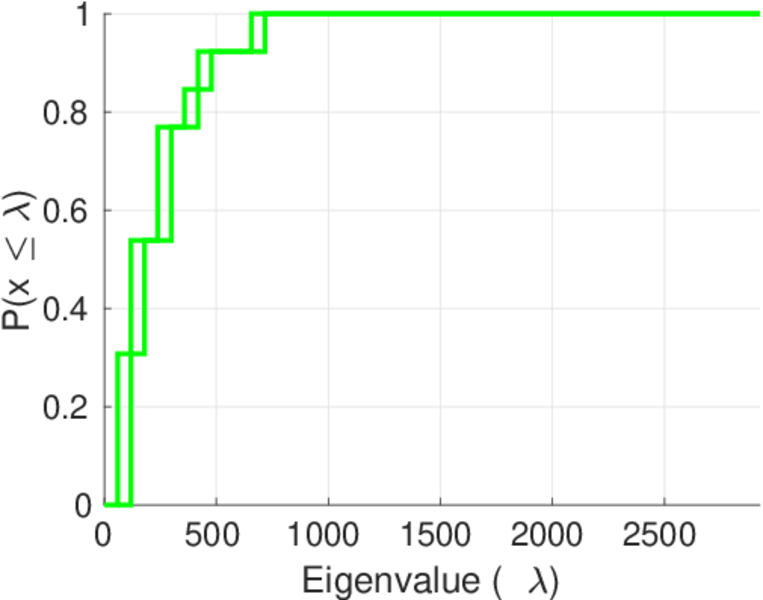
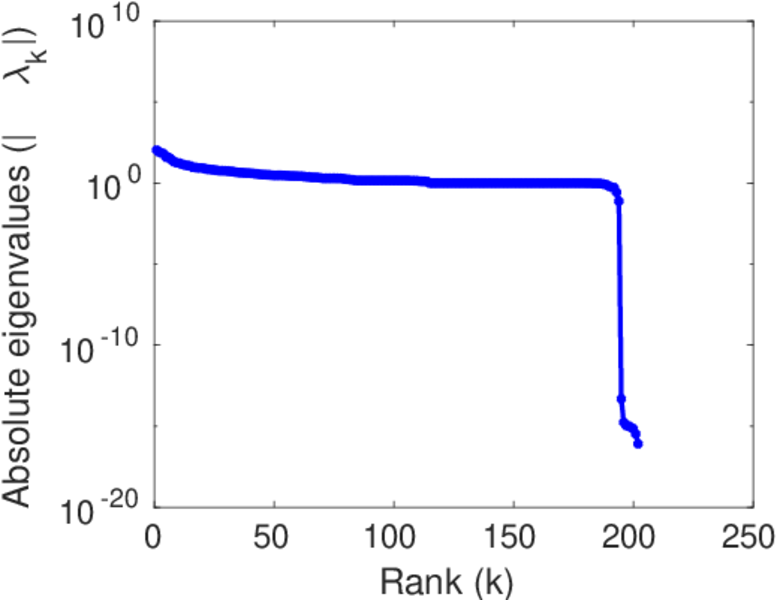
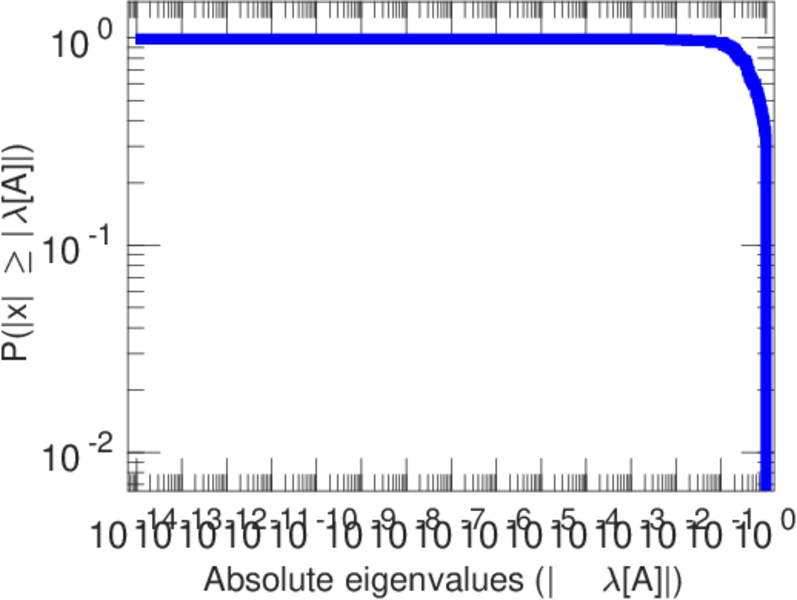
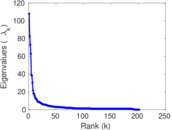
| Spectral norm | α = | 107.863
|
| Algebraic connectivity | a = | 0.007 623 29
|
| Spectral separation | |λ1[A] / λ2[A]| = | 1.303 81
|
| Controllability | C = | 2,280
|
| Relative controllability | Cr = | 0.854 573
|
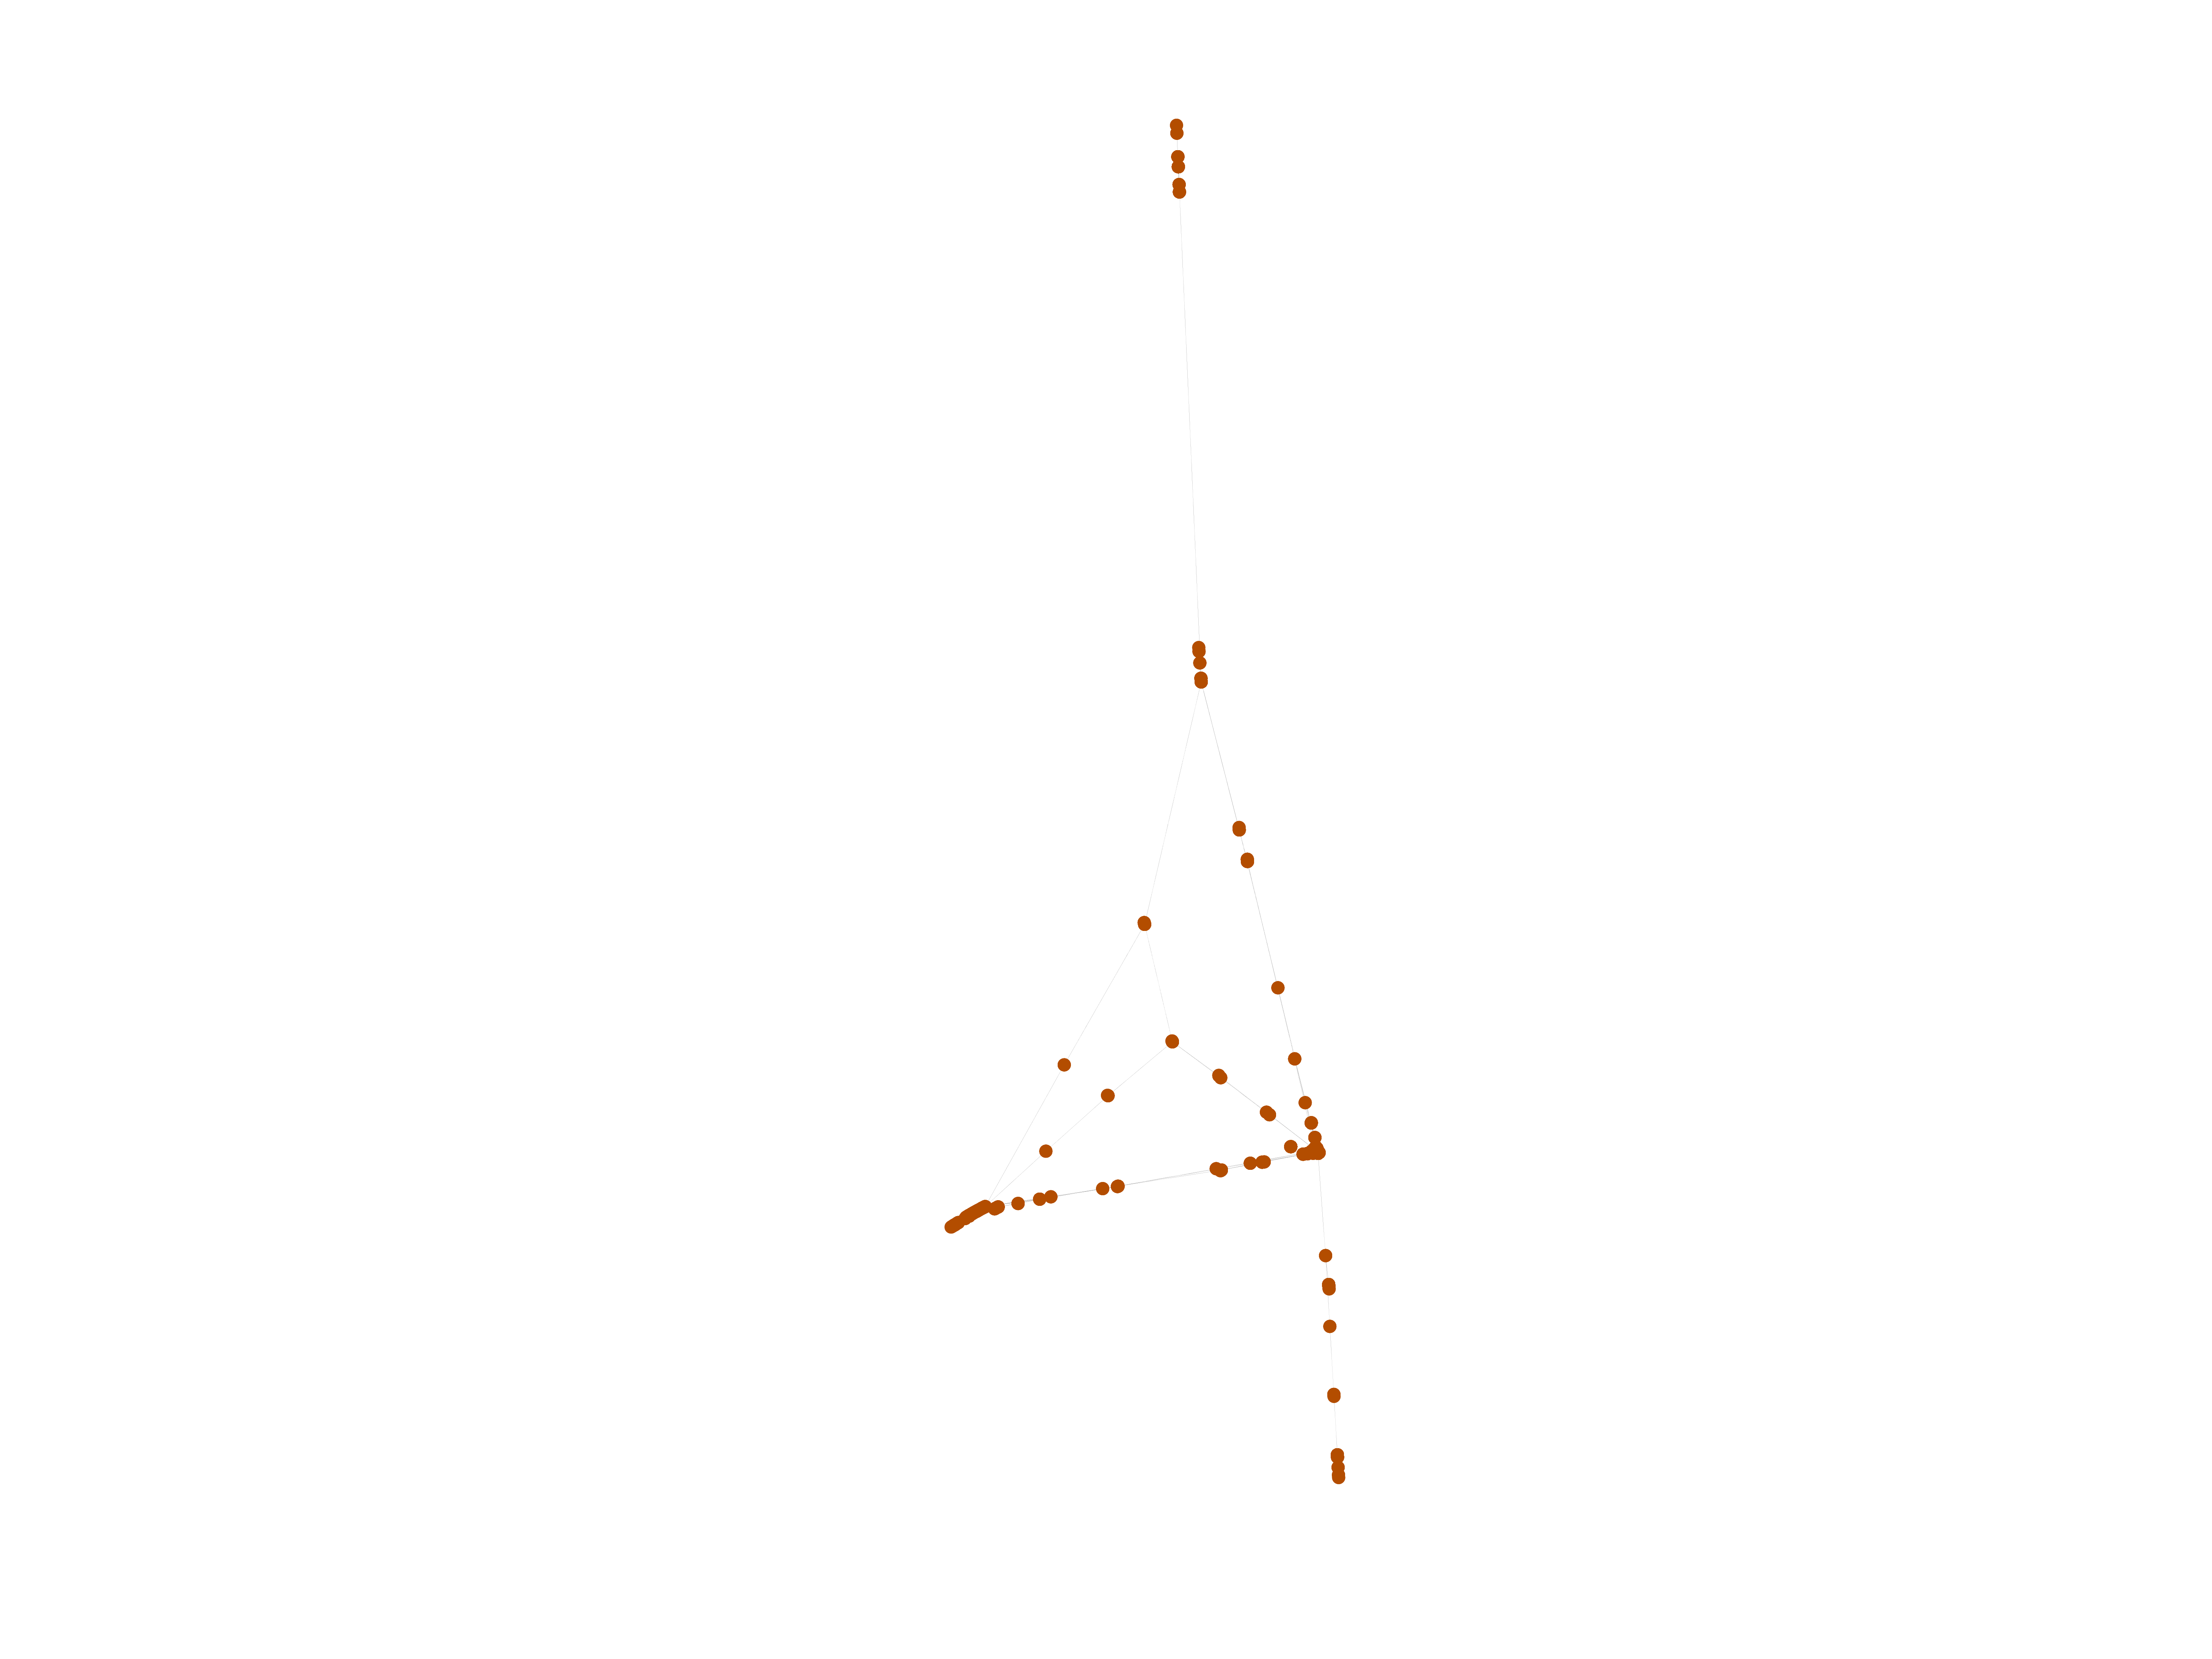
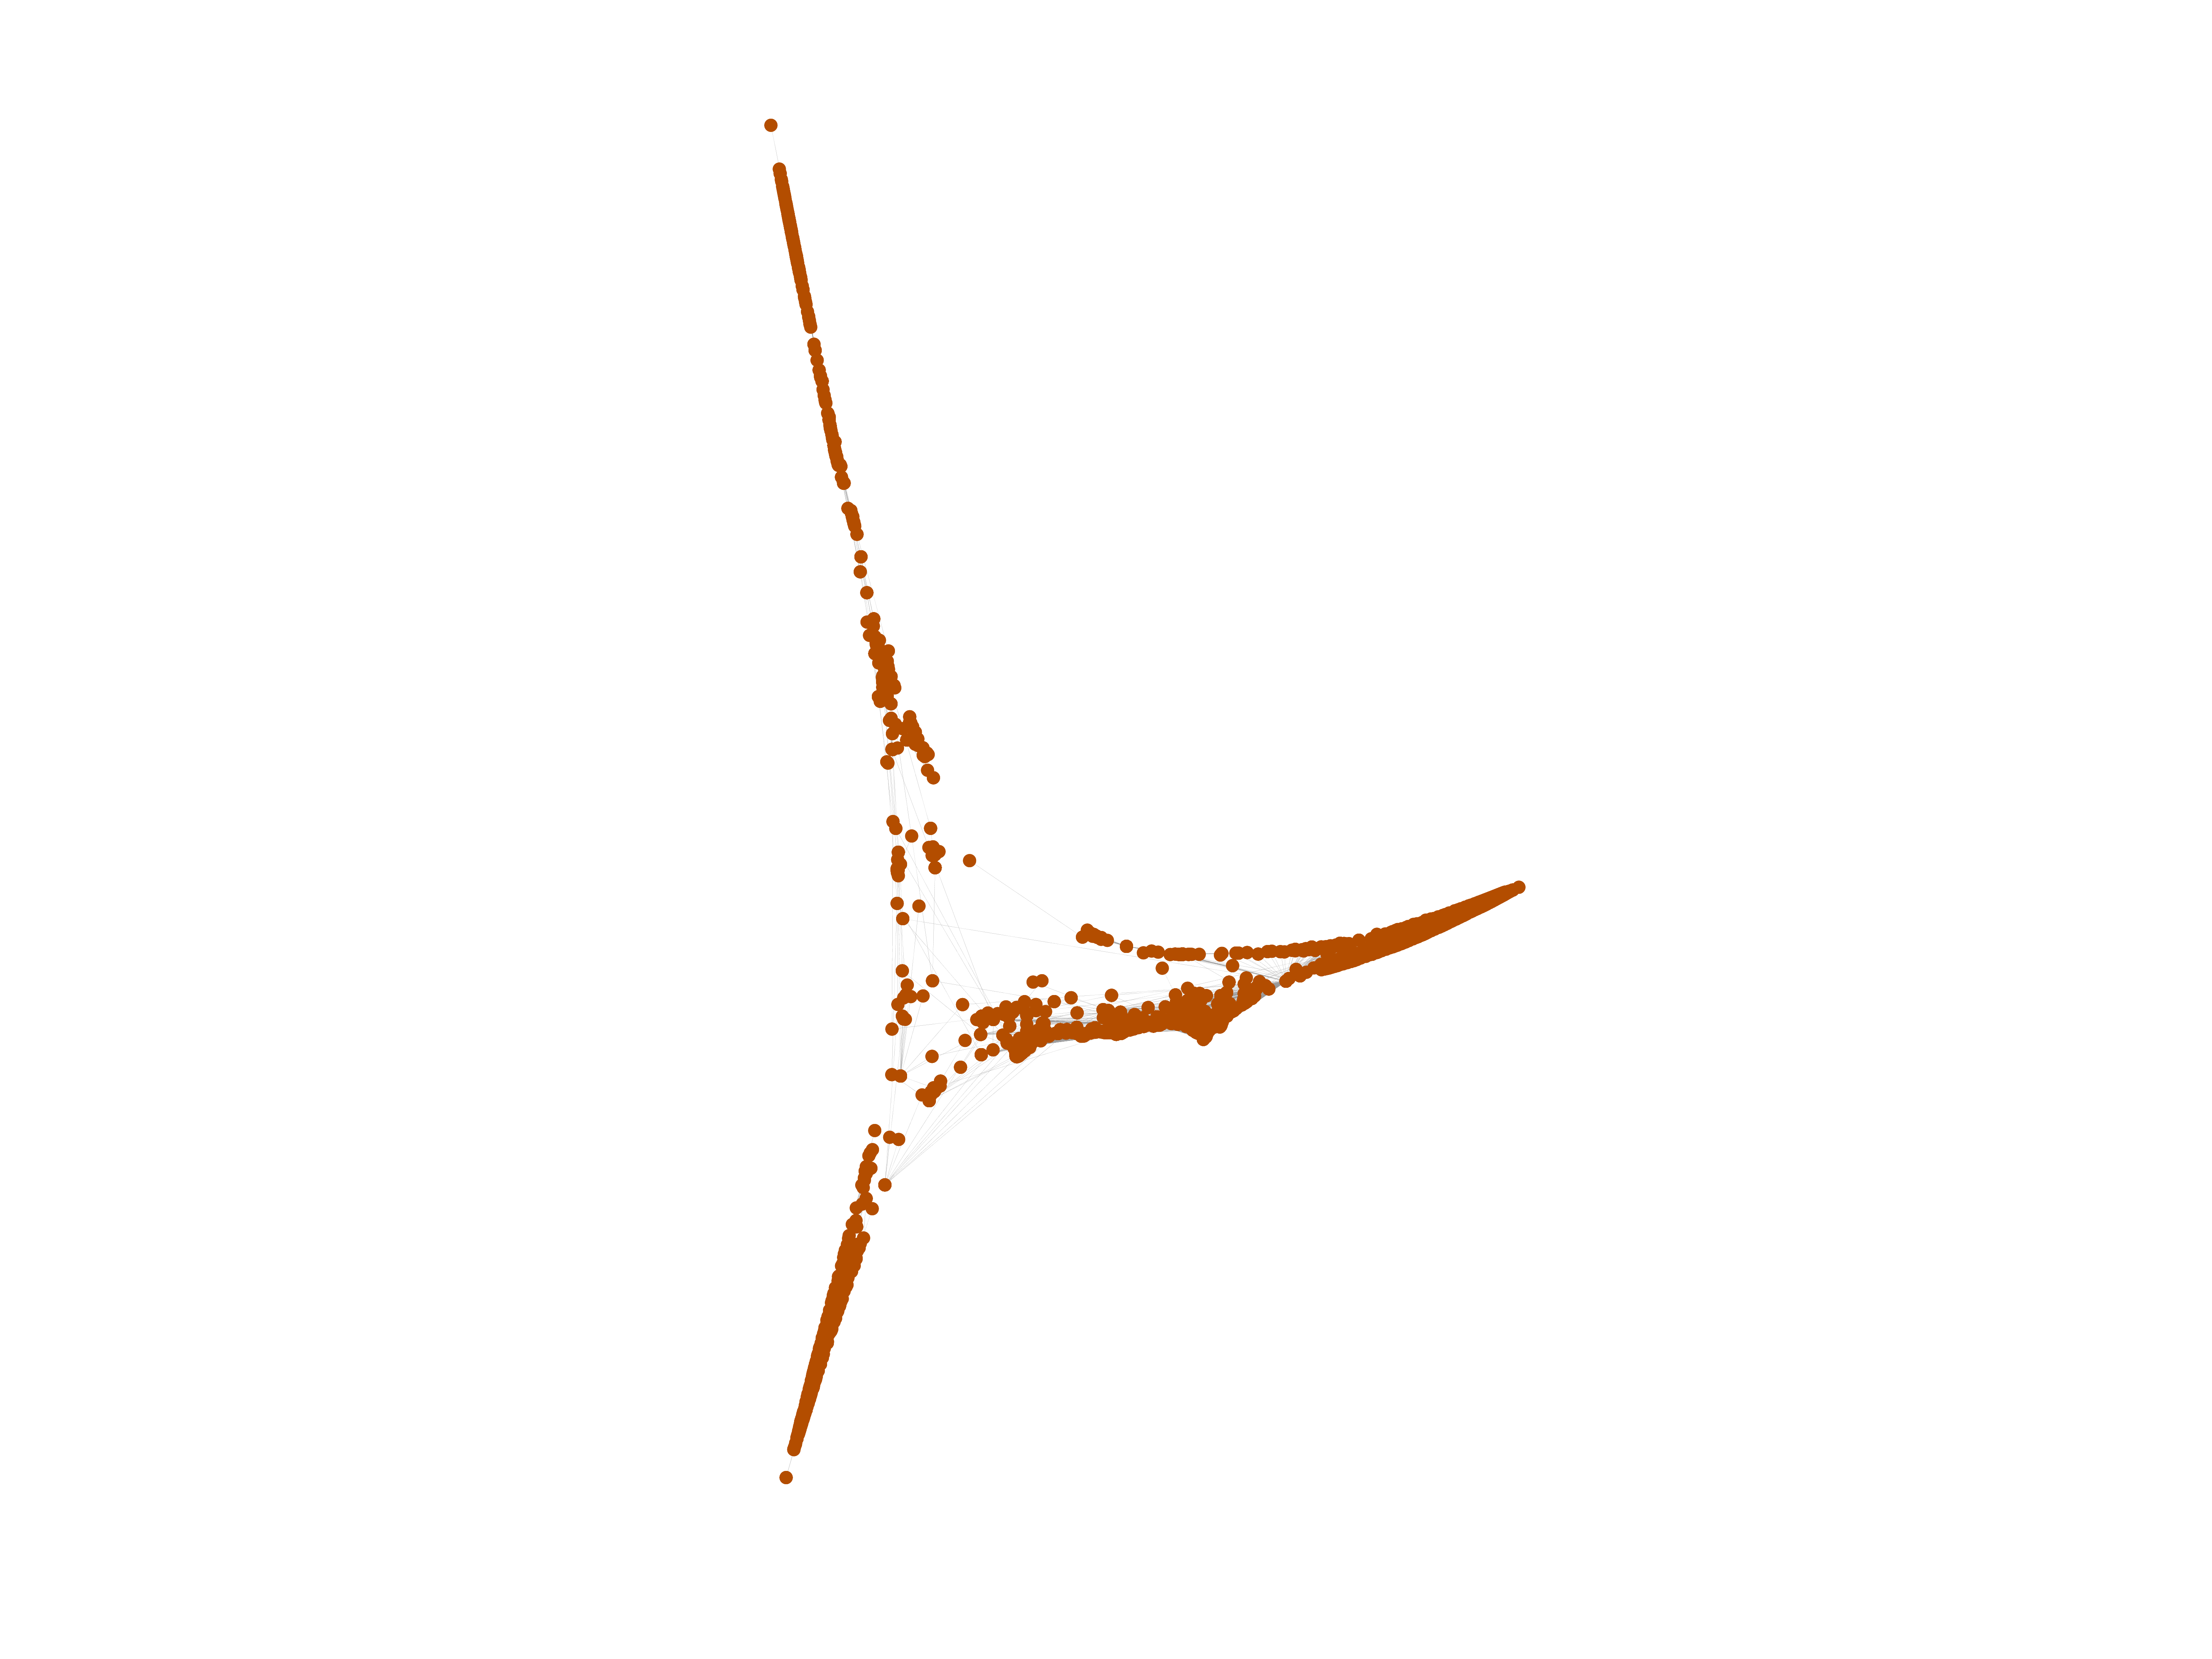
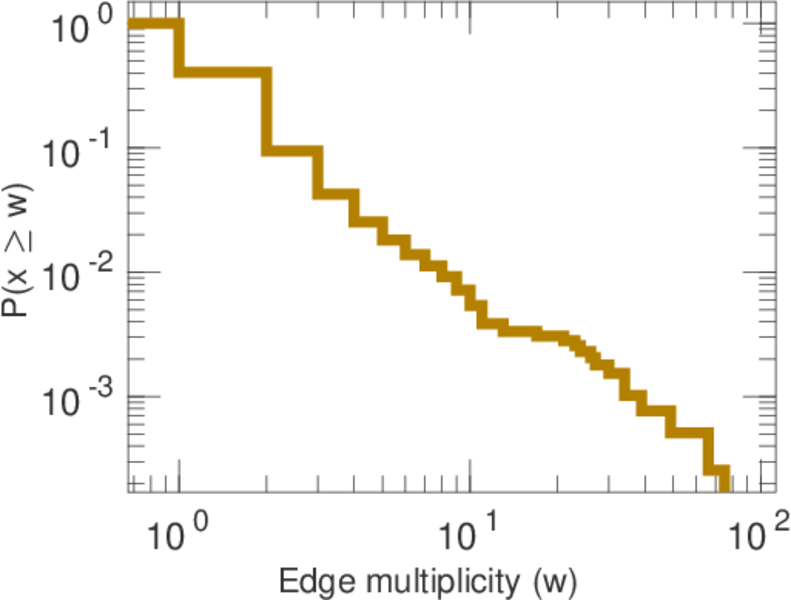
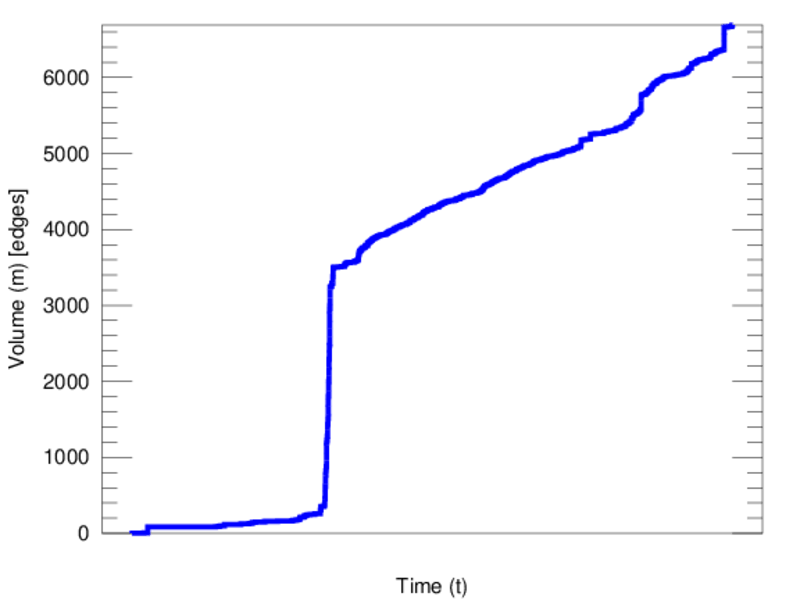
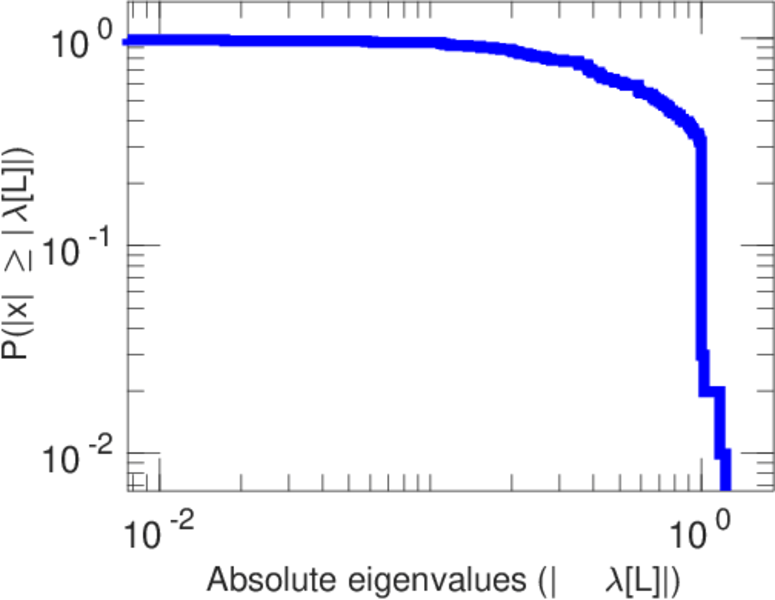
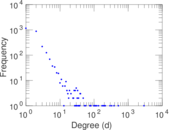
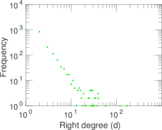
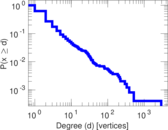
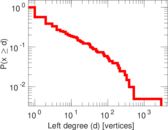
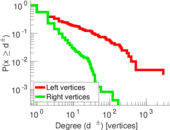
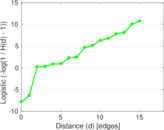
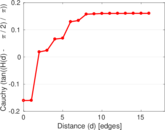
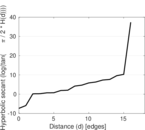
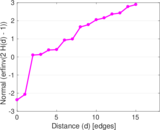
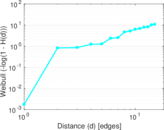
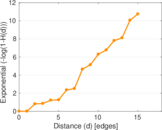
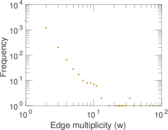
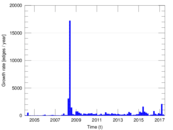
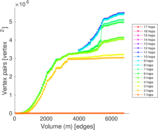
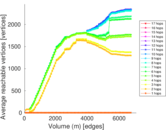
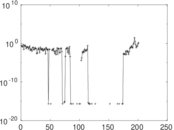
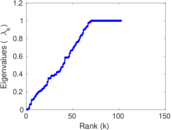
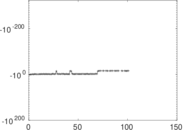
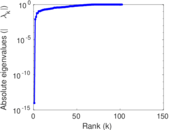
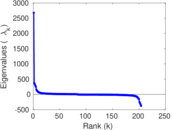
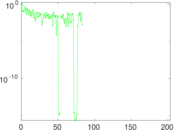
Plots


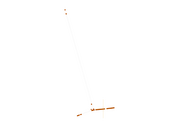
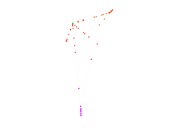


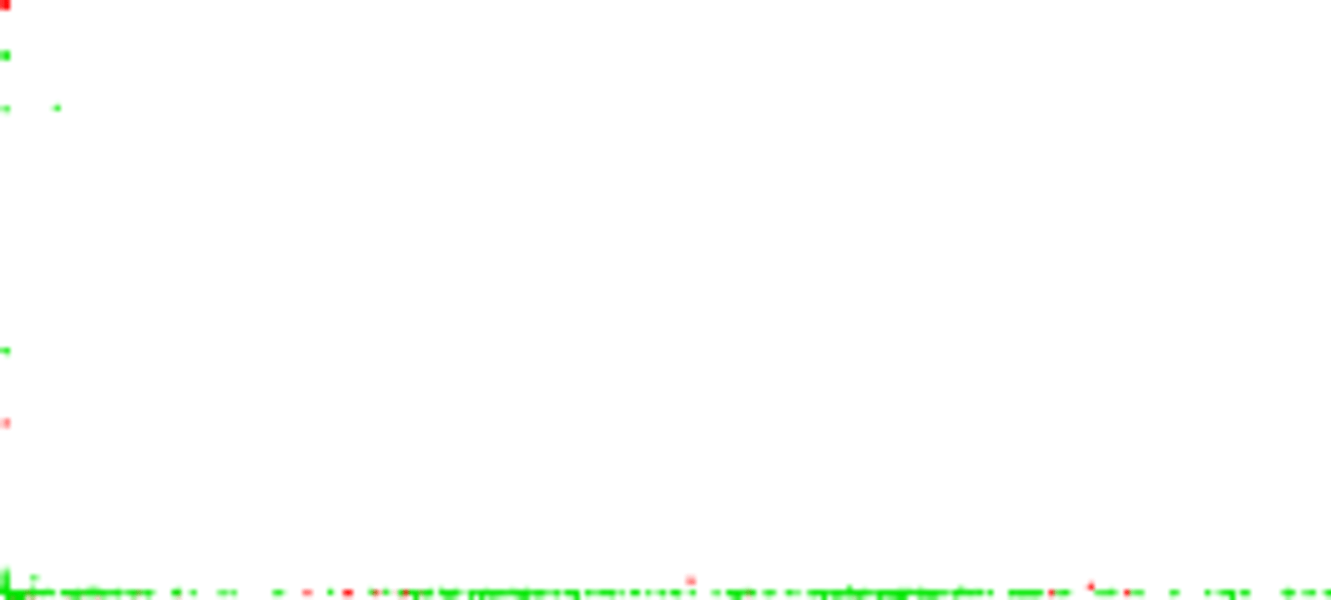
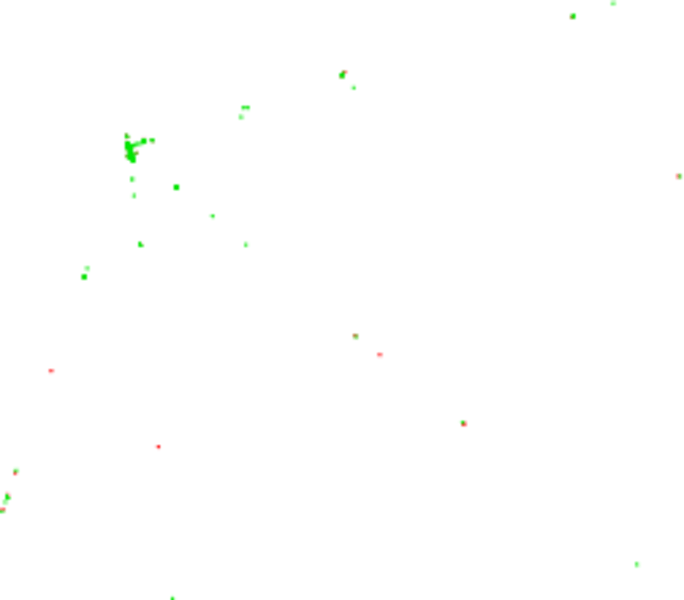
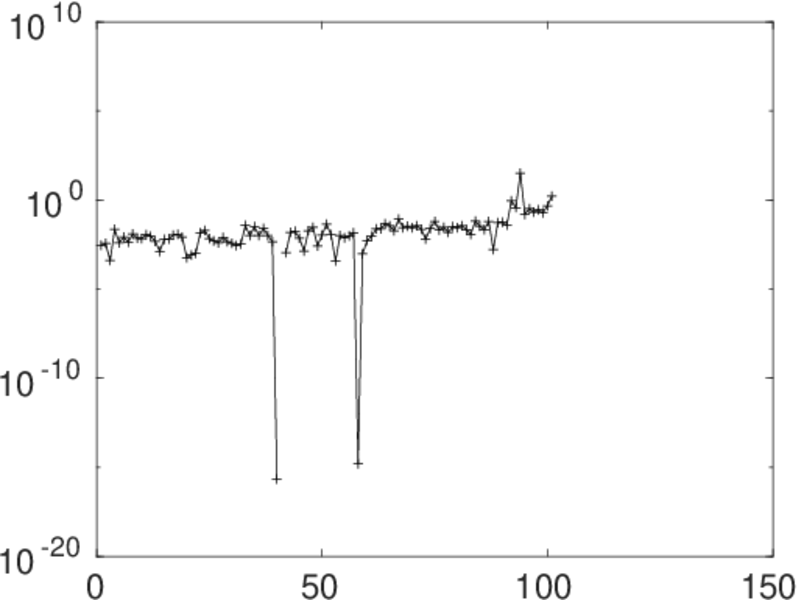
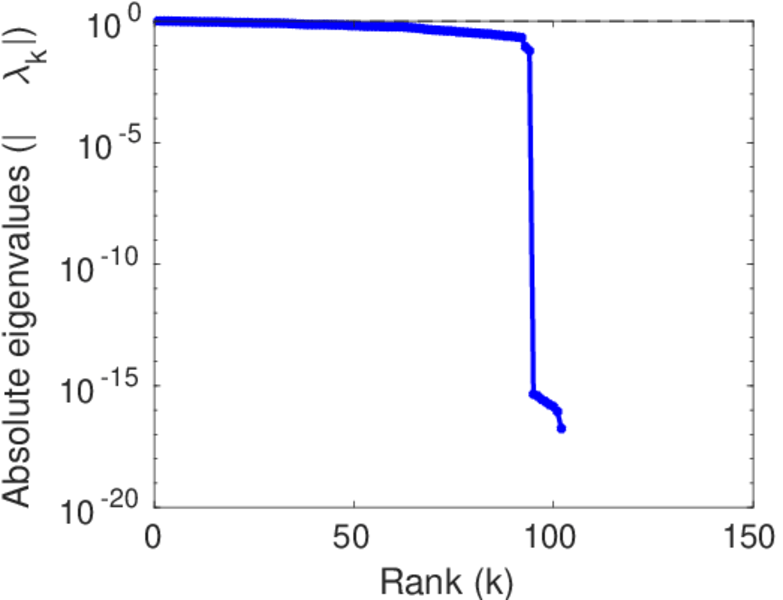
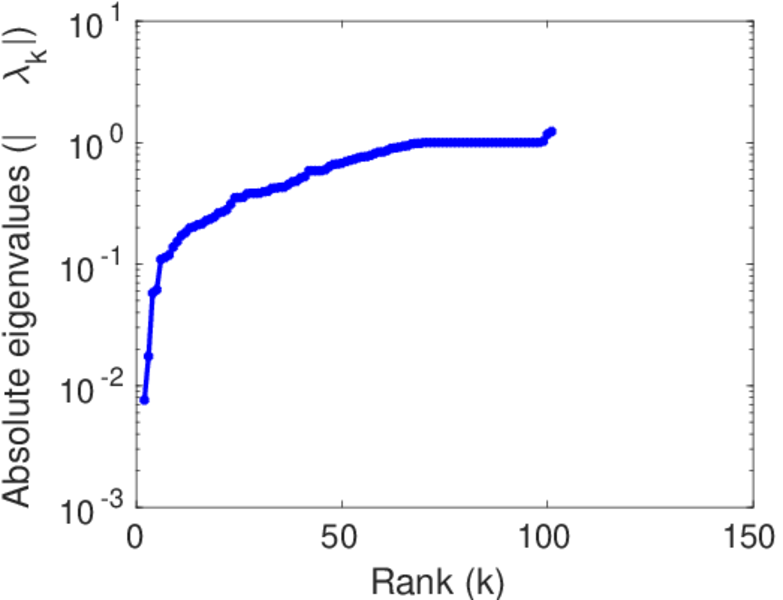
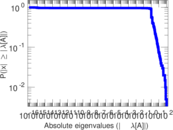
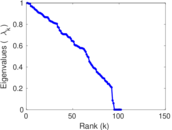
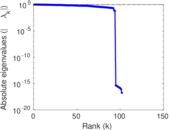
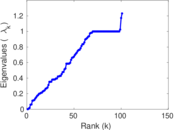
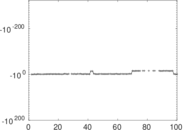
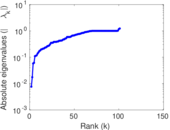
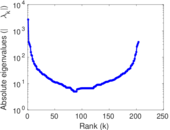
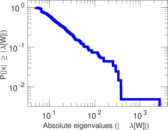
Matrix decompositions plots


Downloads
References
|
[1]
|
Jérôme Kunegis.
KONECT – The Koblenz Network Collection.
In Proc. Int. Conf. on World Wide Web Companion, pages
1343–1350, 2013.
[ http ]
|
|
[2]
|
Wikimedia Foundation.
Wikimedia downloads.
http://dumps.wikimedia.org/, January 2010.
|
 KONECT ‣ Networks ‣
Buy Me a Coffee
KONECT ‣ Networks ‣
Buy Me a Coffee