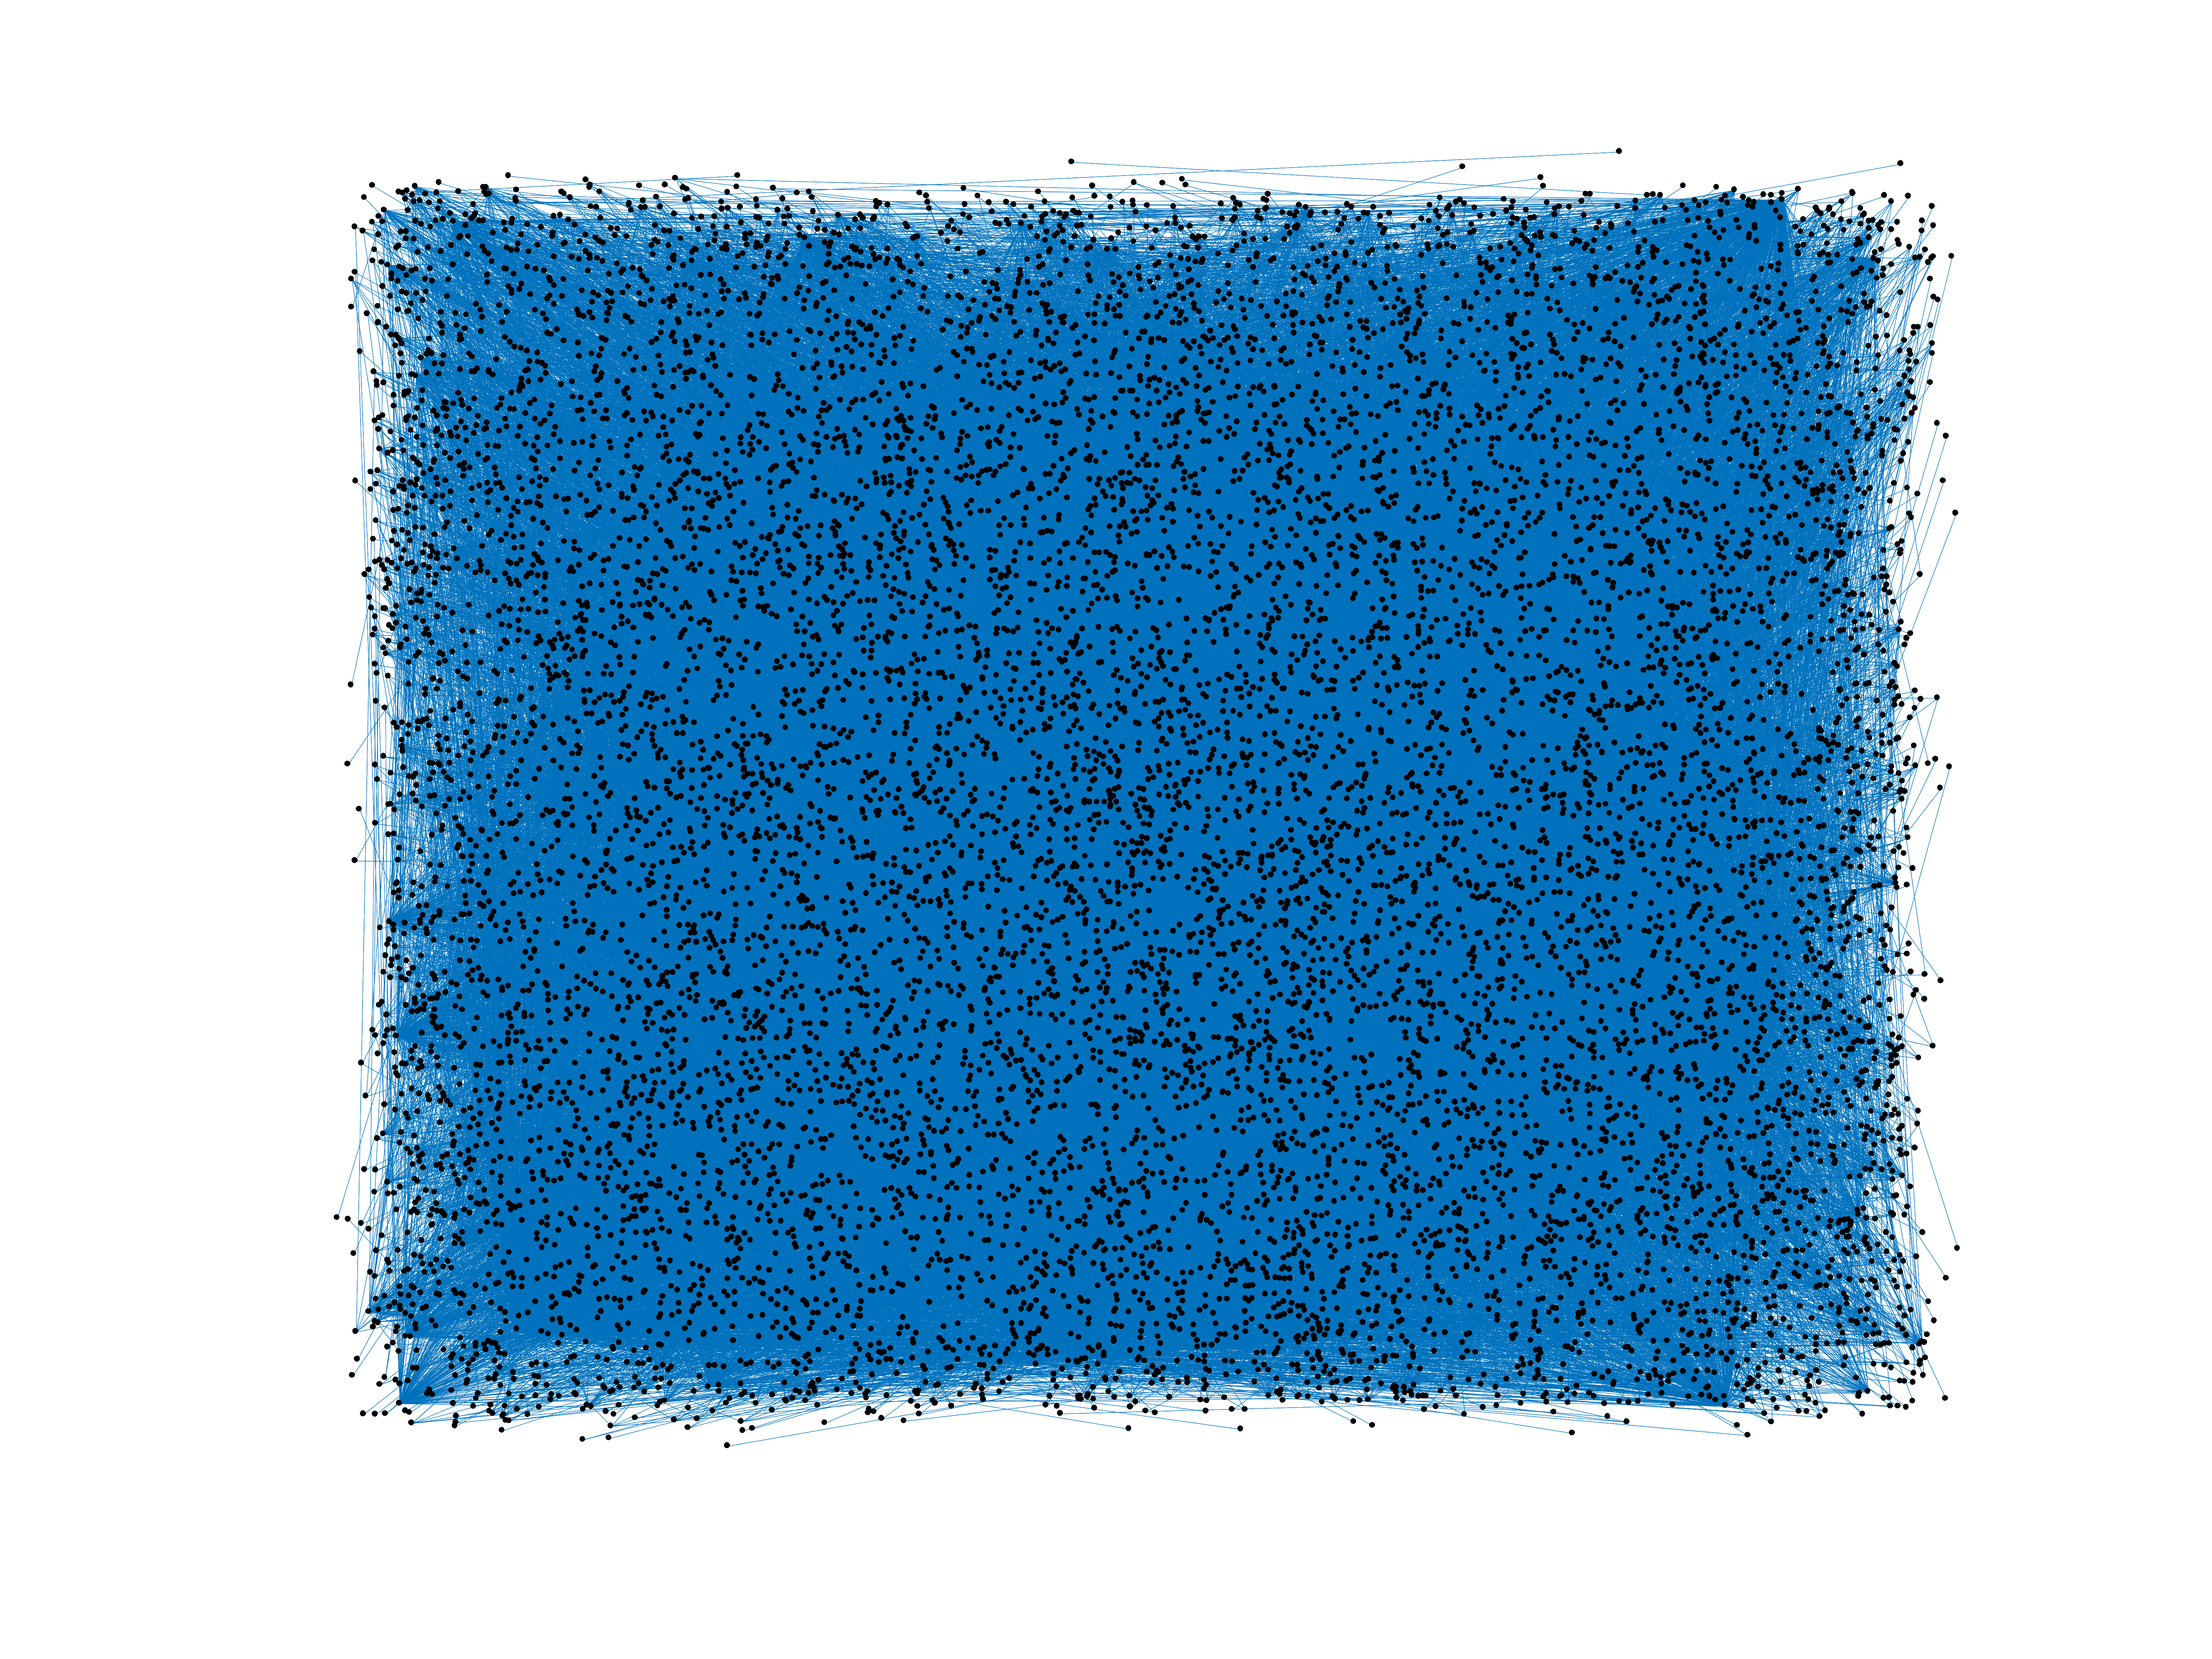
Wikipedia edits (gom)
This is the bipartite edit network of the Goan Konkani Wikipedia. It contains
users and pages from the Goan Konkani Wikipedia, connected by edit events. Each
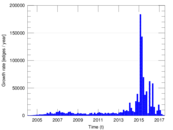
edge represents an edit. The dataset includes the timestamp of each edit.
Metadata
Statistics
| Size | n = | 11,657
|
| Left size | n1 = | 4,406
|
| Right size | n2 = | 7,251
|
| Volume | m = | 163,422
|
| Unique edge count | m̿ = | 37,558
|
| Wedge count | s = | 16,353,929
|
| Claw count | z = | 11,202,872,289
|
| Cross count | x = | 6,524,710,094,283
|
| Square count | q = | 10,623,574
|
| 4-Tour count | T4 = | 150,514,924
|
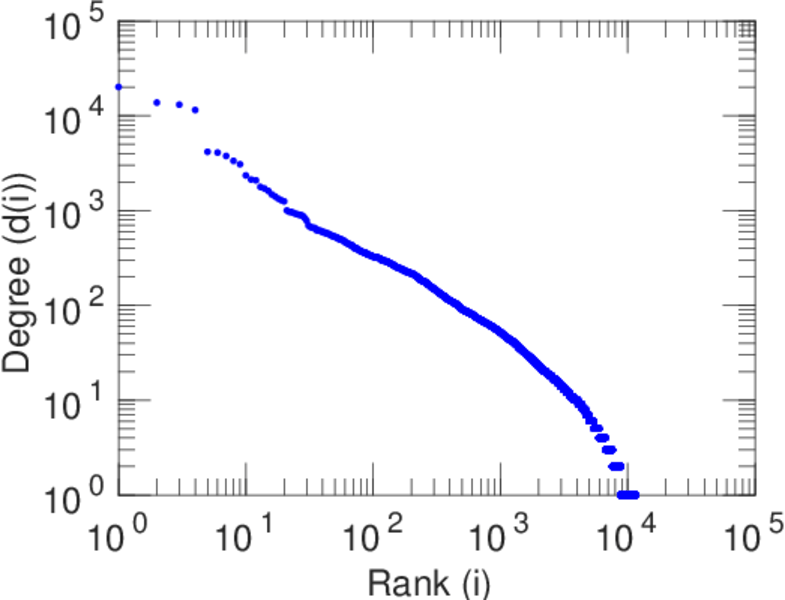
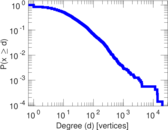
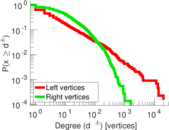
| Maximum degree | dmax = | 20,151
|
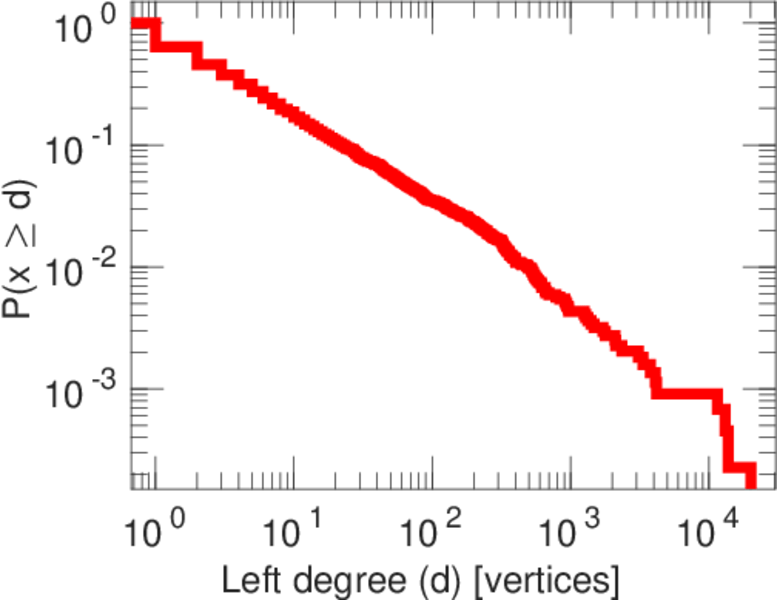
| Maximum left degree | d1max = | 20,151
|
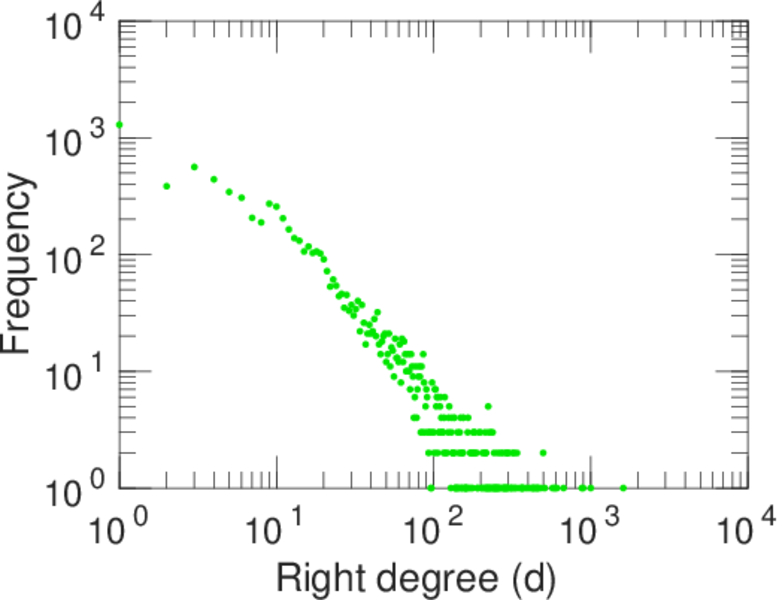
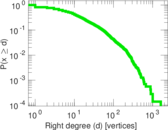
| Maximum right degree | d2max = | 1,616
|
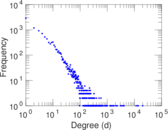
| Average degree | d = | 28.038 4
|
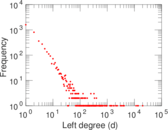
| Average left degree | d1 = | 37.090 8
|
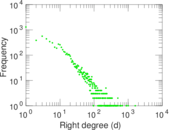
| Average right degree | d2 = | 22.537 9
|
| Fill | p = | 0.001 175 60
|
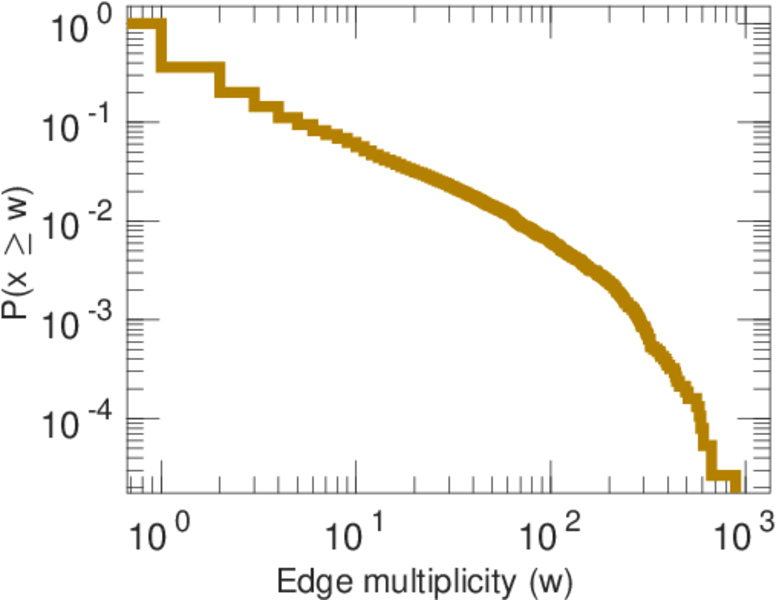
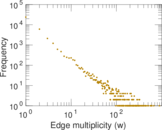
| Average edge multiplicity | m̃ = | 4.351 19
|
| Size of LCC | N = | 11,493
|
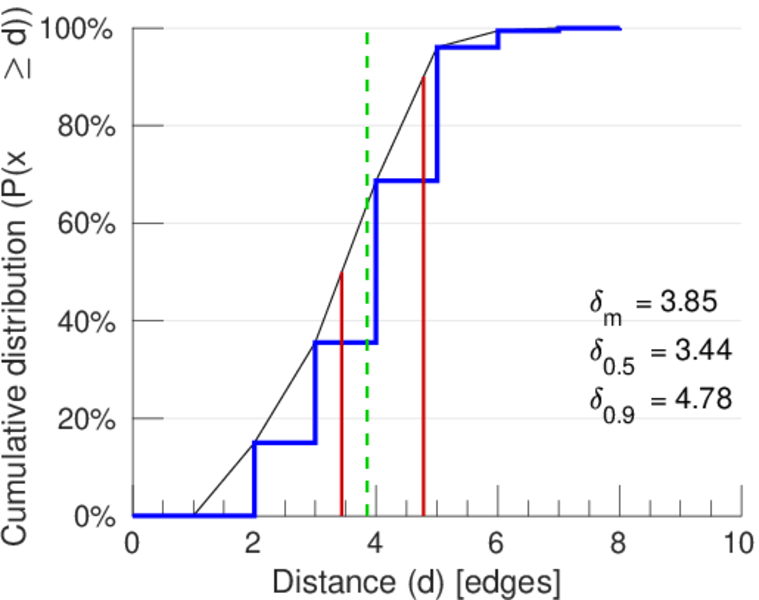
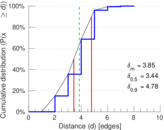
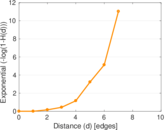
| Diameter | δ = | 9
|
| 50-Percentile effective diameter | δ0.5 = | 3.435 87
|
| 90-Percentile effective diameter | δ0.9 = | 4.779 09
|
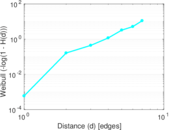
| Median distance | δM = | 4
|
| Mean distance | δm = | 3.852 58
|
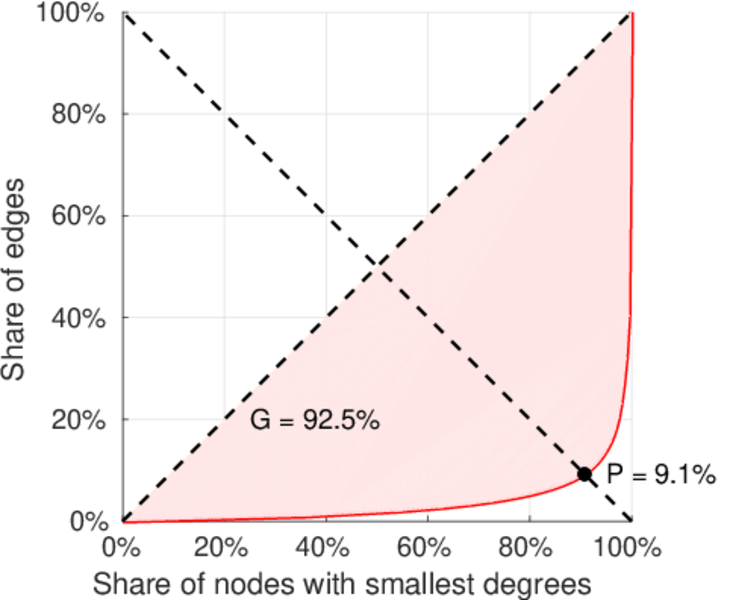
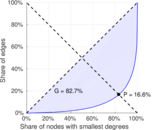
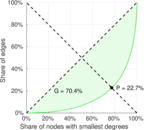
| Gini coefficient | G = | 0.795 508
|
| Balanced inequality ratio | P = | 0.185 217
|
| Left balanced inequality ratio | P1 = | 0.090 948 6
|
| Right balanced inequality ratio | P2 = | 0.226 897
|
| Relative edge distribution entropy | Her = | 0.819 154
|
| Power law exponent | γ = | 2.026 11
|
| Tail power law exponent | γt = | 2.231 00
|
| Tail power law exponent with p | γ3 = | 2.231 00
|
| p-value | p = | 0.057 000 0
|
| Left tail power law exponent with p | γ3,1 = | 1.901 00
|
| Left p-value | p1 = | 0.370 000
|
| Right tail power law exponent with p | γ3,2 = | 2.761 00
|
| Right p-value | p2 = | 0.000 00
|
| Degree assortativity | ρ = | −0.348 487
|
| Degree assortativity p-value | pρ = | 0.000 00
|
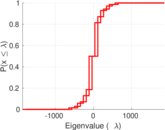
| Spectral norm | α = | 1,857.90
|
| Algebraic connectivity | a = | 0.058 590 1
|
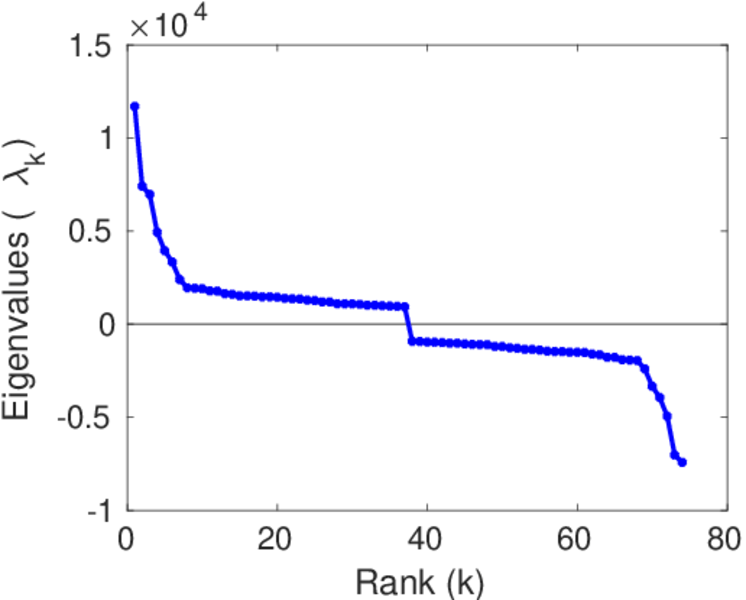
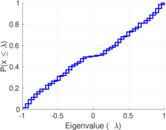
| Spectral separation | |λ1[A] / λ2[A]| = | 1.053 16
|
| Controllability | C = | 8,580
|
| Relative controllability | Cr = | 0.736 734
|
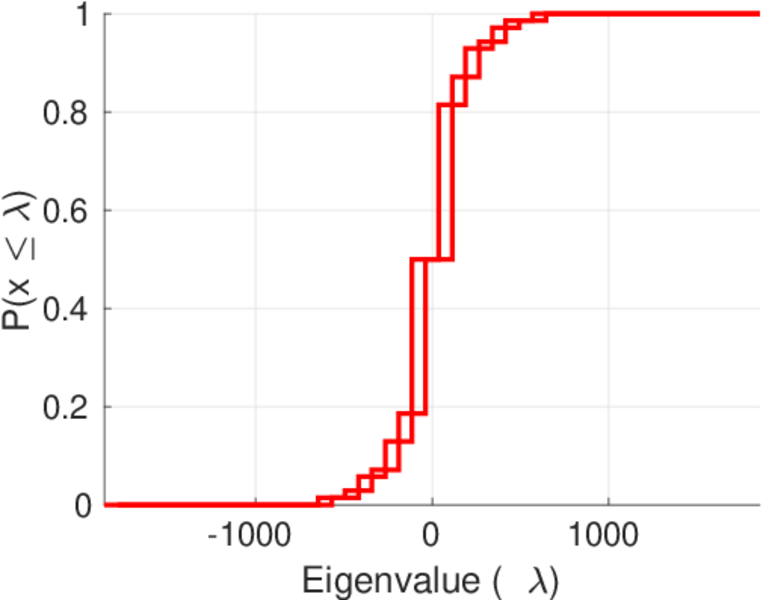
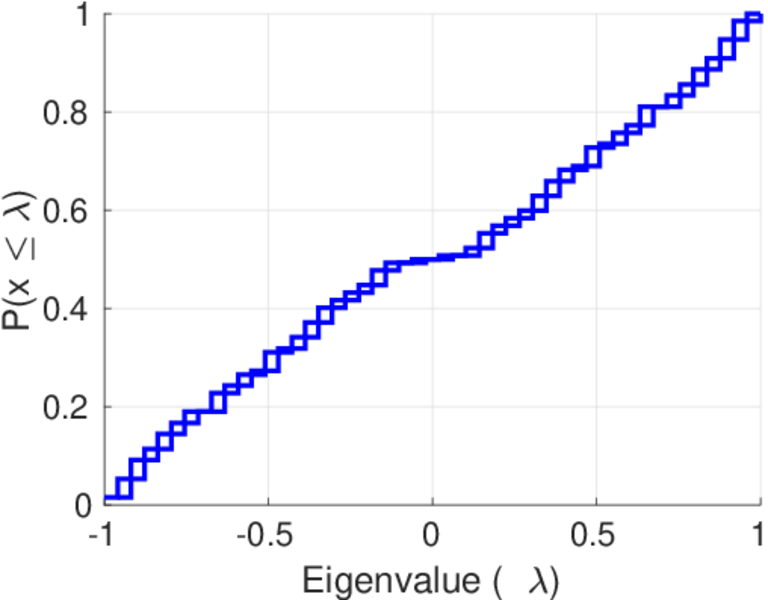
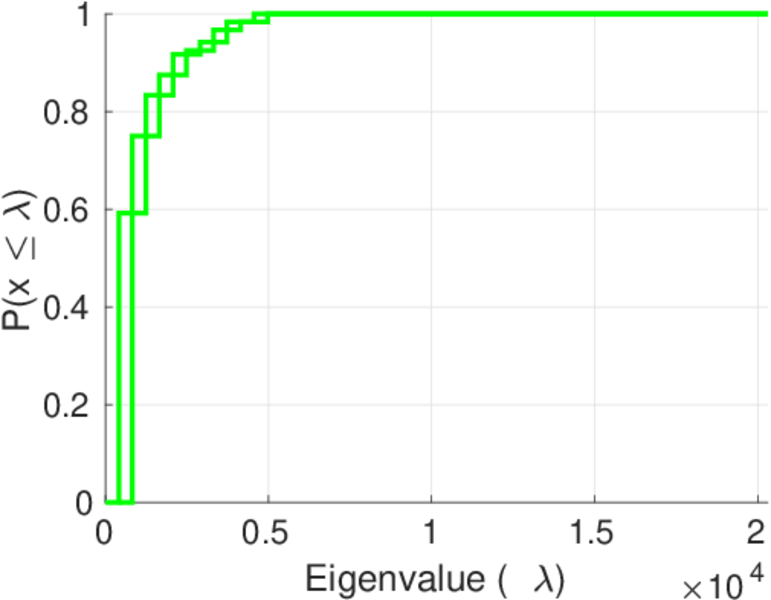
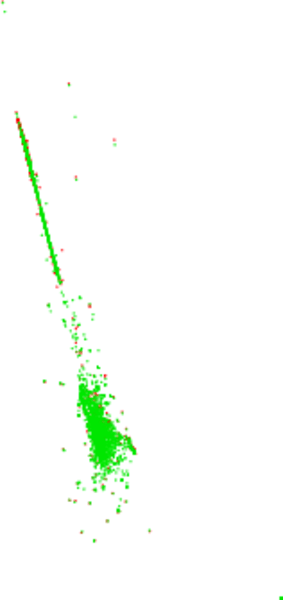
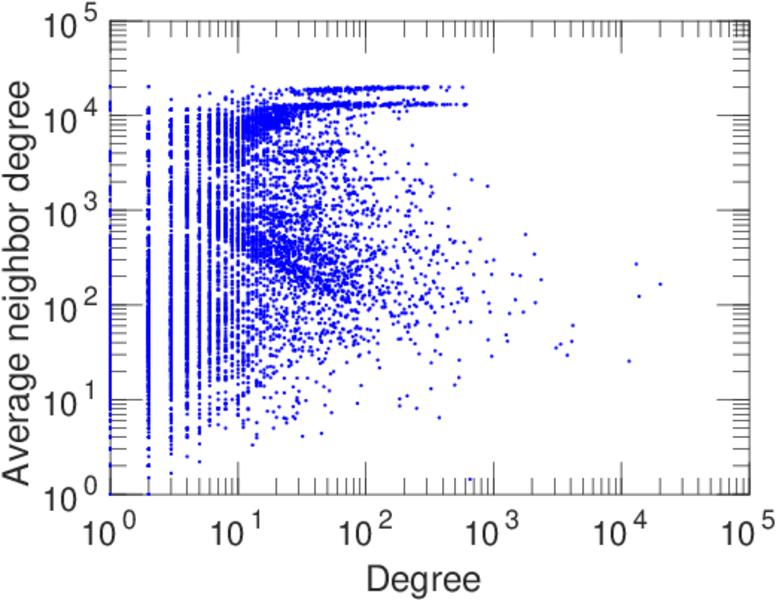
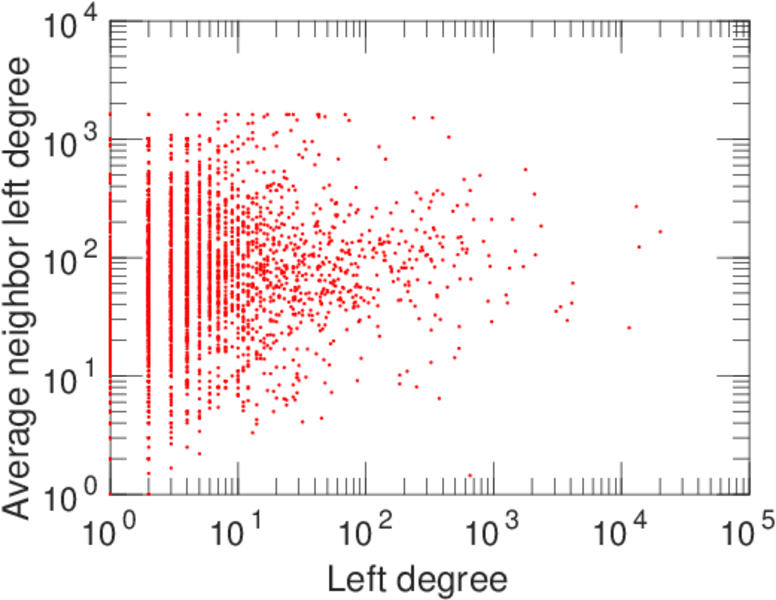
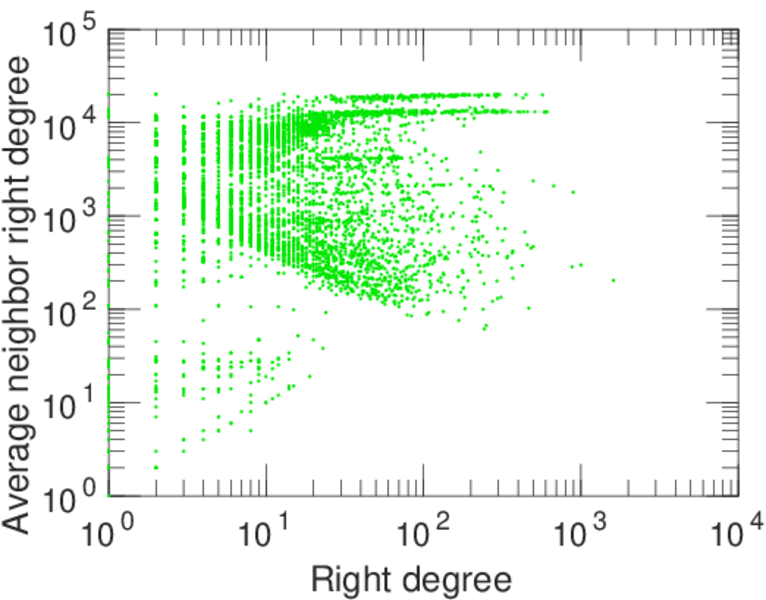
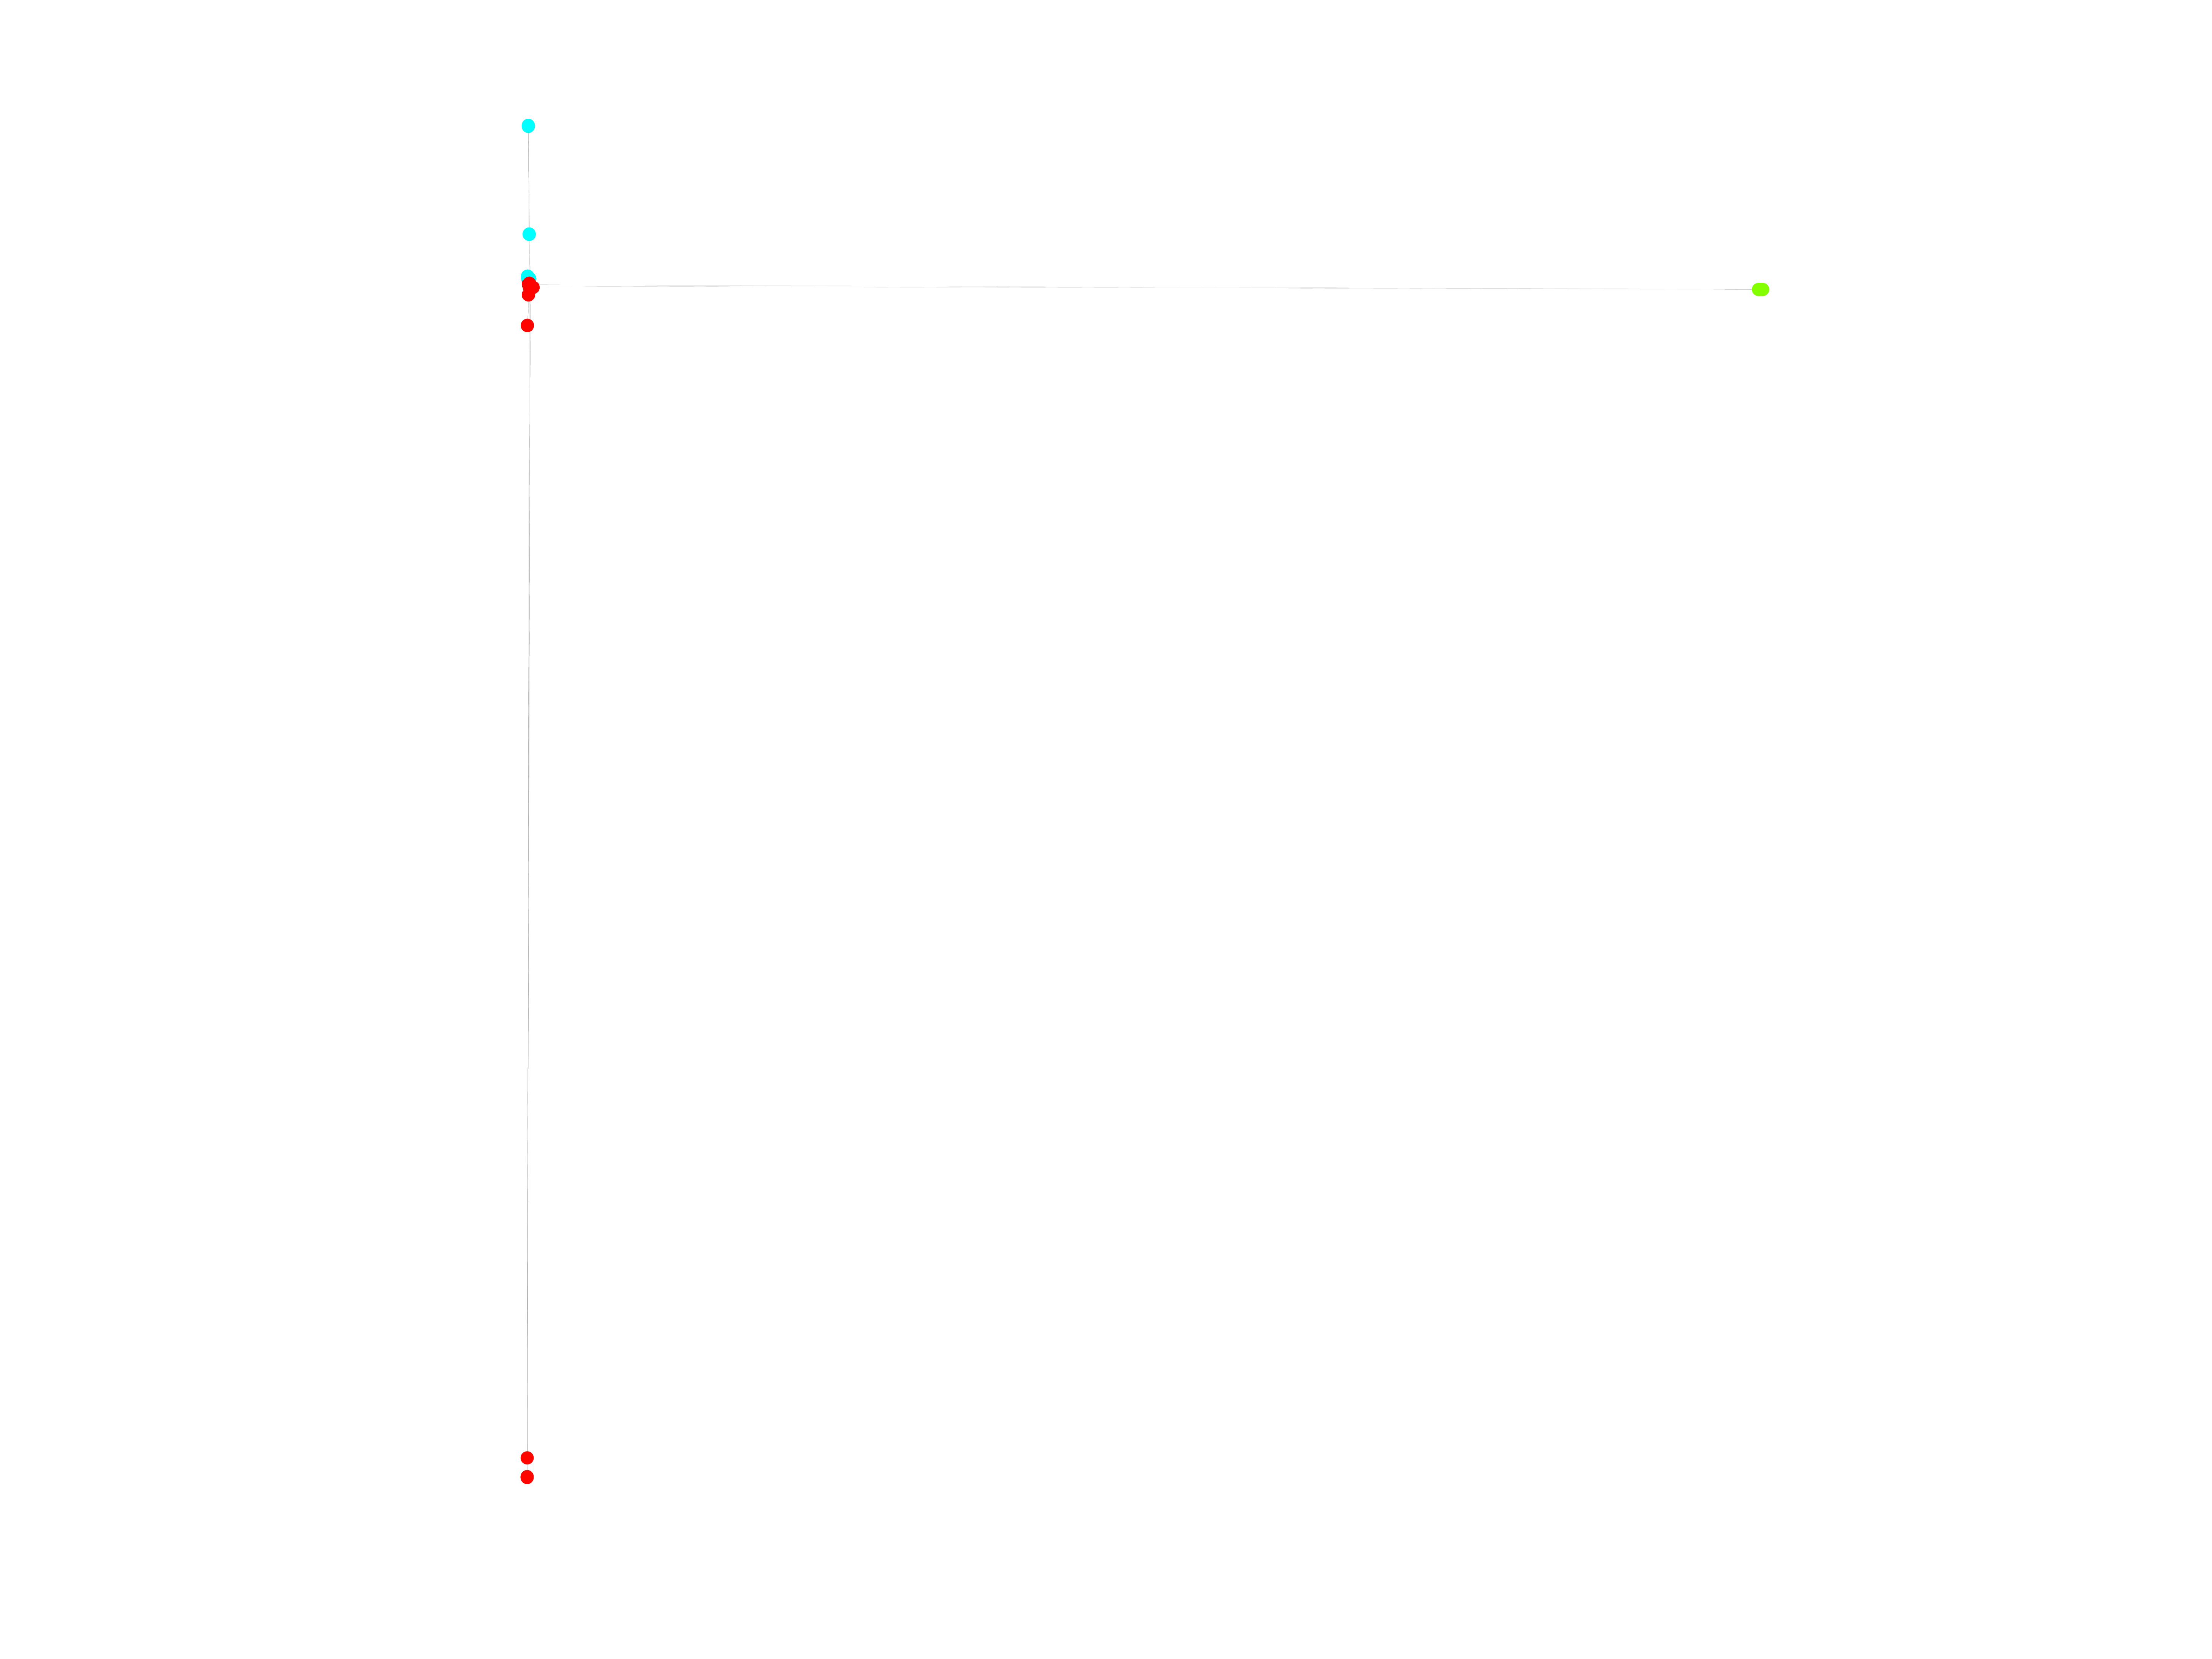
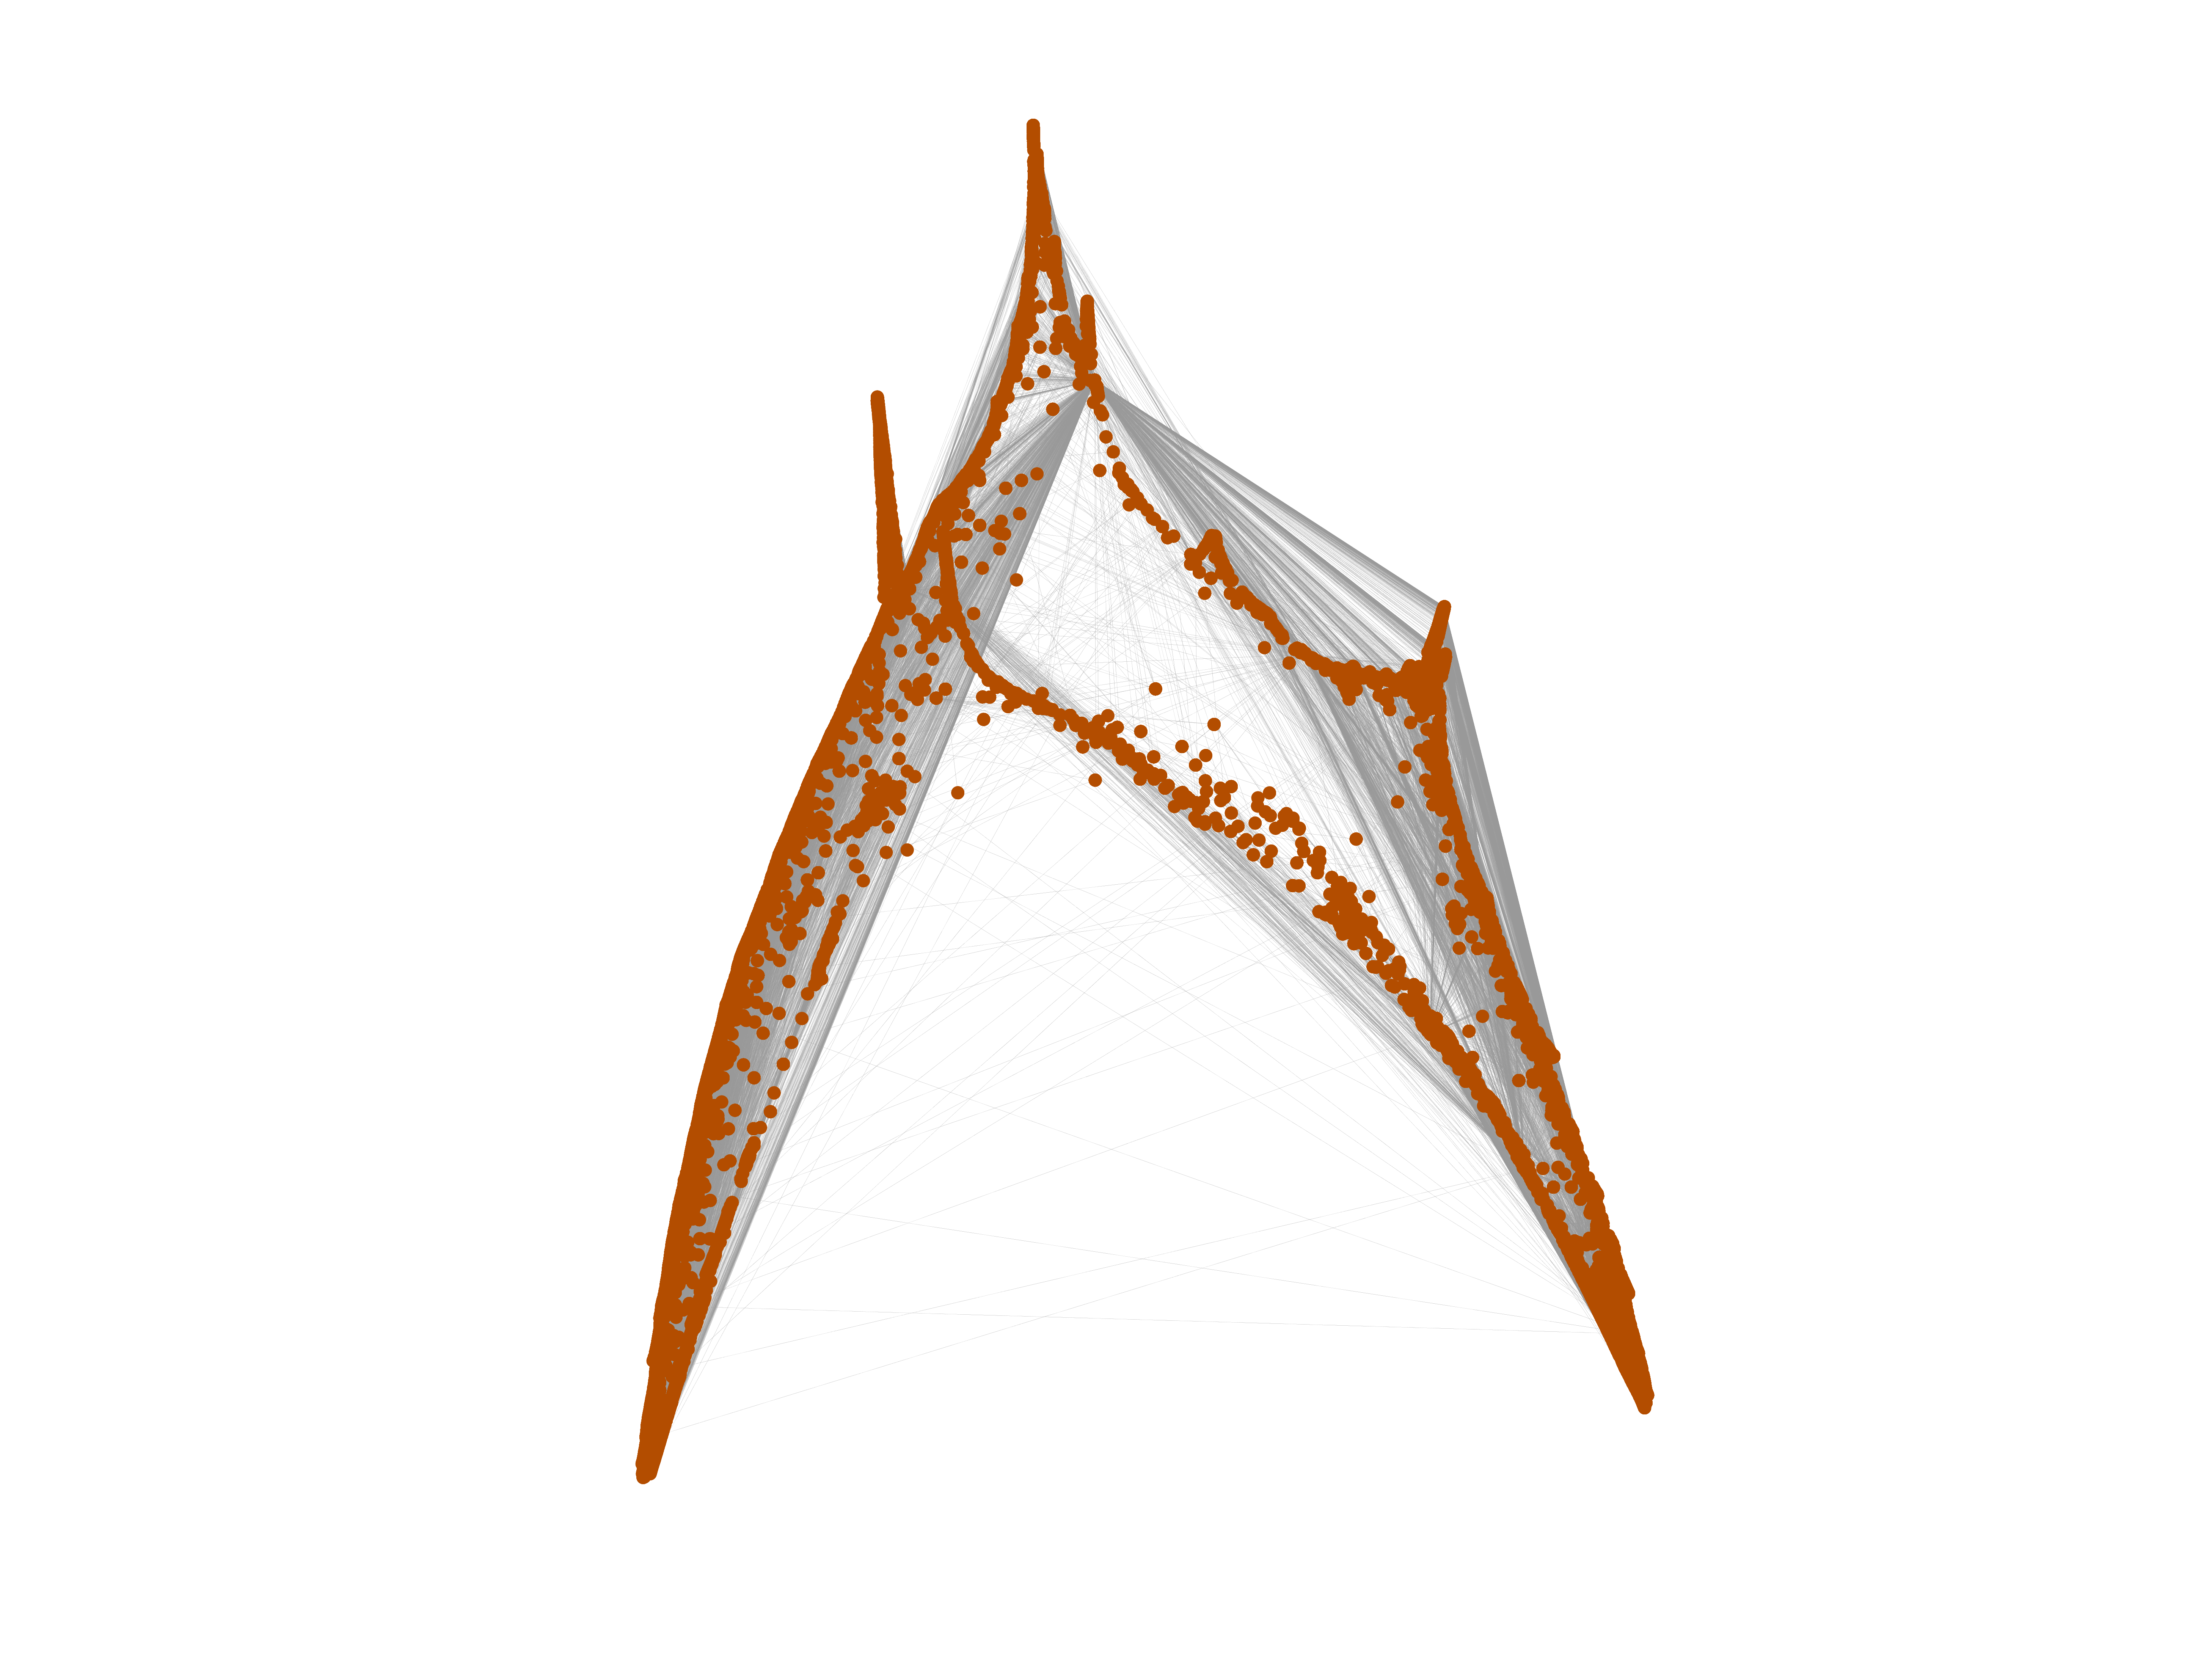
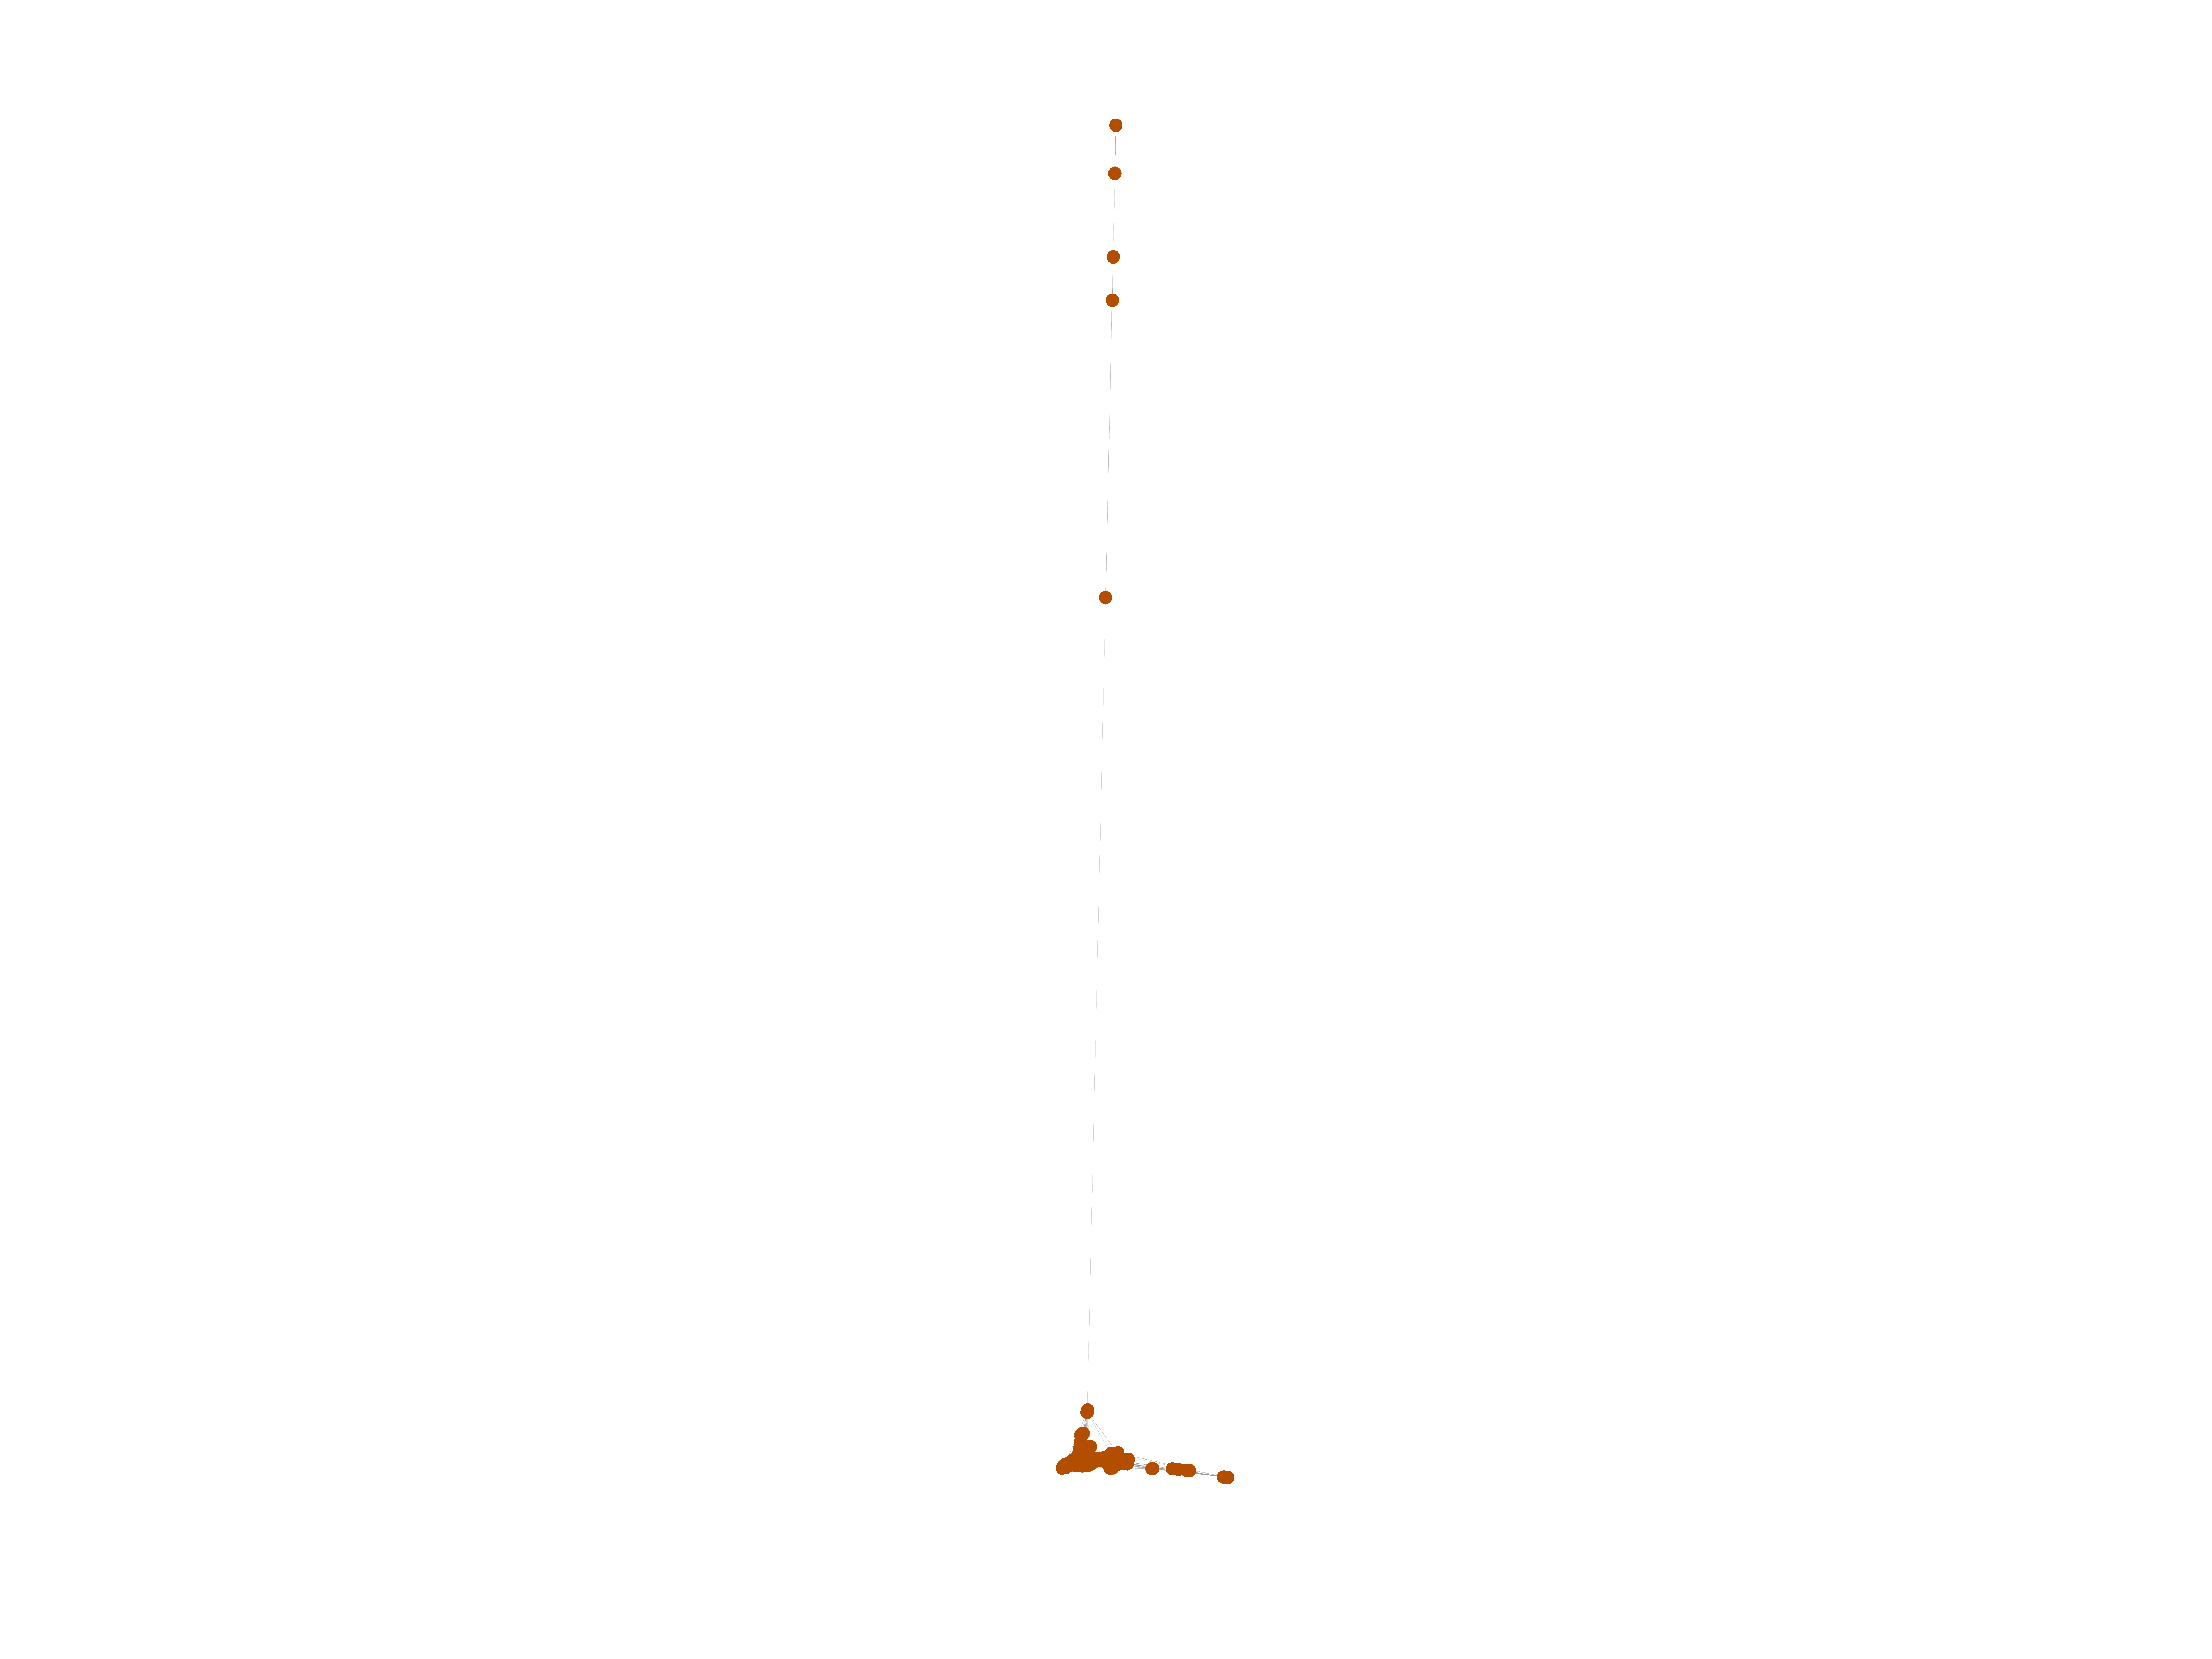
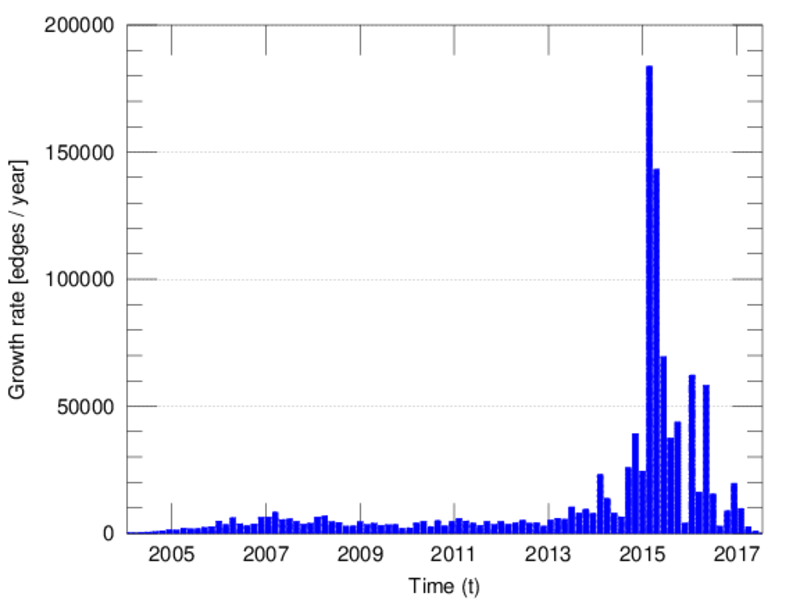
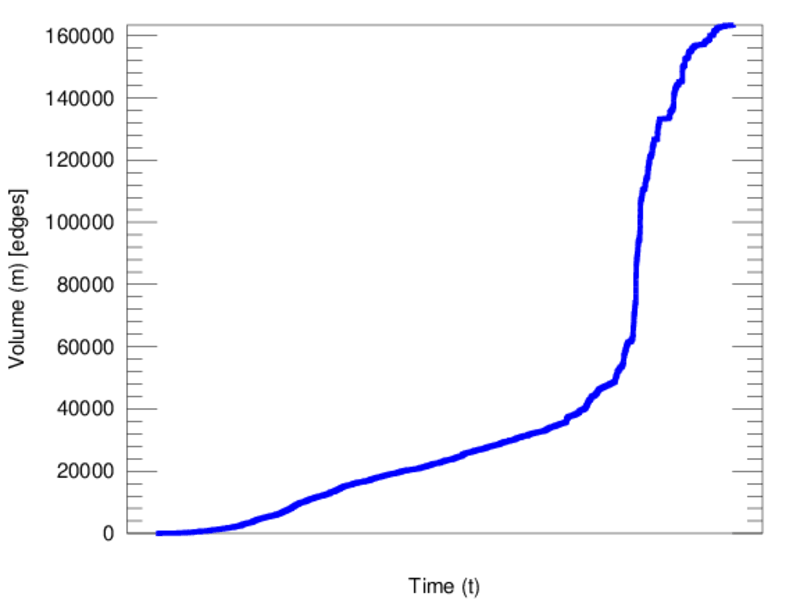
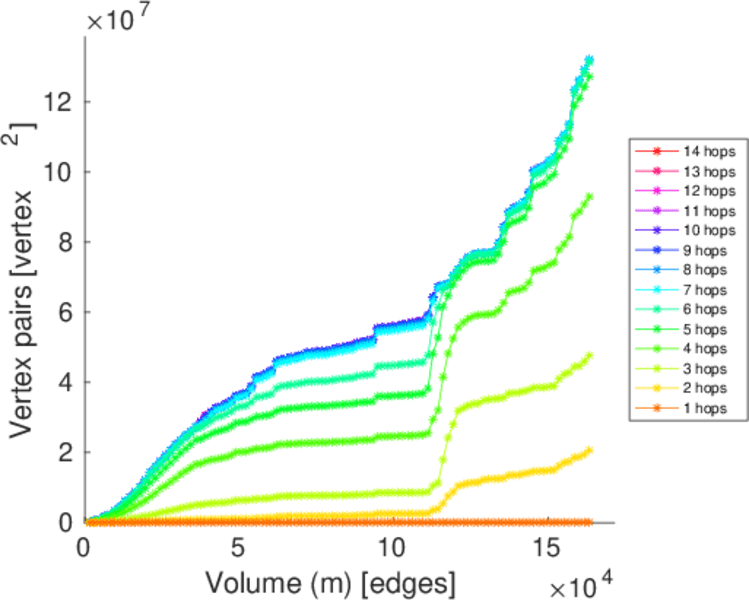
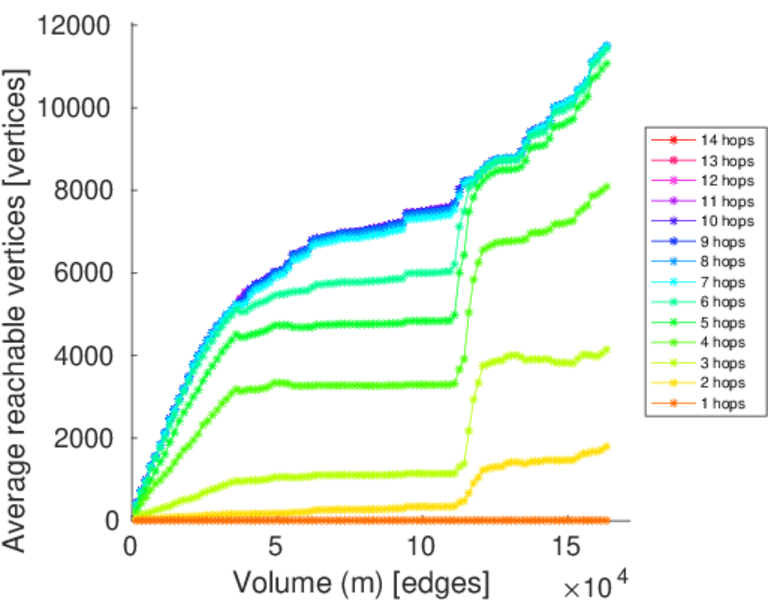
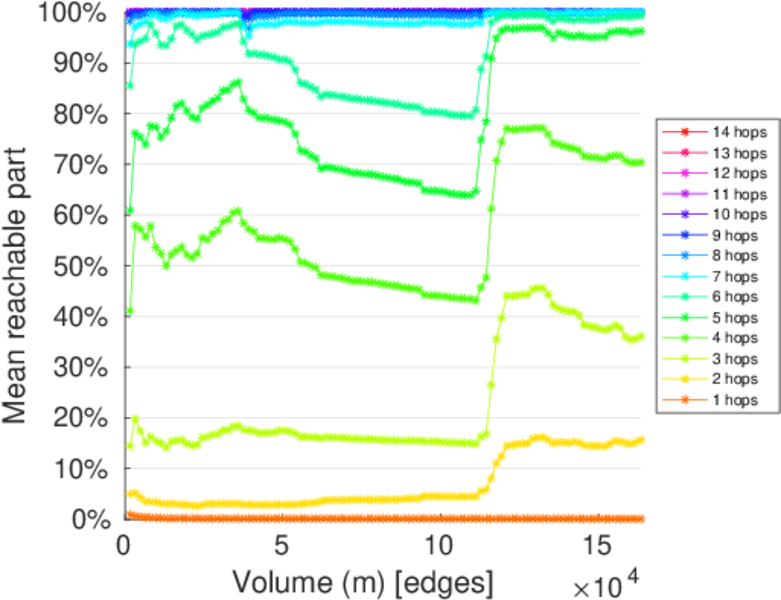
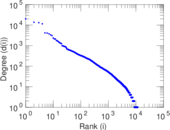
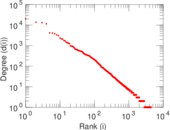
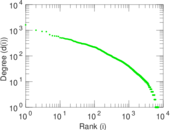
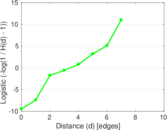
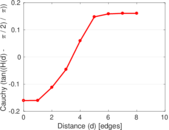
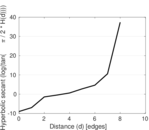
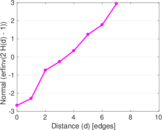
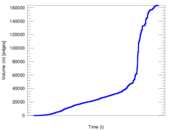
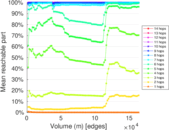
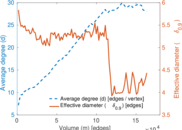
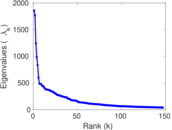
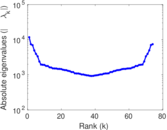
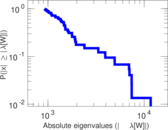
Plots


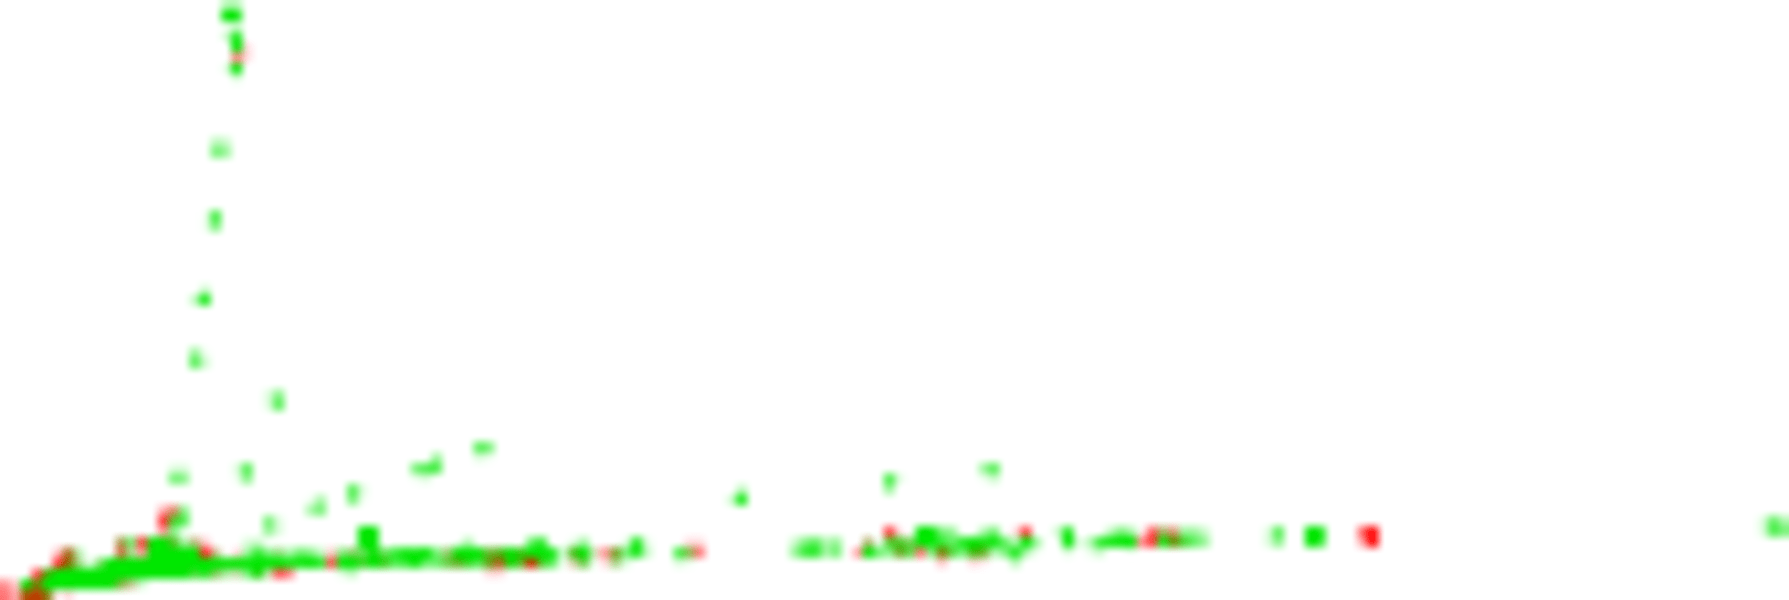
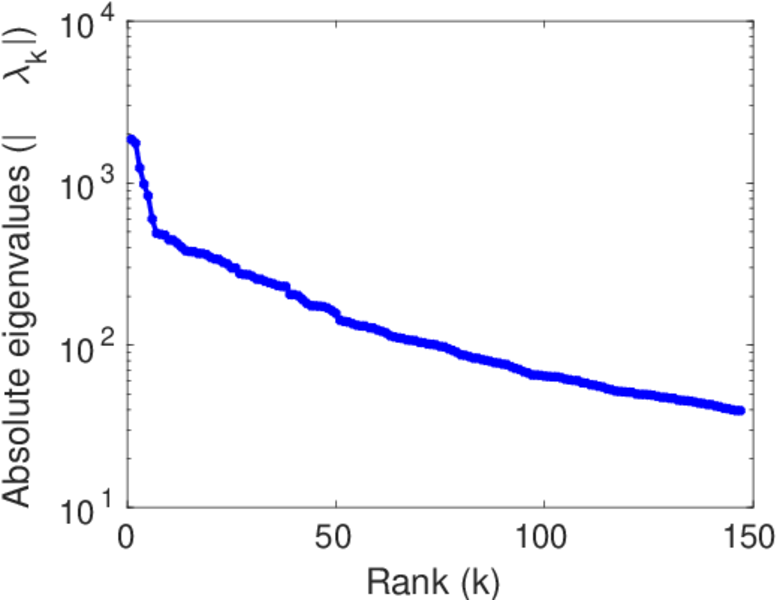
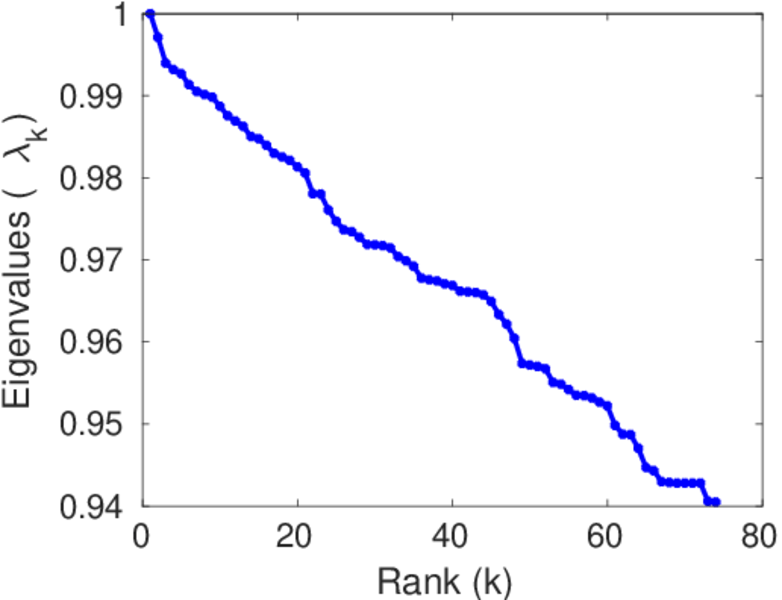
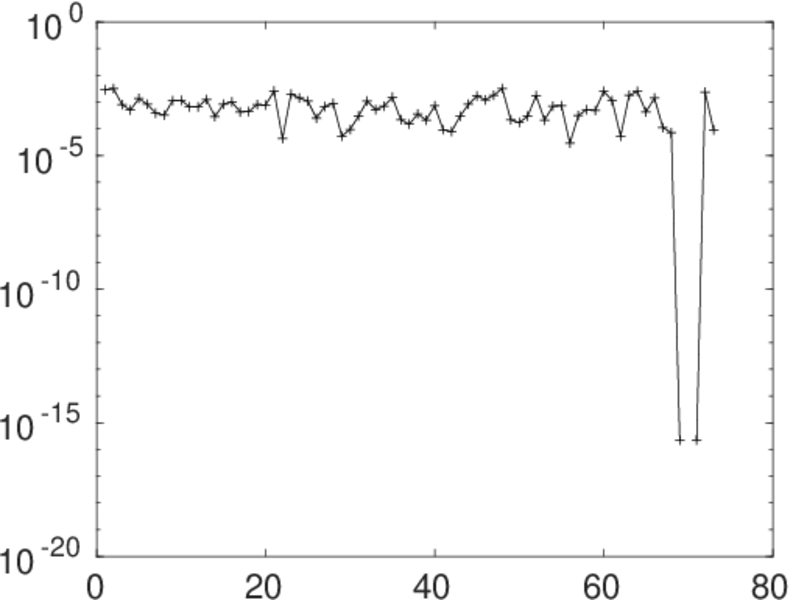
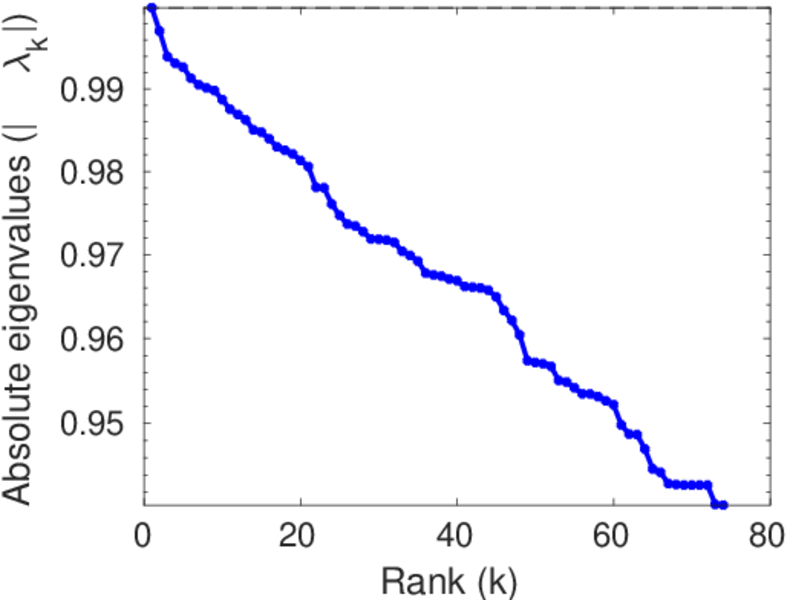
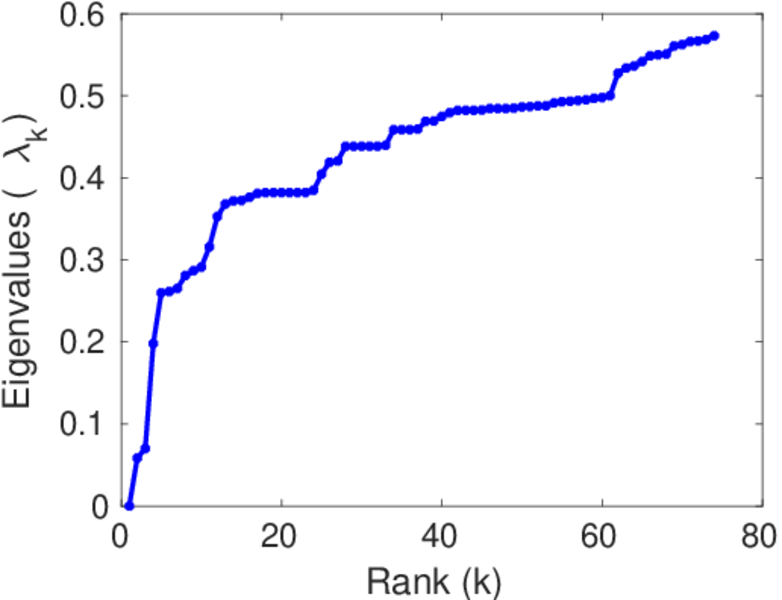
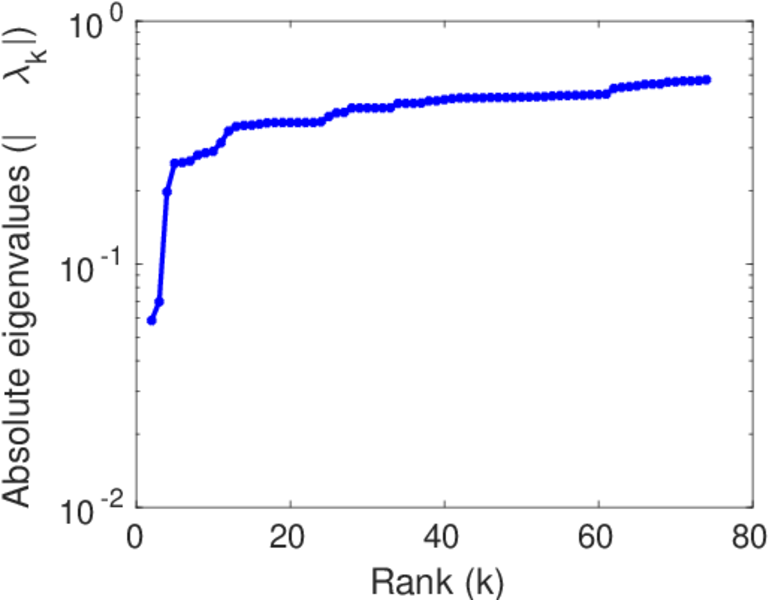
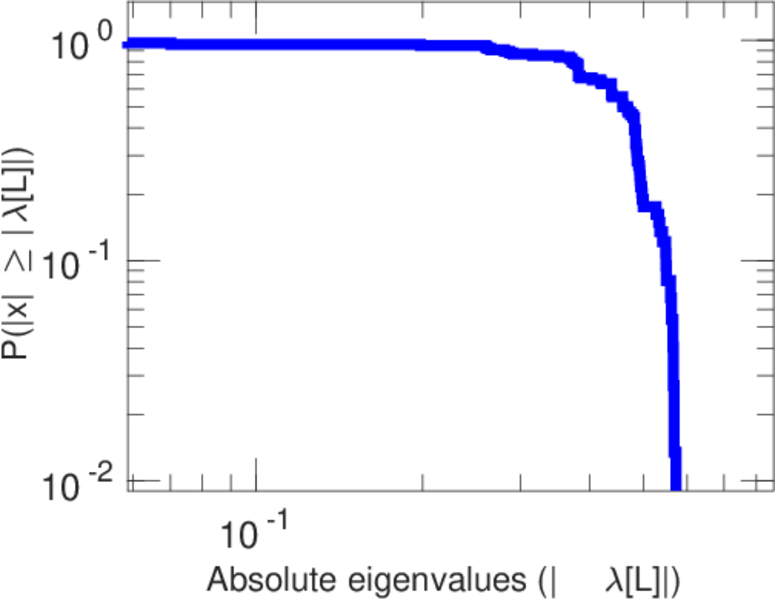
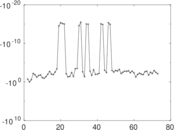
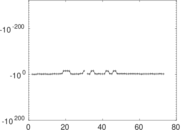
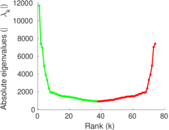
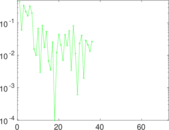
Matrix decompositions plots


Downloads
References
|
[1]
|
Jérôme Kunegis.
KONECT – The Koblenz Network Collection.
In Proc. Int. Conf. on World Wide Web Companion, pages
1343–1350, 2013.
[ http ]
|
|
[2]
|
Wikimedia Foundation.
Wikimedia downloads.
http://dumps.wikimedia.org/, January 2010.
|
 KONECT ‣ Networks ‣
Buy Me a Coffee
KONECT ‣ Networks ‣
Buy Me a Coffee