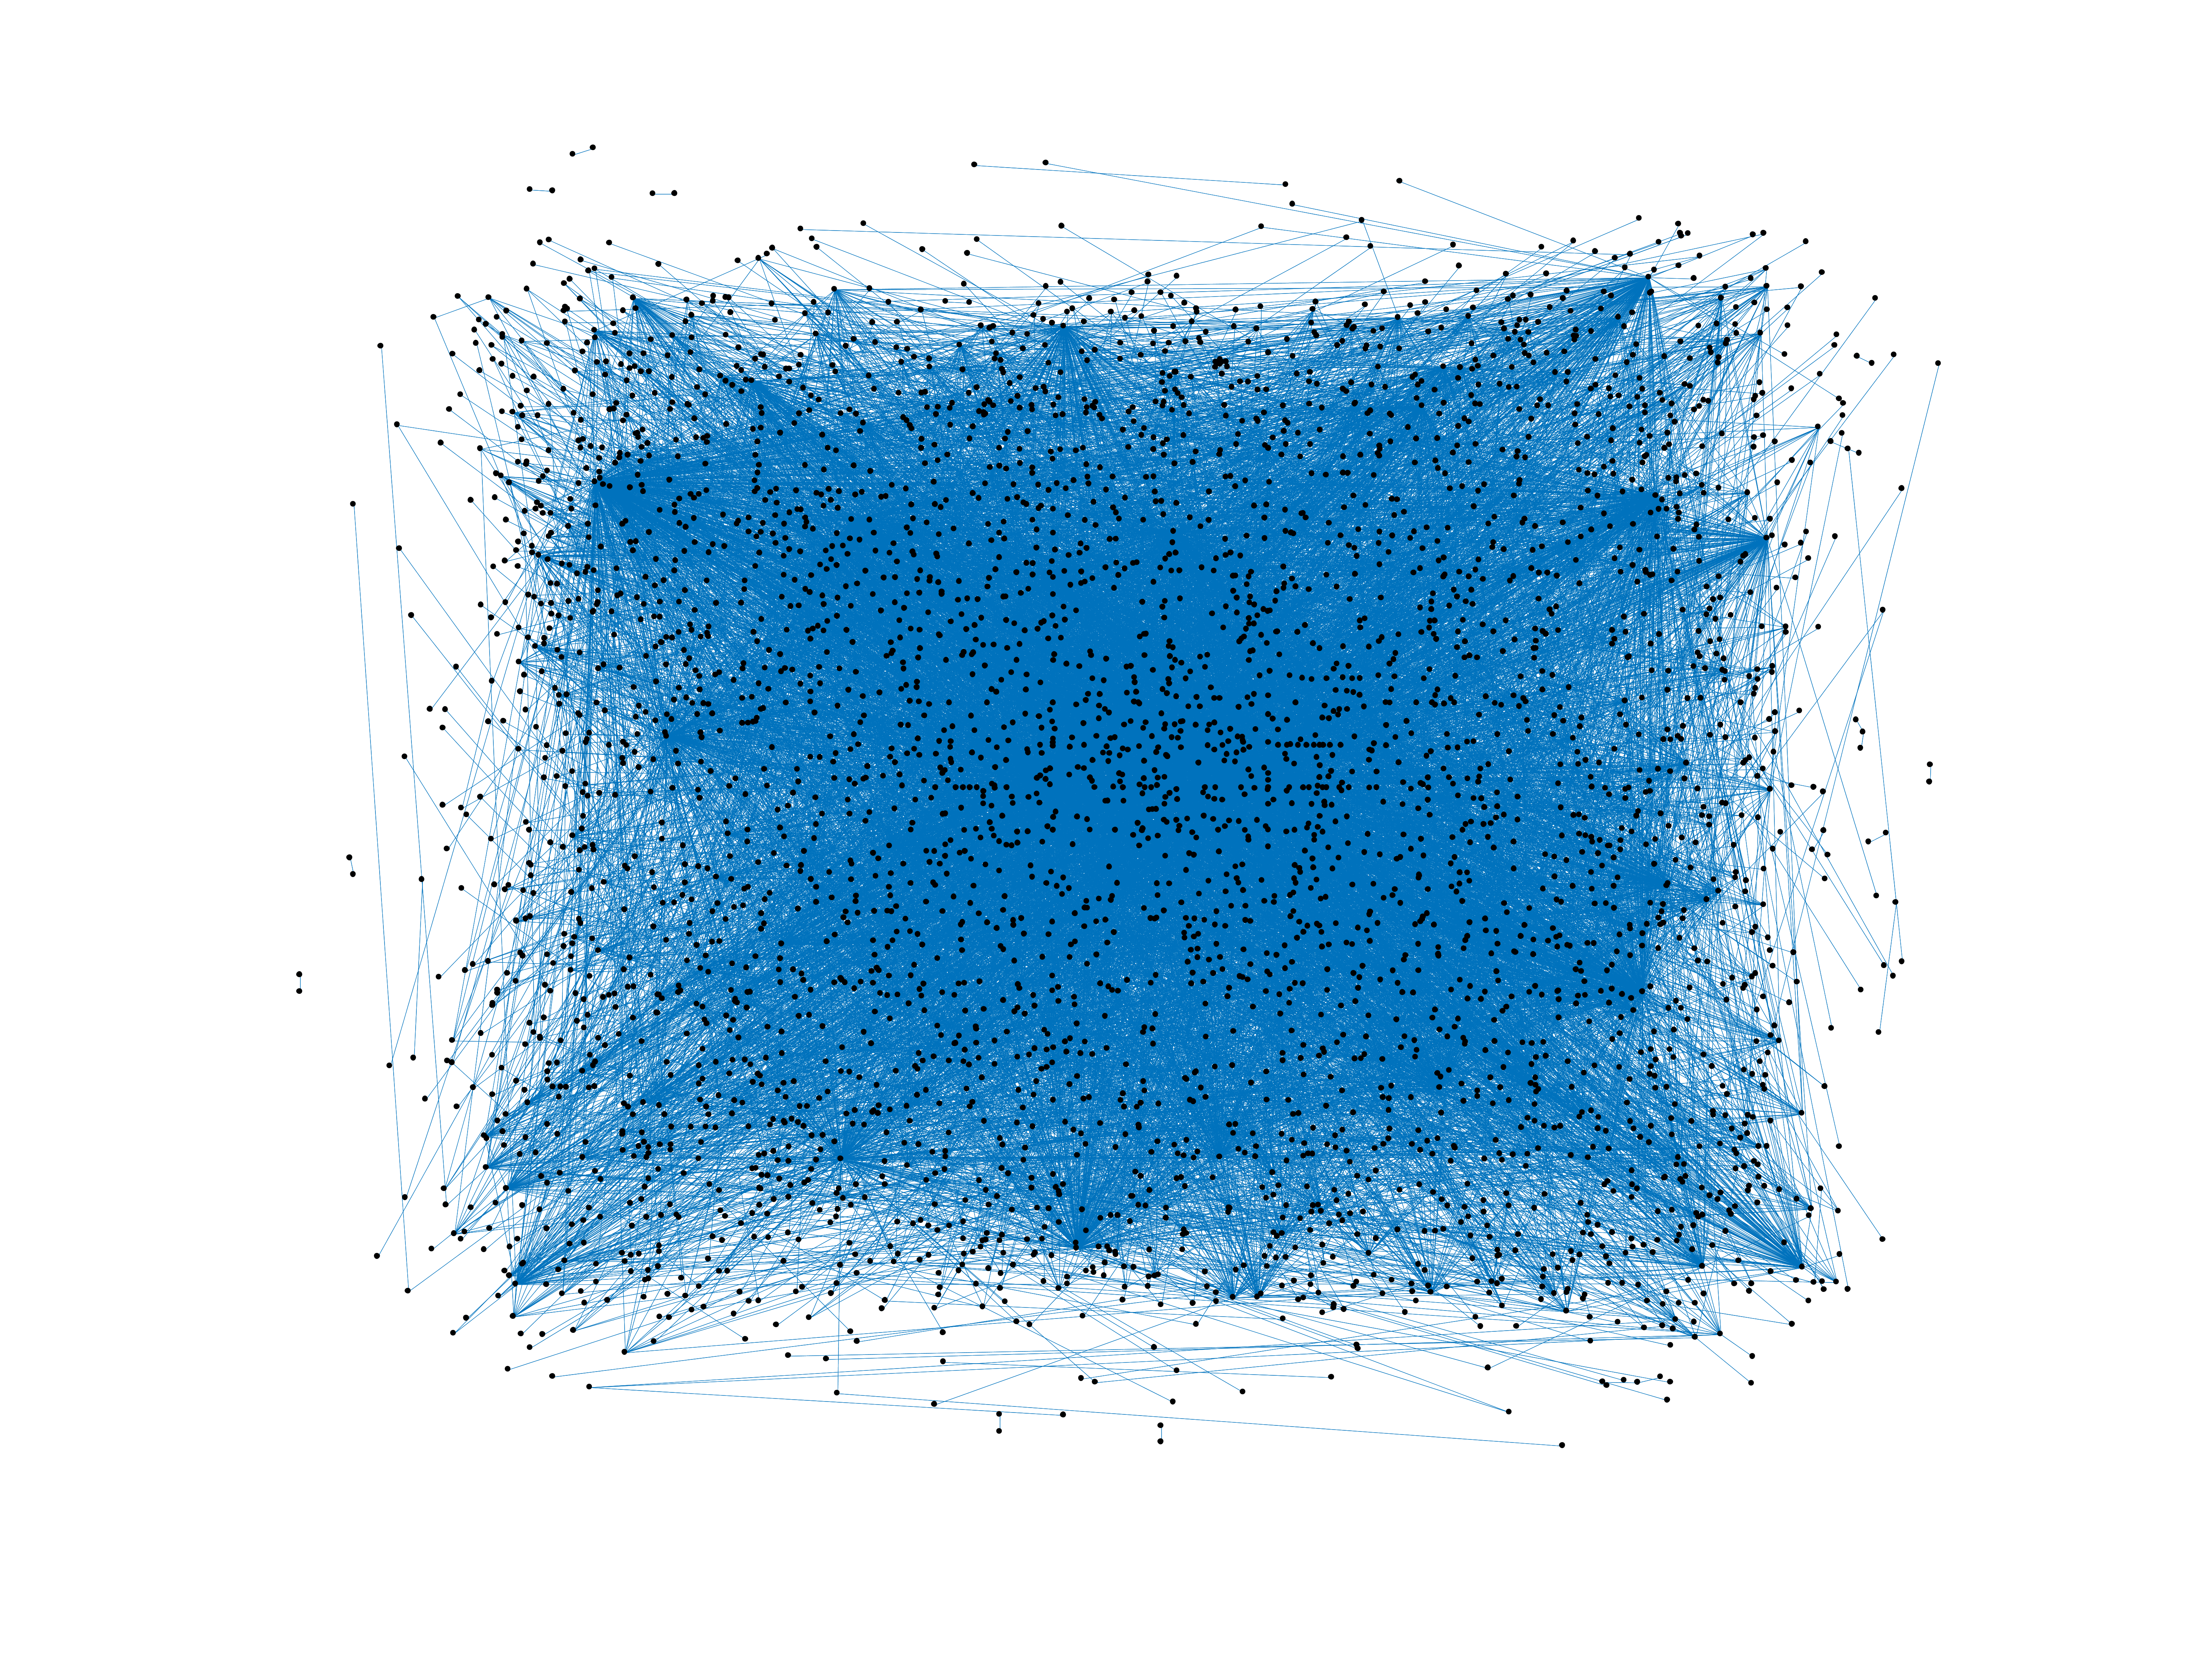
Wikipedia edits (got)
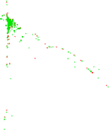
This is the bipartite edit network of the Wikipedia. It contains users and
pages from the Wikipedia, connected by edit events. Each edge represents an
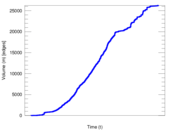
edit. The dataset includes the timestamp of each edit.
Metadata
Statistics
| Size | n = | 3,939
|
| Left size | n1 = | 719
|
| Right size | n2 = | 3,220
|
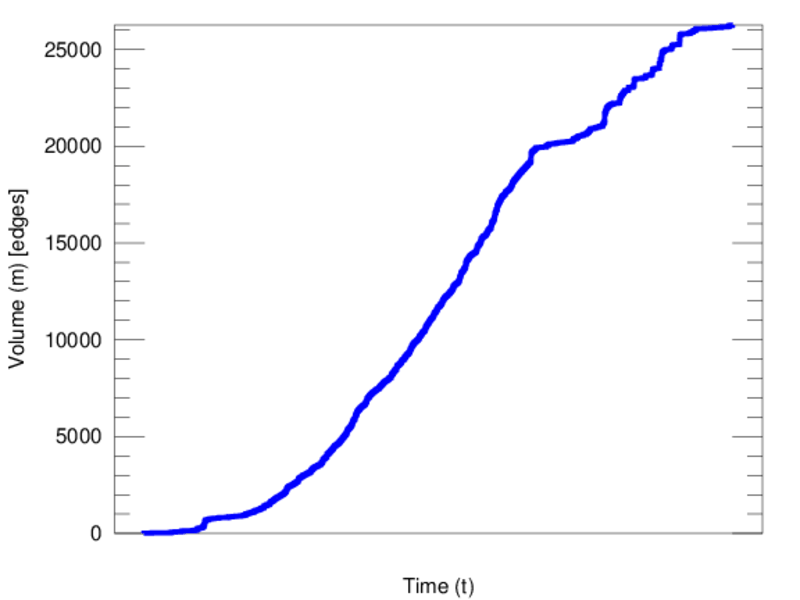
| Volume | m = | 26,259
|
| Unique edge count | m̿ = | 10,885
|
| Wedge count | s = | 1,395,079
|
| Claw count | z = | 250,950,061
|
| Cross count | x = | 47,160,771,648
|
| Square count | q = | 1,710,357
|
| 4-Tour count | T4 = | 19,297,166
|
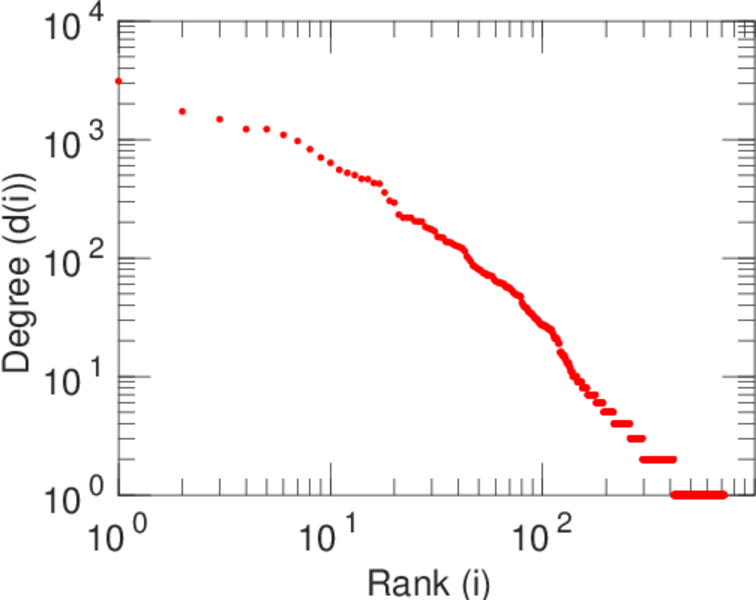
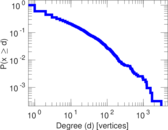
| Maximum degree | dmax = | 3,110
|
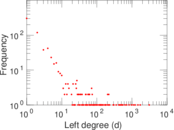
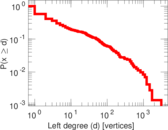
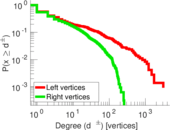
| Maximum left degree | d1max = | 3,110
|
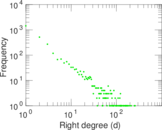
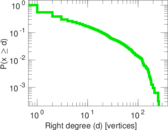
| Maximum right degree | d2max = | 258
|
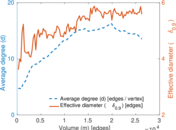
| Average degree | d = | 13.332 8
|
| Average left degree | d1 = | 36.521 6
|
| Average right degree | d2 = | 8.154 97
|
| Fill | p = | 0.004 701 58
|
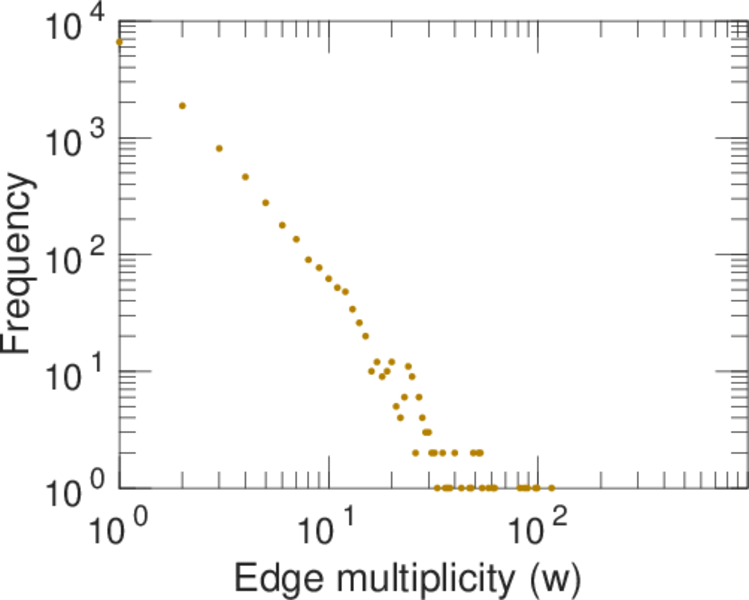
| Average edge multiplicity | m̃ = | 2.412 40
|
| Size of LCC | N = | 3,250
|
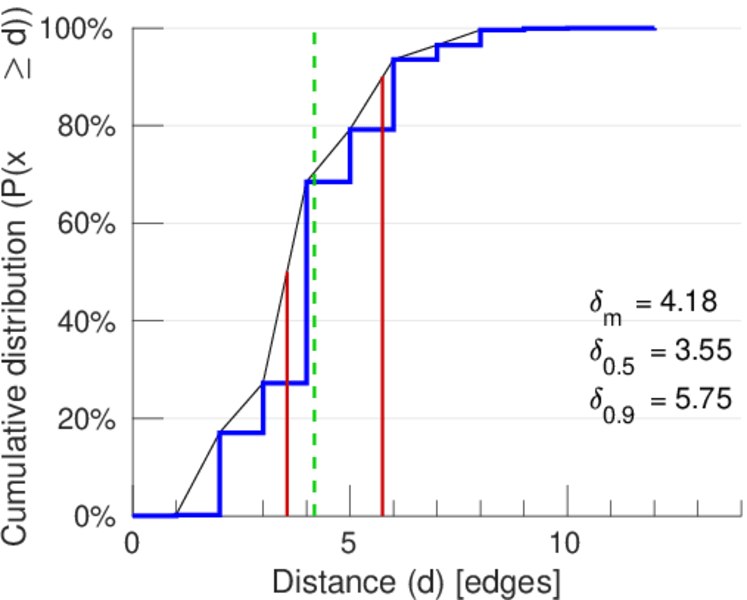
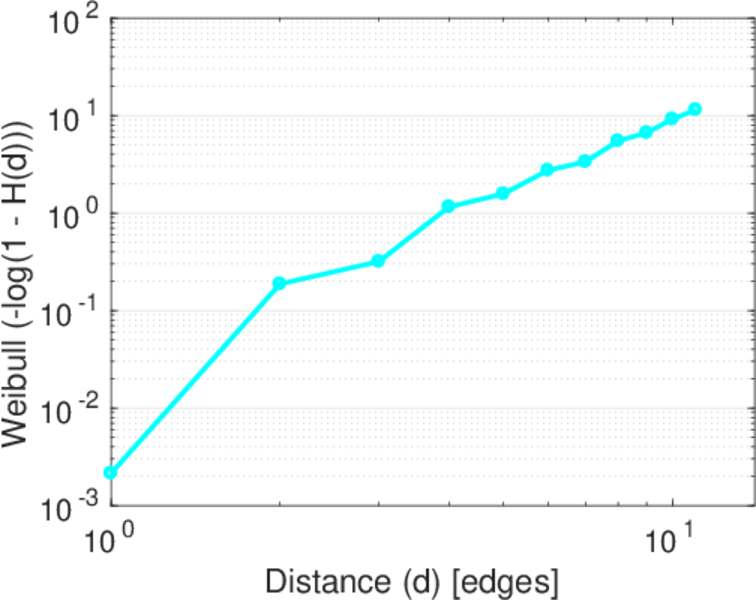
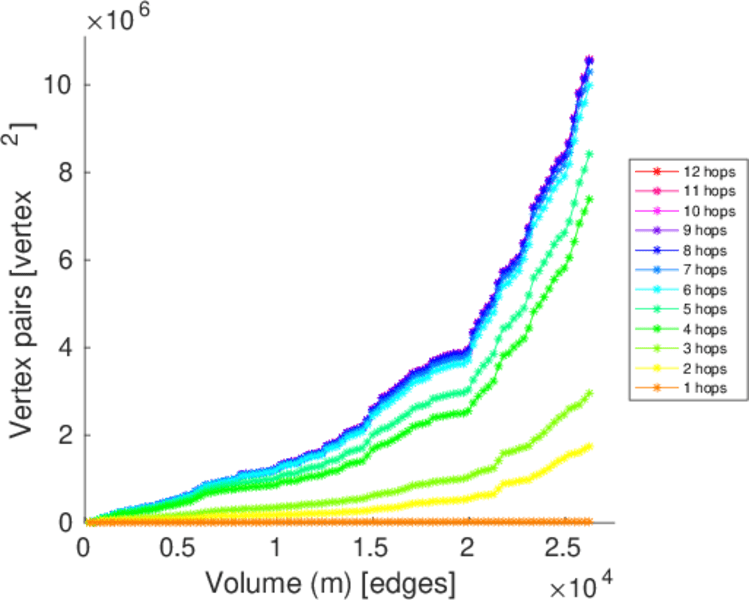
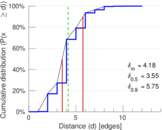
| Diameter | δ = | 12
|
| 50-Percentile effective diameter | δ0.5 = | 3.552 42
|
| 90-Percentile effective diameter | δ0.9 = | 5.753 85
|
| Median distance | δM = | 4
|
| Mean distance | δm = | 4.183 68
|
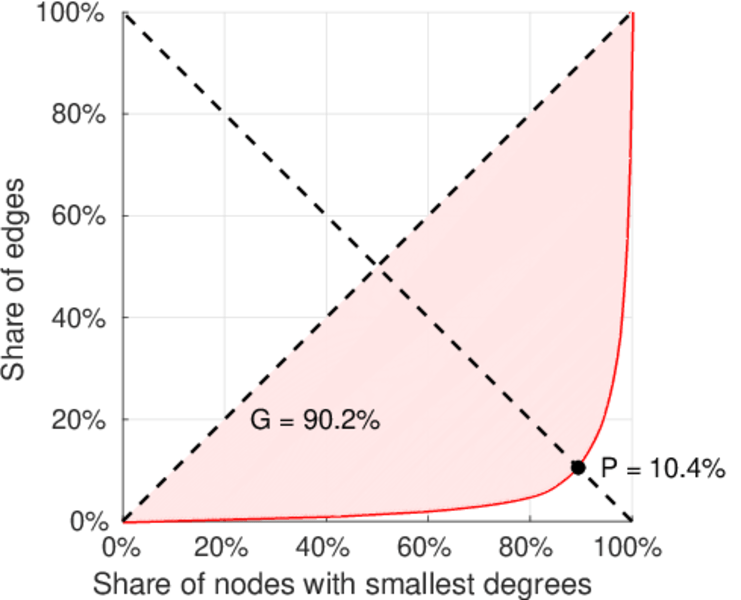
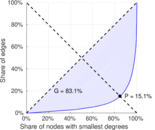
| Gini coefficient | G = | 0.835 423
|
| Balanced inequality ratio | P = | 0.151 681
|
| Left balanced inequality ratio | P1 = | 0.103 812
|
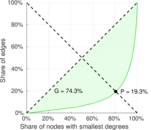
| Right balanced inequality ratio | P2 = | 0.193 077
|
| Relative edge distribution entropy | Her = | 0.807 132
|
| Power law exponent | γ = | 2.510 47
|
| Tail power law exponent | γt = | 1.911 00
|
| Tail power law exponent with p | γ3 = | 1.911 00
|
| p-value | p = | 0.000 00
|
| Left tail power law exponent with p | γ3,1 = | 1.691 00
|
| Left p-value | p1 = | 0.000 00
|
| Right tail power law exponent with p | γ3,2 = | 1.981 00
|
| Right p-value | p2 = | 0.000 00
|
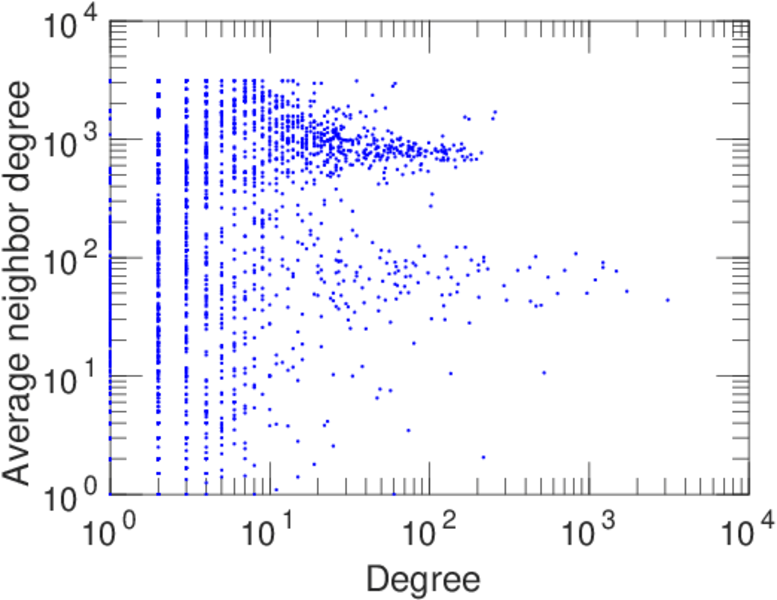
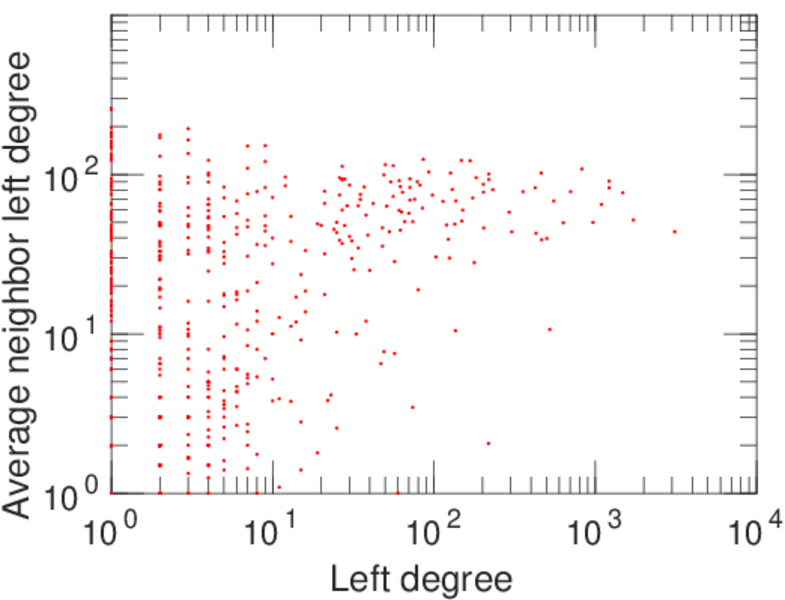
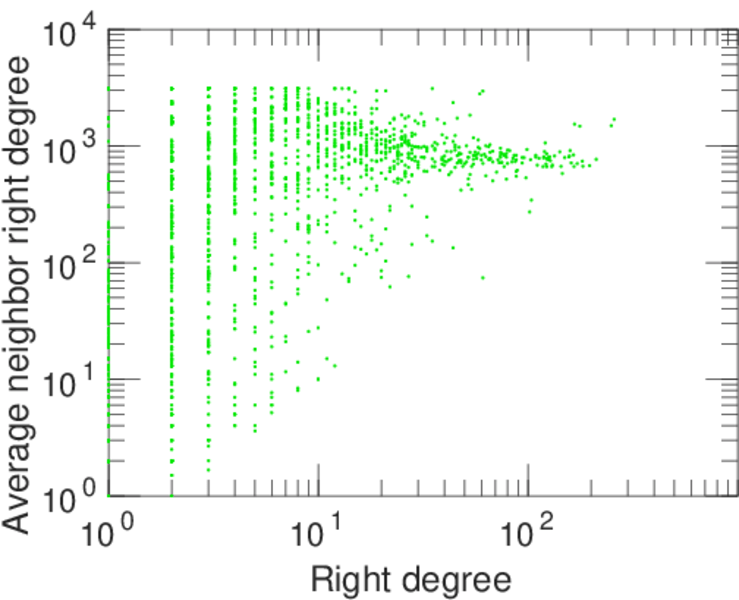
| Degree assortativity | ρ = | −0.239 027
|
| Degree assortativity p-value | pρ = | 2.983 07 × 10−141
|
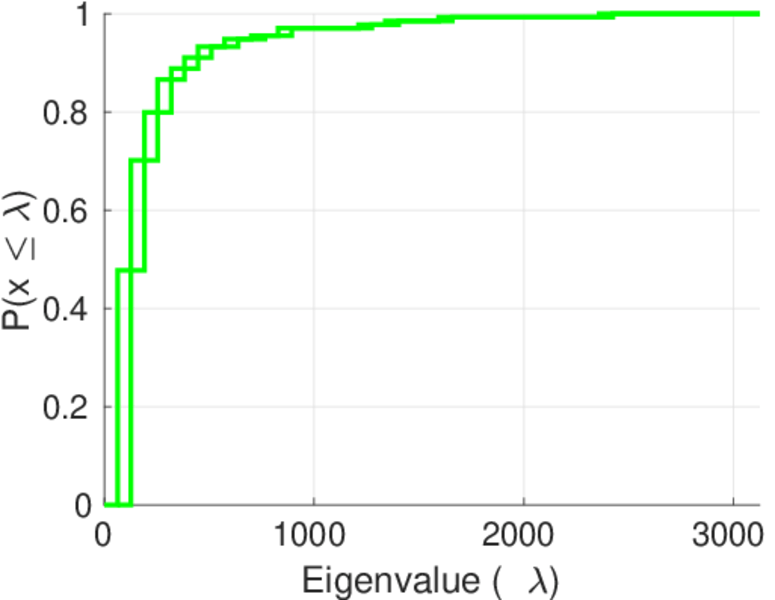
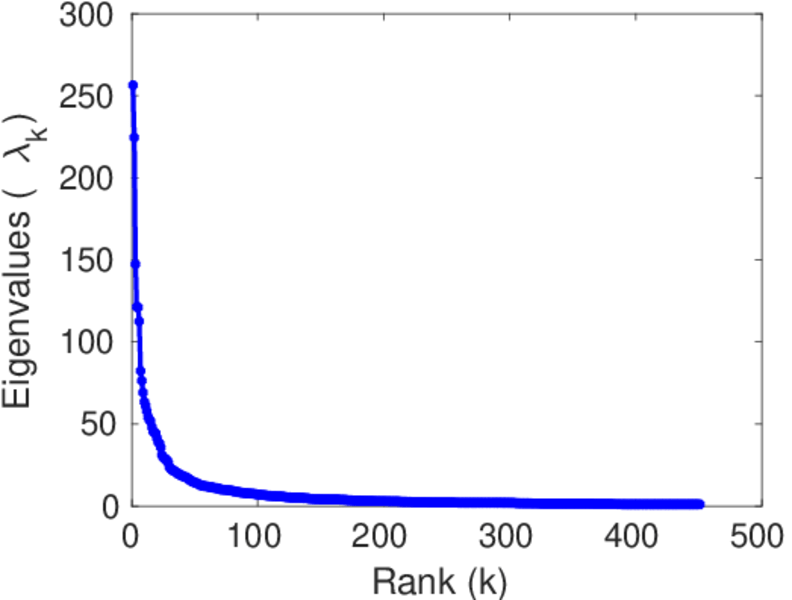
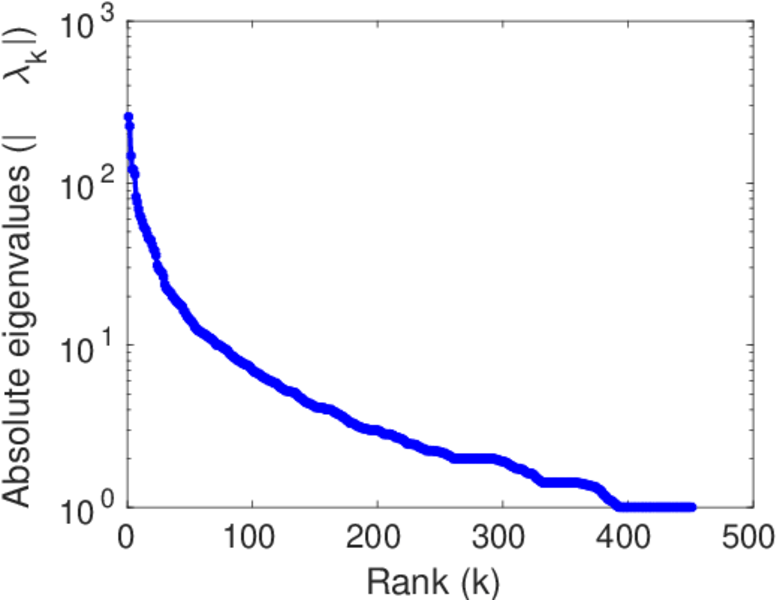
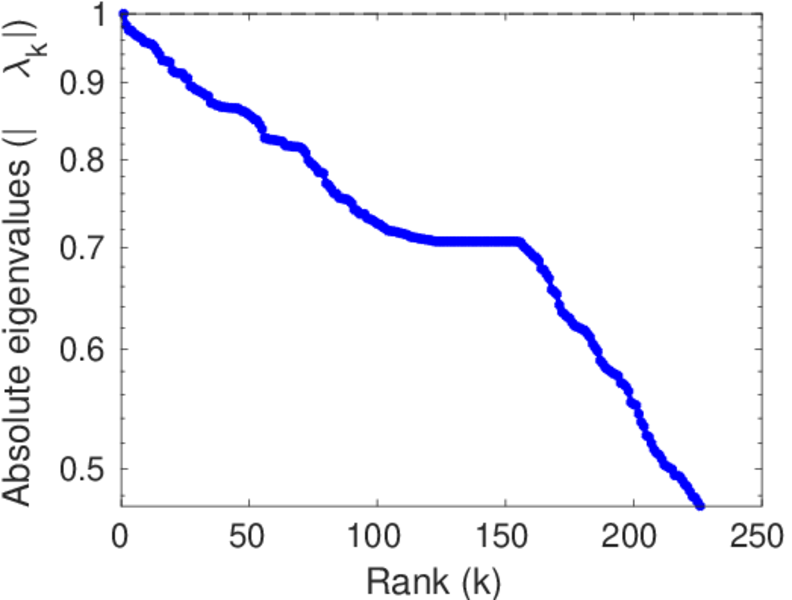
| Spectral norm | α = | 256.422
|
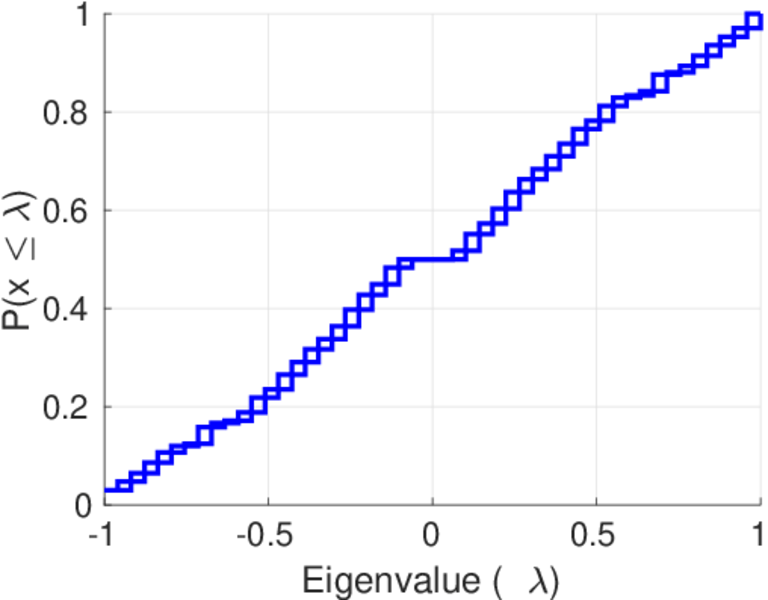
| Algebraic connectivity | a = | 0.038 670 5
|
| Spectral separation | |λ1[A] / λ2[A]| = | 1.142 29
|
| Controllability | C = | 2,510
|
| Relative controllability | Cr = | 0.645 576
|
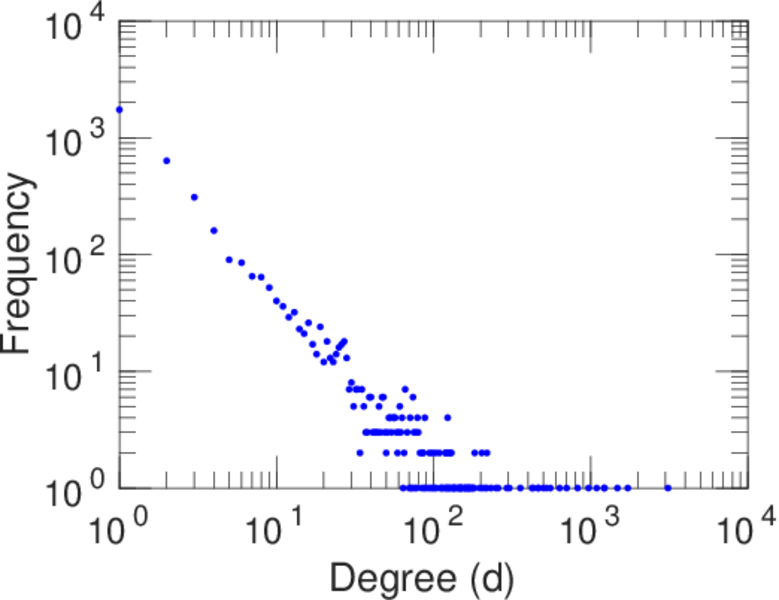
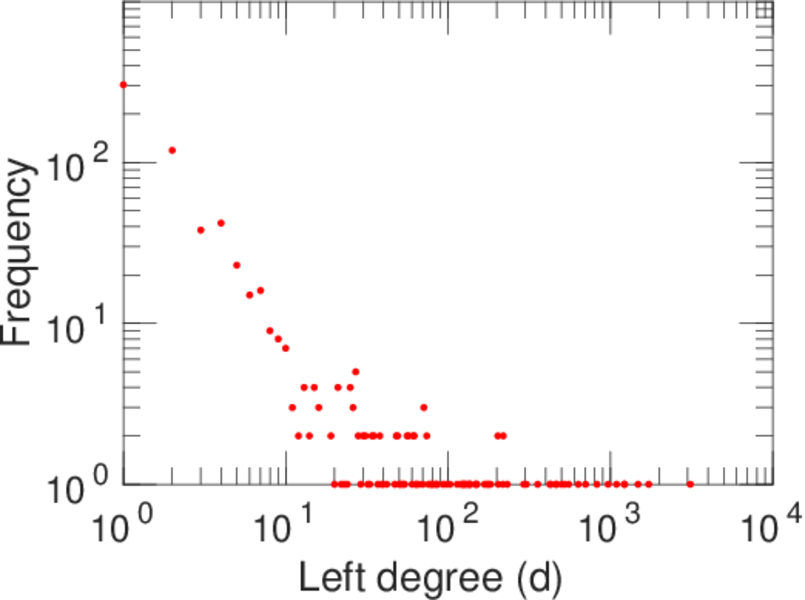
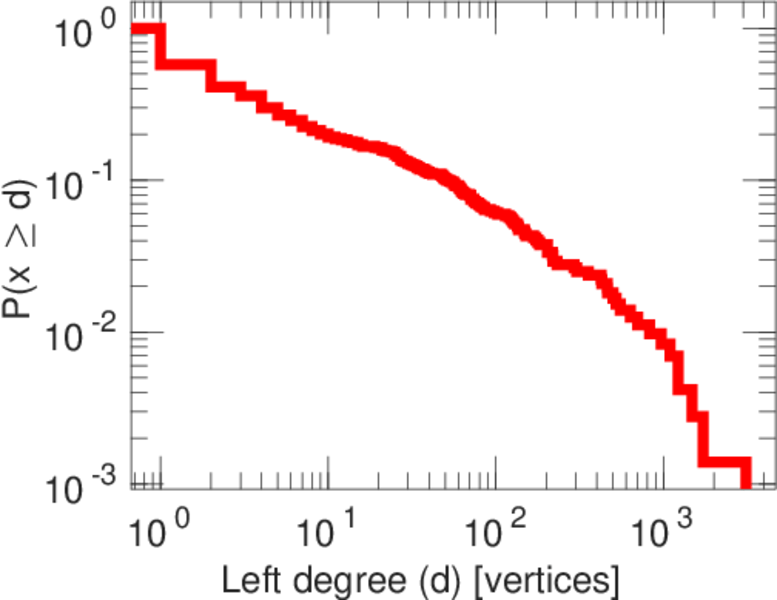
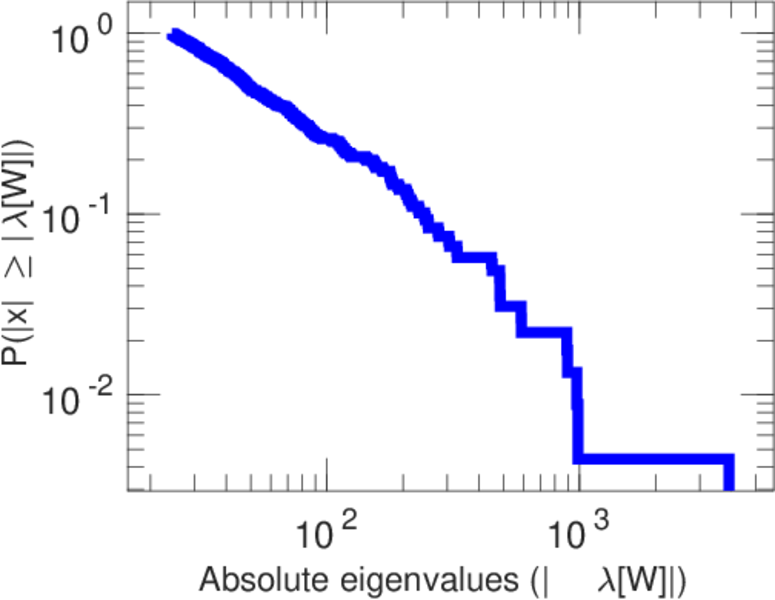
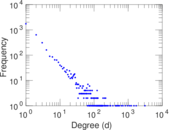
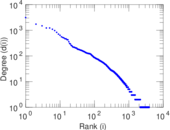
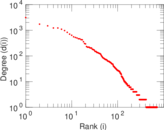
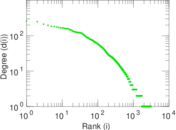
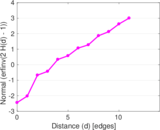
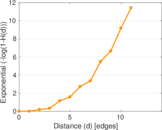
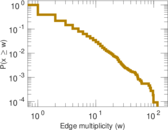
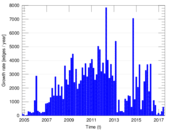
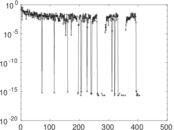
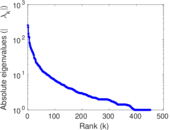
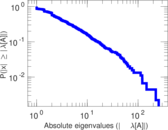
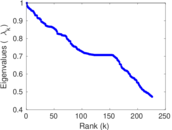
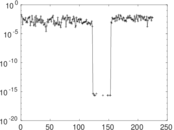
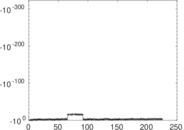
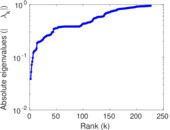
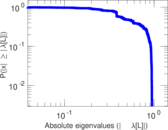
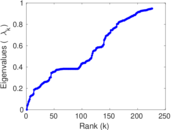
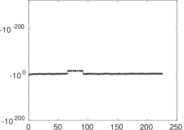
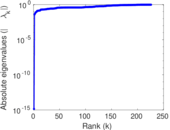
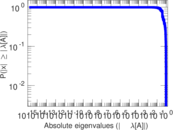
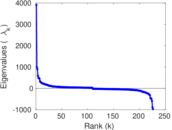
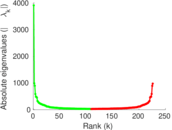
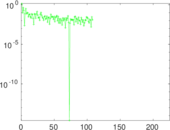
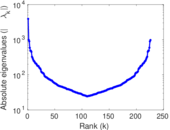
Plots
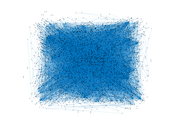

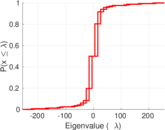
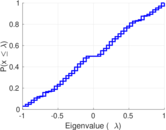

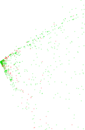
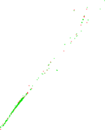


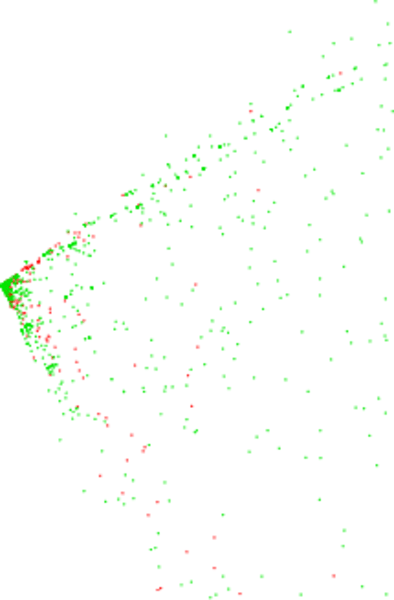
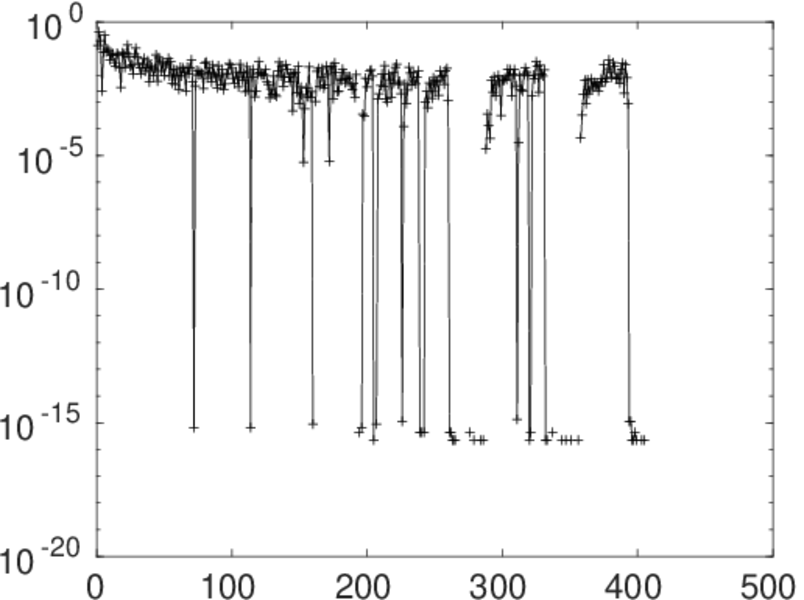
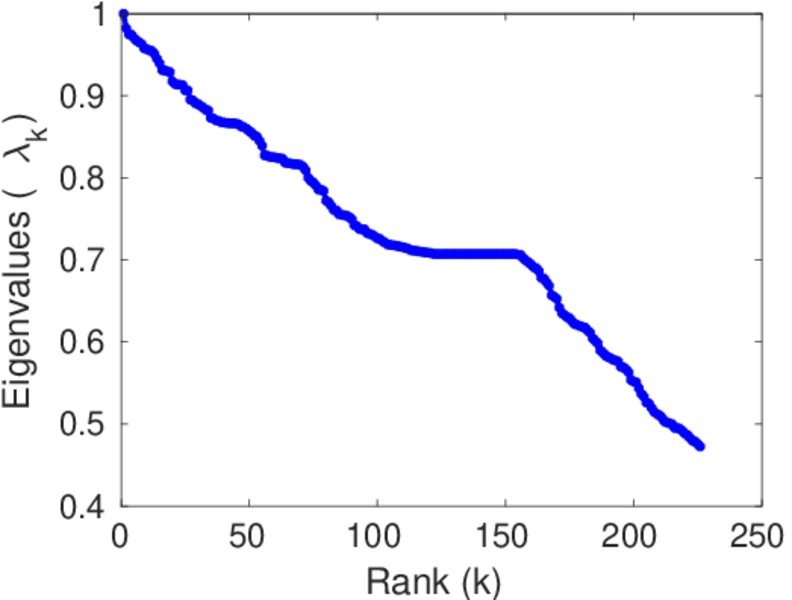
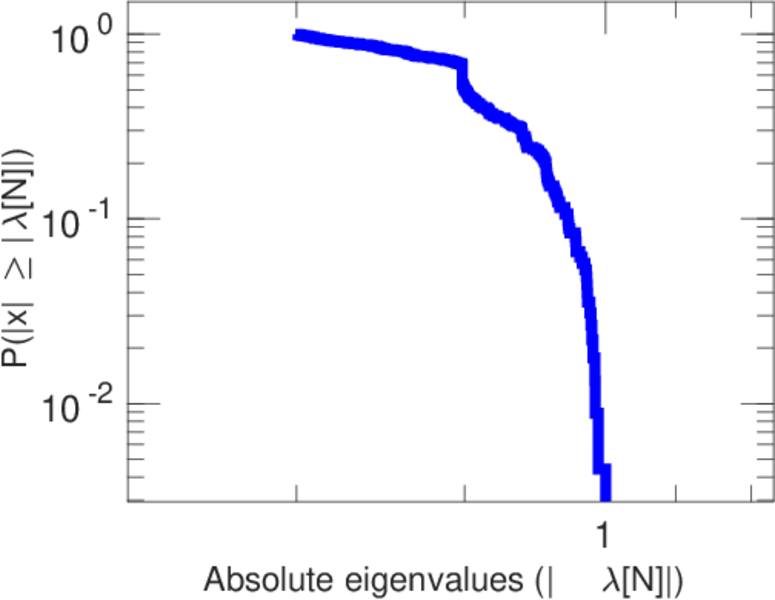
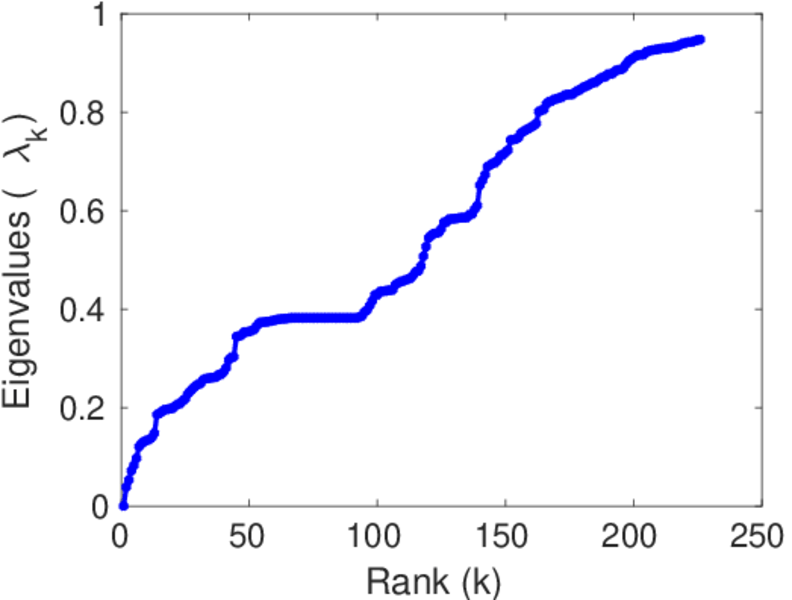
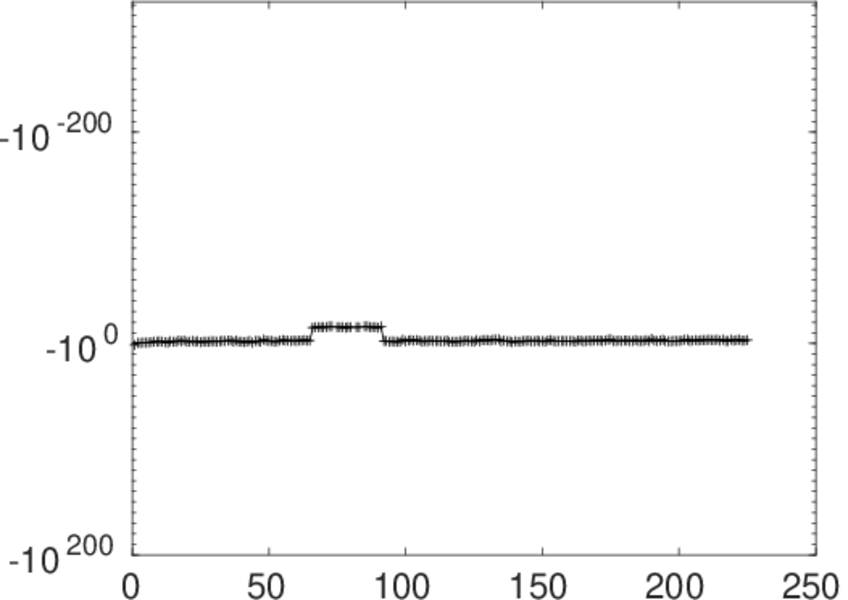
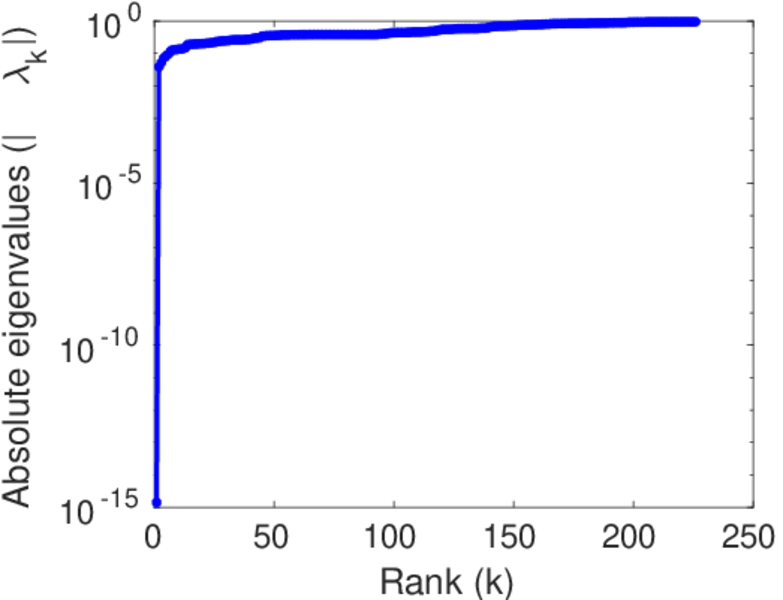
Matrix decompositions plots


Downloads
References
|
[1]
|
Jérôme Kunegis.
KONECT – The Koblenz Network Collection.
In Proc. Int. Conf. on World Wide Web Companion, pages
1343–1350, 2013.
[ http ]
|
|
[2]
|
Wikimedia Foundation.
Wikimedia downloads.
http://dumps.wikimedia.org/, January 2010.
|
 KONECT ‣ Networks ‣
Buy Me a Coffee
KONECT ‣ Networks ‣
Buy Me a Coffee