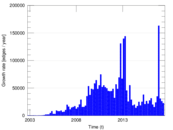
Wikipedia edits (gu)
This is the bipartite edit network of the Gujarati Wikipedia. It contains users
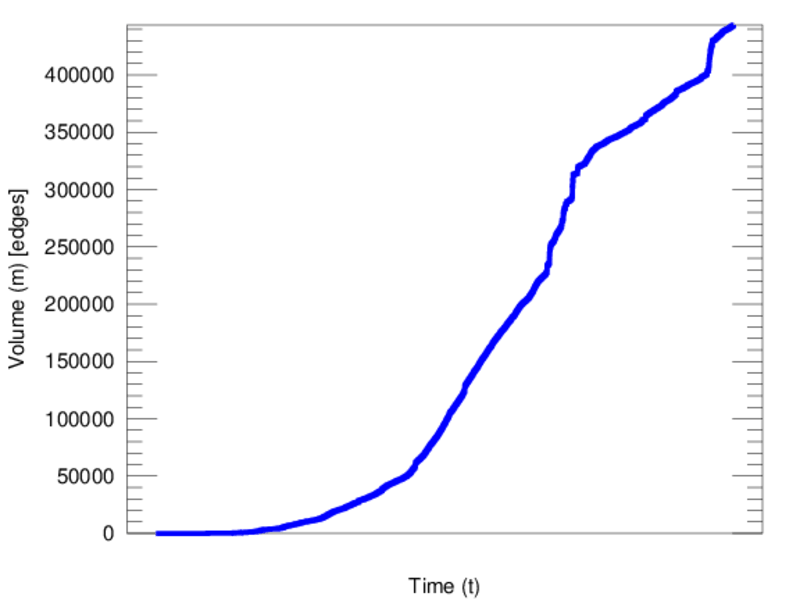
and pages from the Gujarati Wikipedia, connected by edit events. Each edge
represents an edit. The dataset includes the timestamp of each edit.
Metadata
Statistics
| Size | n = | 79,543
|
| Left size | n1 = | 8,403
|
| Right size | n2 = | 71,140
|
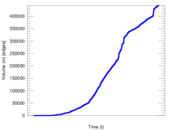
| Volume | m = | 443,632
|
| Unique edge count | m̿ = | 238,313
|
| Wedge count | s = | 1,192,003,422
|
| Claw count | z = | 7,020,168,006,433
|
| Cross count | x = | 34,089,381,217,500,844
|
| Square count | q = | 1,030,473,612
|
| 4-Tour count | T4 = | 13,012,343,194
|
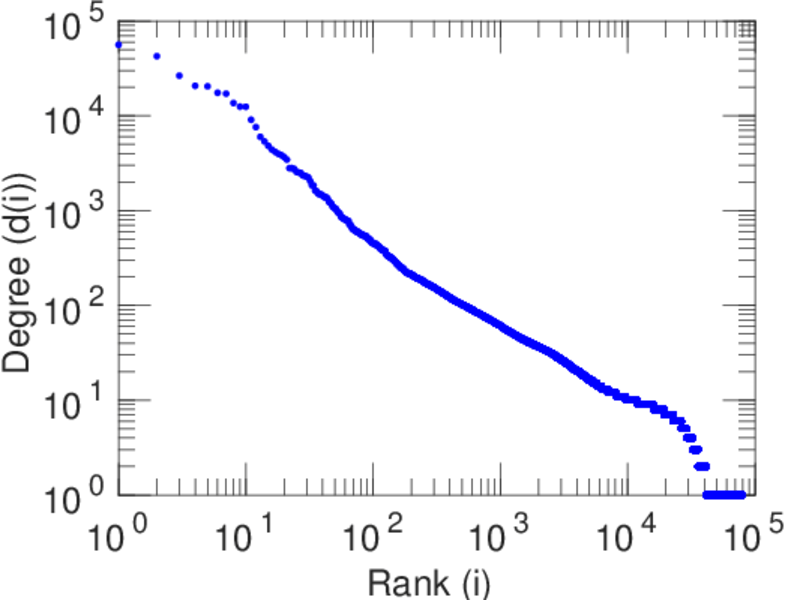
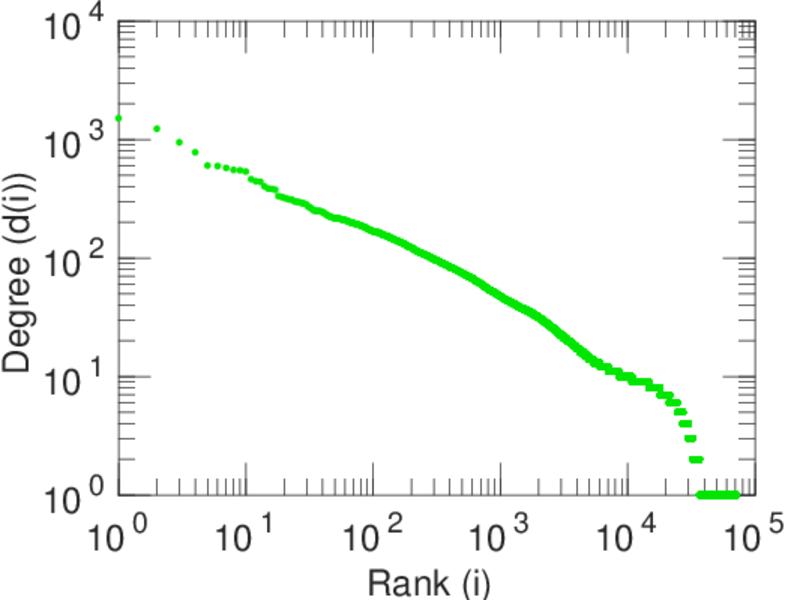
| Maximum degree | dmax = | 56,062
|
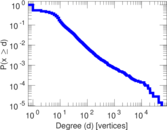
| Maximum left degree | d1max = | 56,062
|
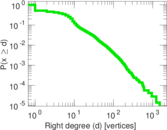
| Maximum right degree | d2max = | 1,510
|
| Average degree | d = | 11.154 5
|
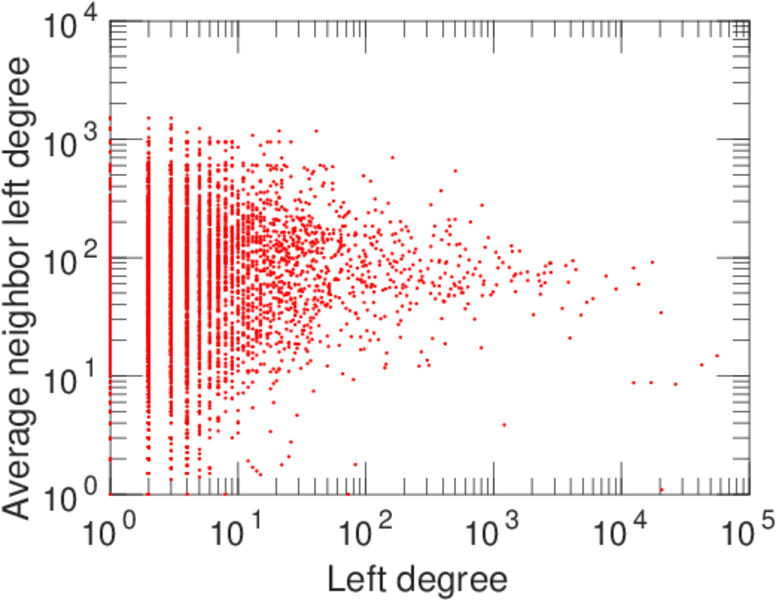
| Average left degree | d1 = | 52.794 5
|
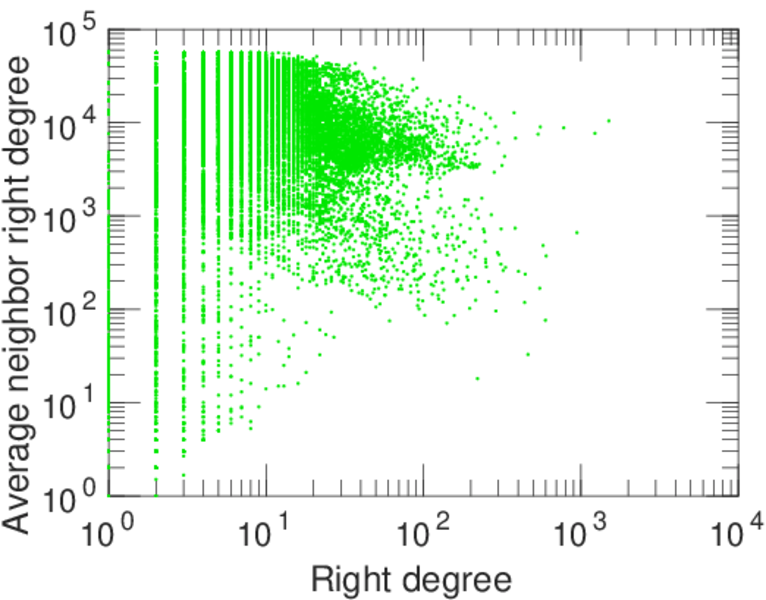
| Average right degree | d2 = | 6.236 04
|
| Fill | p = | 0.000 398 657
|
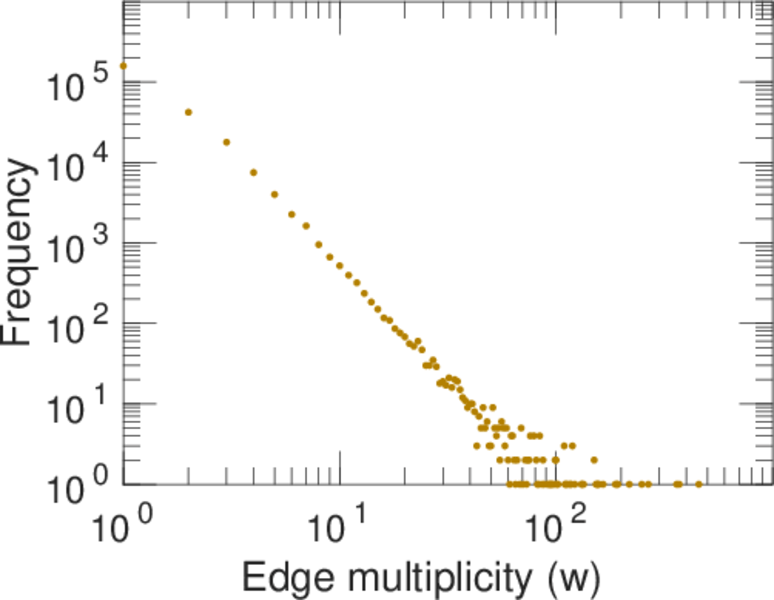
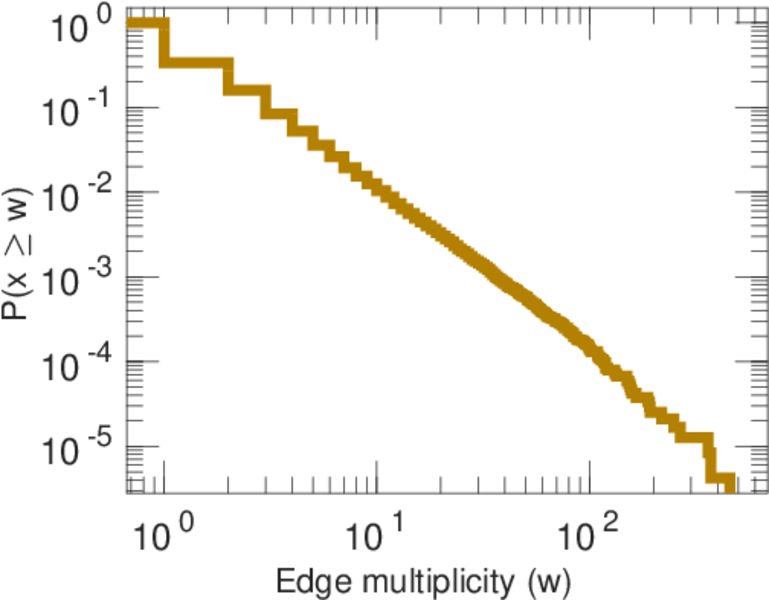
| Average edge multiplicity | m̃ = | 1.861 55
|
| Size of LCC | N = | 78,090
|
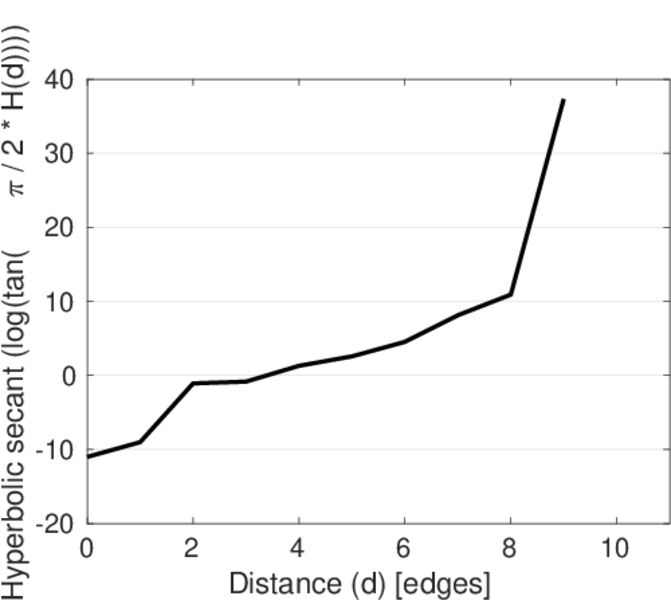
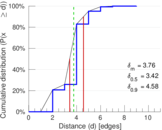
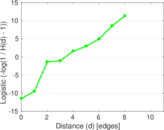
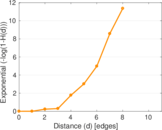
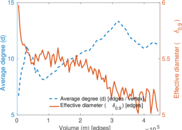
| Diameter | δ = | 11
|
| 50-Percentile effective diameter | δ0.5 = | 3.422 64
|
| 90-Percentile effective diameter | δ0.9 = | 4.579 58
|
| Median distance | δM = | 4
|
| Mean distance | δm = | 3.759 94
|
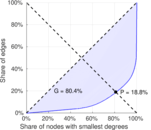
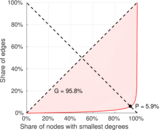
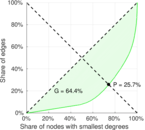
| Gini coefficient | G = | 0.807 409
|
| Balanced inequality ratio | P = | 0.186 728
|
| Left balanced inequality ratio | P1 = | 0.059 312 7
|
| Right balanced inequality ratio | P2 = | 0.256 722
|
| Relative edge distribution entropy | Her = | 0.728 602
|
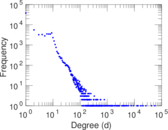
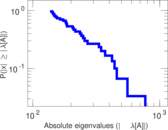
| Power law exponent | γ = | 2.383 43
|
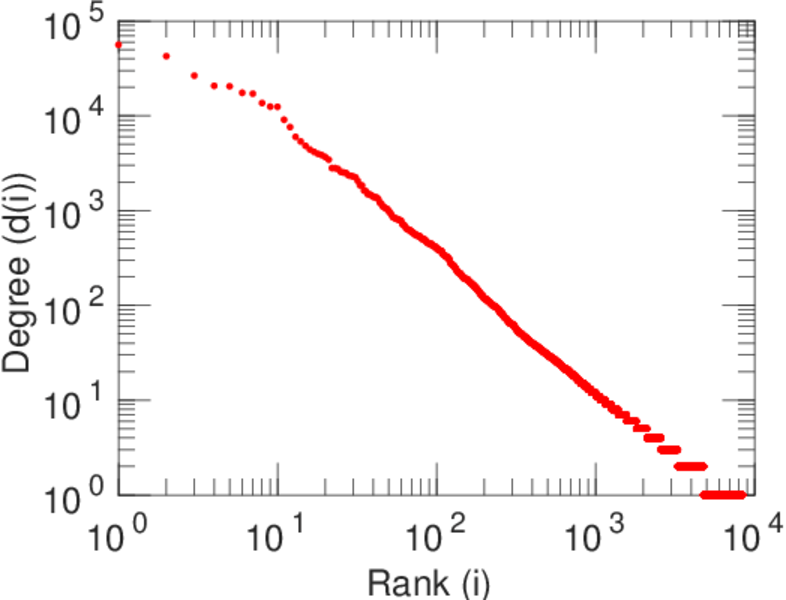
| Tail power law exponent | γt = | 1.741 00
|
| Tail power law exponent with p | γ3 = | 1.741 00
|
| p-value | p = | 0.725 000
|
| Left tail power law exponent with p | γ3,1 = | 1.951 00
|
| Left p-value | p1 = | 0.000 00
|
| Right tail power law exponent with p | γ3,2 = | 4.001 00
|
| Right p-value | p2 = | 0.184 000
|
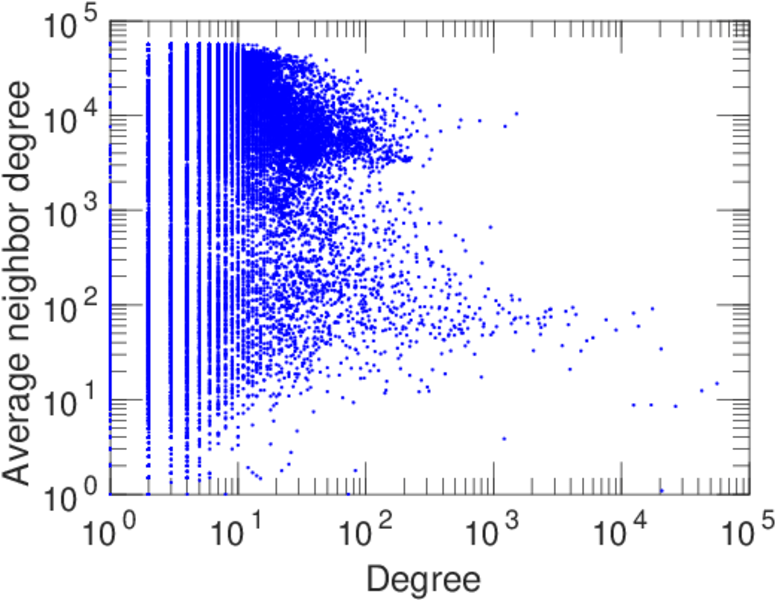
| Degree assortativity | ρ = | −0.378 325
|
| Degree assortativity p-value | pρ = | 0.000 00
|
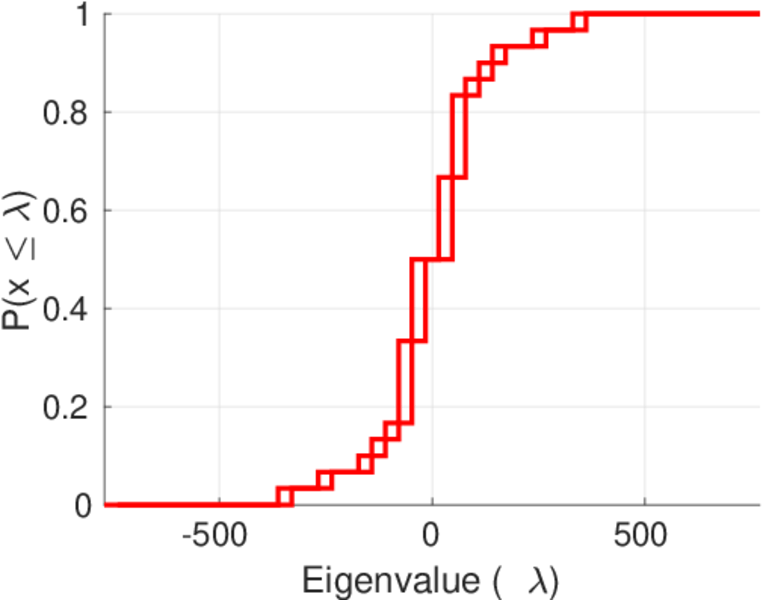
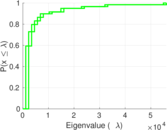
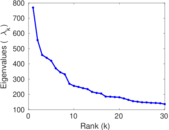
| Spectral norm | α = | 769.693
|
| Algebraic connectivity | a = | 0.024 781 4
|
| Spectral separation | |λ1[A] / λ2[A]| = | 1.383 31
|
| Controllability | C = | 70,746
|
| Relative controllability | Cr = | 0.894 172
|
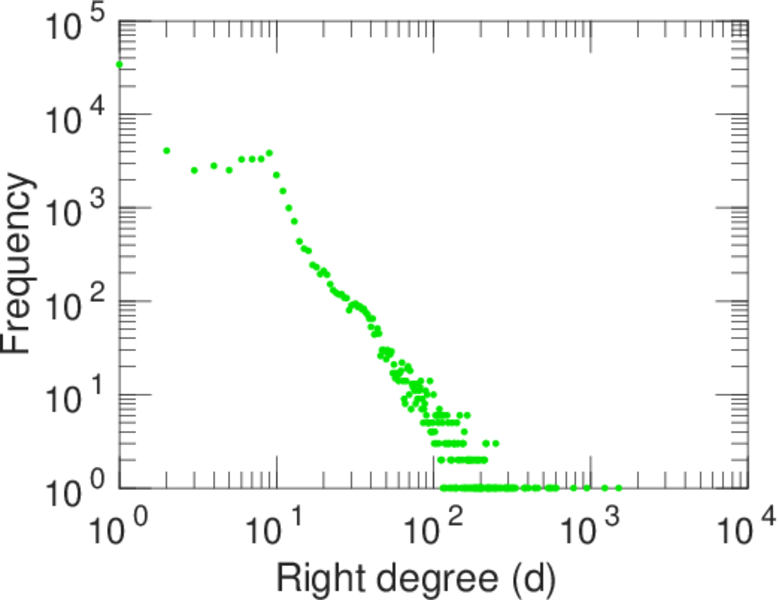
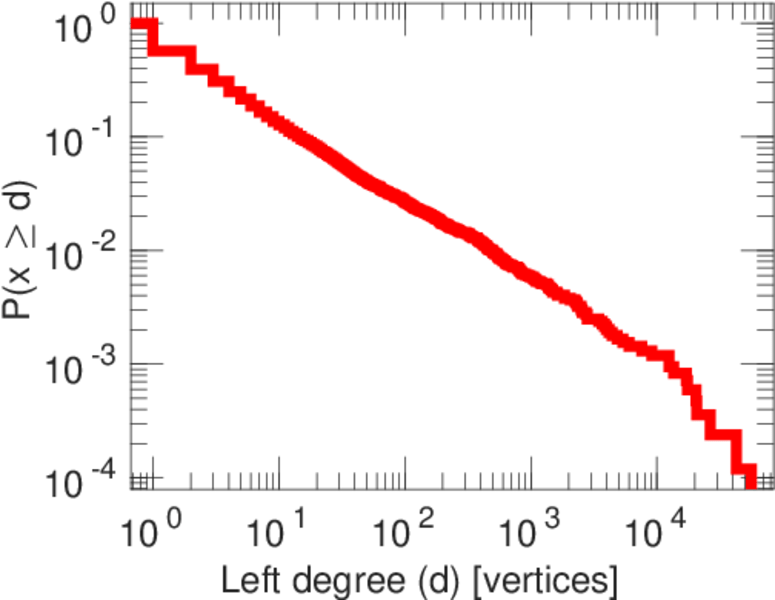
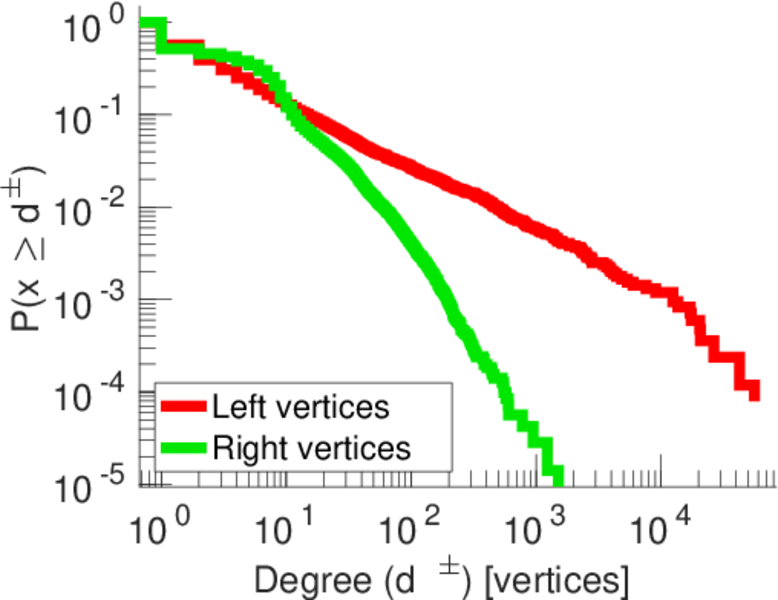
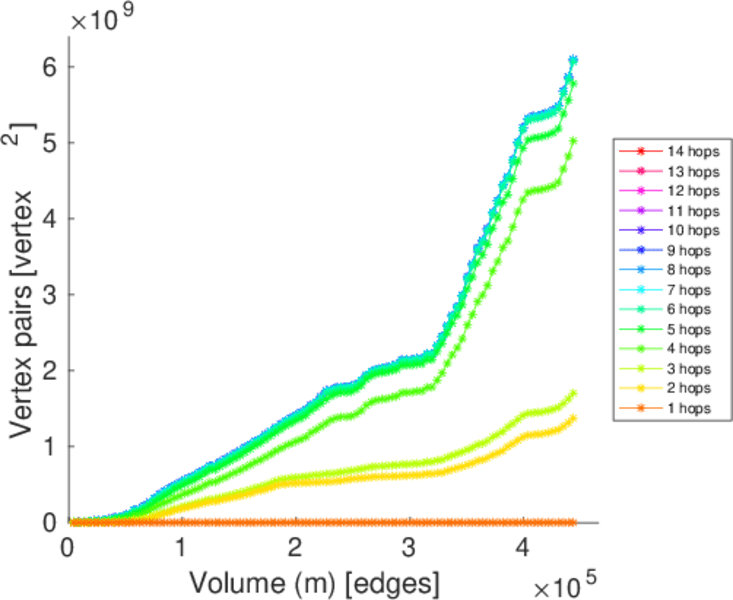
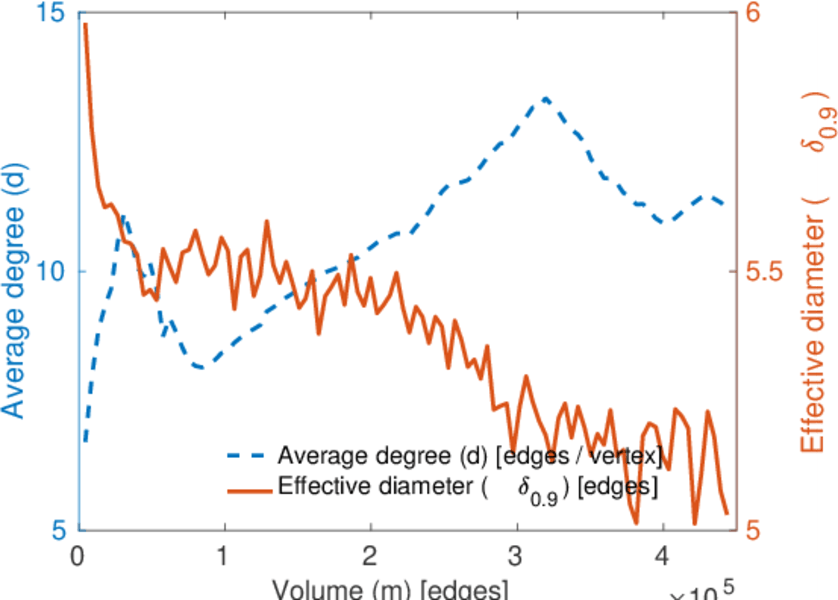
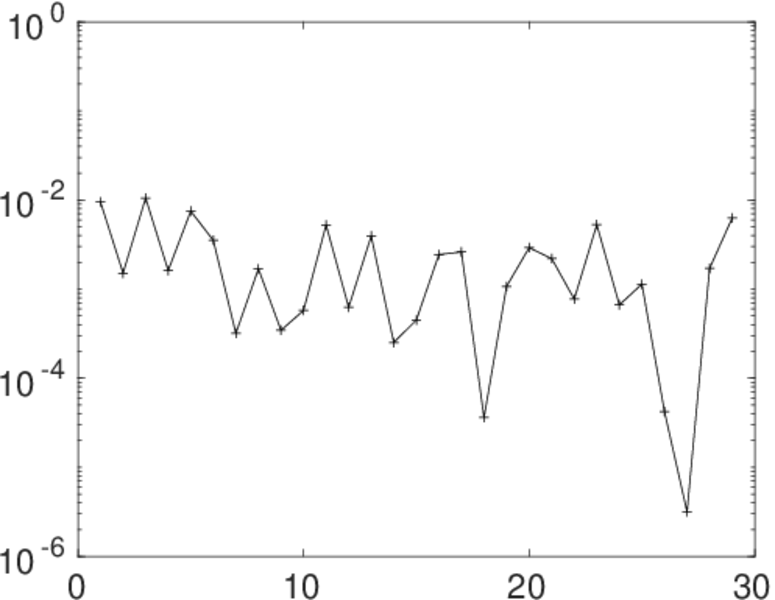
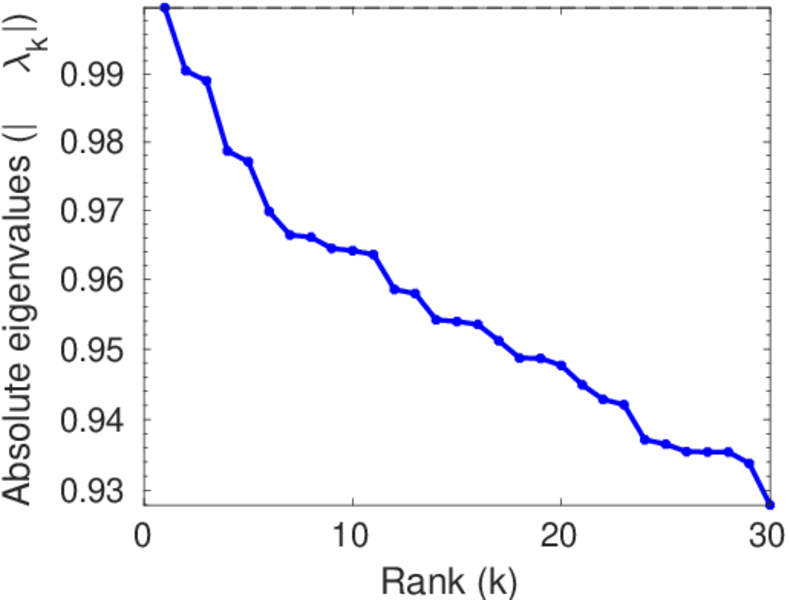
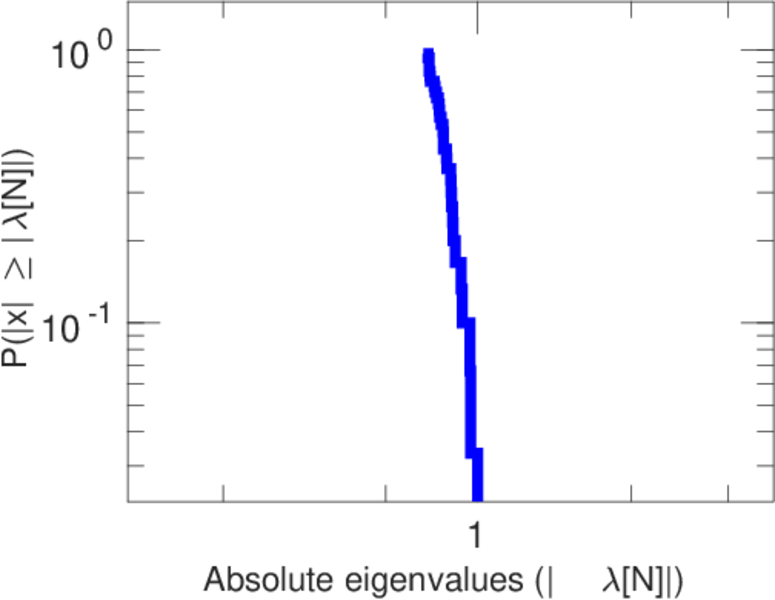
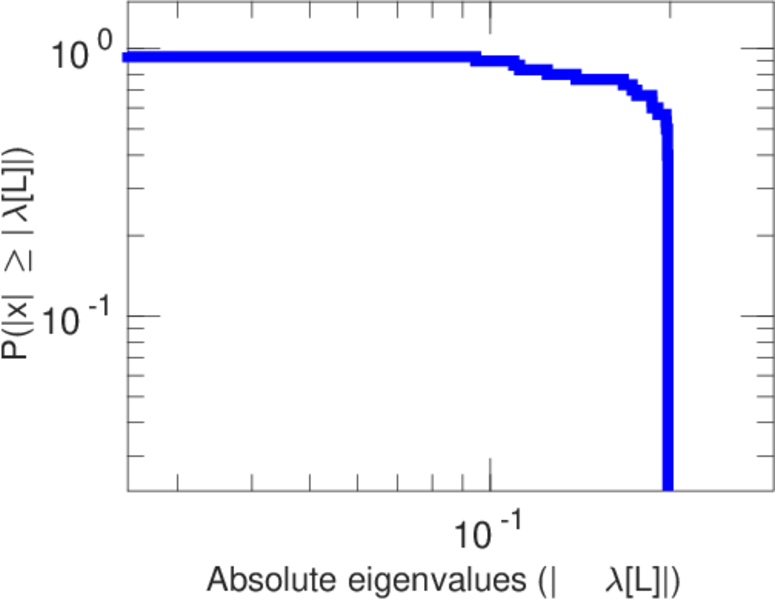
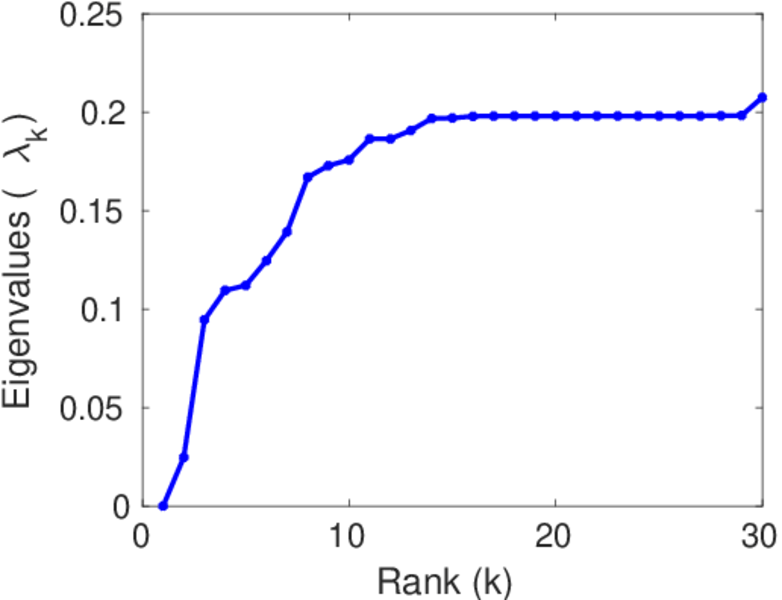
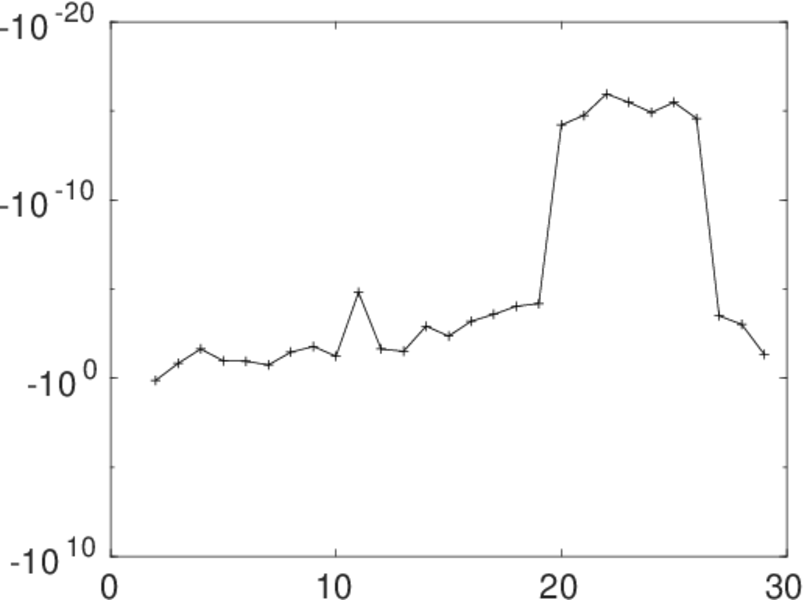
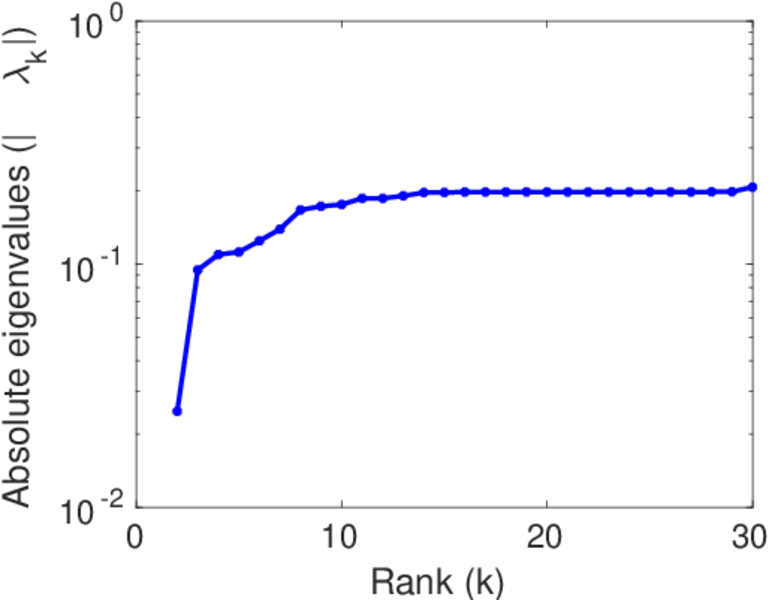
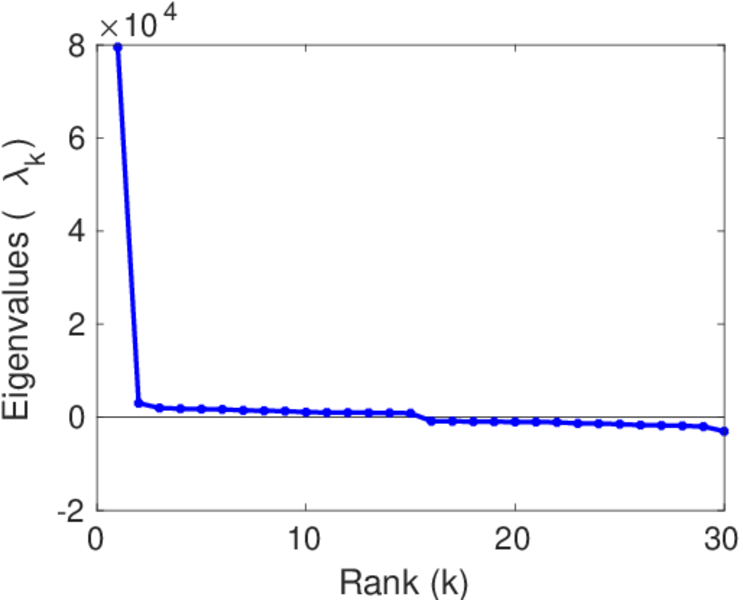
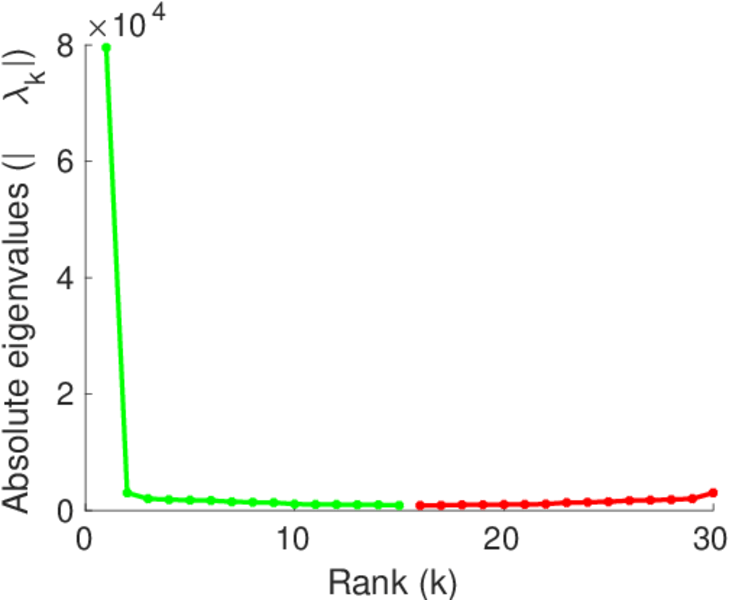
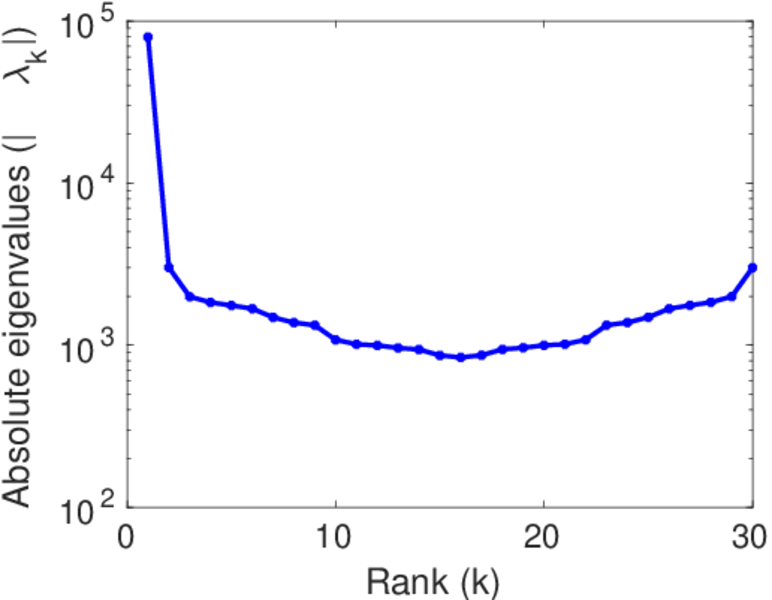
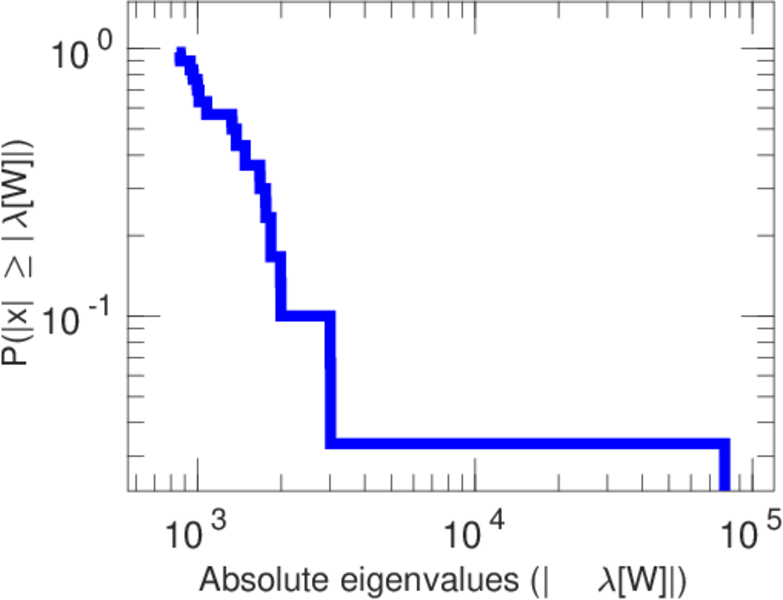
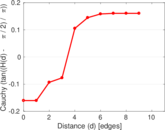
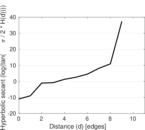
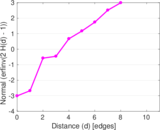
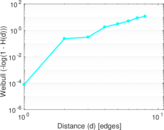
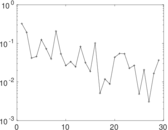
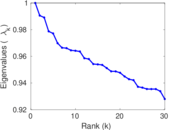
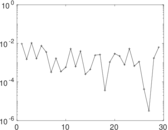
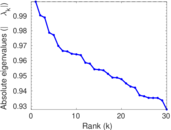
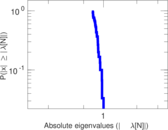
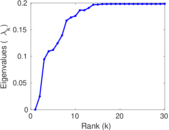
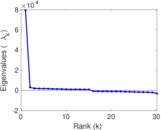
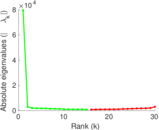
Plots


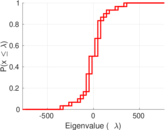
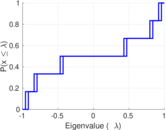

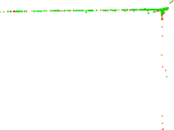


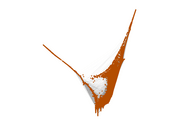


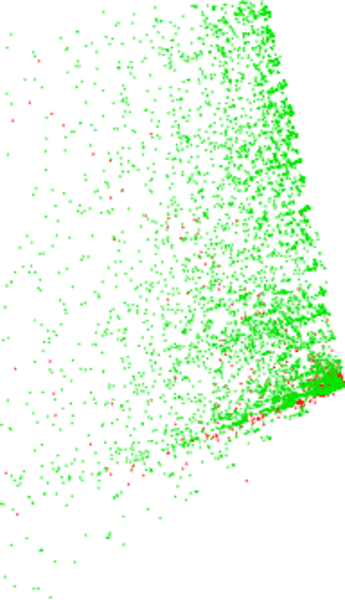
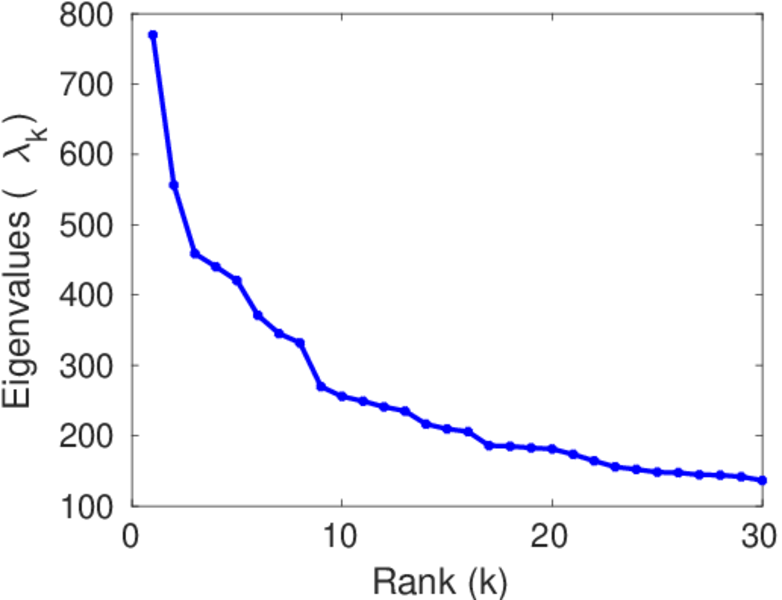
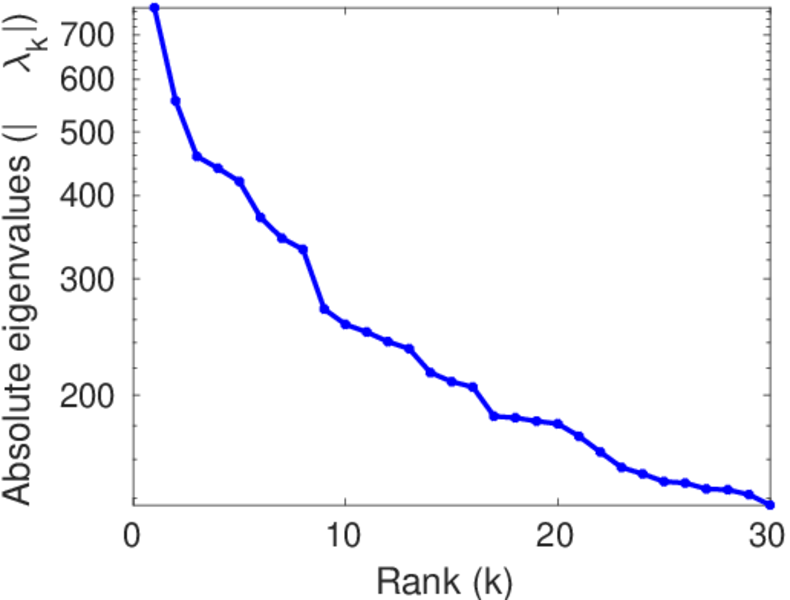
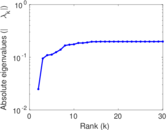
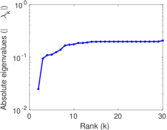
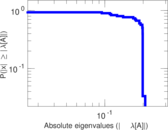
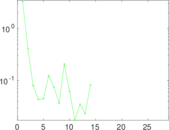
Matrix decompositions plots


Downloads
References
|
[1]
|
Jérôme Kunegis.
KONECT – The Koblenz Network Collection.
In Proc. Int. Conf. on World Wide Web Companion, pages
1343–1350, 2013.
[ http ]
|
|
[2]
|
Wikimedia Foundation.
Wikimedia downloads.
http://dumps.wikimedia.org/, January 2010.
|
 KONECT ‣ Networks ‣
Buy Me a Coffee
KONECT ‣ Networks ‣
Buy Me a Coffee