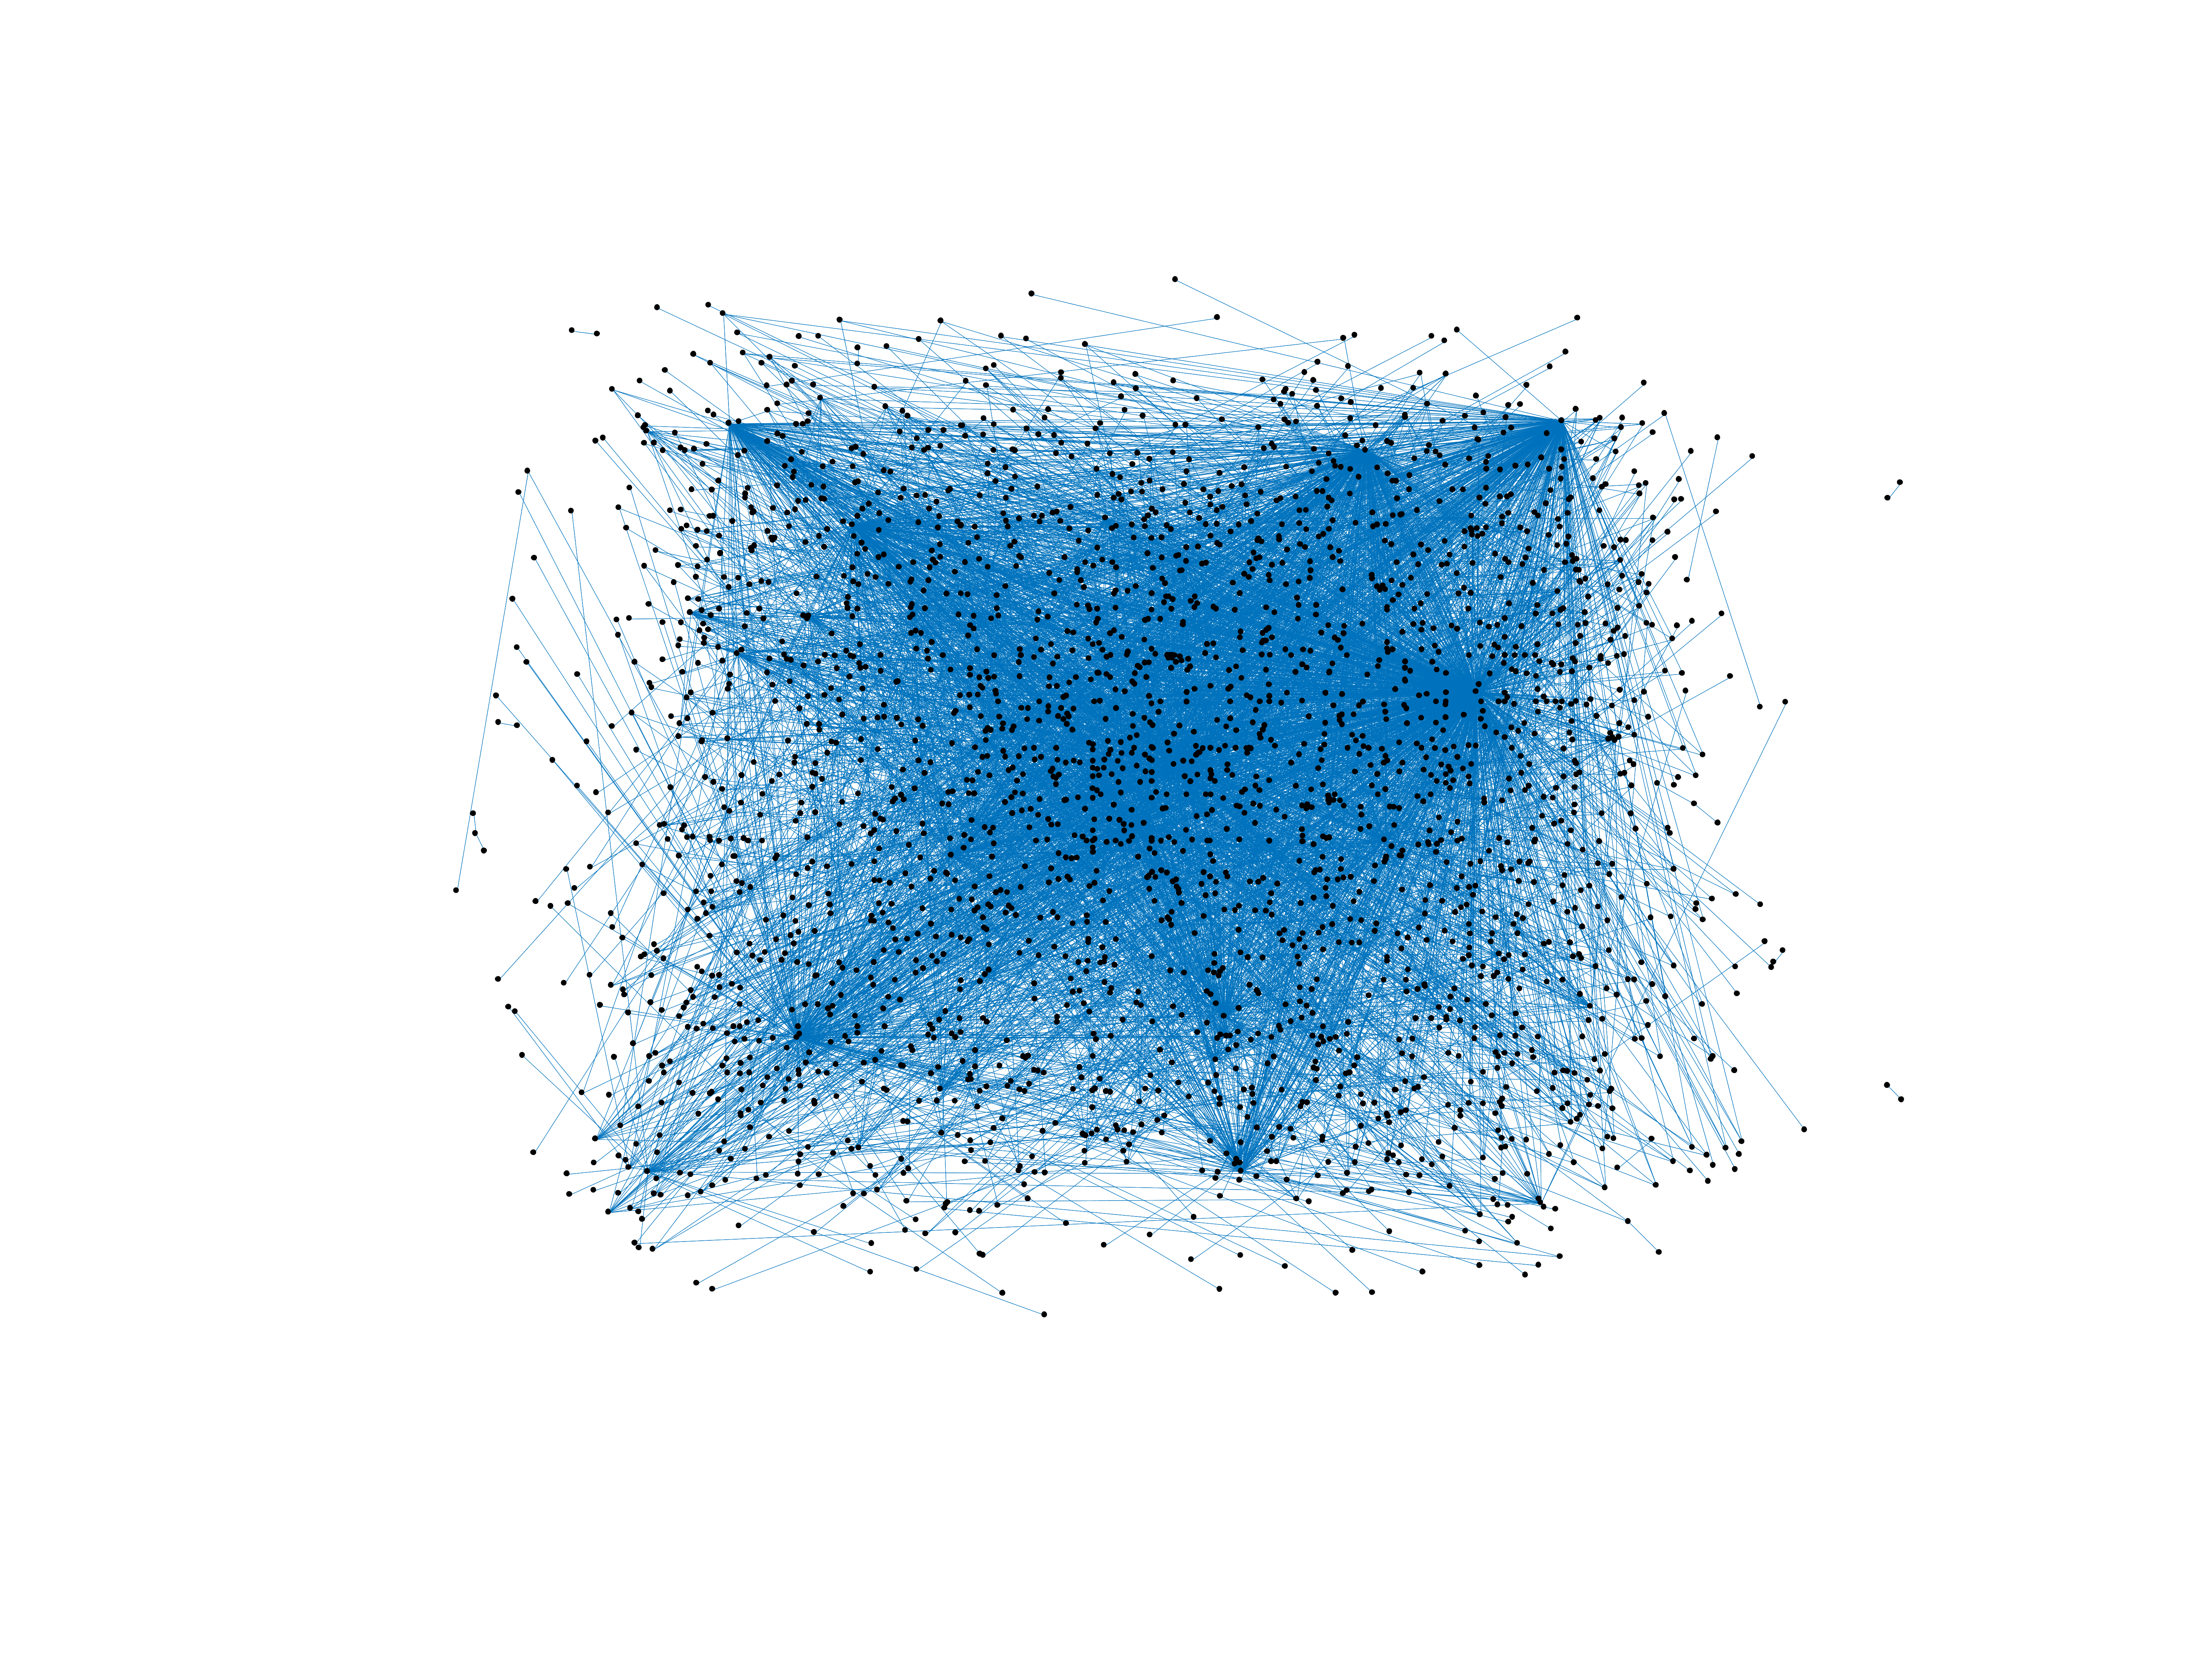
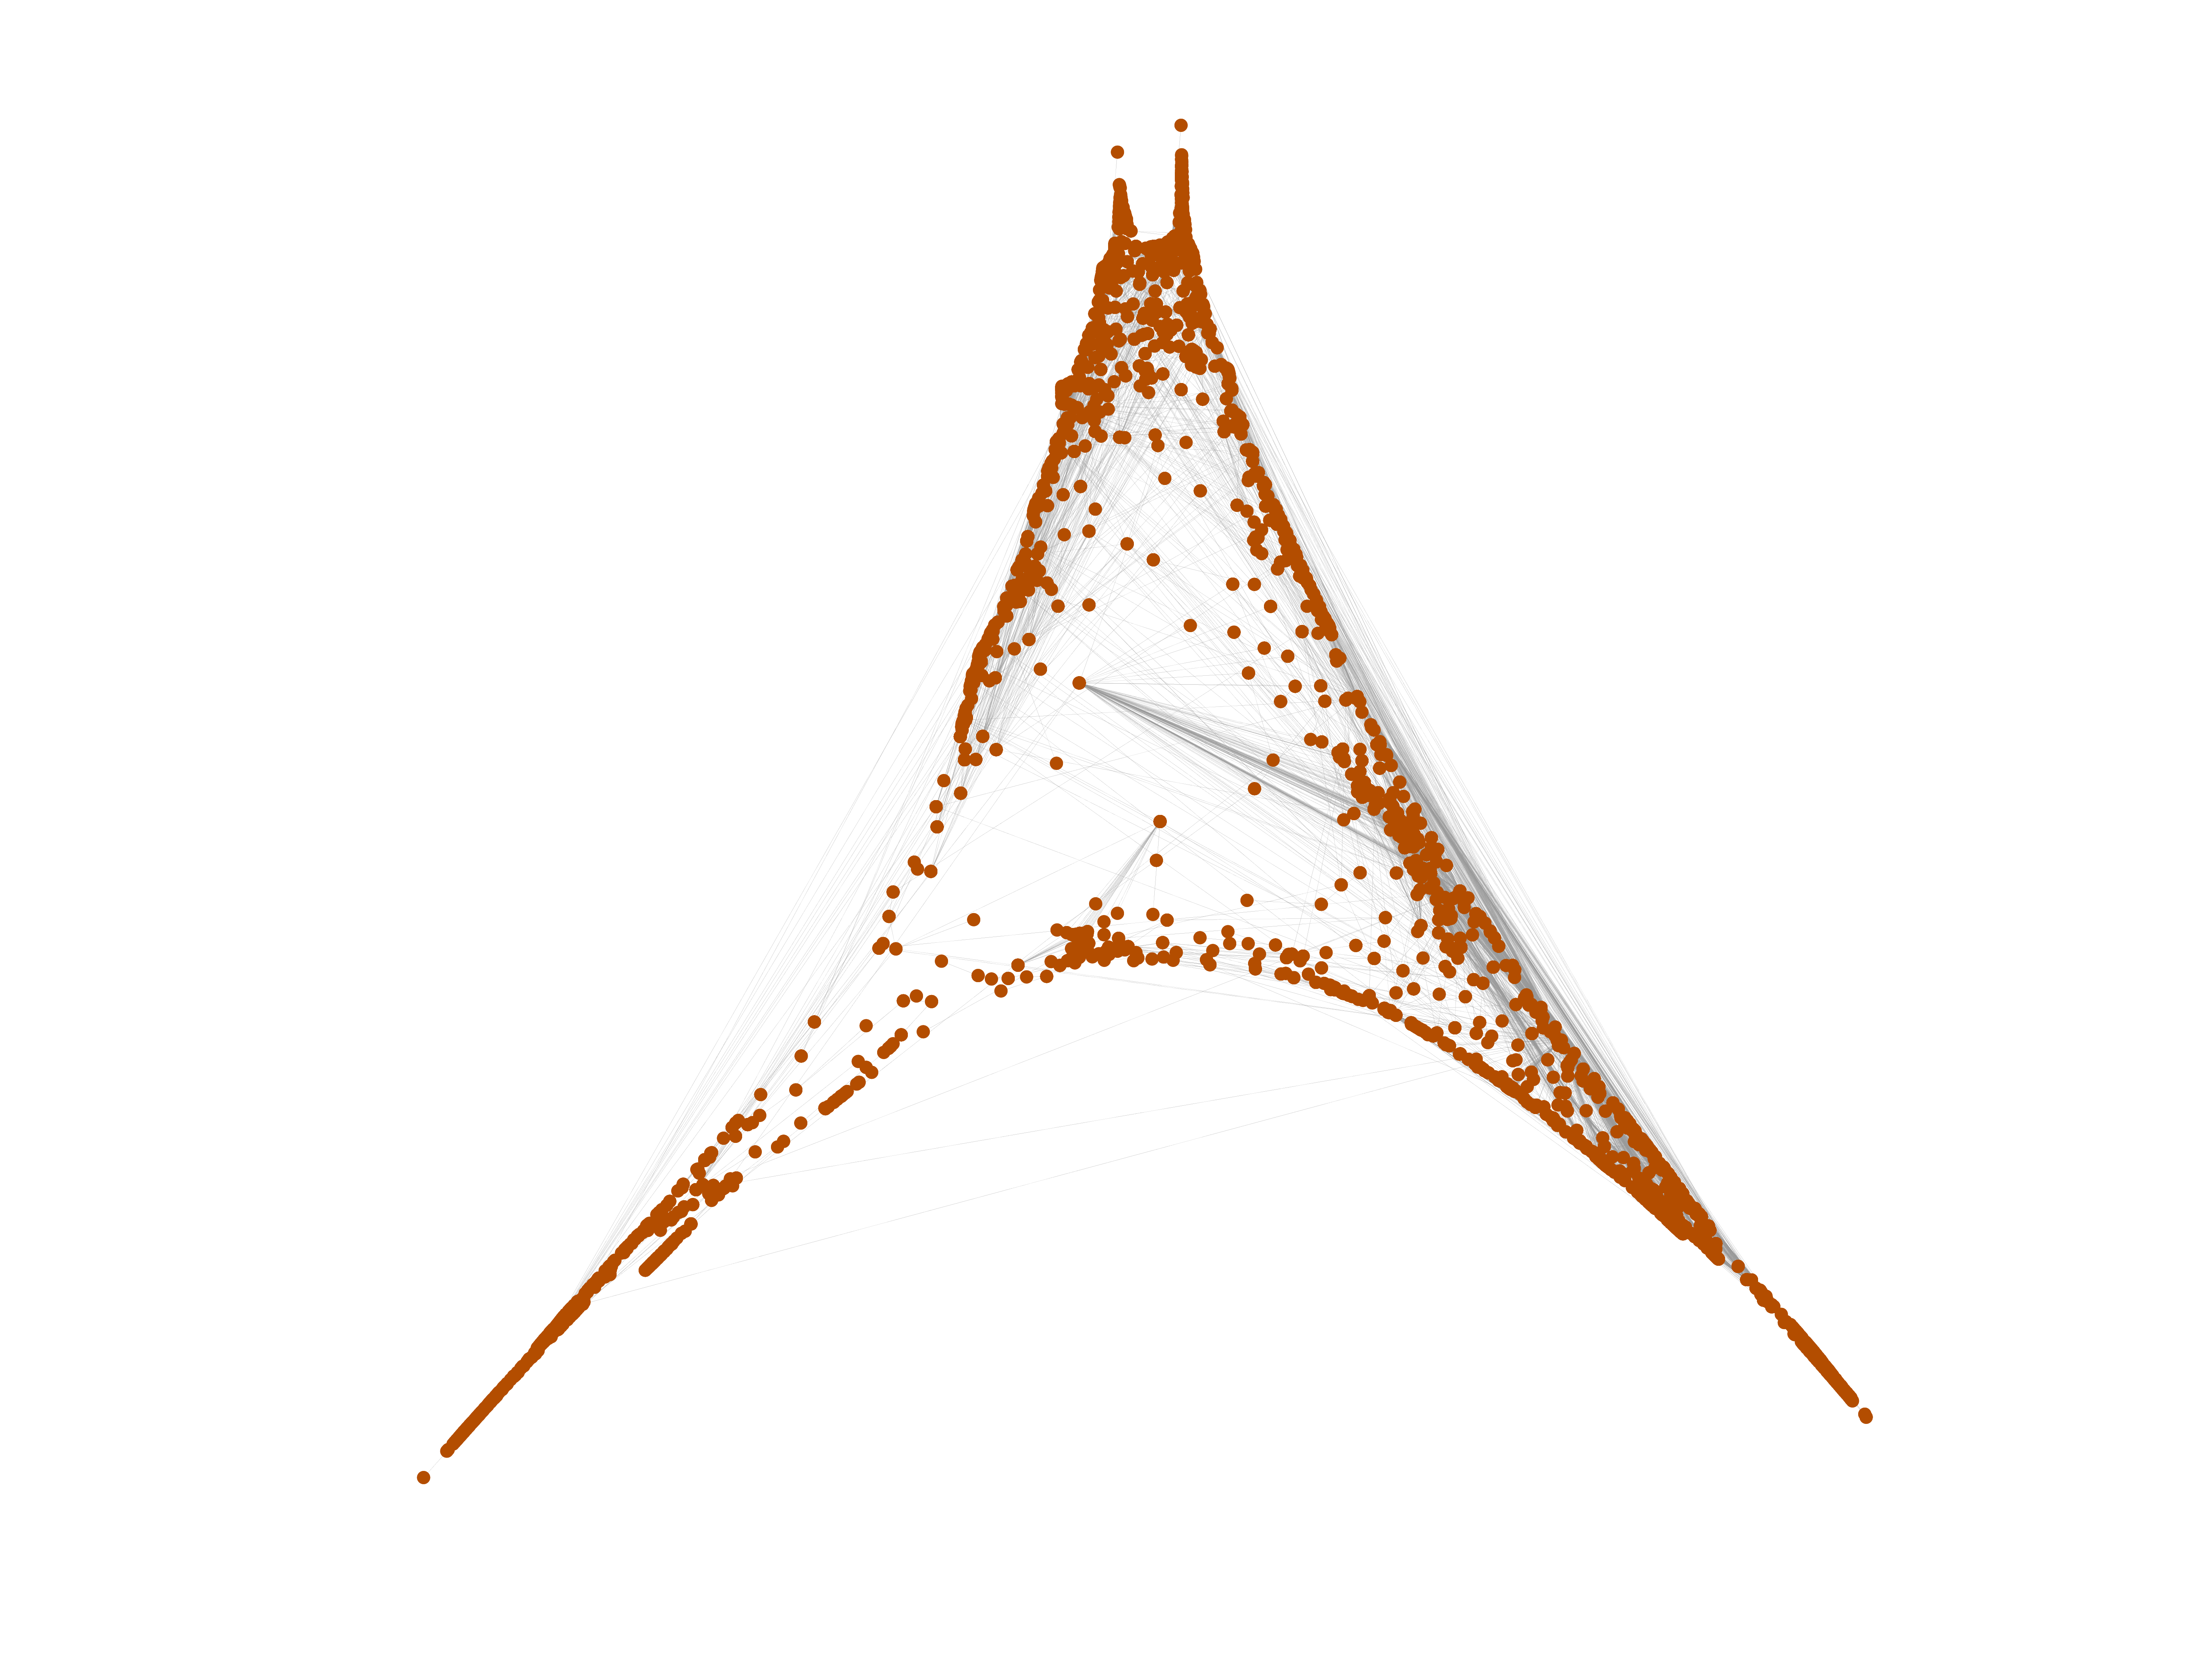
Wikiquote edits (gu)
This is the bipartite edit network of the Gujarati Wikiquote. It contains users
and pages from the Gujarati Wikiquote, connected by edit events. Each edge
represents an edit. The dataset includes the timestamp of each edit.
Metadata
Statistics
| Size | n = | 2,649
|
| Left size | n1 = | 963
|
| Right size | n2 = | 1,686
|
| Volume | m = | 11,364
|
| Unique edge count | m̿ = | 5,502
|
| Wedge count | s = | 794,579
|
| Claw count | z = | 184,039,364
|
| Cross count | x = | 40,907,686,841
|
| Square count | q = | 291,739
|
| 4-Tour count | T4 = | 5,524,224
|
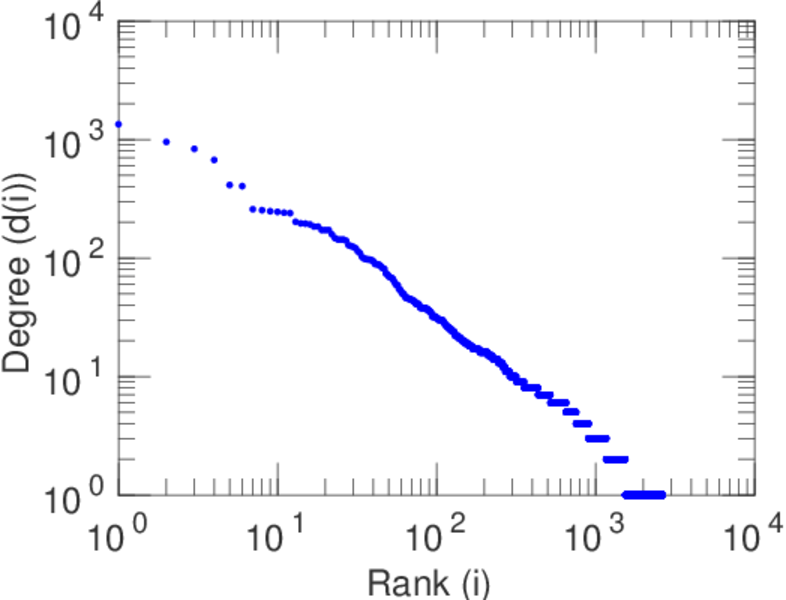
| Maximum degree | dmax = | 1,344
|
| Maximum left degree | d1max = | 1,344
|
| Maximum right degree | d2max = | 248
|
| Average degree | d = | 8.579 84
|
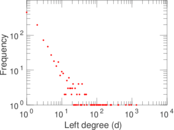
| Average left degree | d1 = | 11.800 6
|
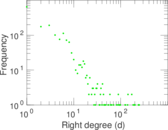
| Average right degree | d2 = | 6.740 21
|
| Fill | p = | 0.003 388 73
|
| Average edge multiplicity | m̃ = | 2.065 43
|
| Size of LCC | N = | 2,458
|
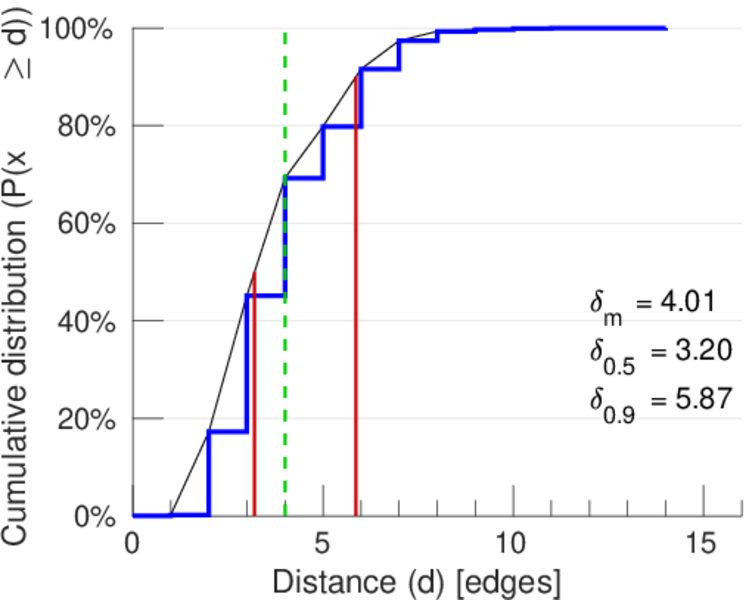
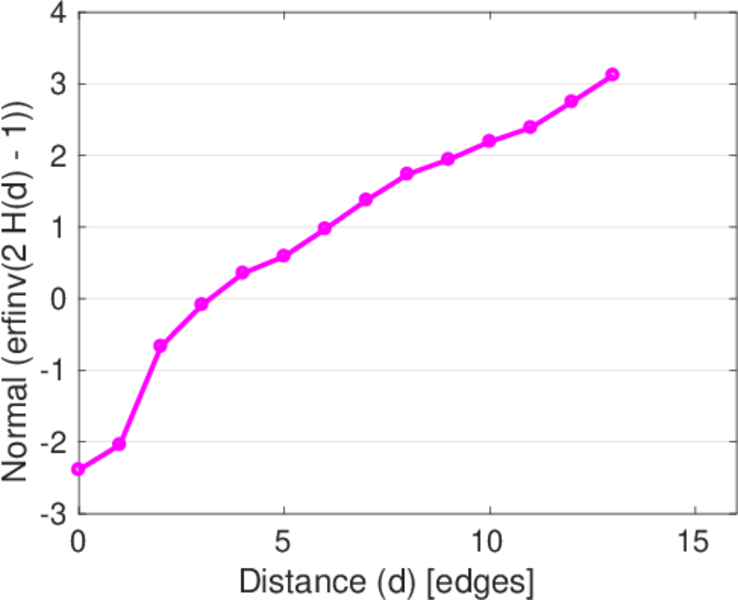
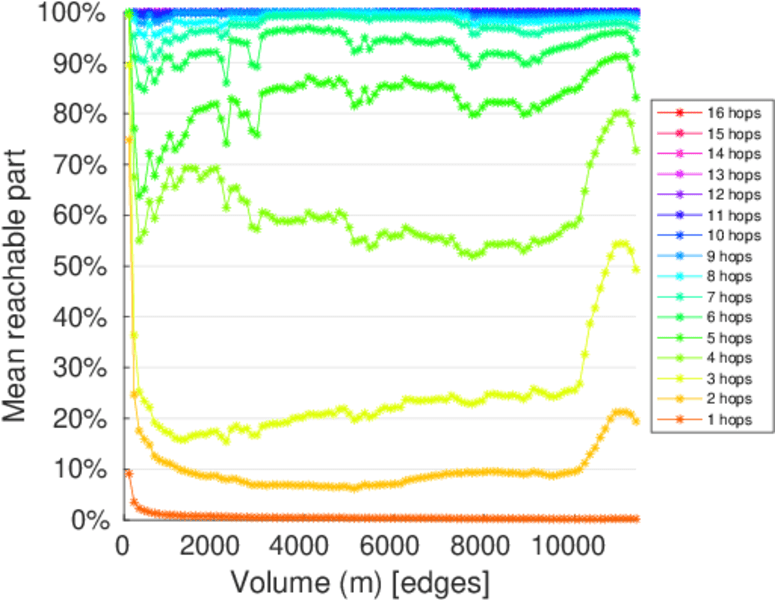
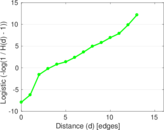
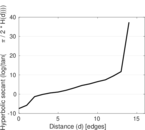
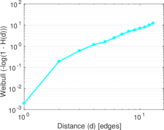
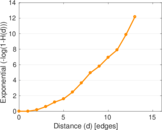
| Diameter | δ = | 15
|
| 50-Percentile effective diameter | δ0.5 = | 3.201 88
|
| 90-Percentile effective diameter | δ0.9 = | 5.866 52
|
| Median distance | δM = | 4
|
| Mean distance | δm = | 4.005 16
|
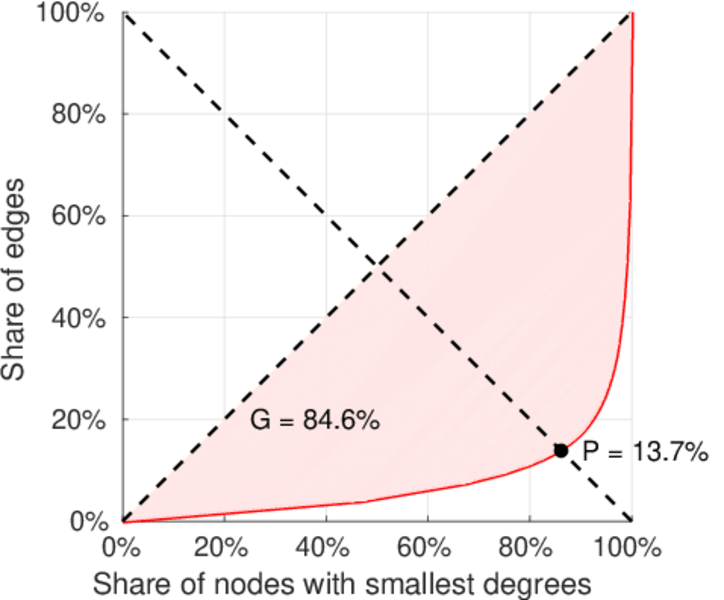
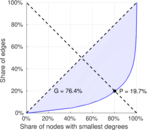
| Gini coefficient | G = | 0.716 720
|
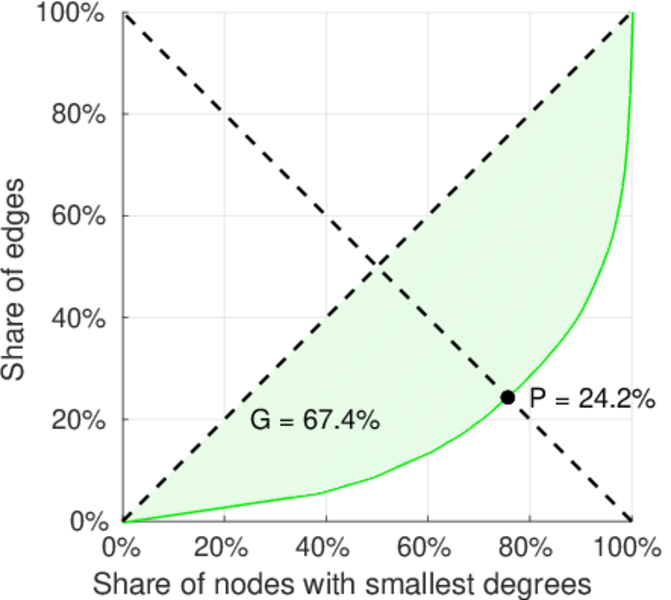
| Balanced inequality ratio | P = | 0.220 653
|
| Left balanced inequality ratio | P1 = | 0.137 012
|
| Right balanced inequality ratio | P2 = | 0.241 552
|
| Relative edge distribution entropy | Her = | 0.809 759
|
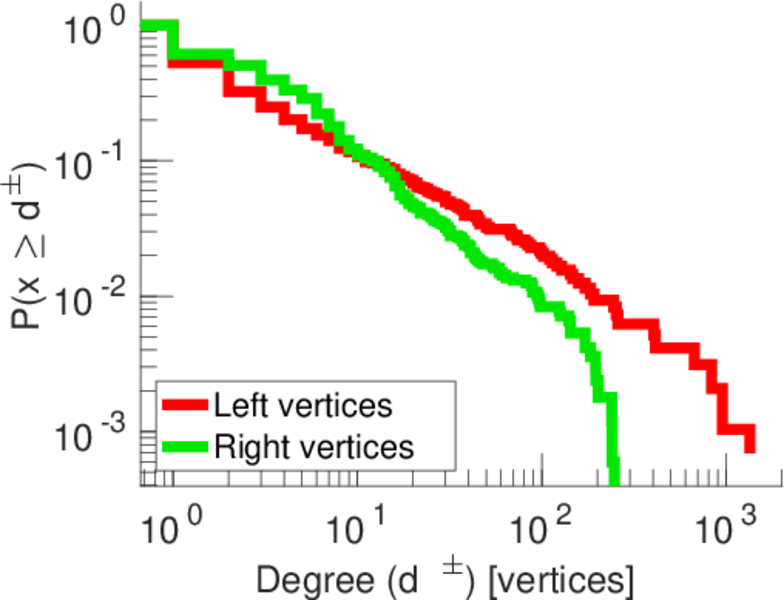
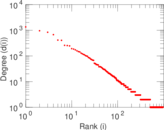
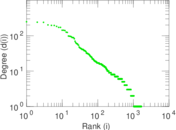
| Power law exponent | γ = | 2.555 05
|
| Tail power law exponent | γt = | 2.031 00
|
| Tail power law exponent with p | γ3 = | 2.031 00
|
| p-value | p = | 0.825 000
|
| Left tail power law exponent with p | γ3,1 = | 2.111 00
|
| Left p-value | p1 = | 0.005 000 00
|
| Right tail power law exponent with p | γ3,2 = | 2.651 00
|
| Right p-value | p2 = | 0.000 00
|
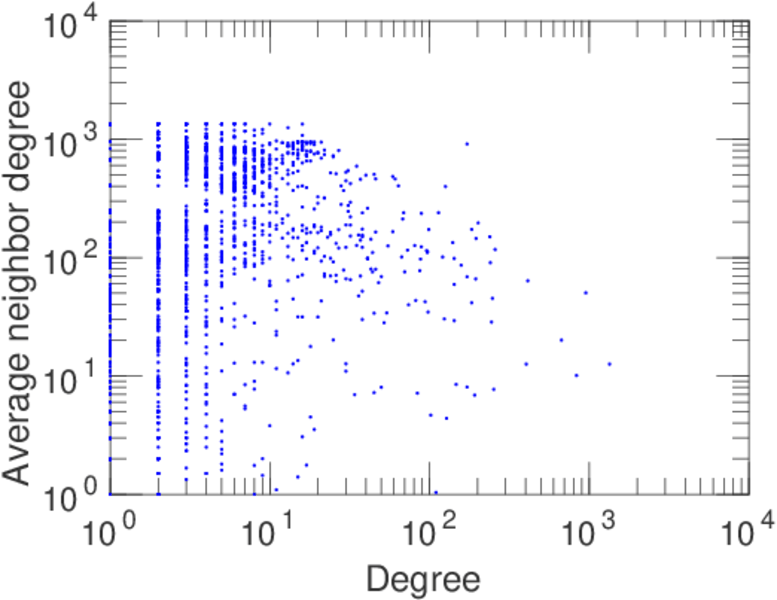
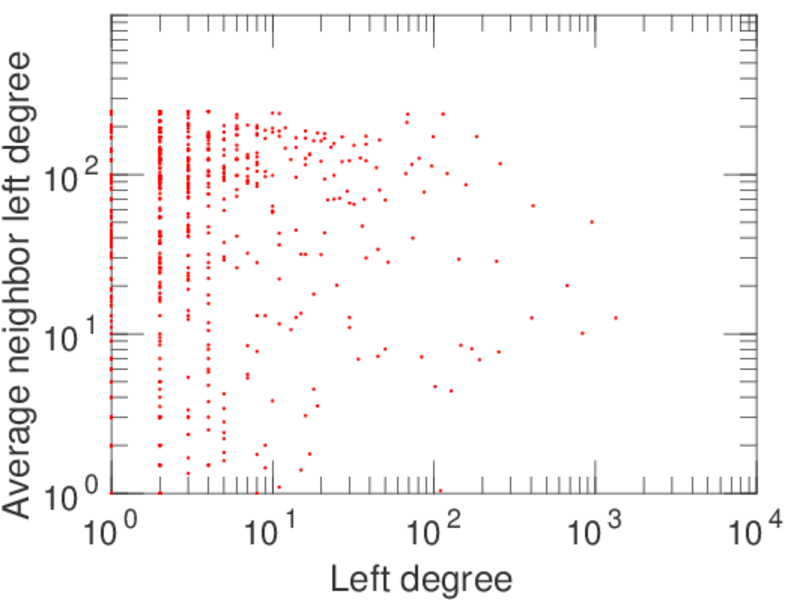
| Degree assortativity | ρ = | −0.348 980
|
| Degree assortativity p-value | pρ = | 2.442 94 × 10−157
|
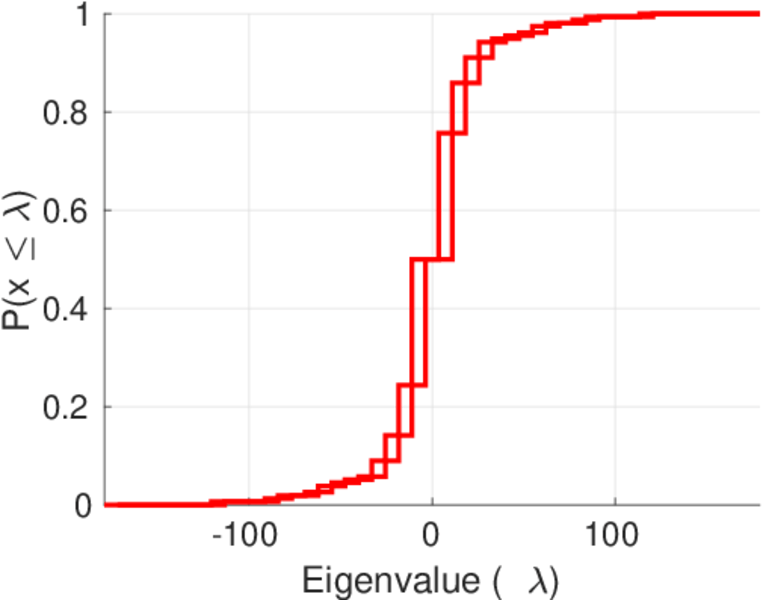
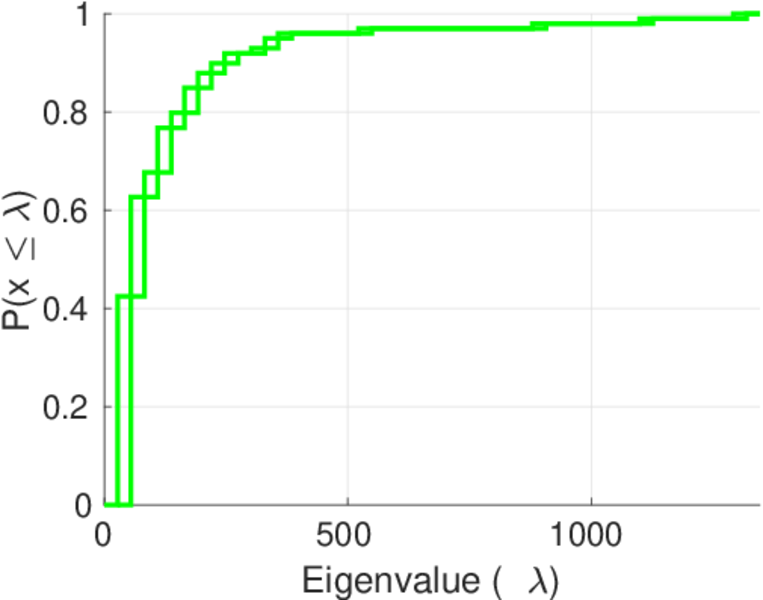
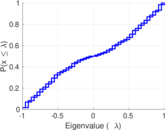
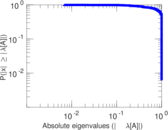
| Spectral norm | α = | 179.072
|
| Algebraic connectivity | a = | 0.006 848 45
|
| Spectral separation | |λ1[A] / λ2[A]| = | 1.223 78
|
| Controllability | C = | 1,997
|
| Relative controllability | Cr = | 0.756 153
|
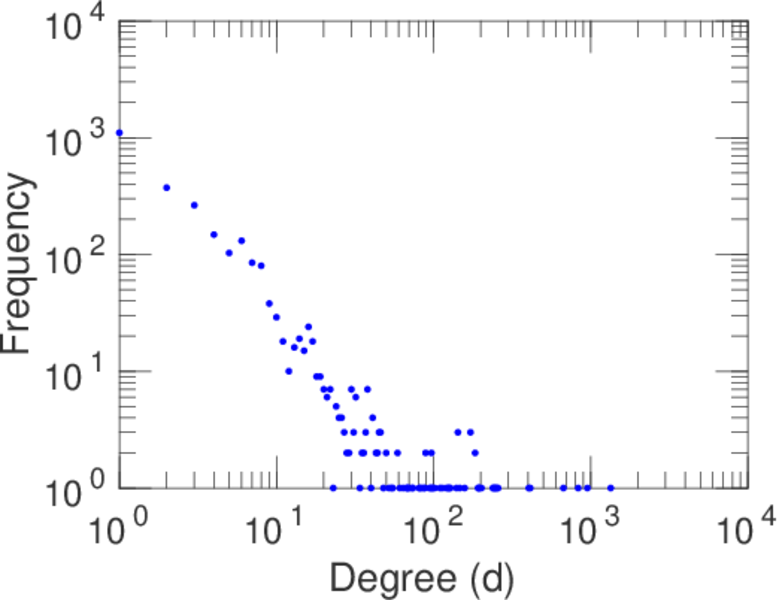
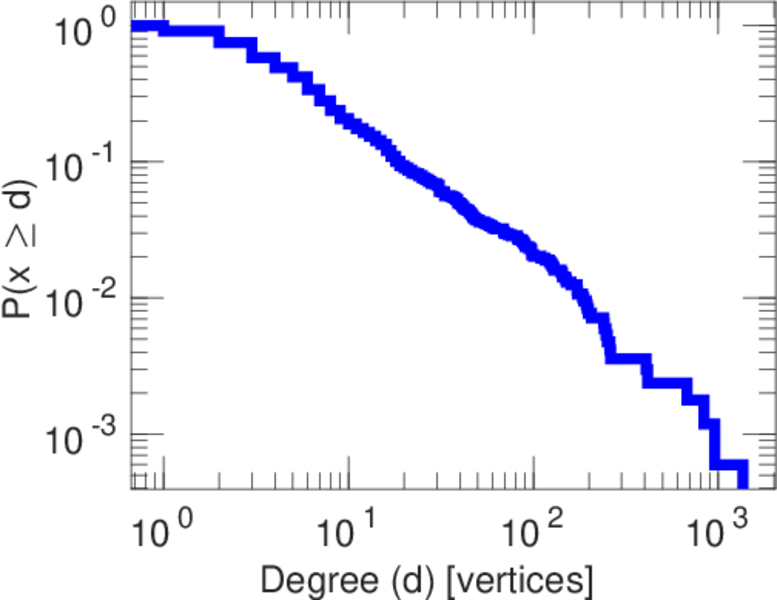
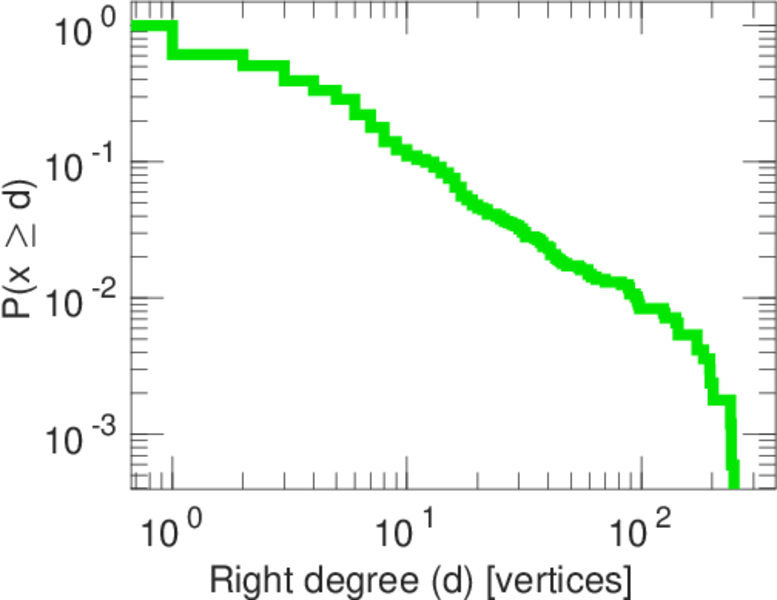
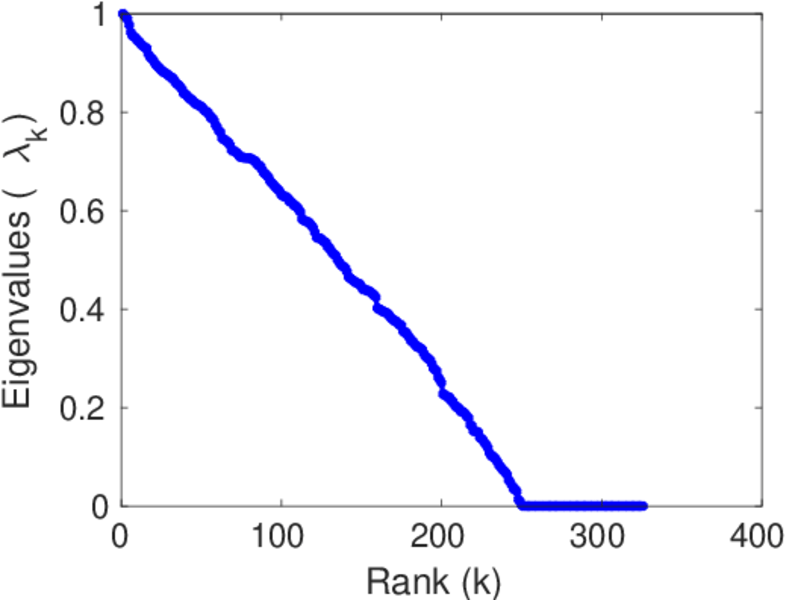
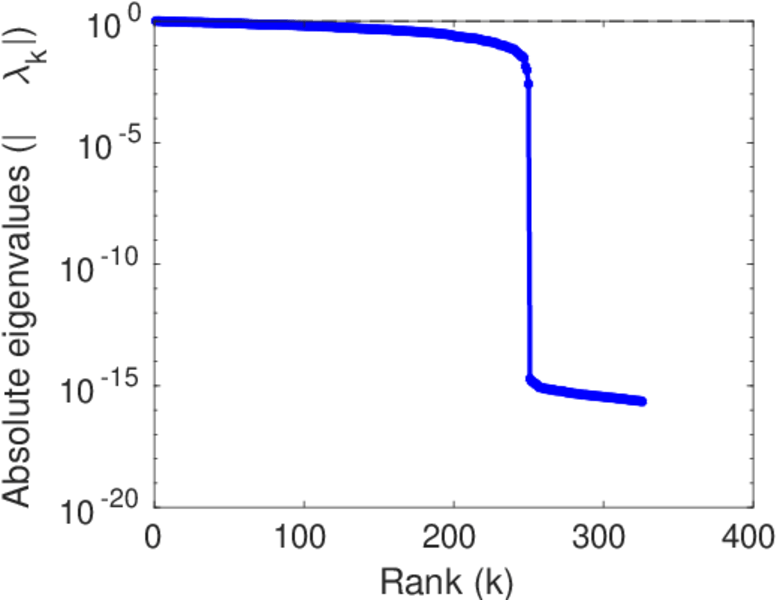
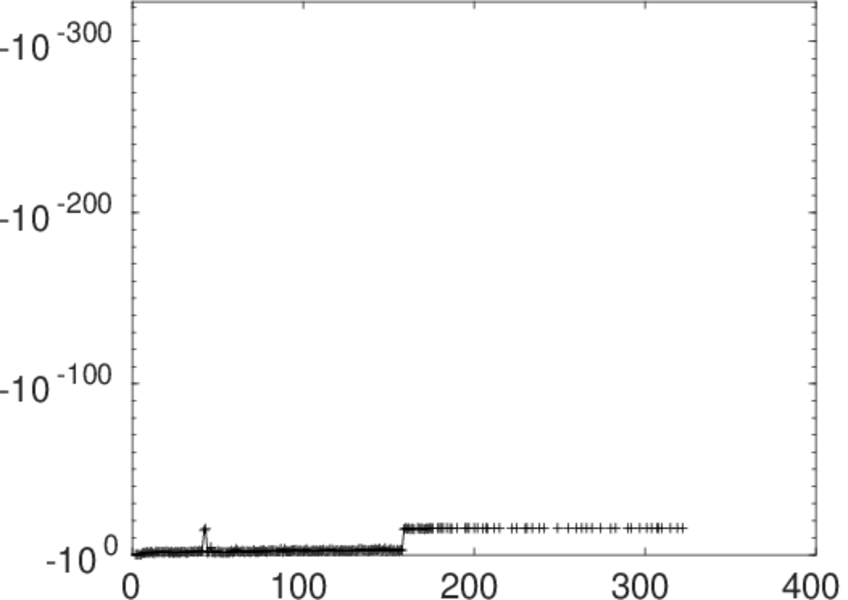
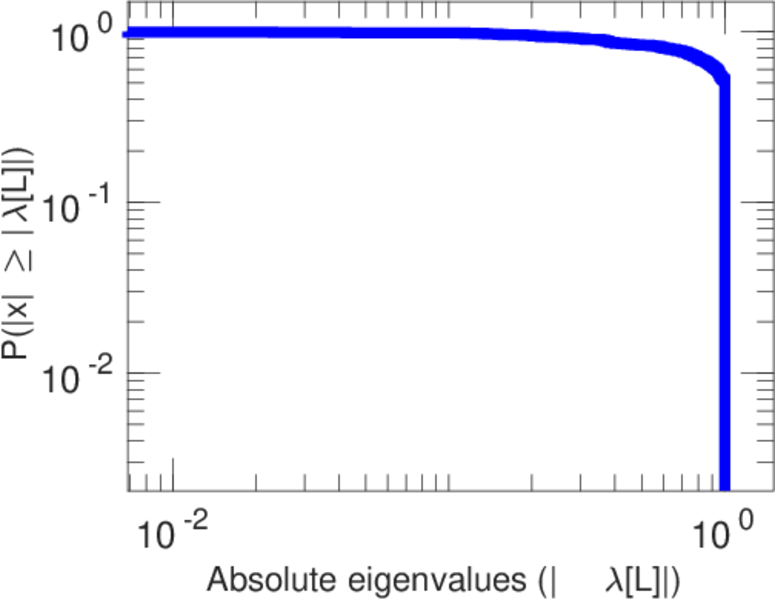
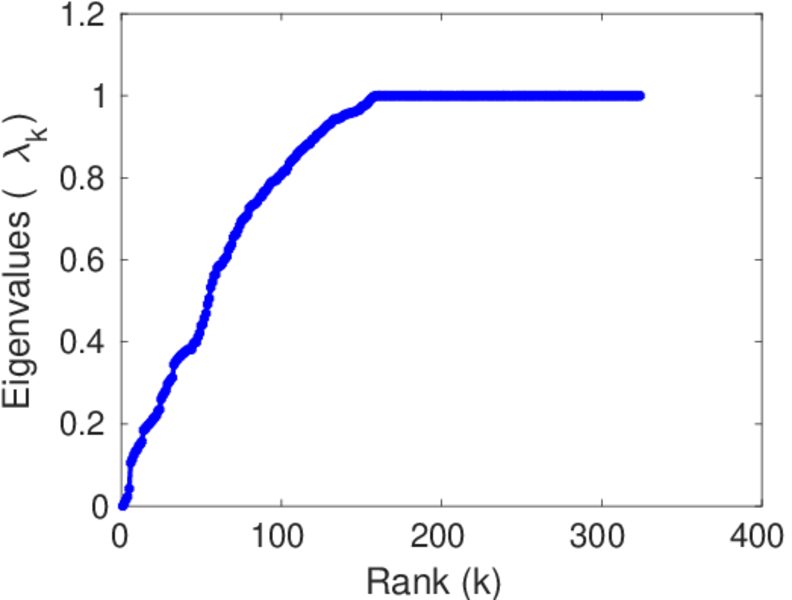
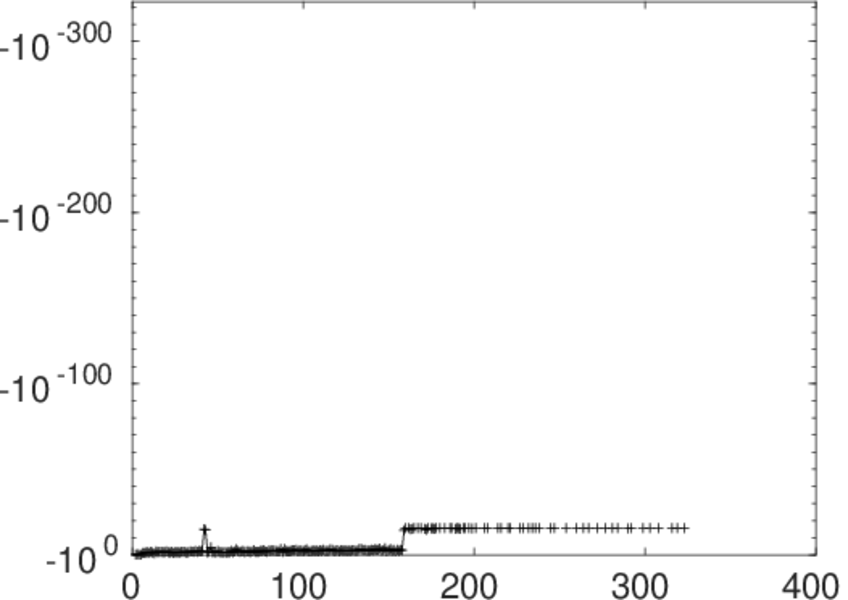
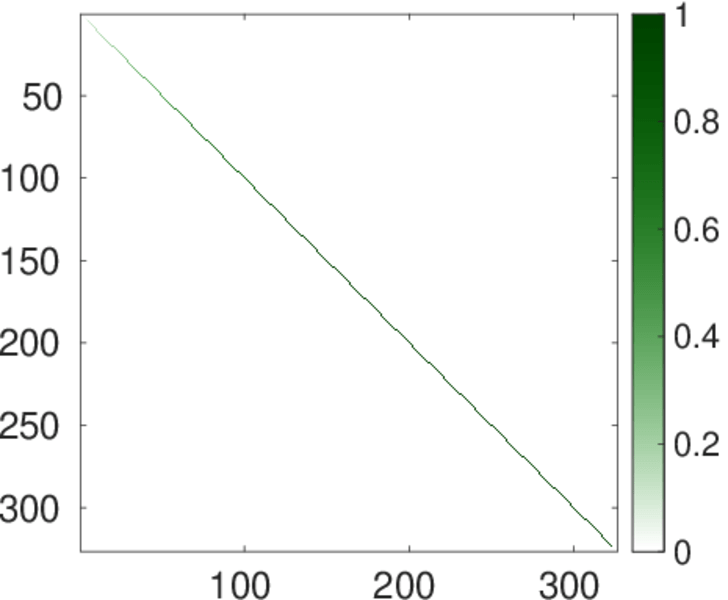
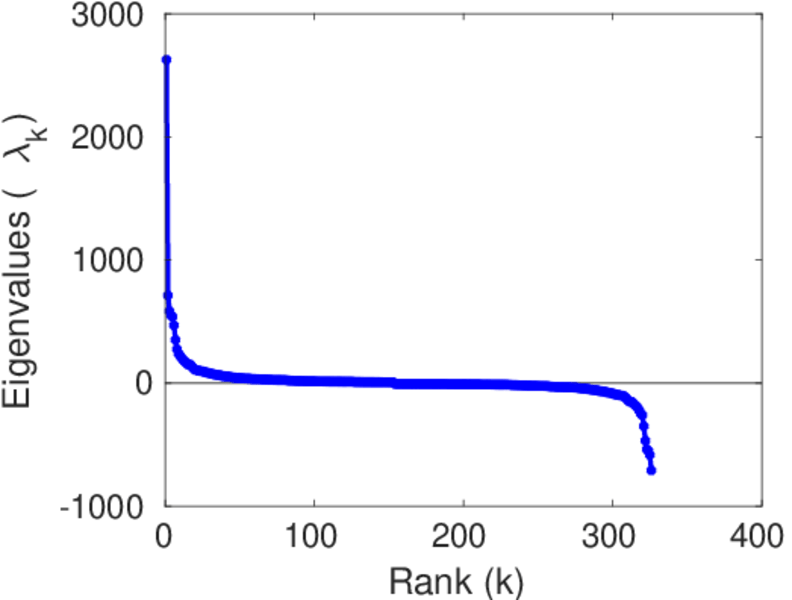
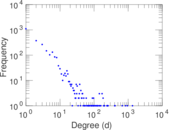
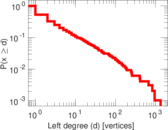
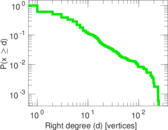
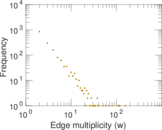
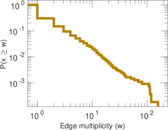
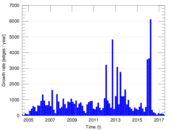
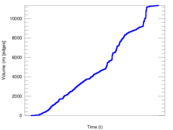
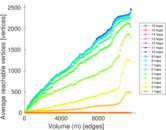
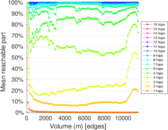
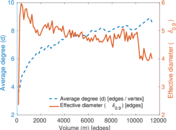
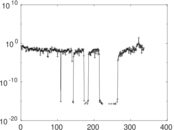
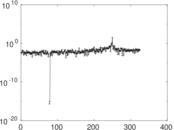
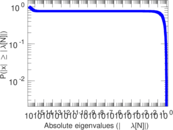
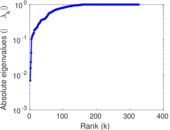
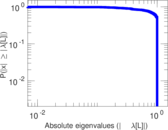
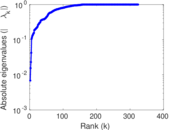
Plots


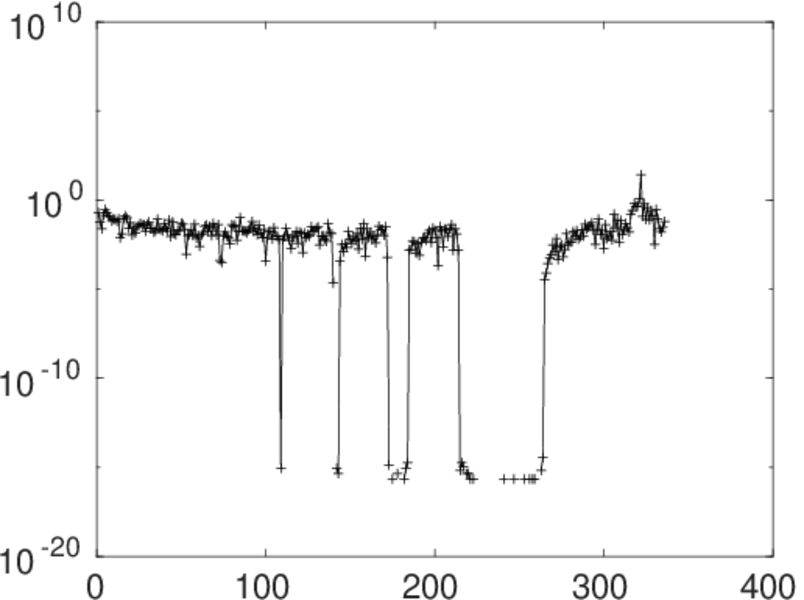
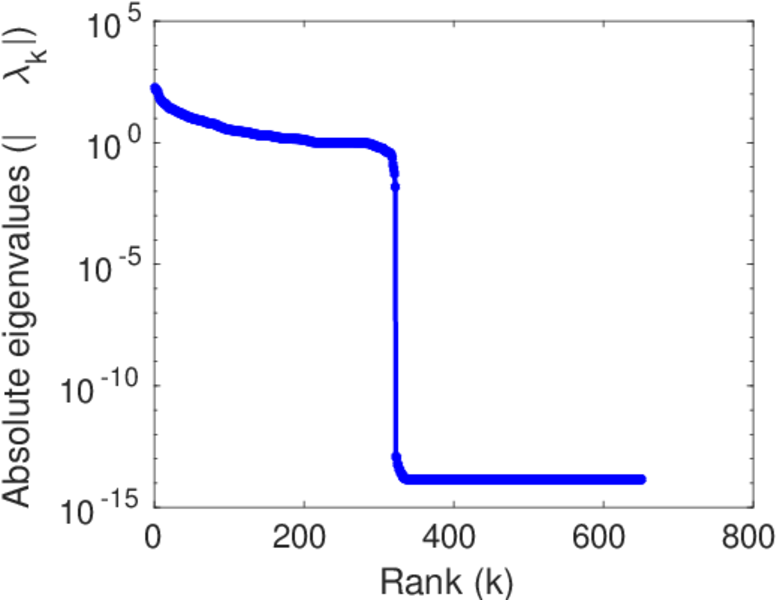
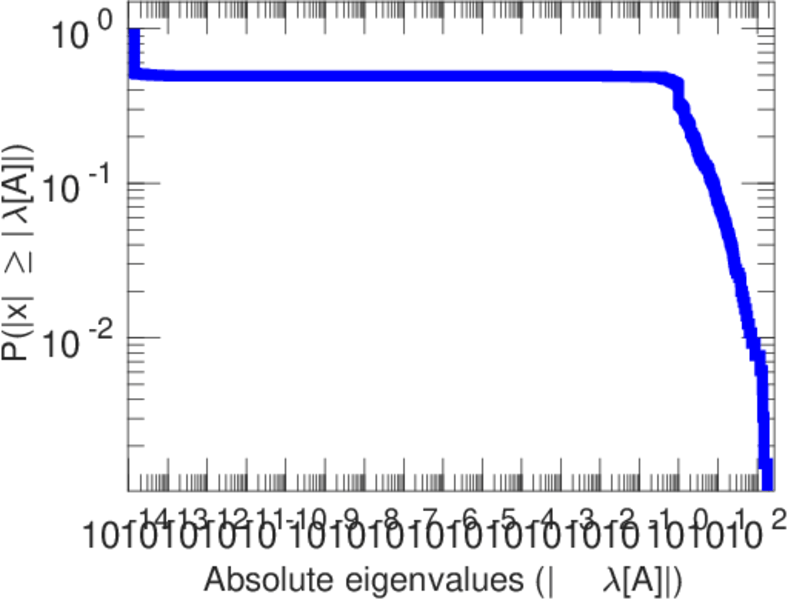
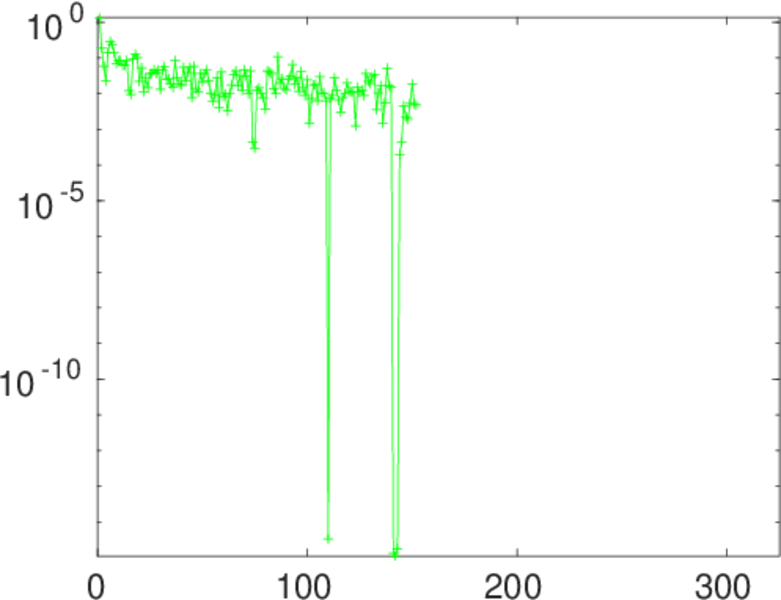
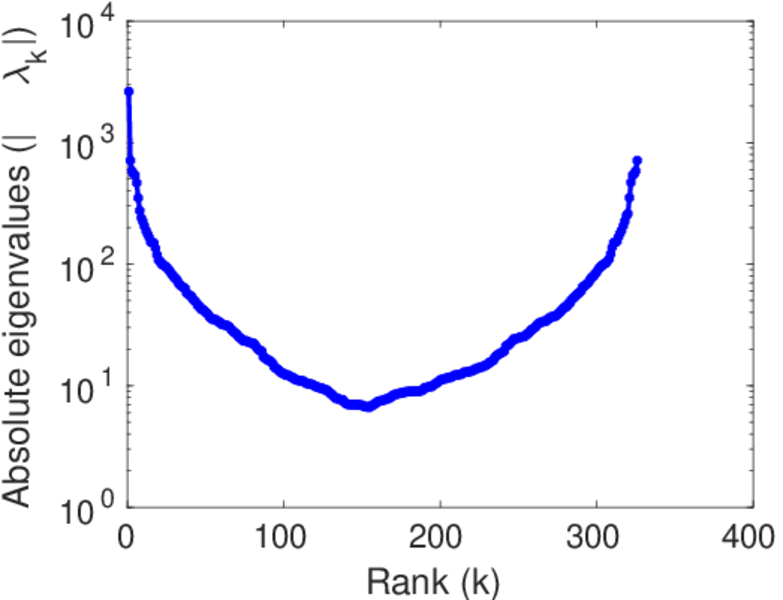
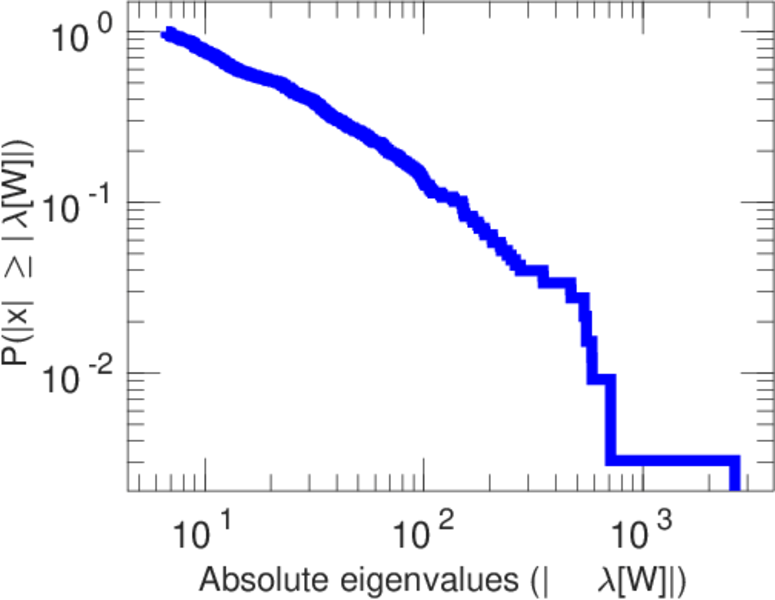
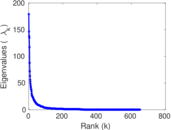
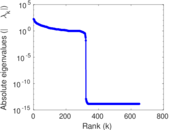
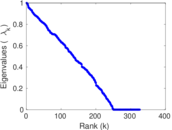
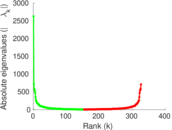
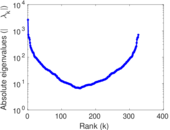
Matrix decompositions plots


Downloads
References
|
[1]
|
Jérôme Kunegis.
KONECT – The Koblenz Network Collection.
In Proc. Int. Conf. on World Wide Web Companion, pages
1343–1350, 2013.
[ http ]
|
|
[2]
|
Wikimedia Foundation.
Wikimedia downloads.
http://dumps.wikimedia.org/, January 2010.
|
 KONECT ‣ Networks ‣
Buy Me a Coffee
KONECT ‣ Networks ‣
Buy Me a Coffee