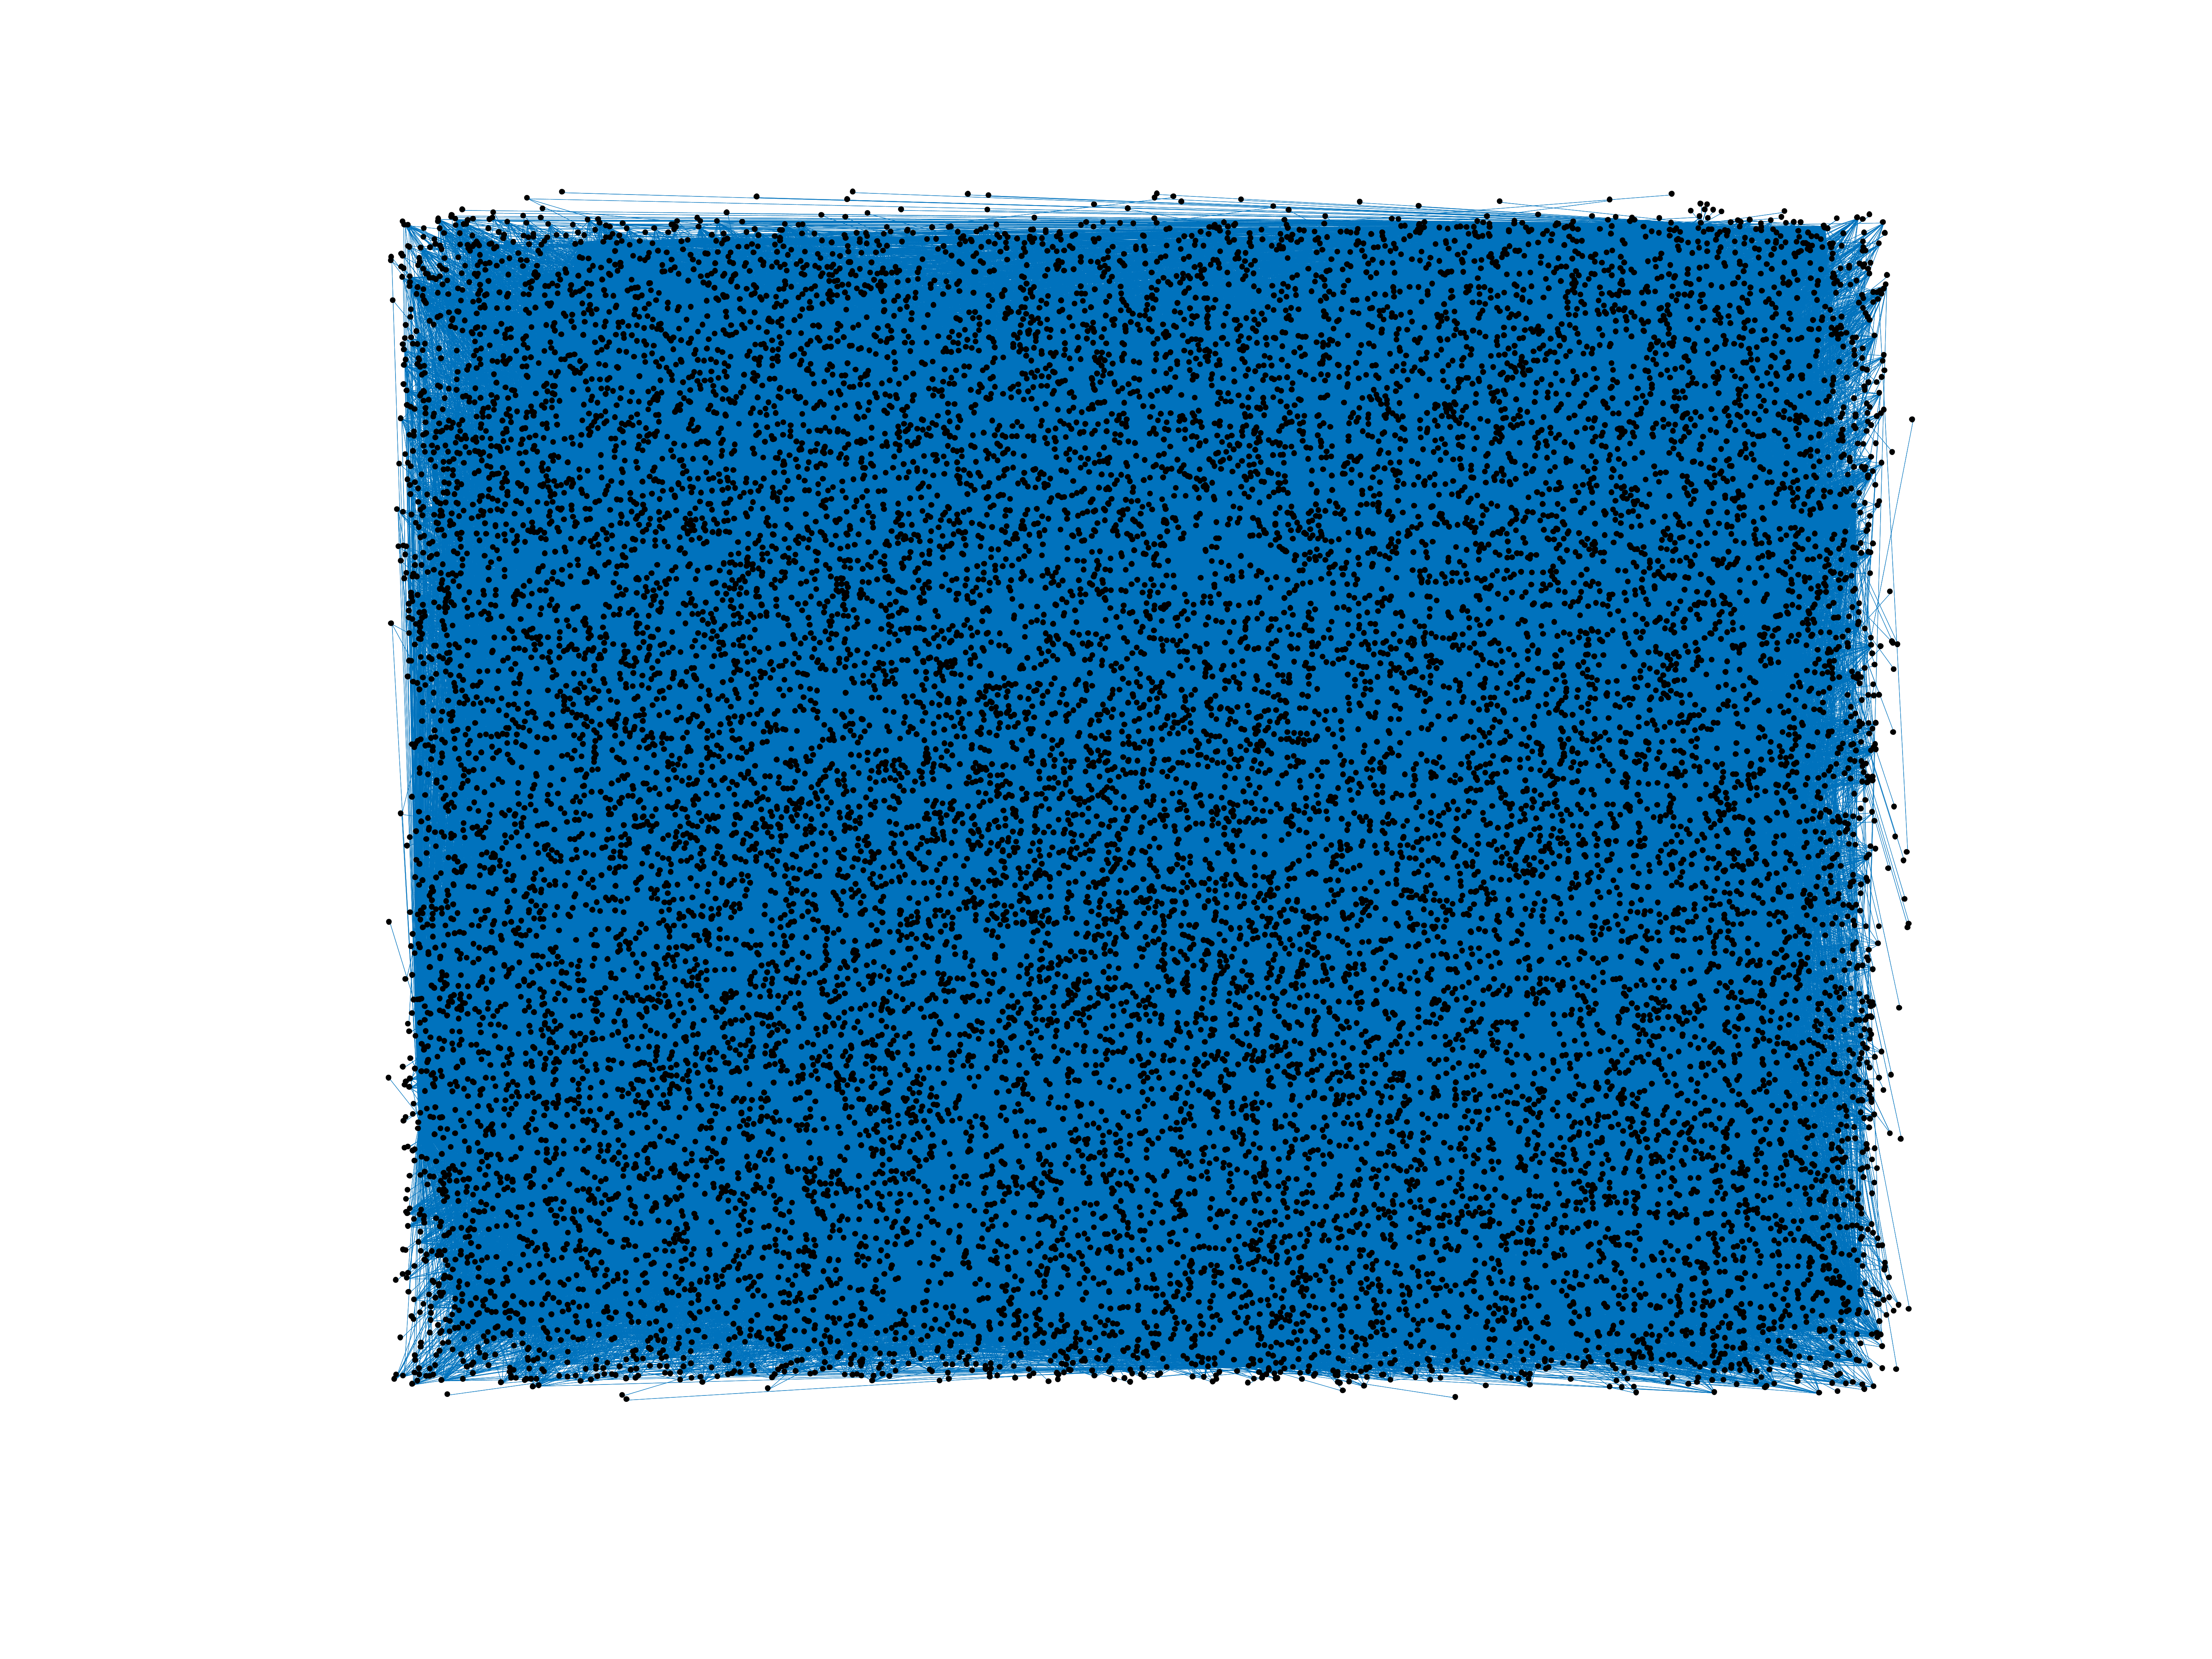
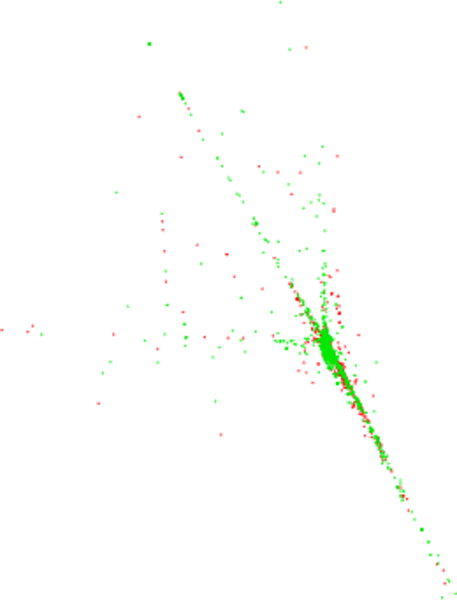
Wikipedia edits (gv)
This is the bipartite edit network of the Manx Wikipedia. It contains users and
pages from the Manx Wikipedia, connected by edit events. Each edge represents
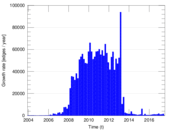
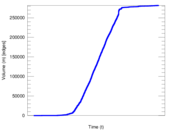
an edit. The dataset includes the timestamp of each edit.
Metadata
Statistics
| Size | n = | 18,060
|
| Left size | n1 = | 1,284
|
| Right size | n2 = | 16,776
|
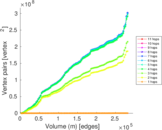
| Volume | m = | 281,618
|
| Unique edge count | m̿ = | 133,815
|
| Wedge count | s = | 274,799,517
|
| Claw count | z = | 649,253,674,418
|
| Cross count | x = | 1,443,149,123,750,590
|
| Square count | q = | 737,428,949
|
| 4-Tour count | T4 = | 6,999,112,026
|
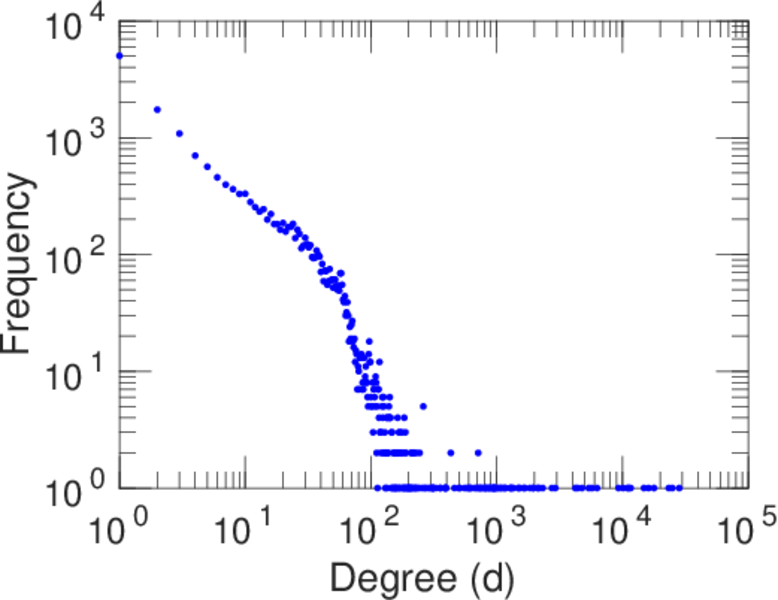
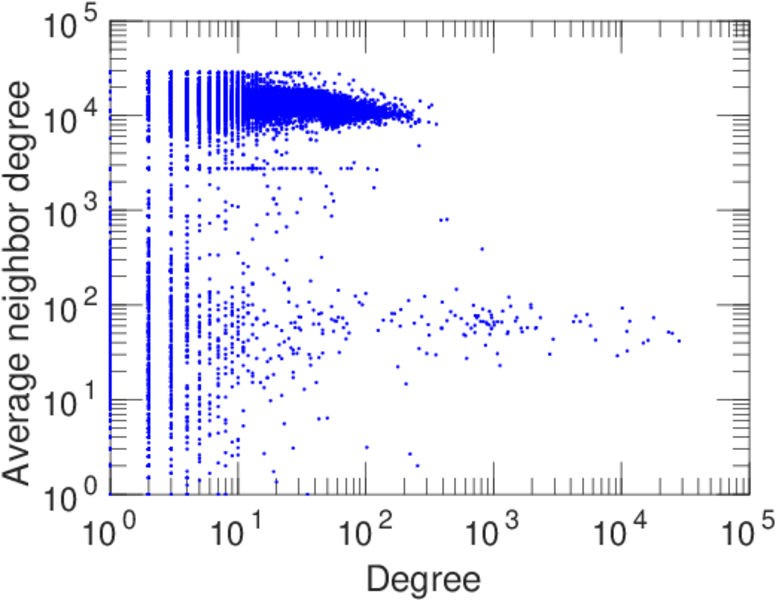
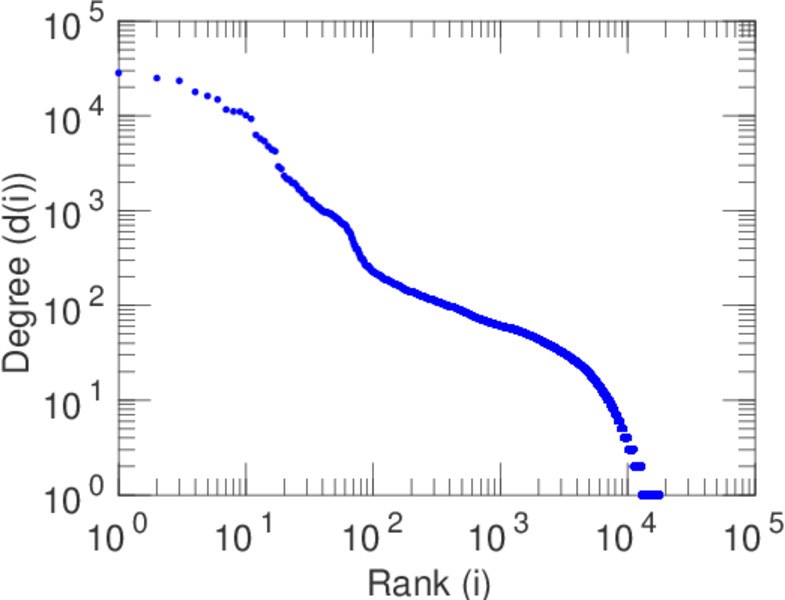
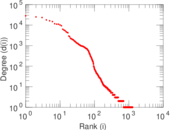
| Maximum degree | dmax = | 28,323
|
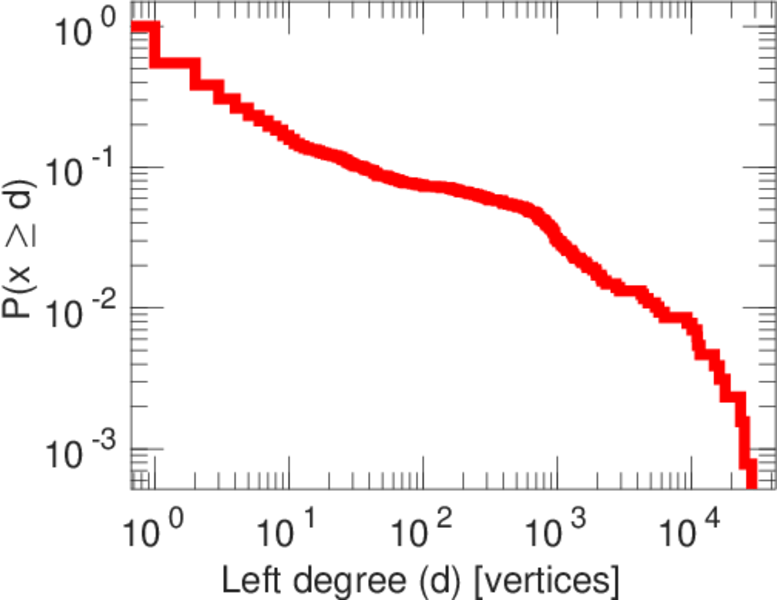
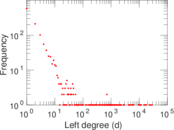
| Maximum left degree | d1max = | 28,323
|
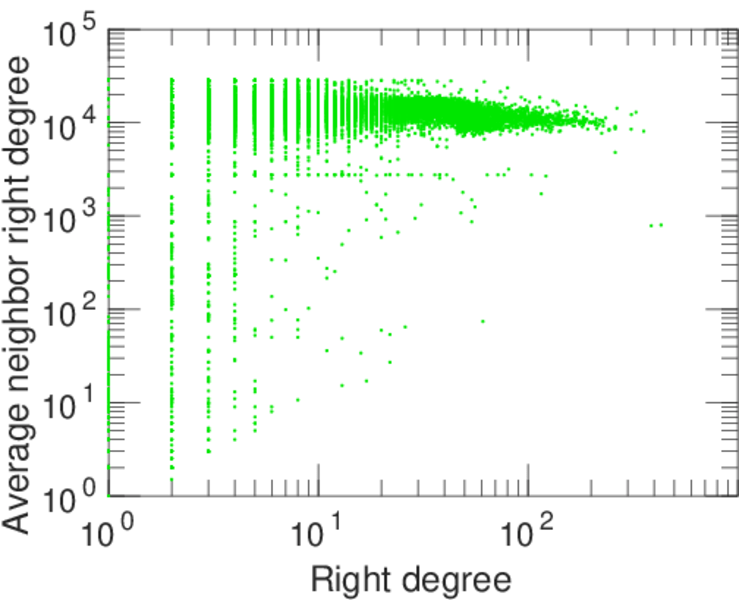
| Maximum right degree | d2max = | 432
|
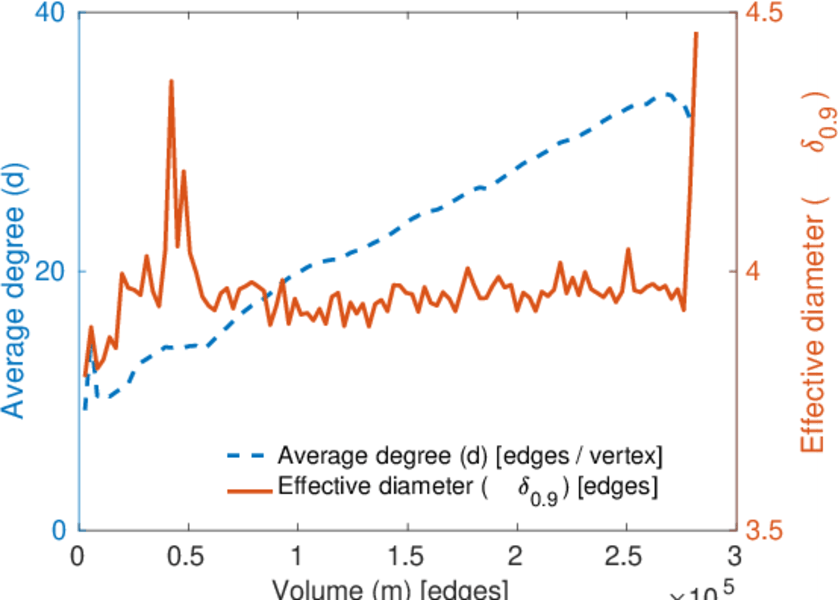
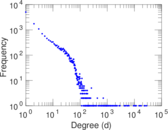
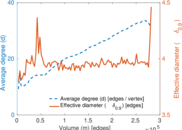
| Average degree | d = | 31.186 9
|
| Average left degree | d1 = | 219.329
|
| Average right degree | d2 = | 16.787 0
|
| Fill | p = | 0.006 212 28
|
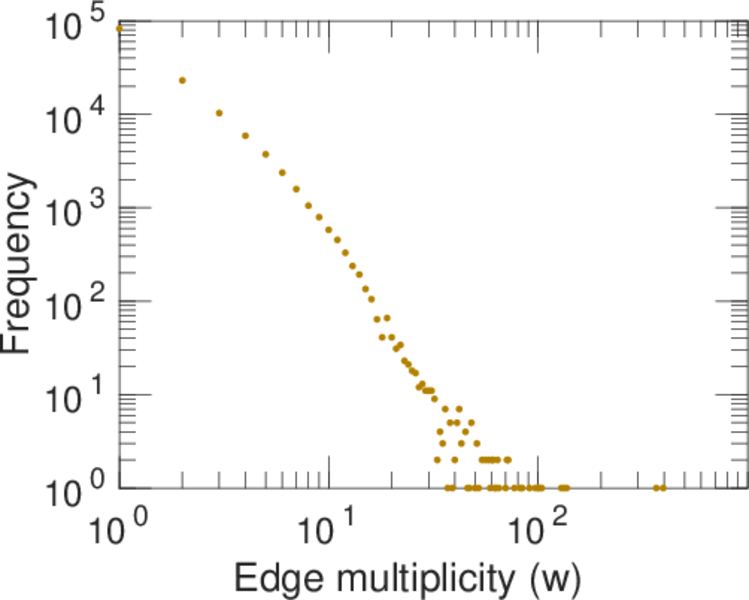
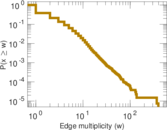
| Average edge multiplicity | m̃ = | 2.104 53
|
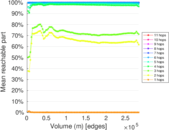
| Size of LCC | N = | 17,367
|
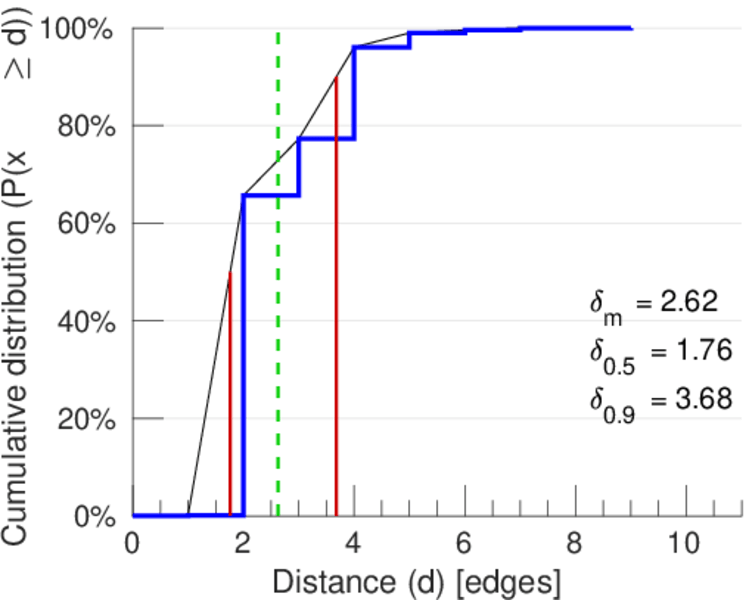
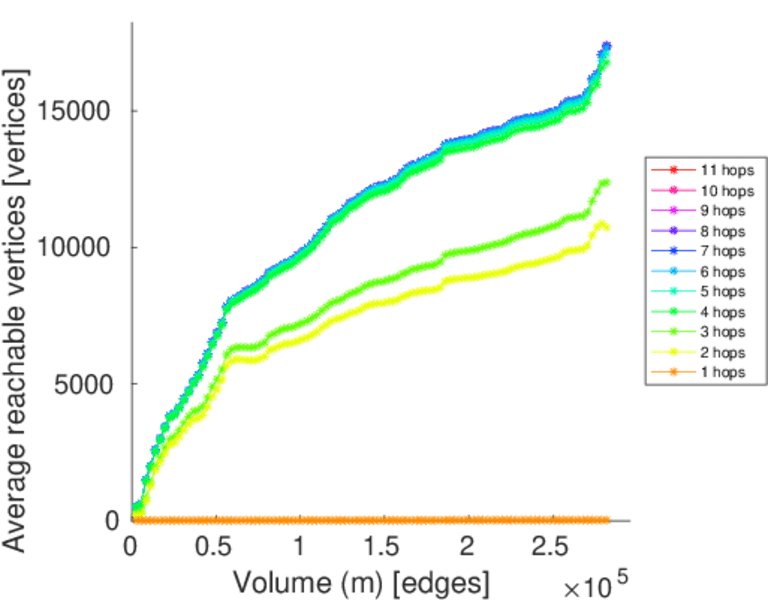
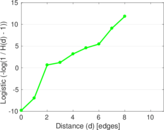
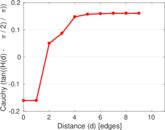
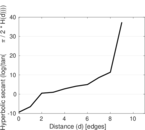
| Diameter | δ = | 11
|
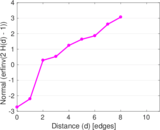
| 50-Percentile effective diameter | δ0.5 = | 1.761 12
|
| 90-Percentile effective diameter | δ0.9 = | 3.677 59
|
| Median distance | δM = | 2
|
| Mean distance | δm = | 2.623 58
|
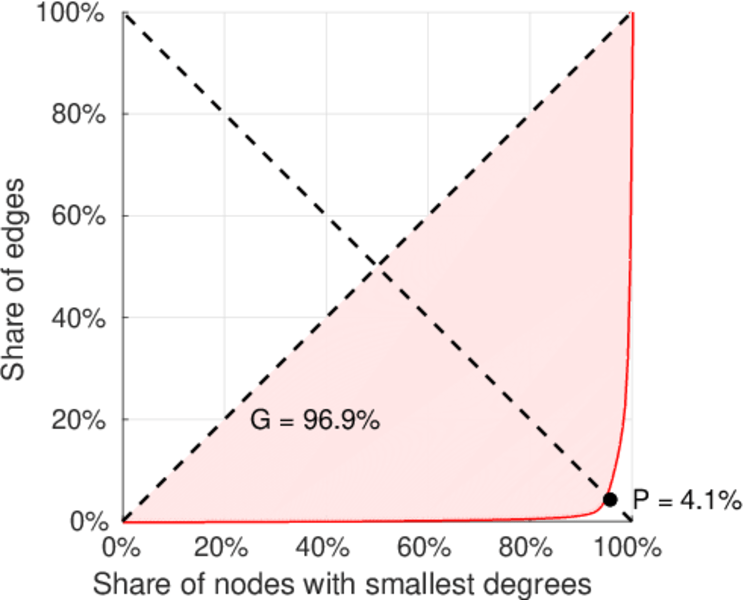
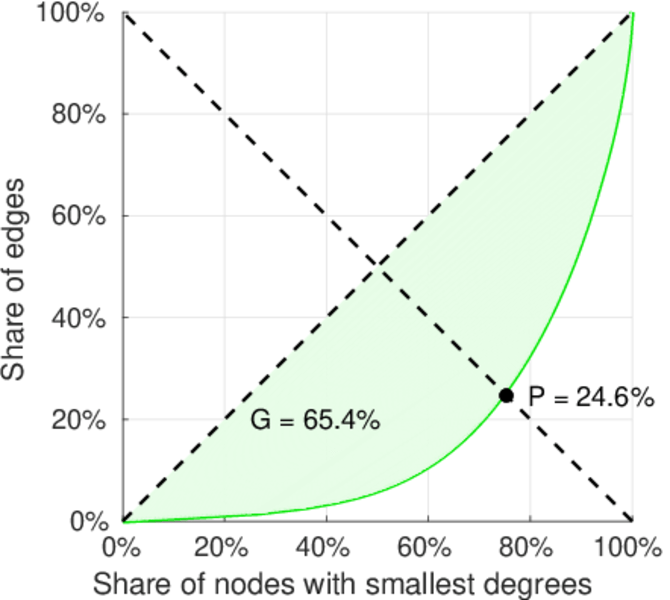
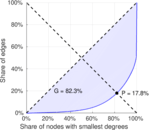
| Gini coefficient | G = | 0.819 466
|
| Balanced inequality ratio | P = | 0.183 520
|
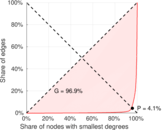
| Left balanced inequality ratio | P1 = | 0.040 931 3
|
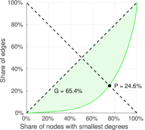
| Right balanced inequality ratio | P2 = | 0.245 510
|
| Relative edge distribution entropy | Her = | 0.747 788
|
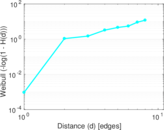
| Power law exponent | γ = | 1.730 11
|
| Tail power law exponent | γt = | 2.731 00
|
| Tail power law exponent with p | γ3 = | 2.731 00
|
| p-value | p = | 0.000 00
|
| Left tail power law exponent with p | γ3,1 = | 1.651 00
|
| Left p-value | p1 = | 0.000 00
|
| Right tail power law exponent with p | γ3,2 = | 5.851 00
|
| Right p-value | p2 = | 0.000 00
|
| Degree assortativity | ρ = | −0.358 367
|
| Degree assortativity p-value | pρ = | 0.000 00
|
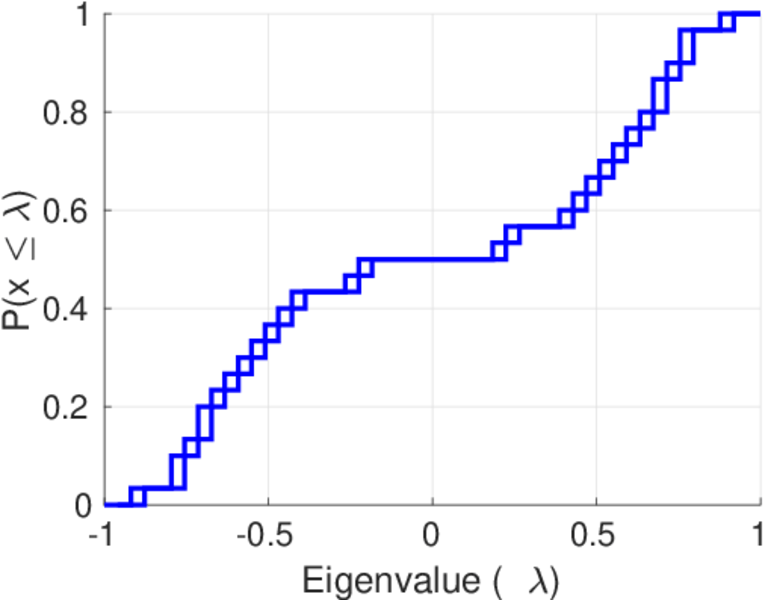
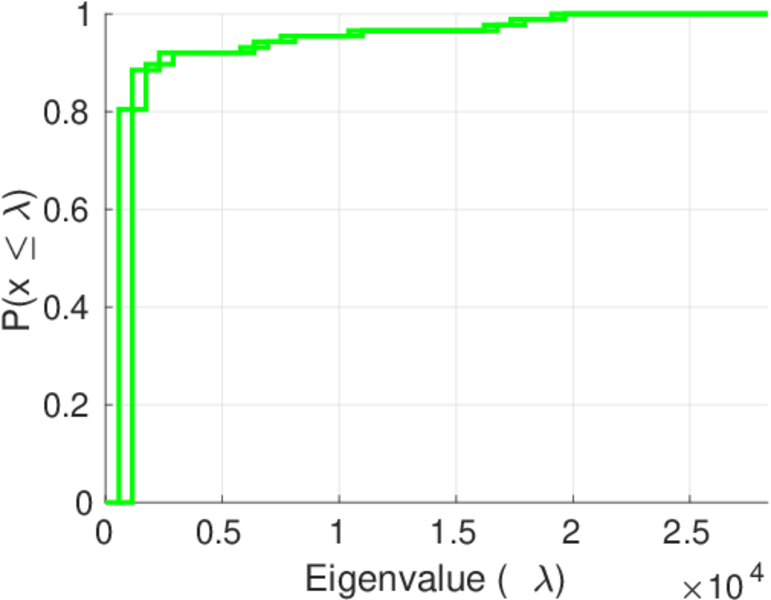
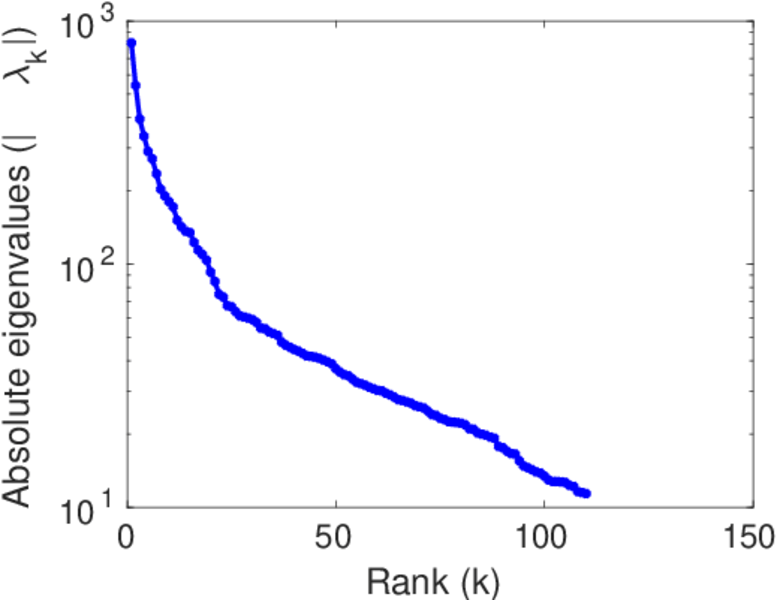
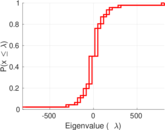
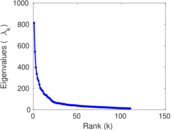
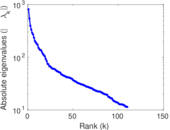
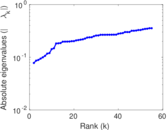
| Spectral norm | α = | 813.174
|
| Algebraic connectivity | a = | 0.077 802 1
|
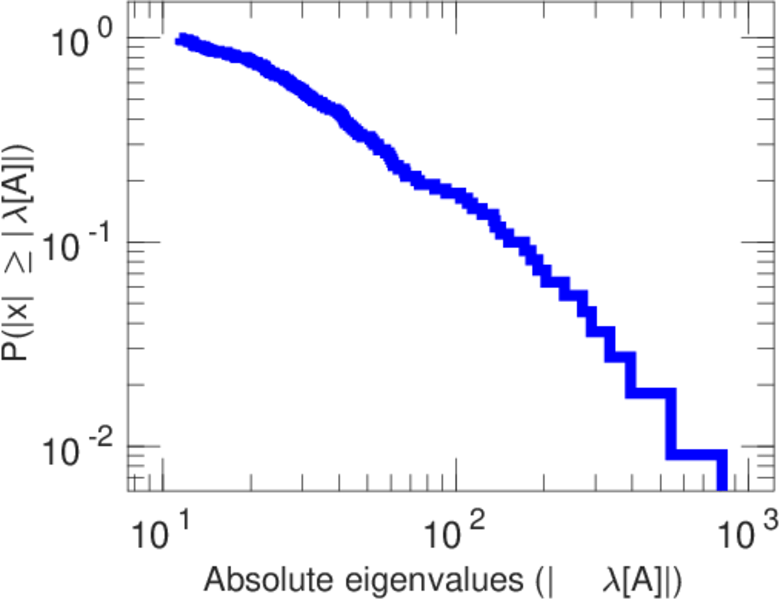
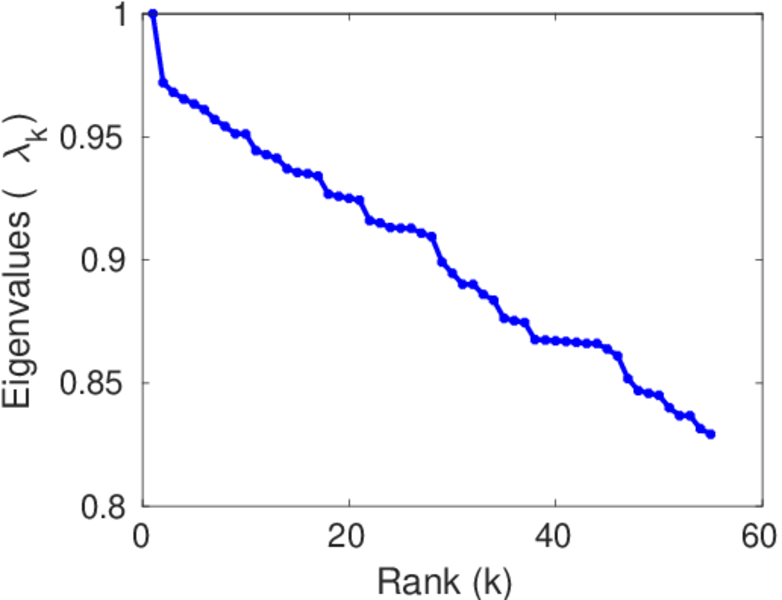
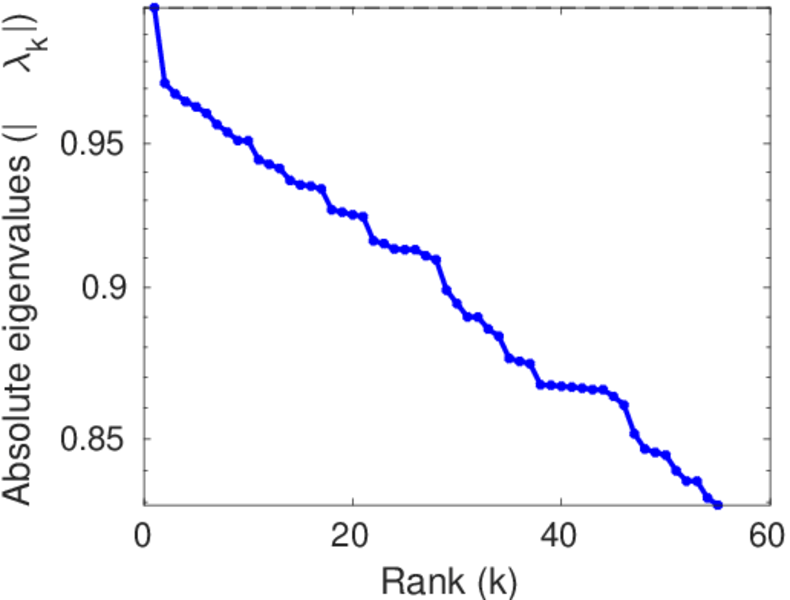
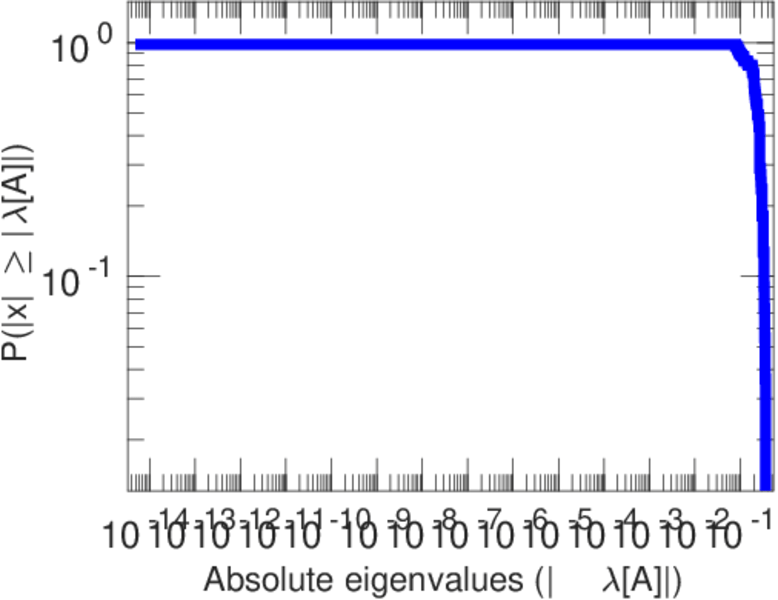
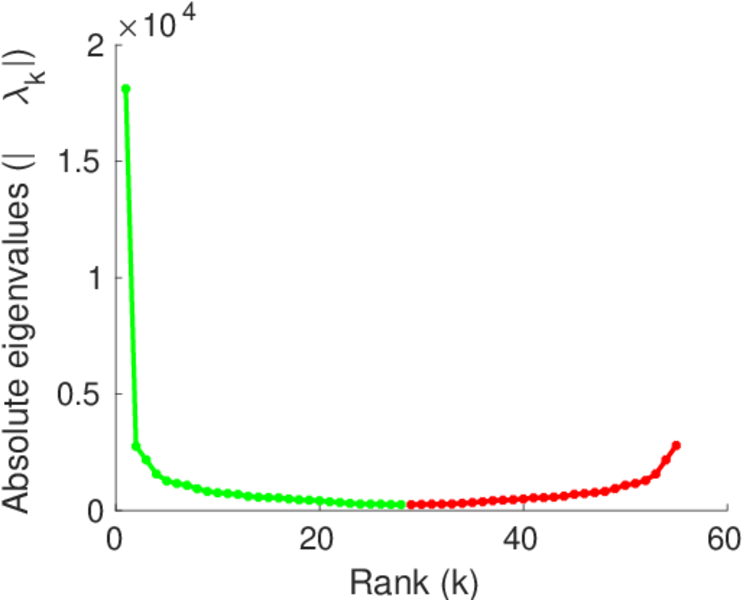
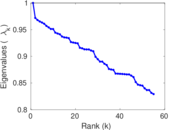
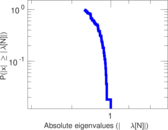
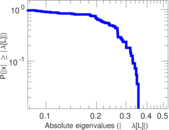
| Spectral separation | |λ1[A] / λ2[A]| = | 1.497 04
|
| Controllability | C = | 15,506
|
| Relative controllability | Cr = | 0.866 741
|
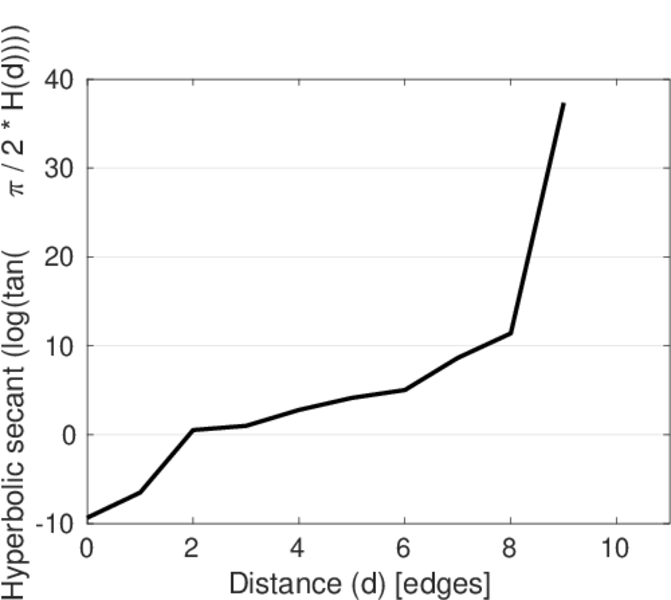
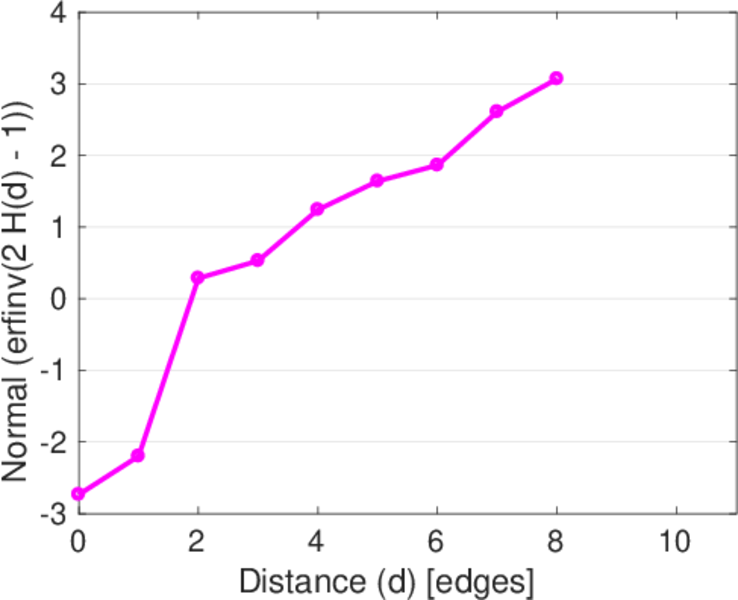
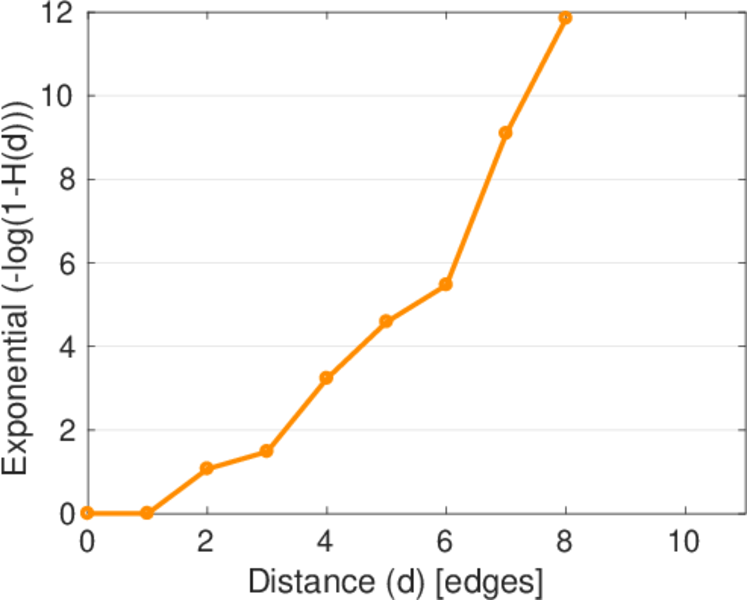
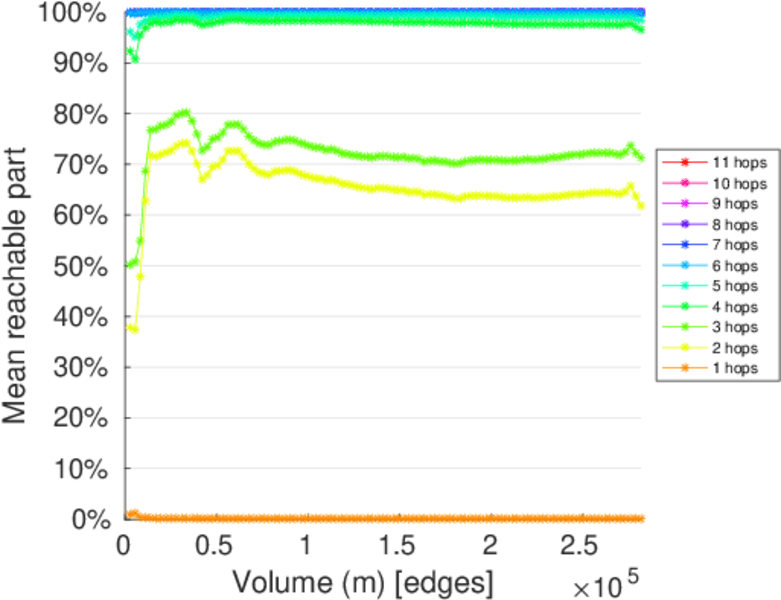
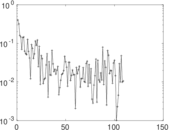
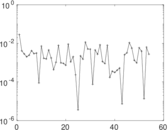
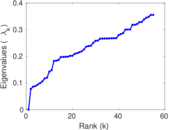
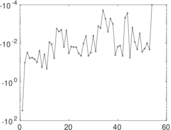
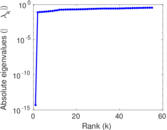
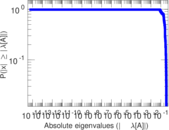
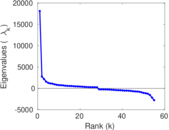
Plots


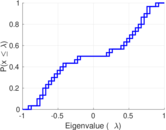


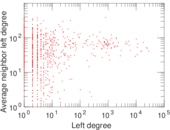


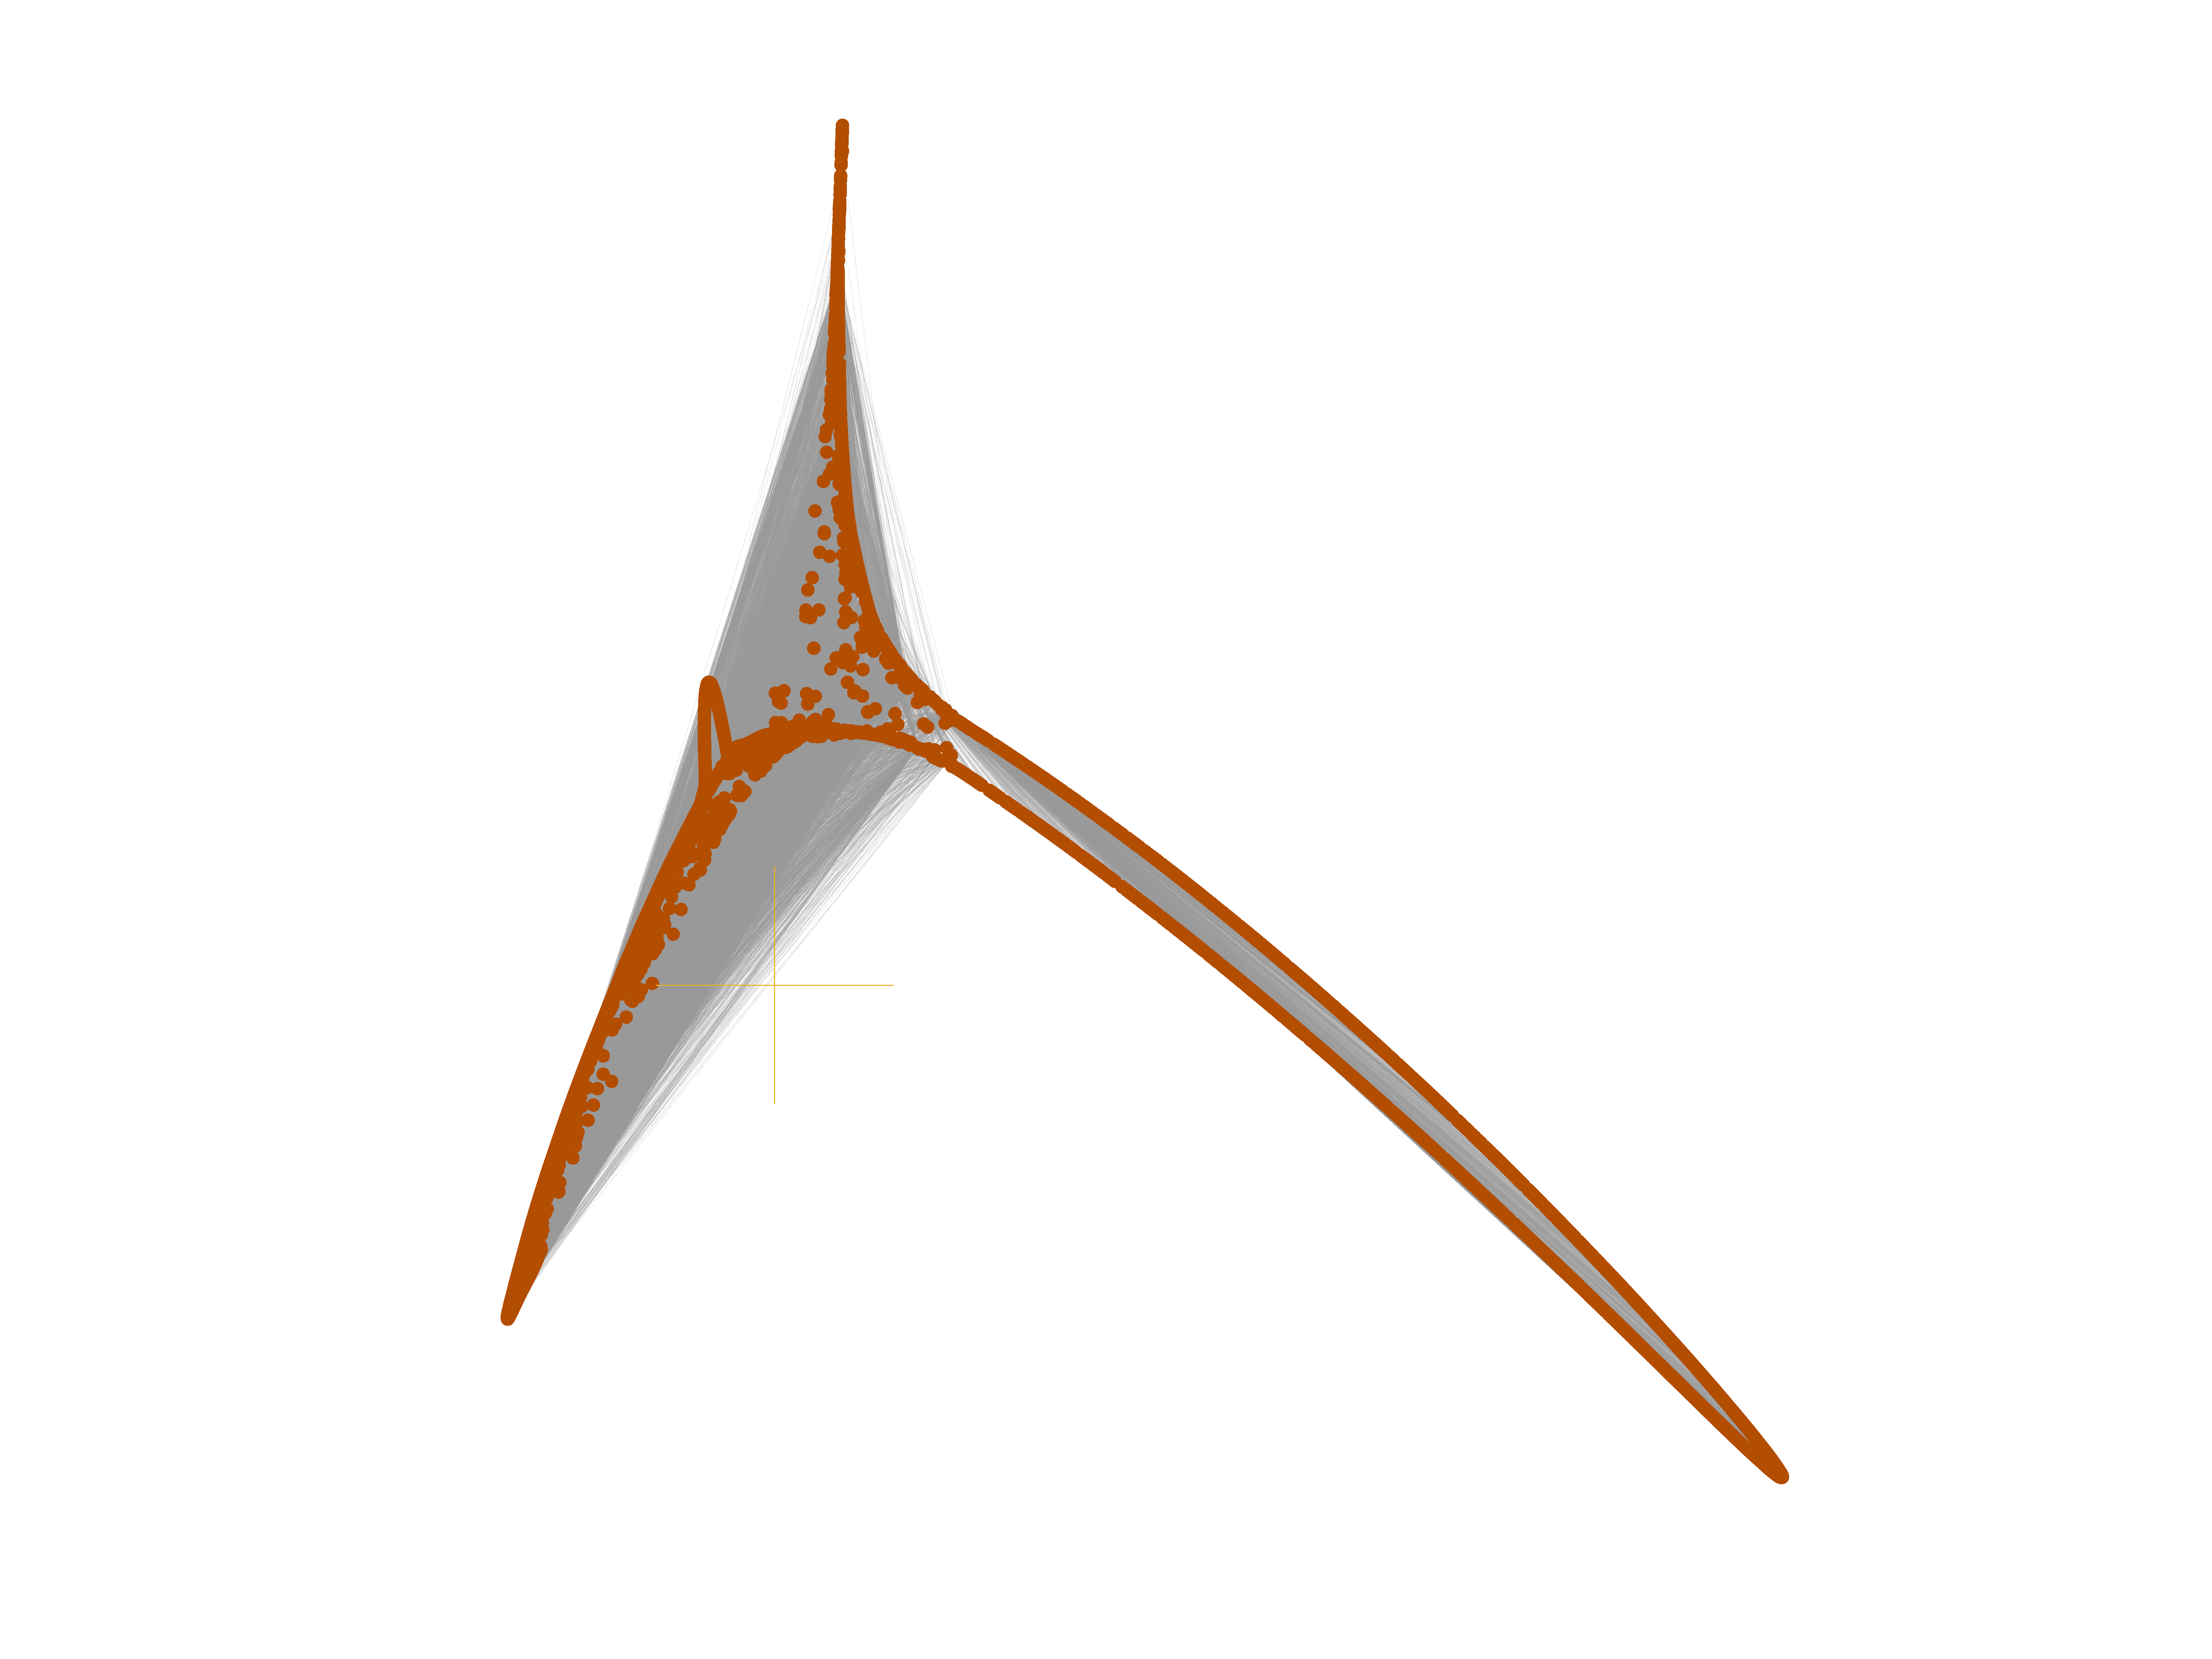
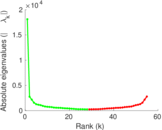
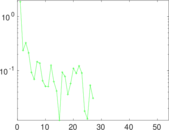
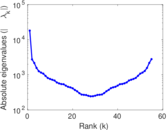
Matrix decompositions plots


Downloads
References
|
[1]
|
Jérôme Kunegis.
KONECT – The Koblenz Network Collection.
In Proc. Int. Conf. on World Wide Web Companion, pages
1343–1350, 2013.
[ http ]
|
|
[2]
|
Wikimedia Foundation.
Wikimedia downloads.
http://dumps.wikimedia.org/, January 2010.
|
 KONECT ‣ Networks ‣
Buy Me a Coffee
KONECT ‣ Networks ‣
Buy Me a Coffee