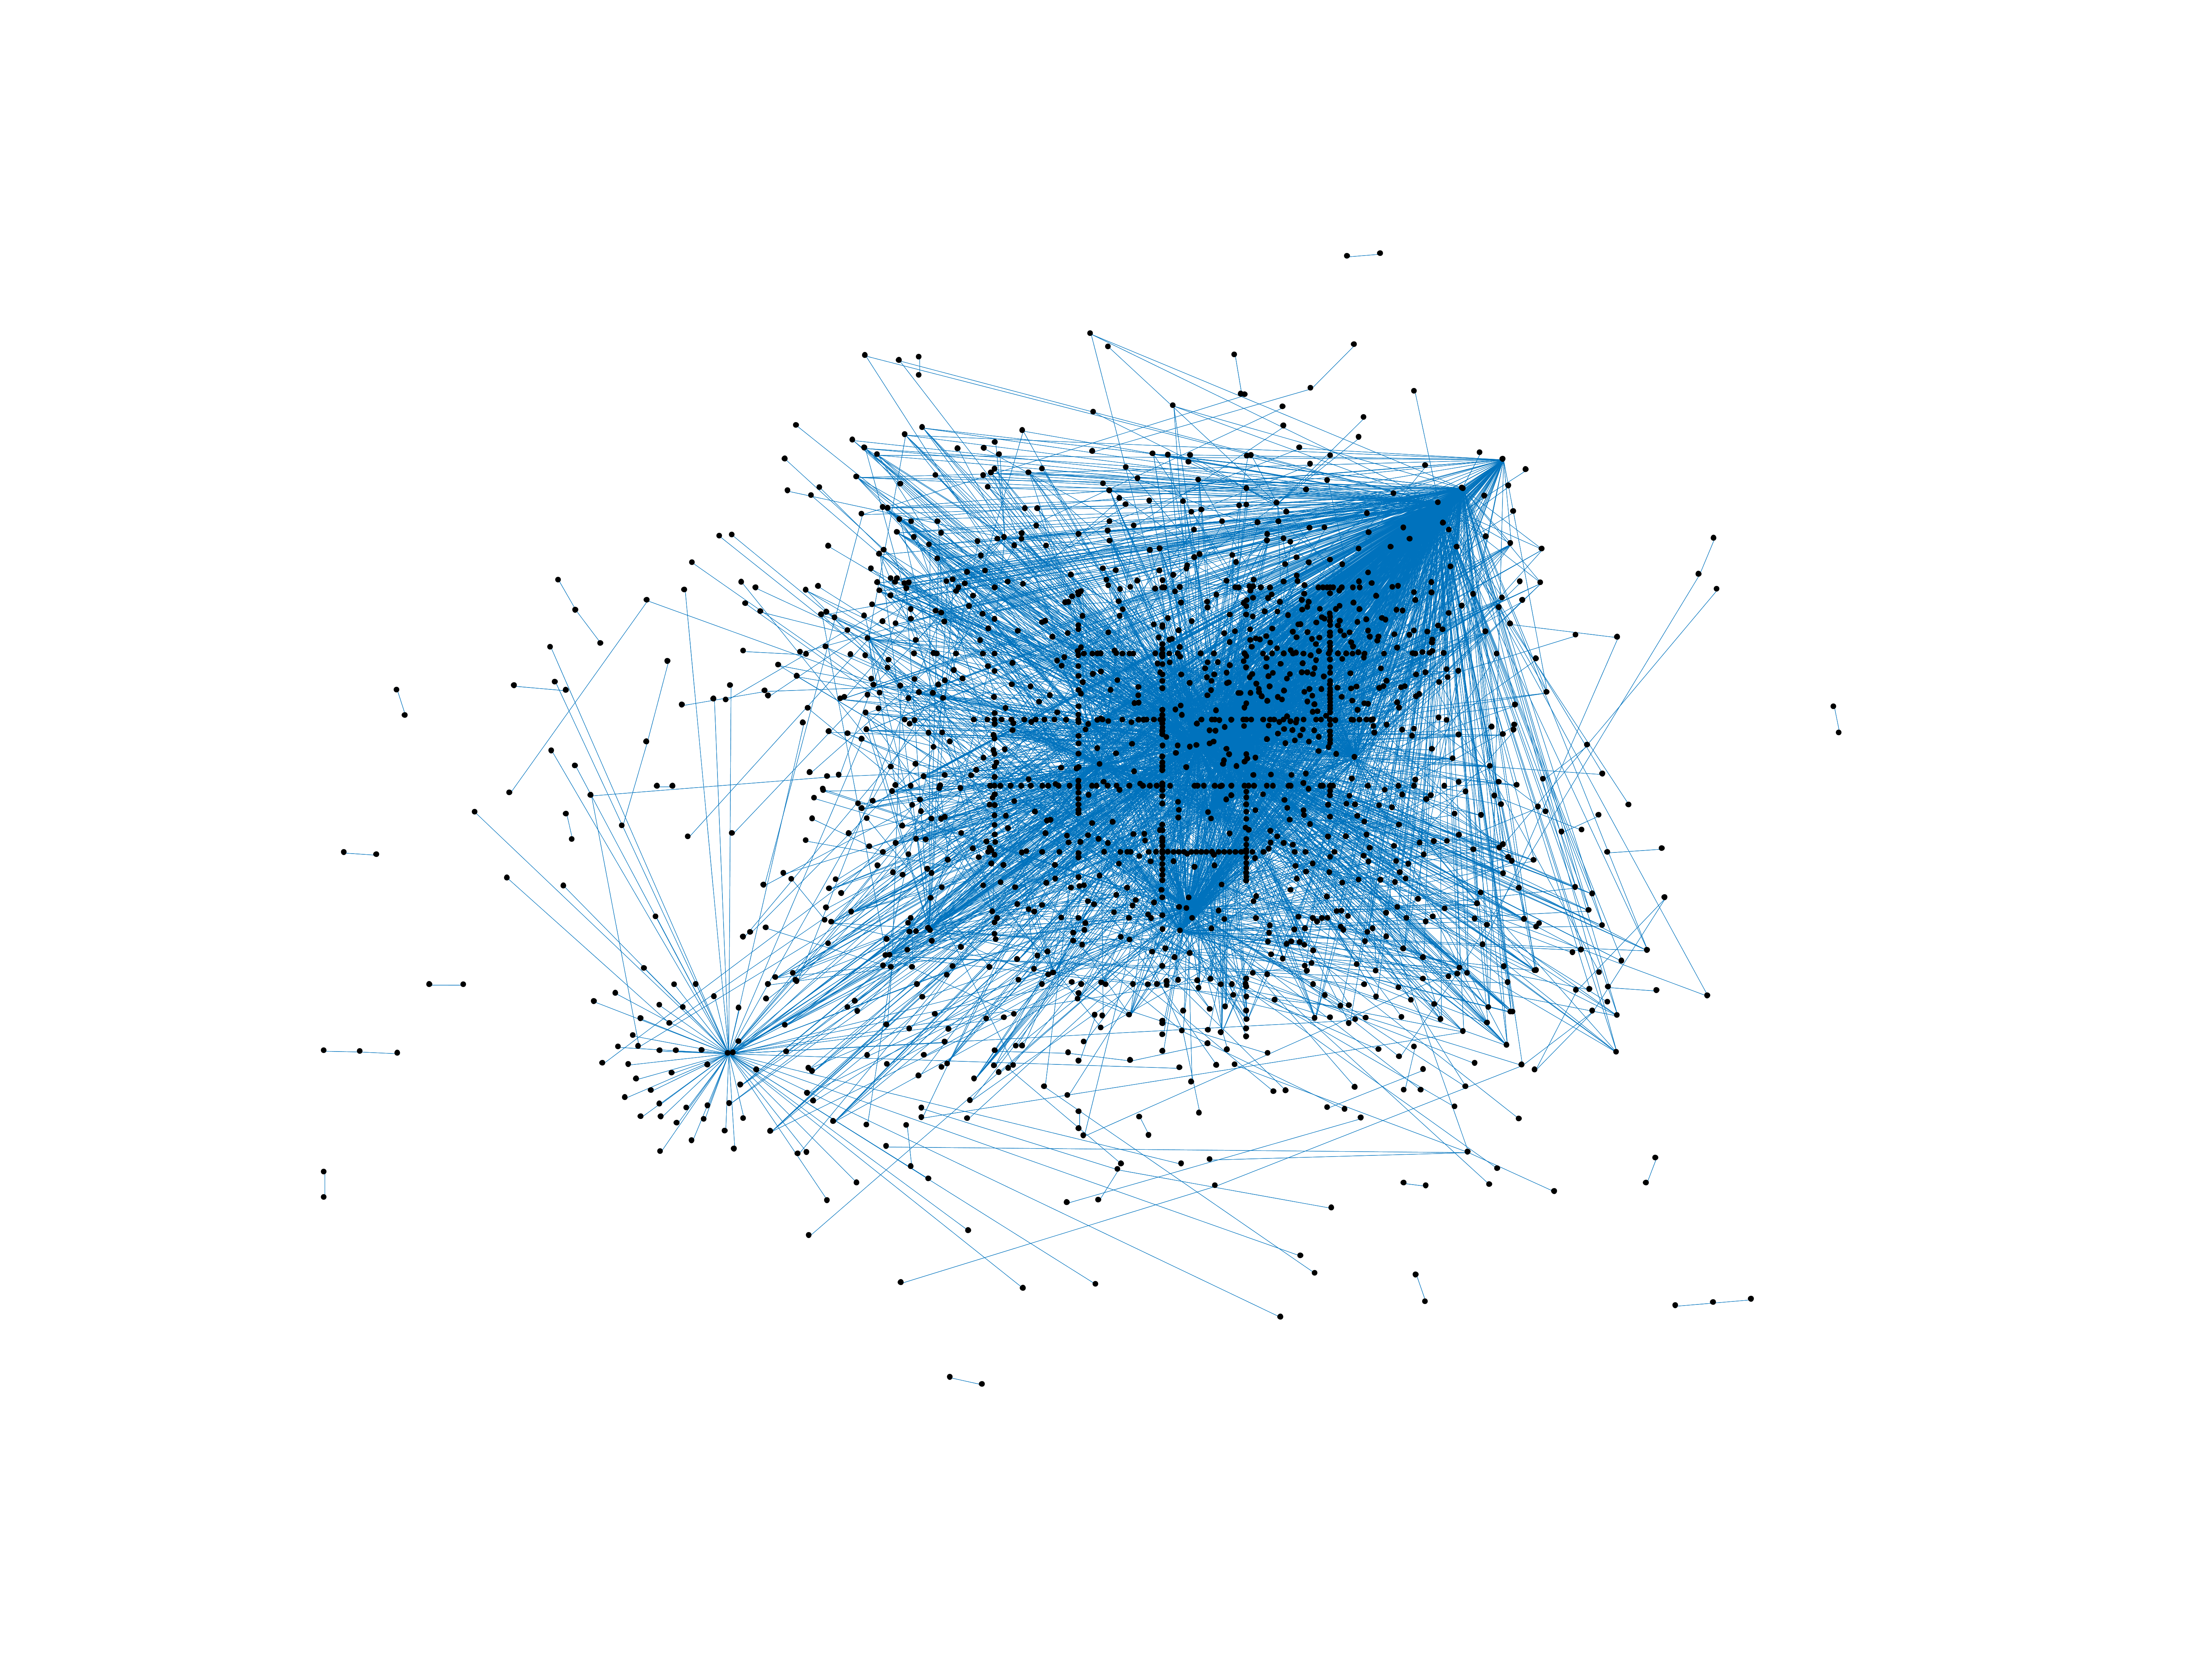
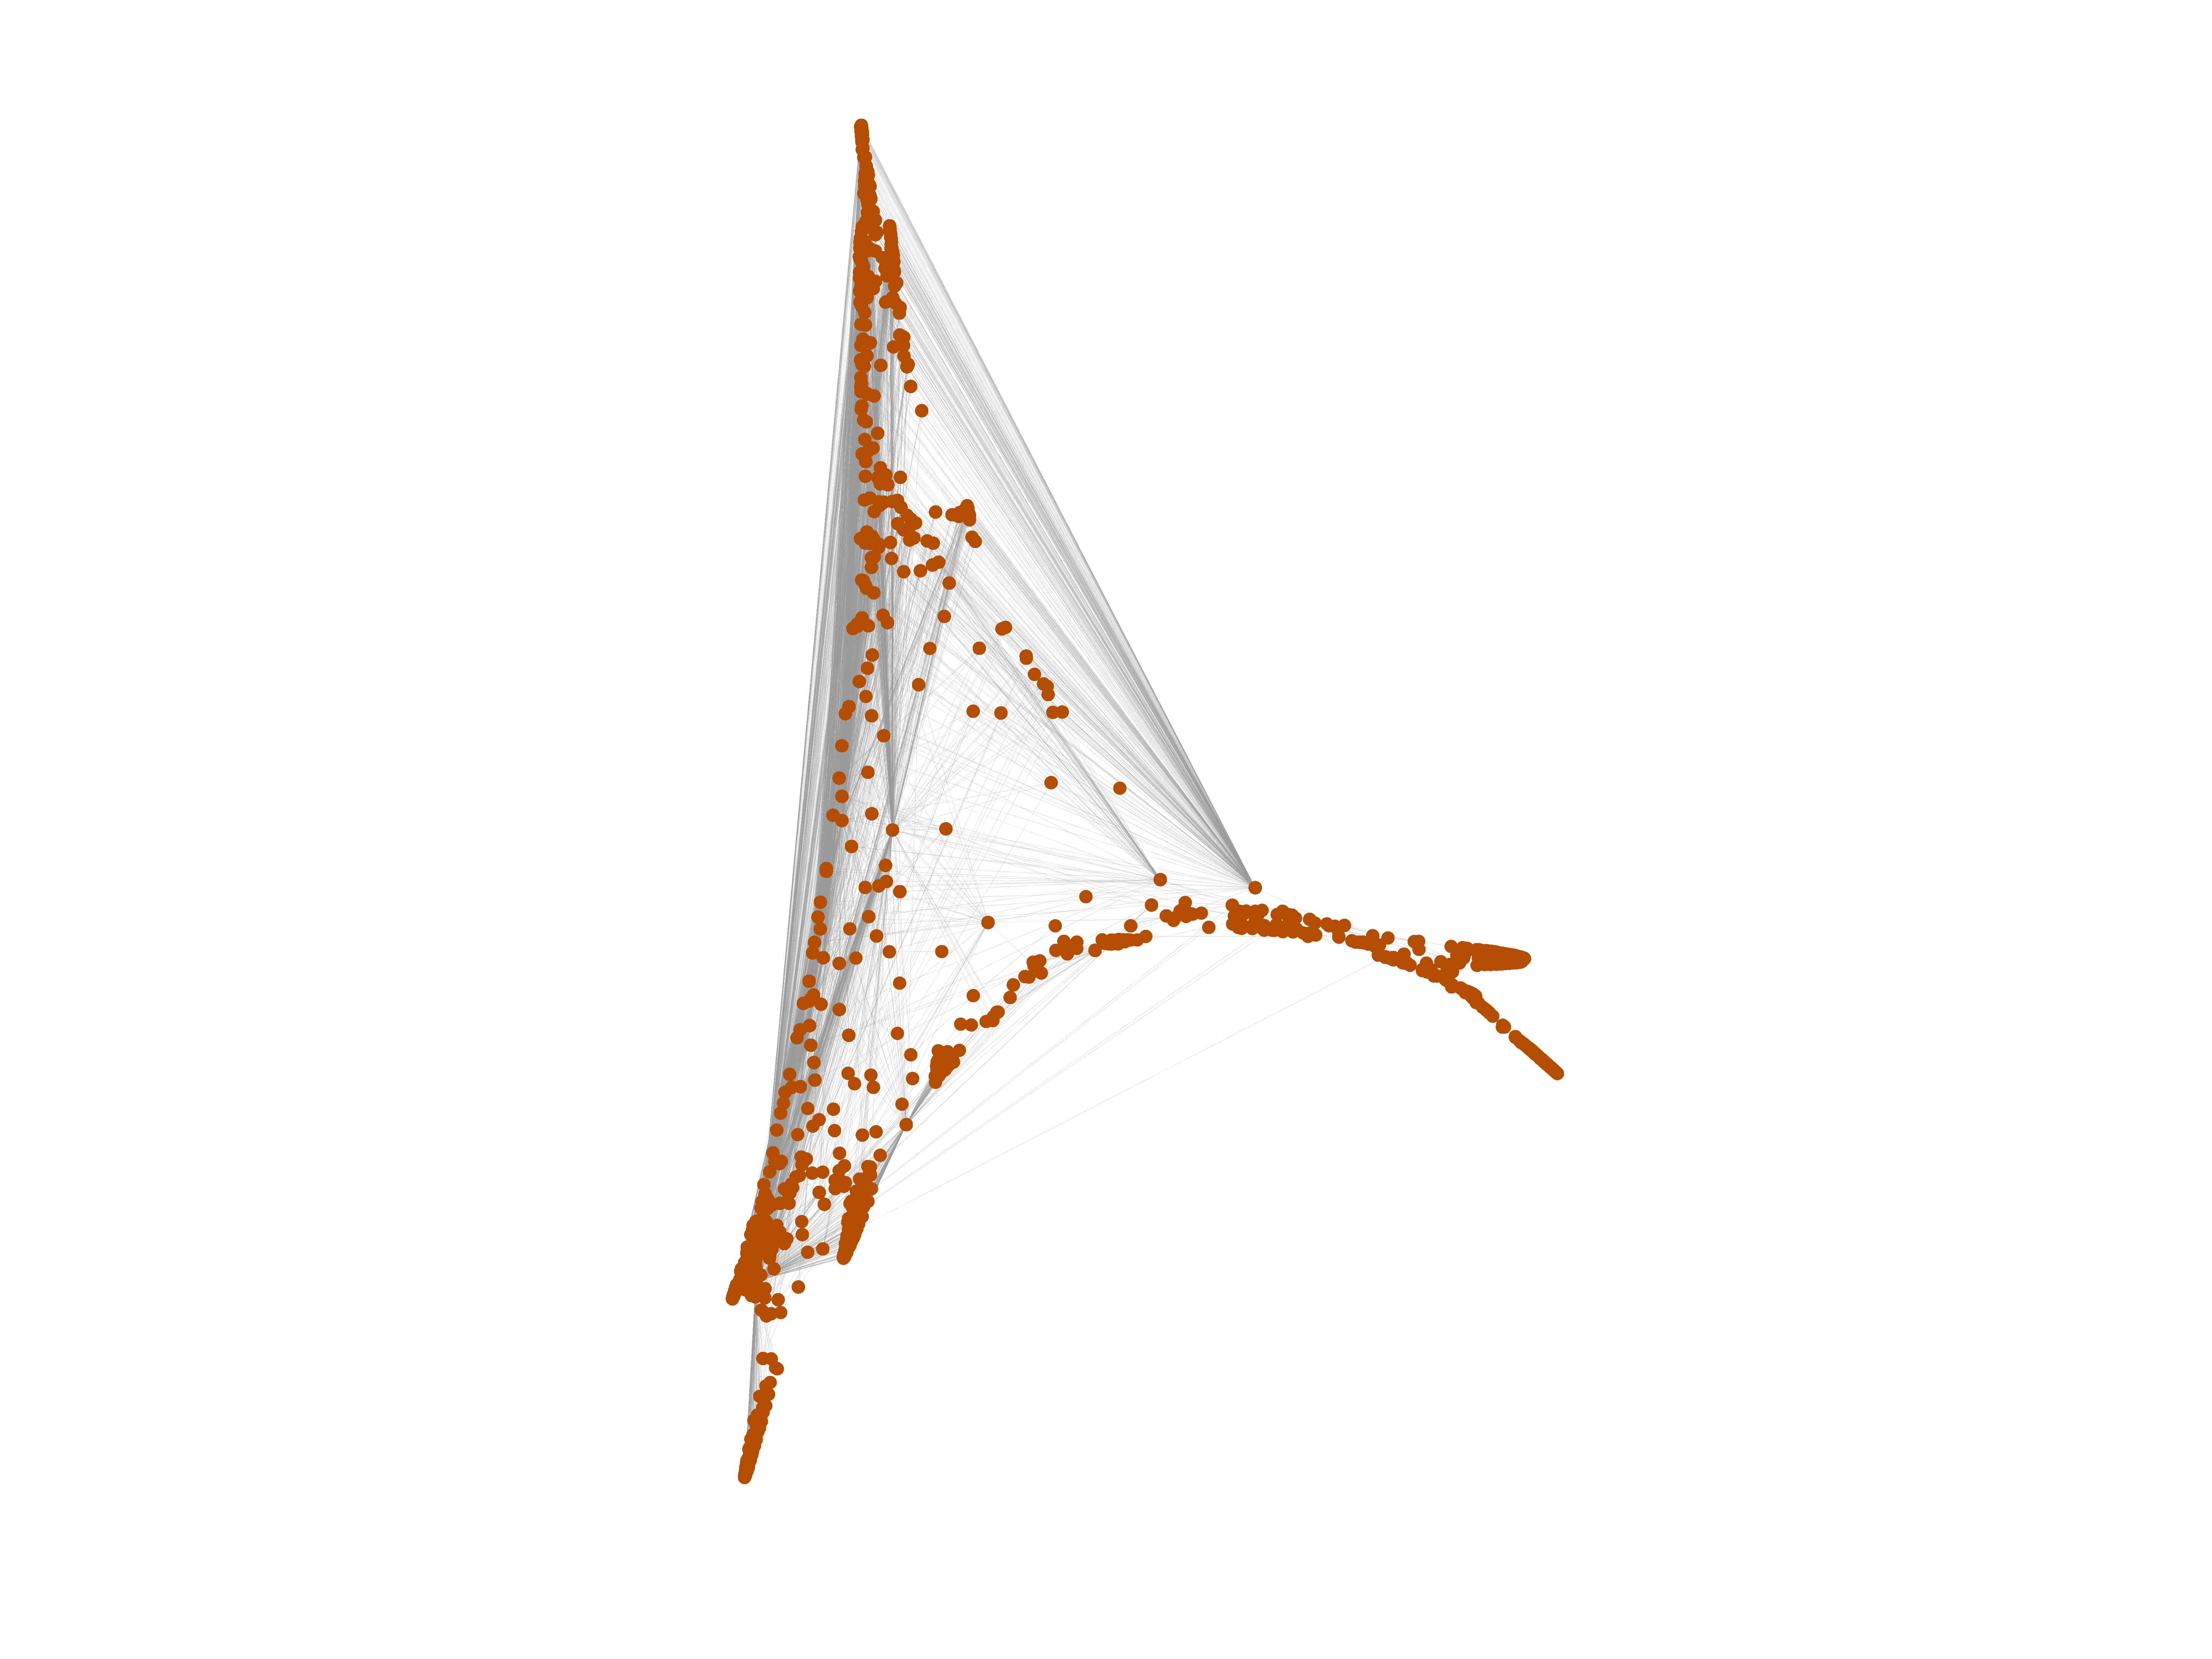
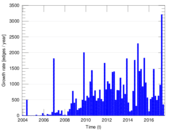
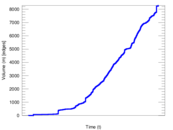
Wiktionary edits (gv)
This is the bipartite edit network of the Manx Wiktionary. It contains users
and pages from the Manx Wiktionary, connected by edit events. Each edge
represents an edit. The dataset includes the timestamp of each edit.
Metadata
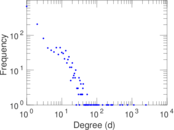
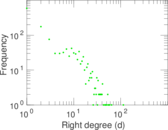
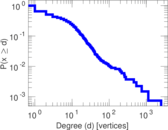
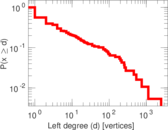
Statistics
| Size | n = | 1,530
|
| Left size | n1 = | 187
|
| Right size | n2 = | 1,343
|
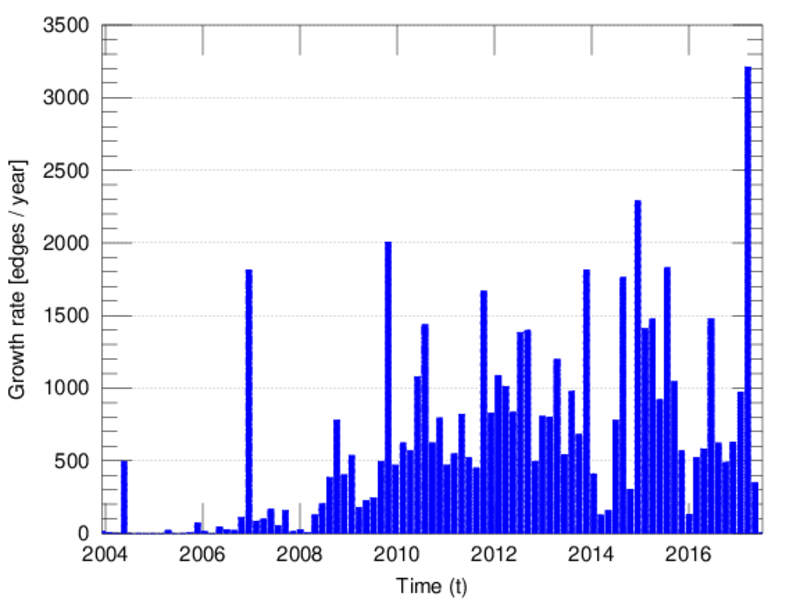
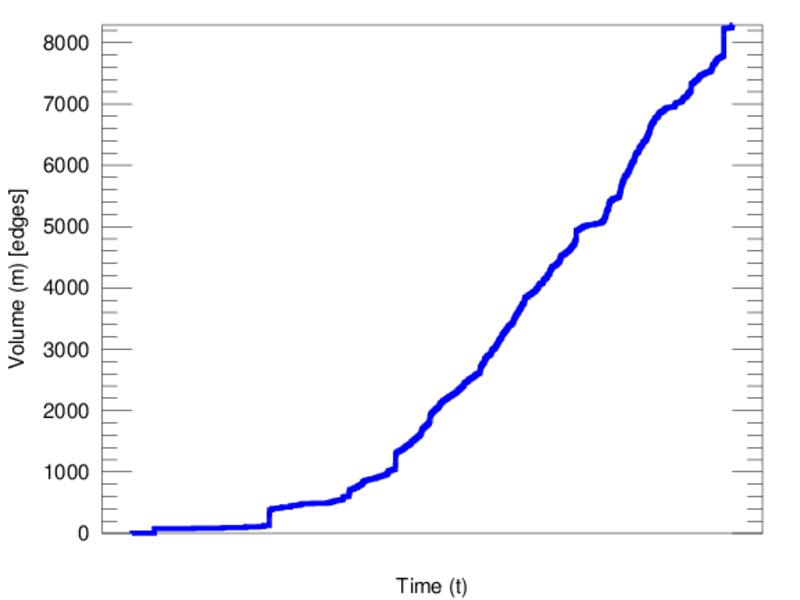
| Volume | m = | 8,287
|
| Unique edge count | m̿ = | 3,942
|
| Wedge count | s = | 573,548
|
| Claw count | z = | 86,837,377
|
| Cross count | x = | 11,734,793,431
|
| Square count | q = | 590,562
|
| 4-Tour count | T4 = | 7,026,880
|
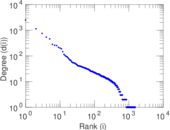
| Maximum degree | dmax = | 2,507
|
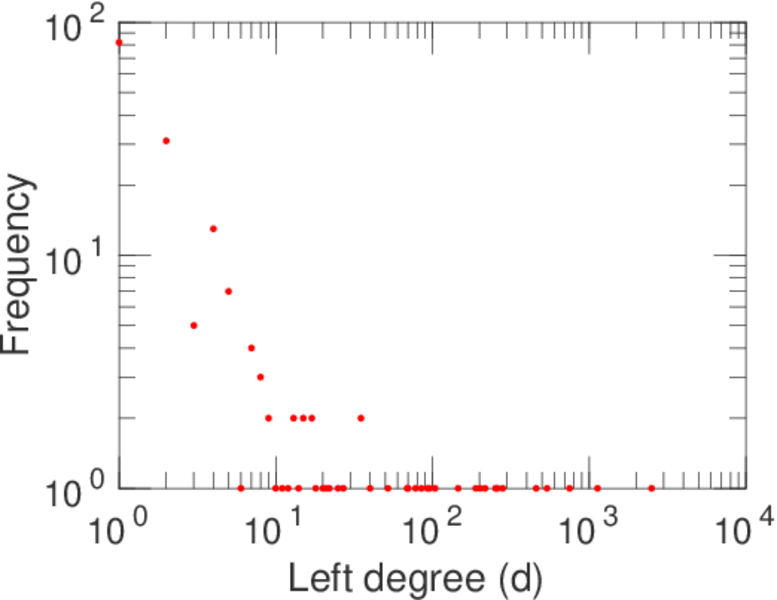
| Maximum left degree | d1max = | 2,507
|
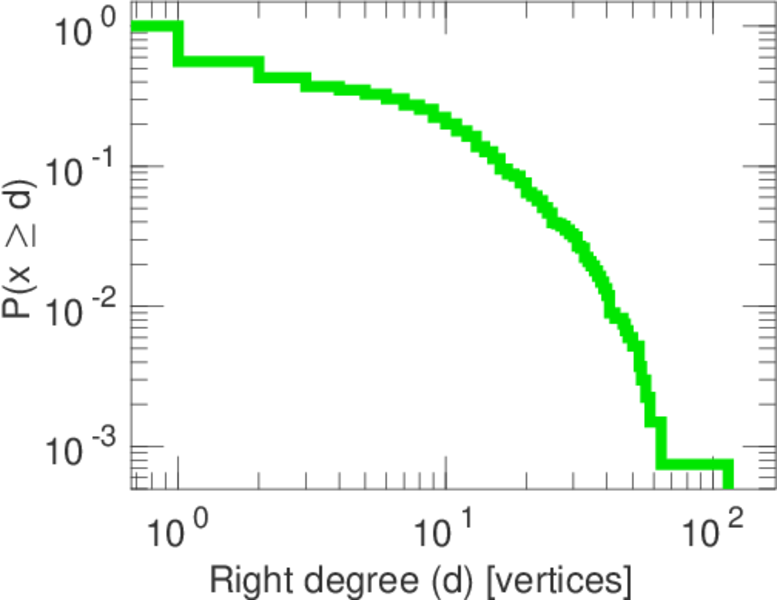
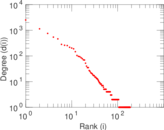
| Maximum right degree | d2max = | 114
|
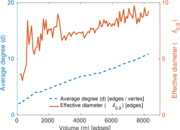
| Average degree | d = | 10.832 7
|
| Average left degree | d1 = | 44.315 5
|
| Average right degree | d2 = | 6.170 51
|
| Fill | p = | 0.015 696 4
|
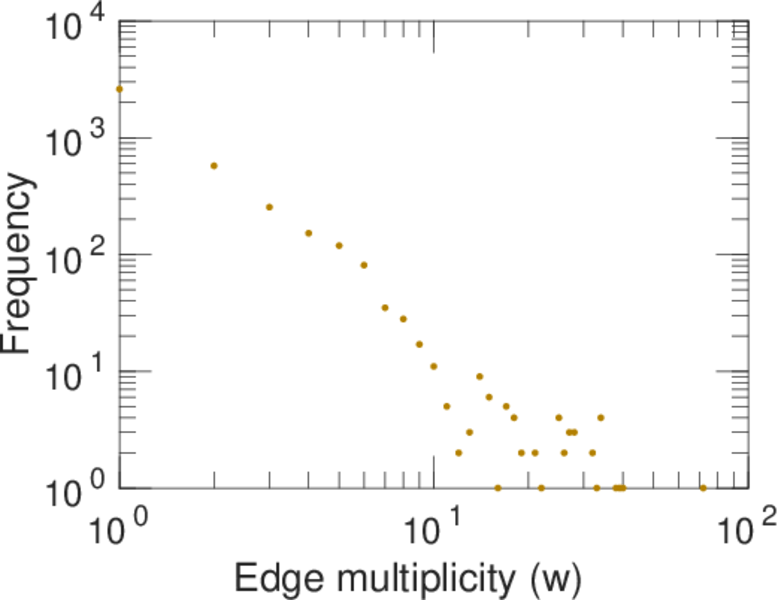
| Average edge multiplicity | m̃ = | 2.102 23
|
| Size of LCC | N = | 1,250
|
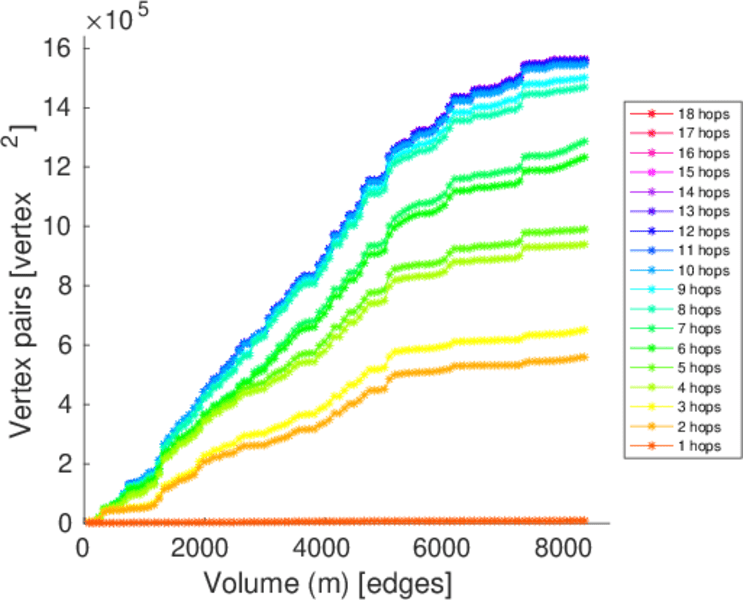
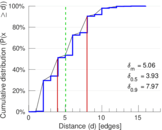
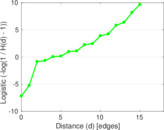
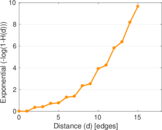
| Diameter | δ = | 17
|
| 50-Percentile effective diameter | δ0.5 = | 3.929 47
|
| 90-Percentile effective diameter | δ0.9 = | 7.973 63
|
| Median distance | δM = | 4
|
| Mean distance | δm = | 5.055 36
|
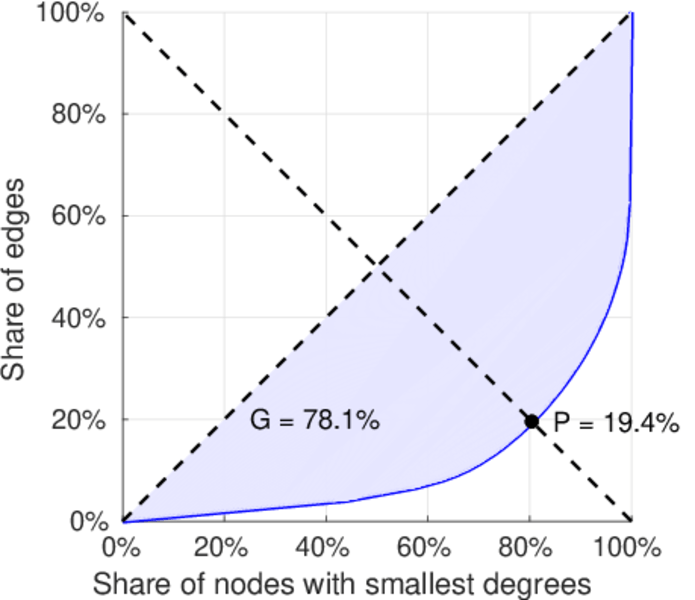
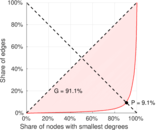
| Gini coefficient | G = | 0.769 181
|
| Balanced inequality ratio | P = | 0.202 425
|
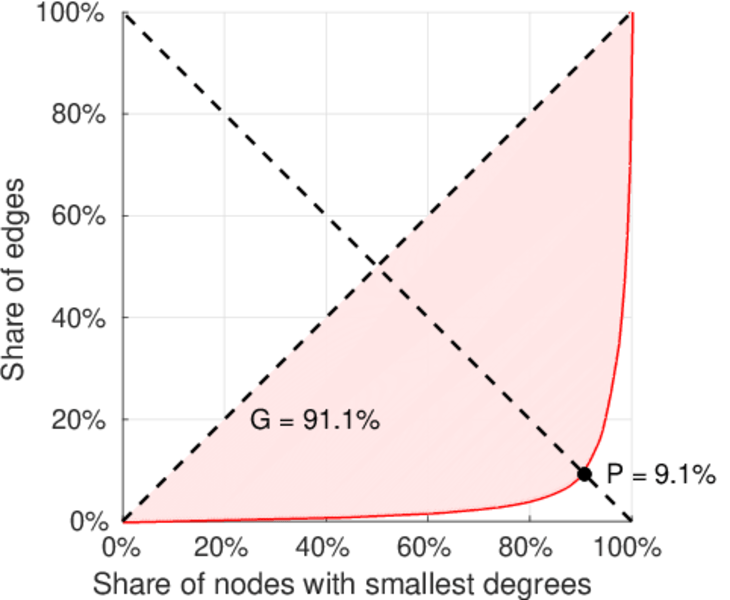
| Left balanced inequality ratio | P1 = | 0.090 985 9
|
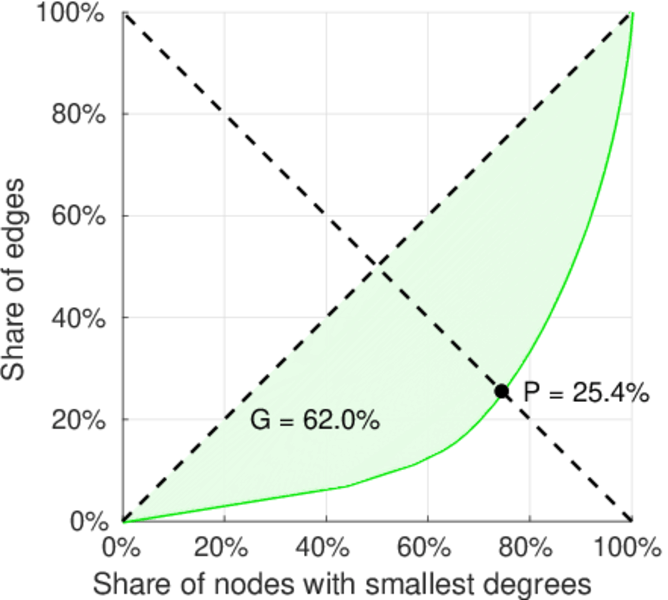
| Right balanced inequality ratio | P2 = | 0.253 892
|
| Relative edge distribution entropy | Her = | 0.783 765
|
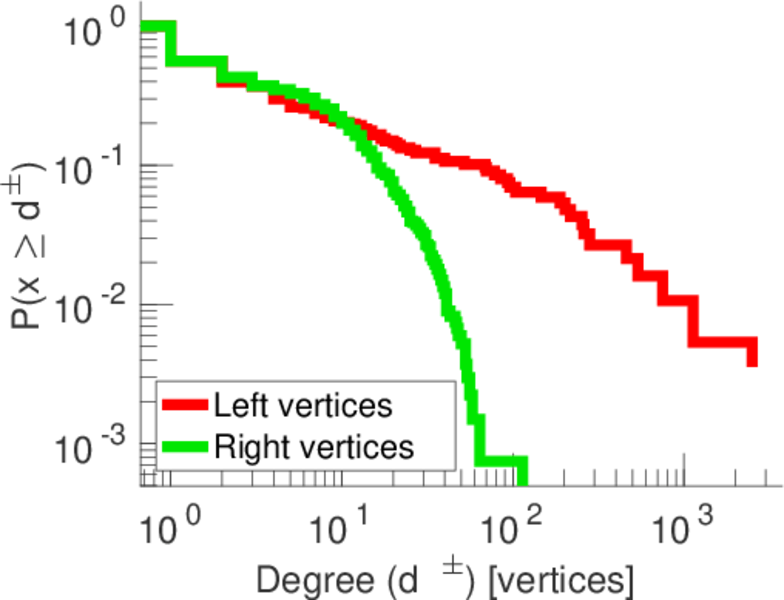
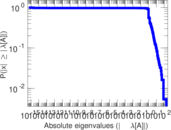
| Power law exponent | γ = | 2.299 62
|
| Tail power law exponent | γt = | 1.821 00
|
| Tail power law exponent with p | γ3 = | 1.821 00
|
| p-value | p = | 0.000 00
|
| Left tail power law exponent with p | γ3,1 = | 1.651 00
|
| Left p-value | p1 = | 0.063 000 0
|
| Right tail power law exponent with p | γ3,2 = | 8.991 00
|
| Right p-value | p2 = | 0.792 000
|
| Degree assortativity | ρ = | +0.008 719 94
|
| Degree assortativity p-value | pρ = | 0.584 158
|
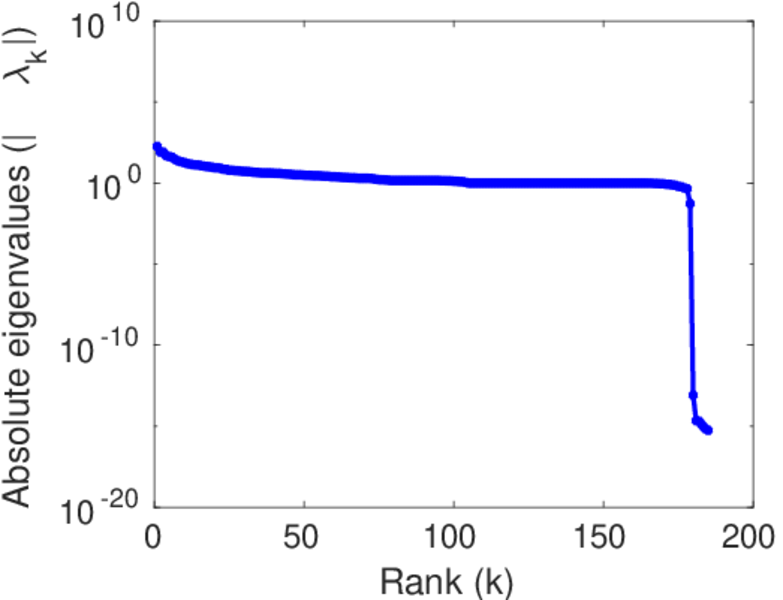
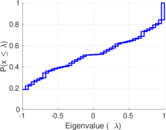
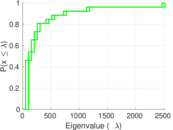
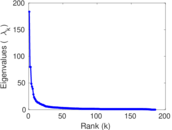
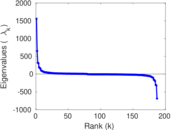
| Spectral norm | α = | 183.634
|
| Algebraic connectivity | a = | 0.005 452 47
|
| Spectral separation | |λ1[A] / λ2[A]| = | 2.290 05
|
| Controllability | C = | 1,169
|
| Relative controllability | Cr = | 0.765 553
|
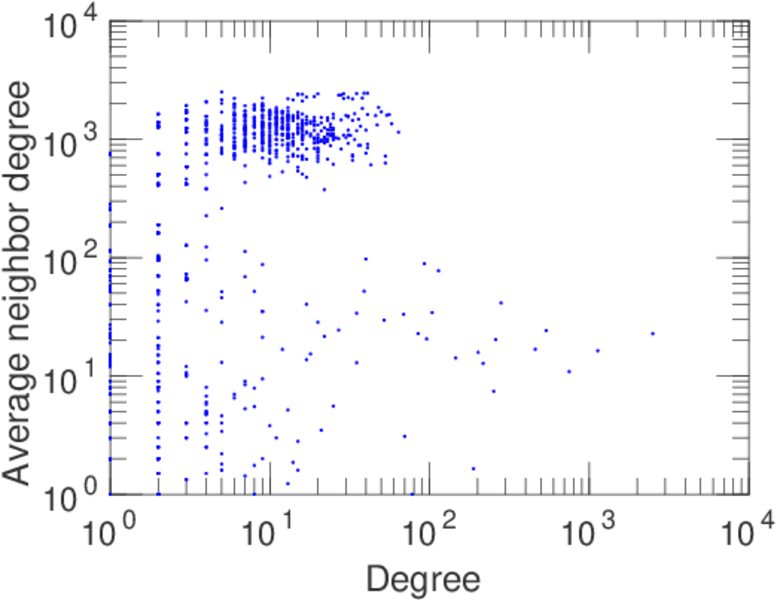
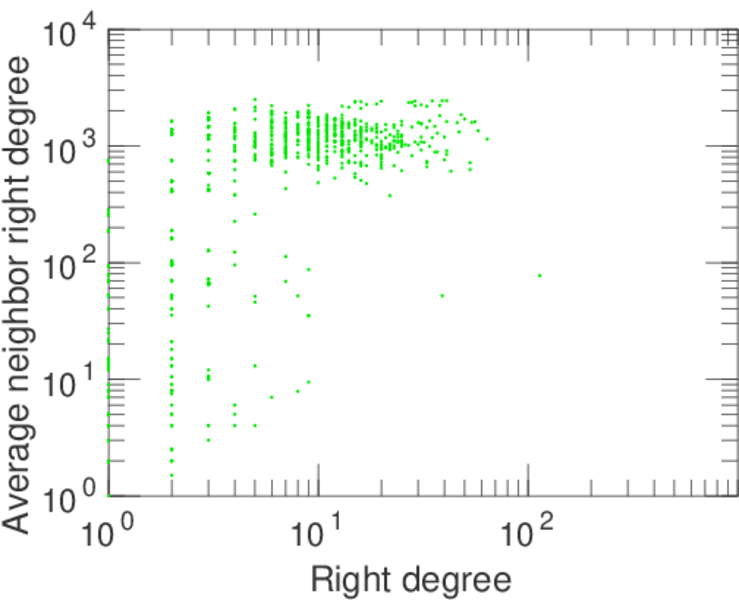
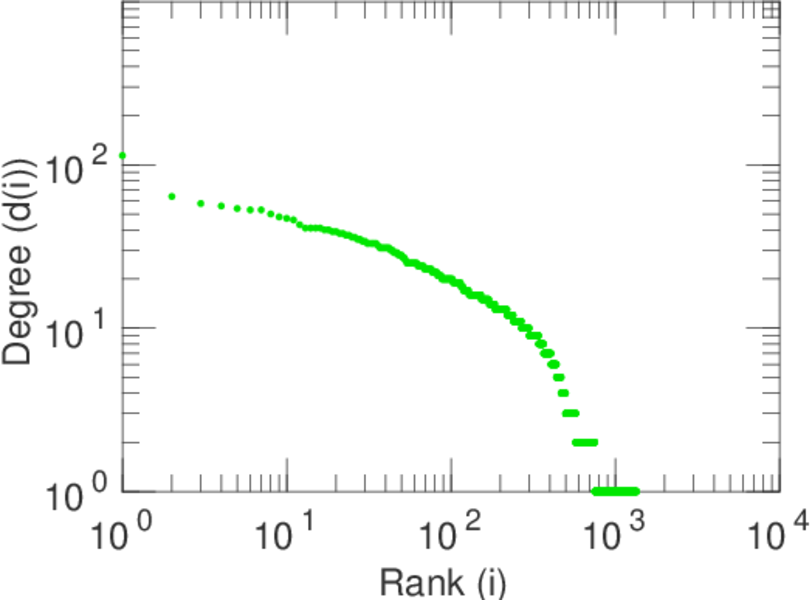
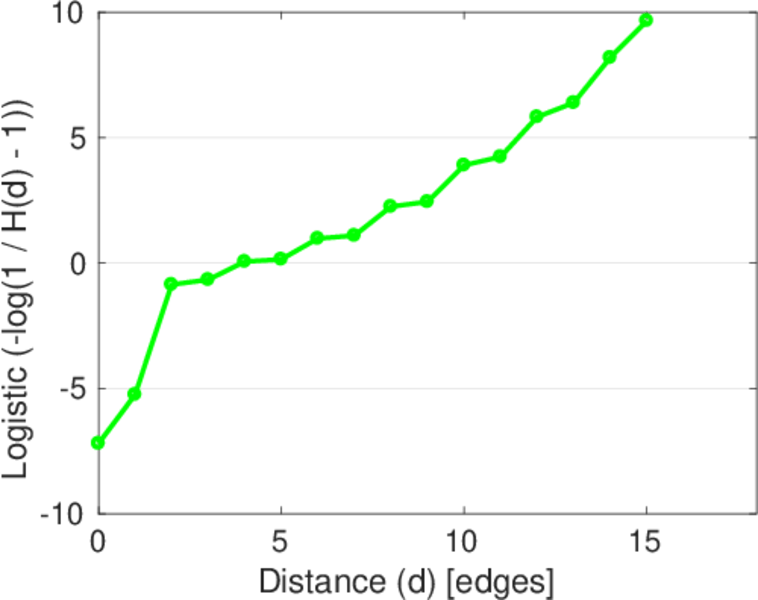
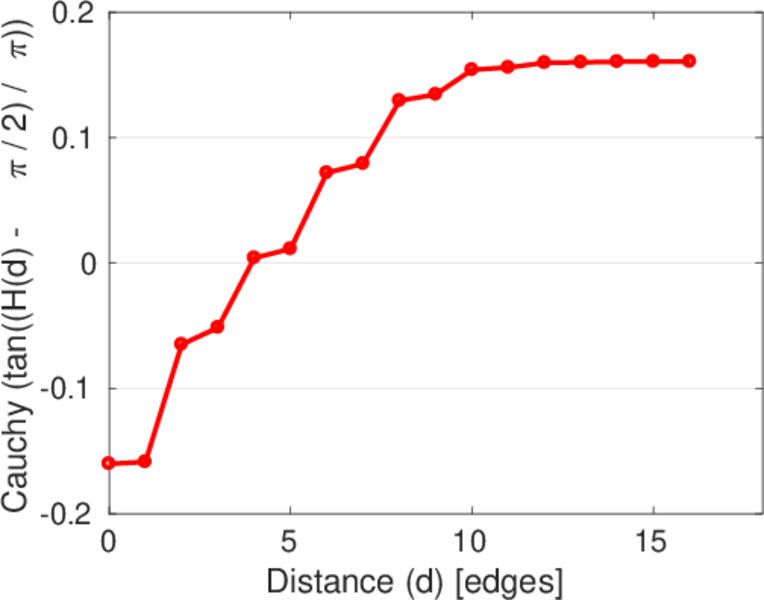
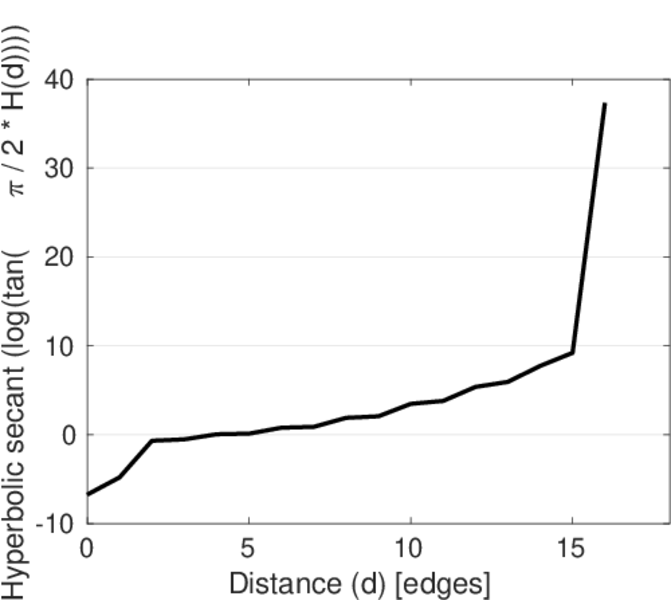
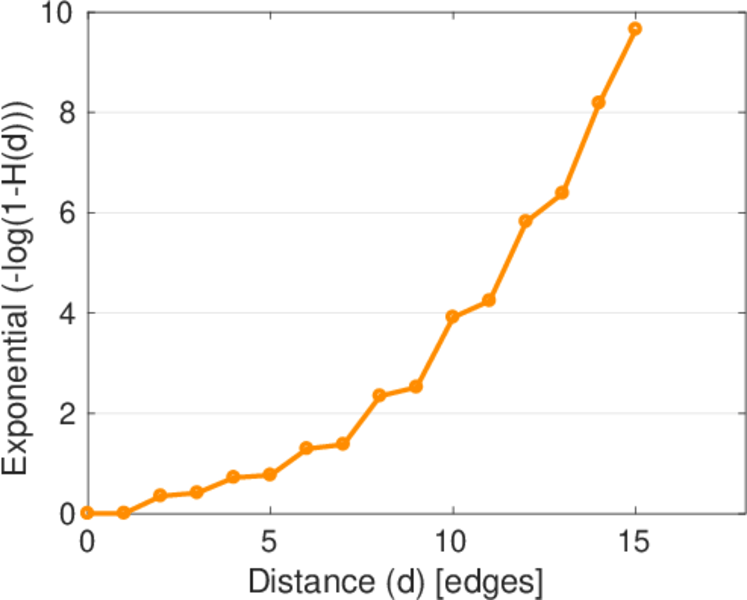
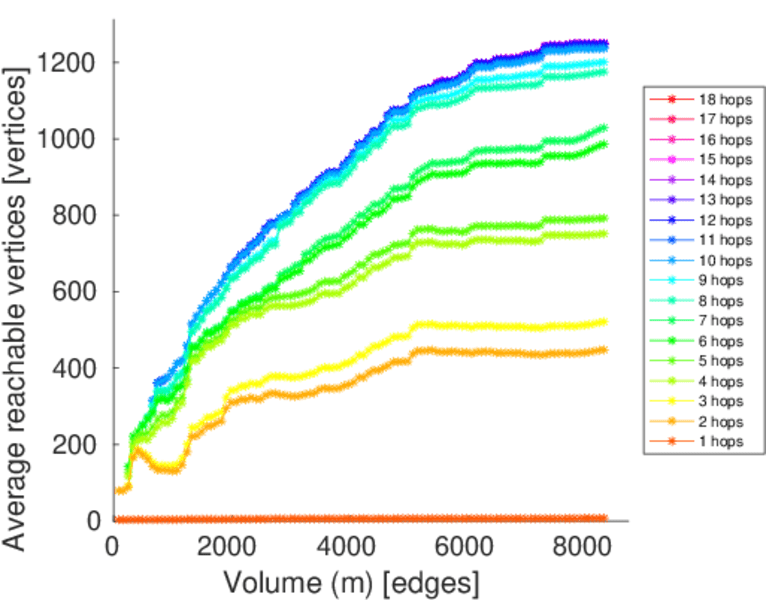
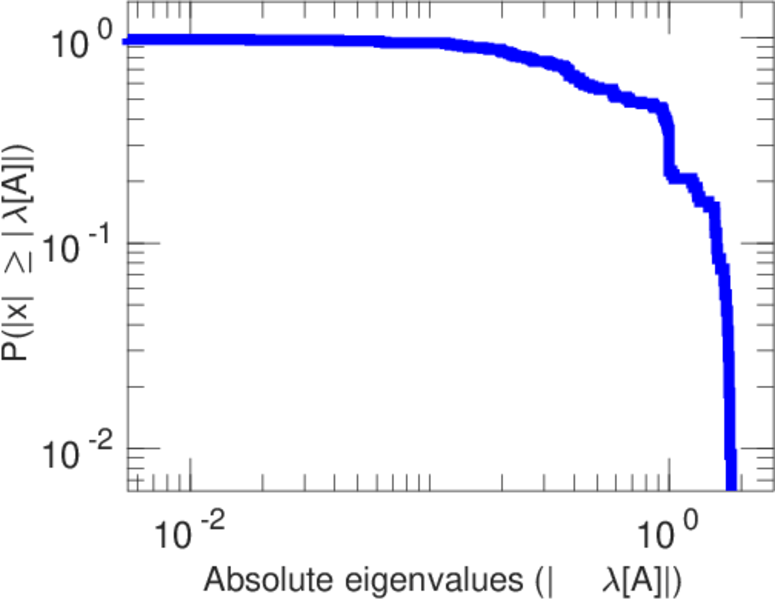
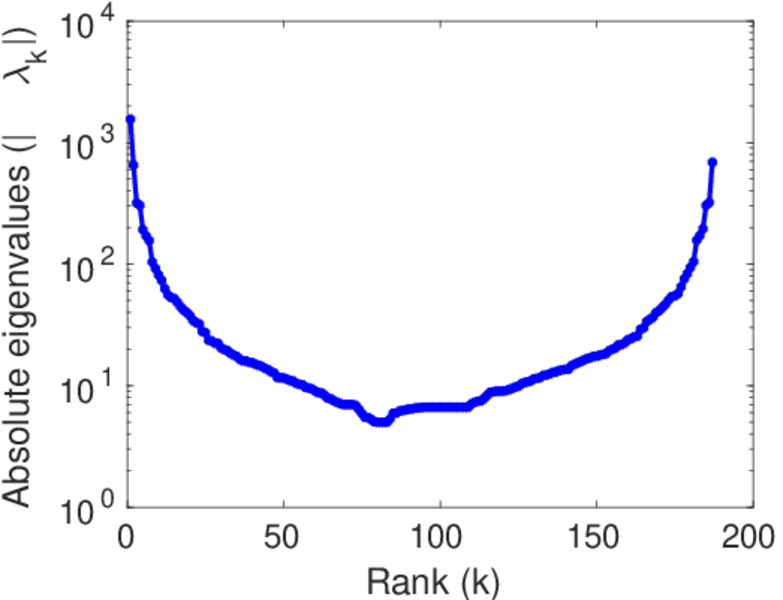
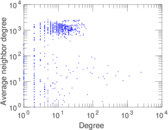
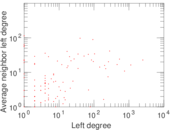
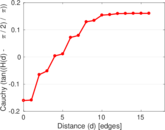
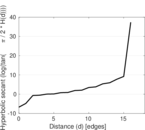
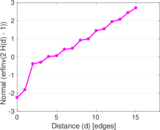
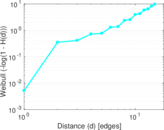
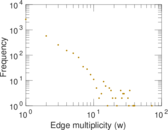
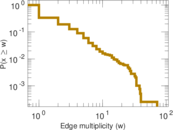
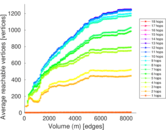
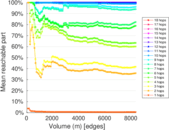
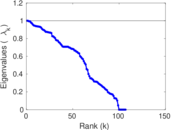
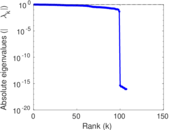
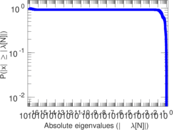
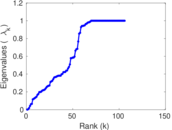
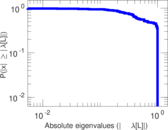
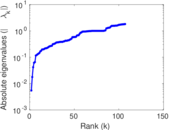
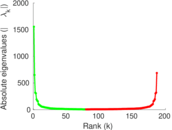
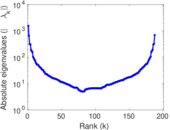
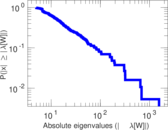
Plots


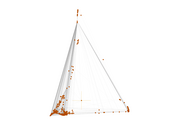
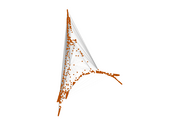

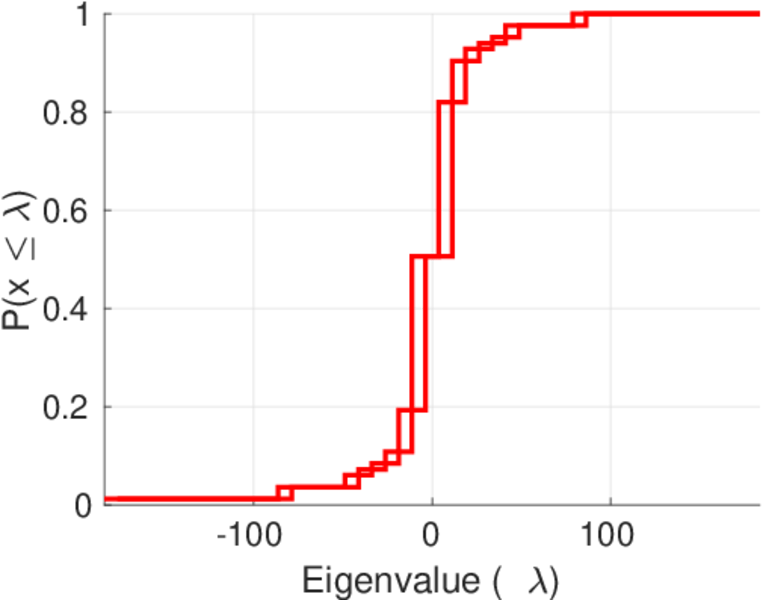
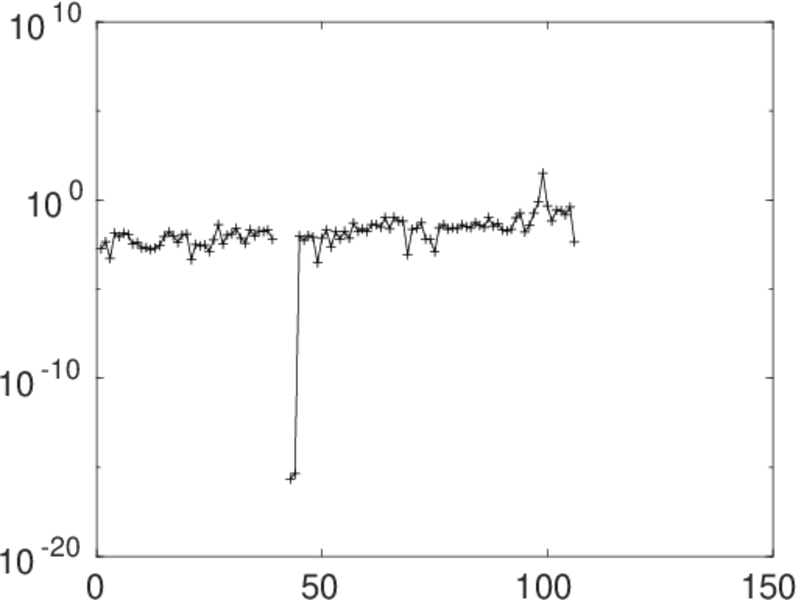
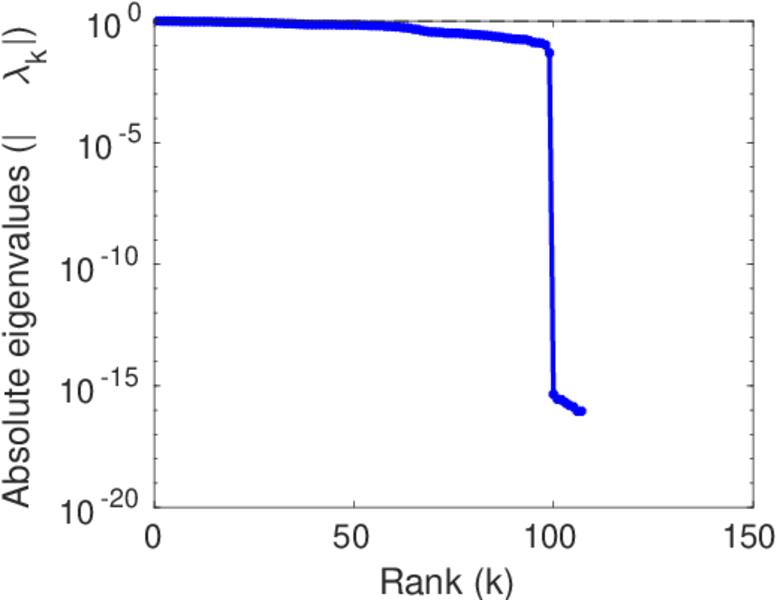
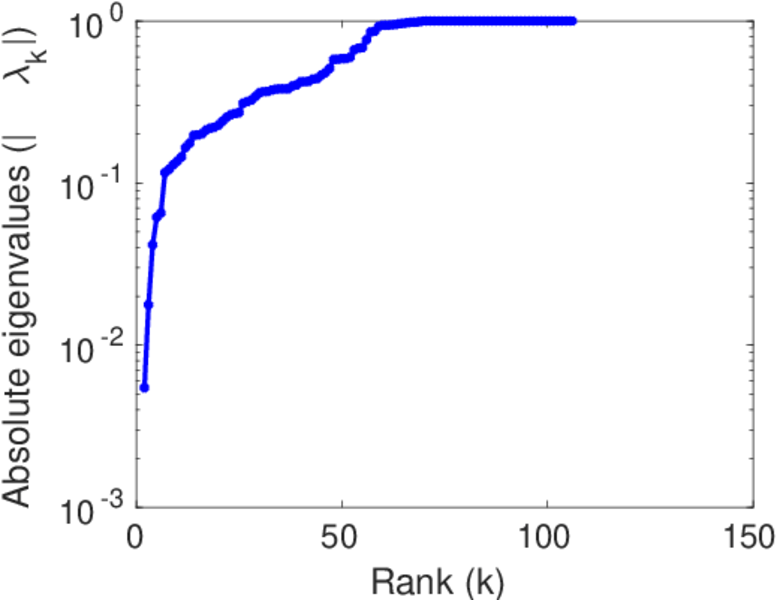
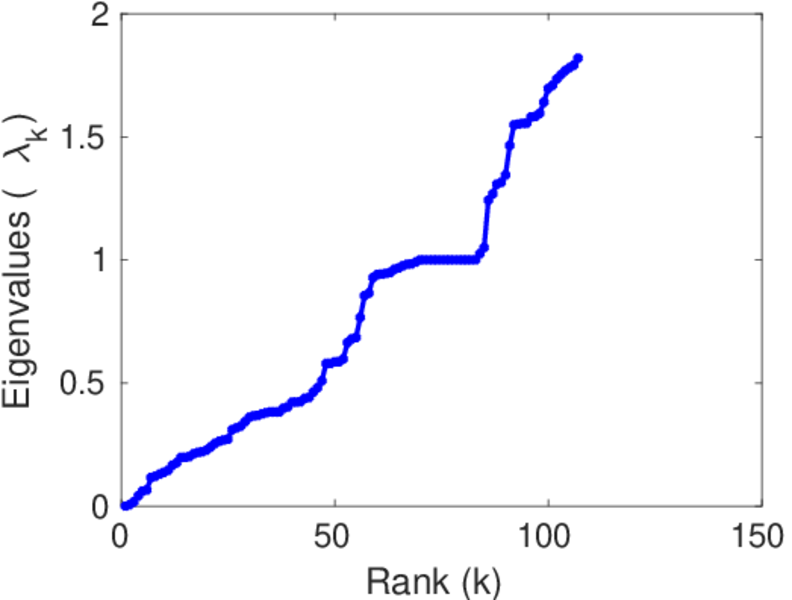
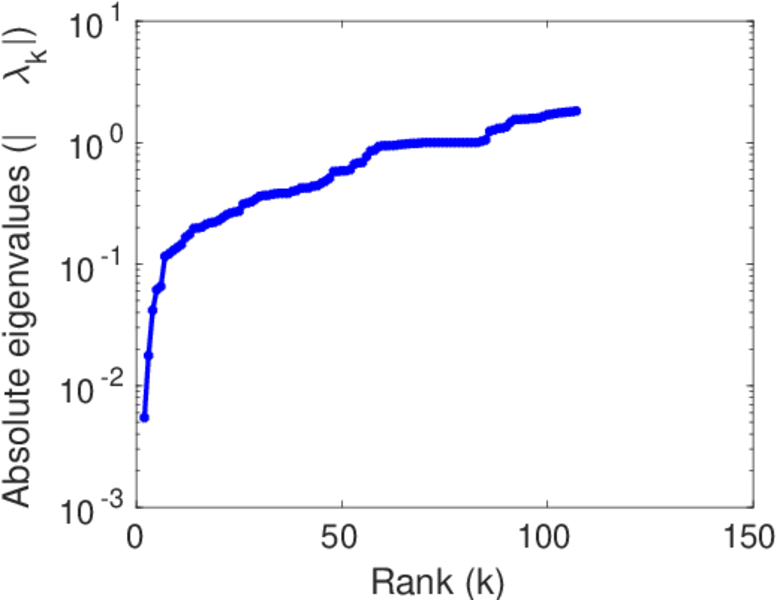
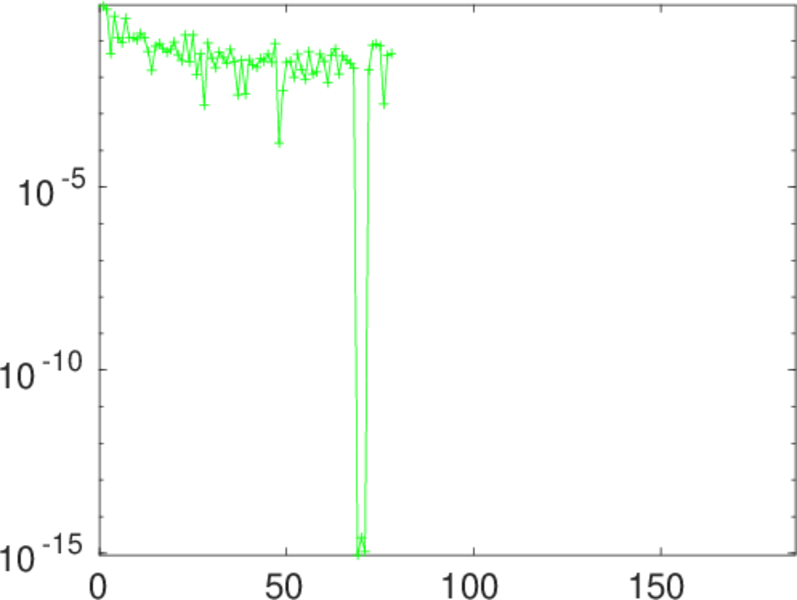
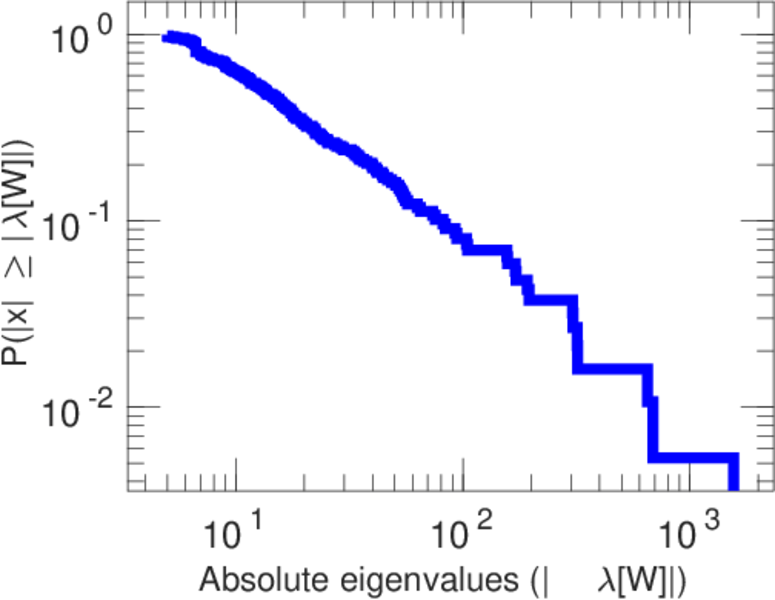
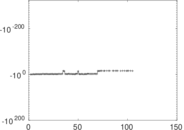
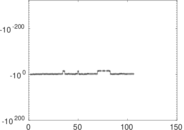
Matrix decompositions plots


Downloads
References
|
[1]
|
Jérôme Kunegis.
KONECT – The Koblenz Network Collection.
In Proc. Int. Conf. on World Wide Web Companion, pages
1343–1350, 2013.
[ http ]
|
|
[2]
|
Wikimedia Foundation.
Wikimedia downloads.
http://dumps.wikimedia.org/, January 2010.
|
 KONECT ‣ Networks ‣
Buy Me a Coffee
KONECT ‣ Networks ‣
Buy Me a Coffee