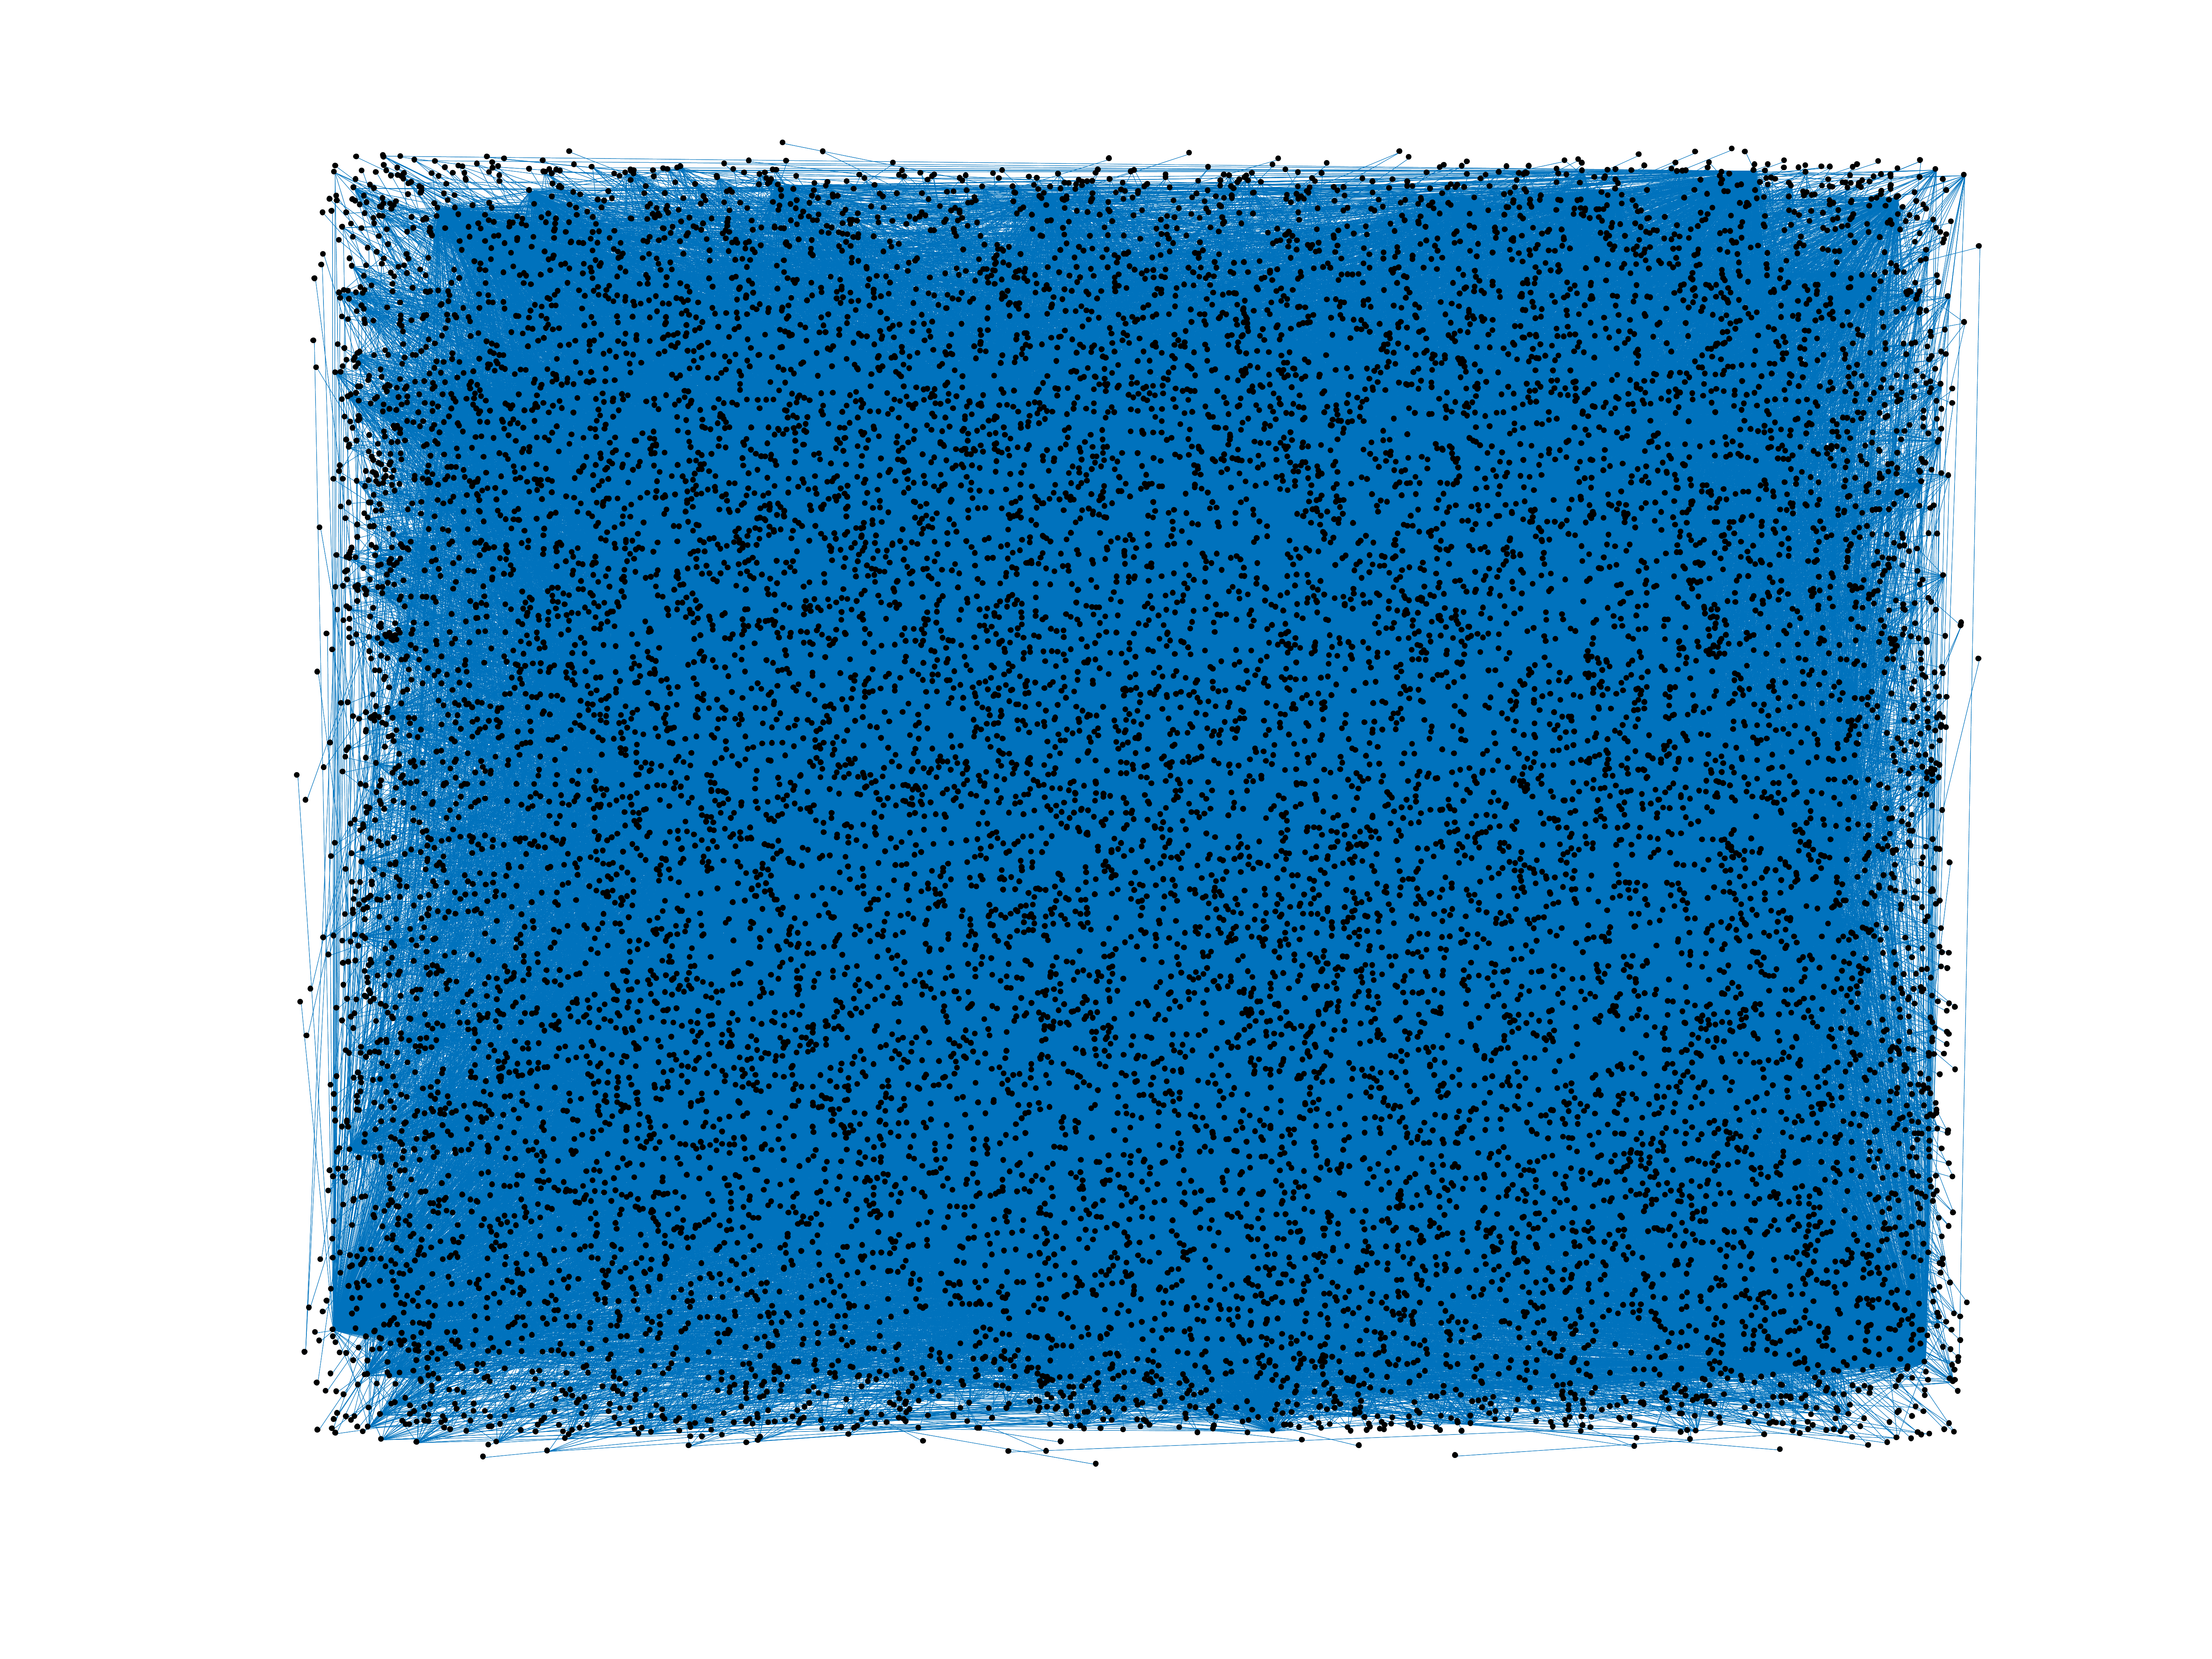
Wikipedia edits (hak)
This is the bipartite edit network of the Hakka Chinese Wikipedia. It contains
users and pages from the Hakka Chinese Wikipedia, connected by edit events.
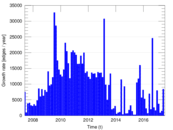
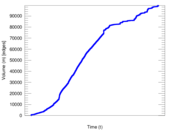
Each edge represents an edit. The dataset includes the timestamp of each edit.
Metadata
Statistics
| Size | n = | 15,890
|
| Left size | n1 = | 1,052
|
| Right size | n2 = | 14,838
|
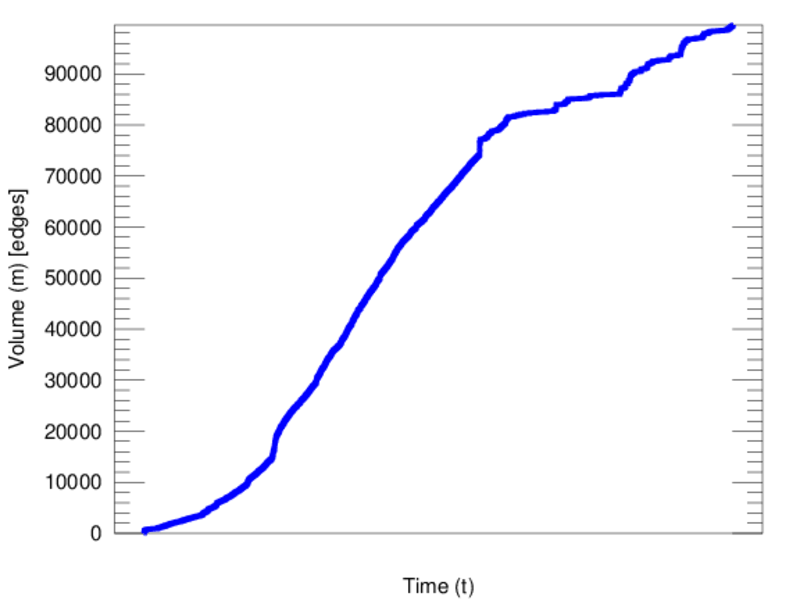
| Volume | m = | 99,585
|
| Unique edge count | m̿ = | 49,281
|
| Wedge count | s = | 24,123,133
|
| Claw count | z = | 13,166,466,281
|
| Cross count | x = | 6,911,169,853,443
|
| Square count | q = | 49,537,007
|
| 4-Tour count | T4 = | 492,973,010
|
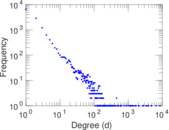
| Maximum degree | dmax = | 8,584
|
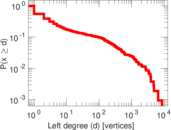
| Maximum left degree | d1max = | 8,584
|
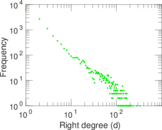
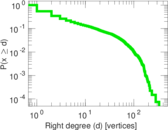
| Maximum right degree | d2max = | 331
|
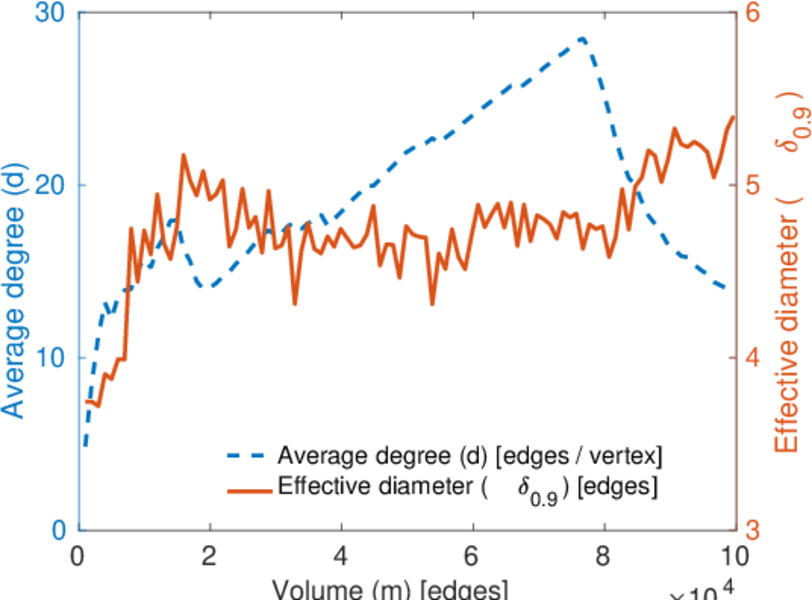
| Average degree | d = | 12.534 3
|
| Average left degree | d1 = | 94.662 5
|
| Average right degree | d2 = | 6.711 48
|
| Fill | p = | 0.003 157 10
|
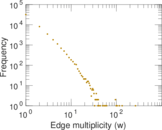
| Average edge multiplicity | m̃ = | 2.020 76
|
| Size of LCC | N = | 13,835
|
| Diameter | δ = | 12
|
| 50-Percentile effective diameter | δ0.5 = | 3.531 01
|
| 90-Percentile effective diameter | δ0.9 = | 5.265 25
|
| Median distance | δM = | 4
|
| Mean distance | δm = | 4.063 07
|
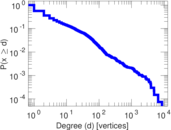
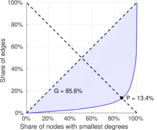
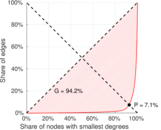
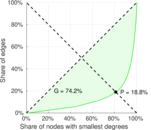
| Gini coefficient | G = | 0.862 986
|
| Balanced inequality ratio | P = | 0.129 467
|
| Left balanced inequality ratio | P1 = | 0.071 064 9
|
| Right balanced inequality ratio | P2 = | 0.188 010
|
| Relative edge distribution entropy | Her = | 0.760 511
|
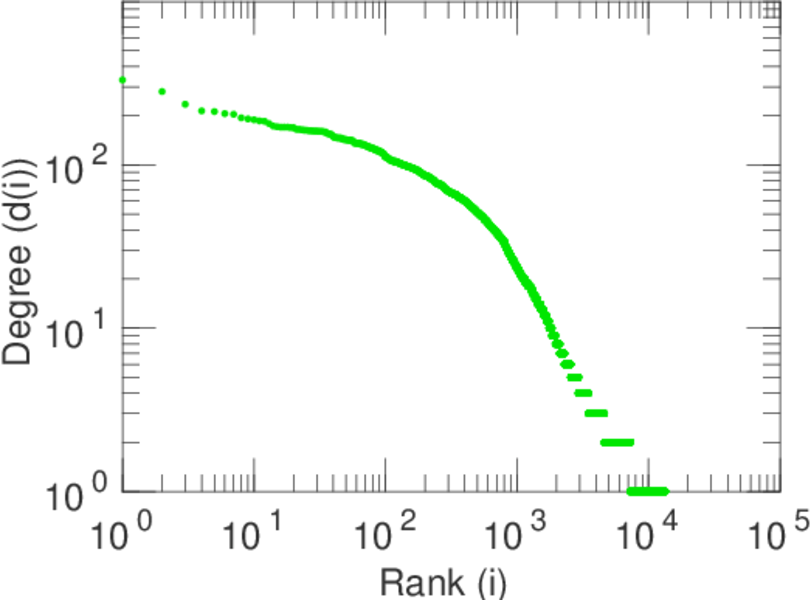
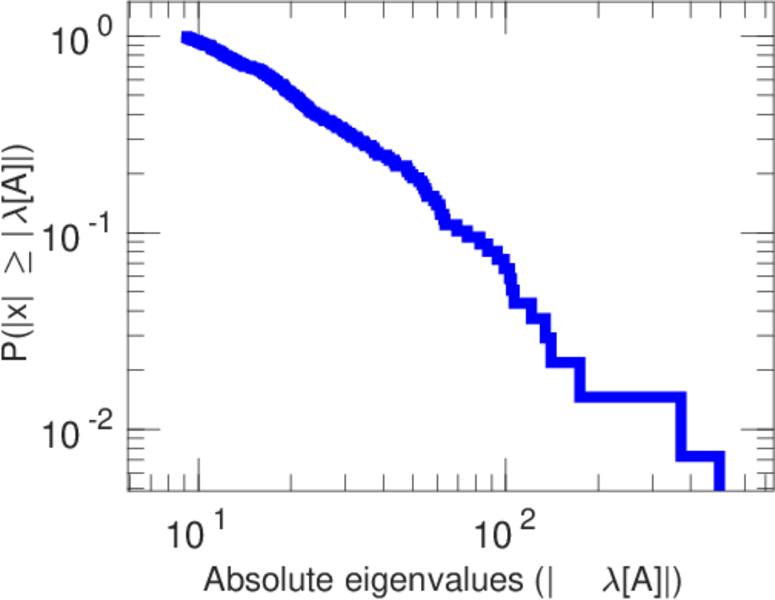
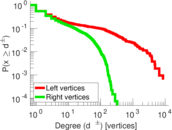
| Power law exponent | γ = | 2.548 08
|
| Tail power law exponent | γt = | 1.921 00
|
| Tail power law exponent with p | γ3 = | 1.921 00
|
| p-value | p = | 0.000 00
|
| Left tail power law exponent with p | γ3,1 = | 1.651 00
|
| Left p-value | p1 = | 0.000 00
|
| Right tail power law exponent with p | γ3,2 = | 1.951 00
|
| Right p-value | p2 = | 0.000 00
|
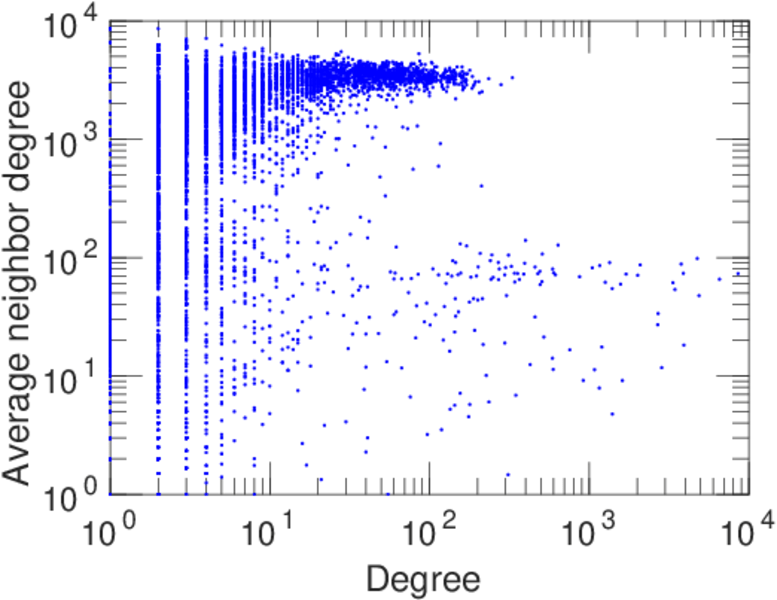
| Degree assortativity | ρ = | −0.220 184
|
| Degree assortativity p-value | pρ = | 0.000 00
|
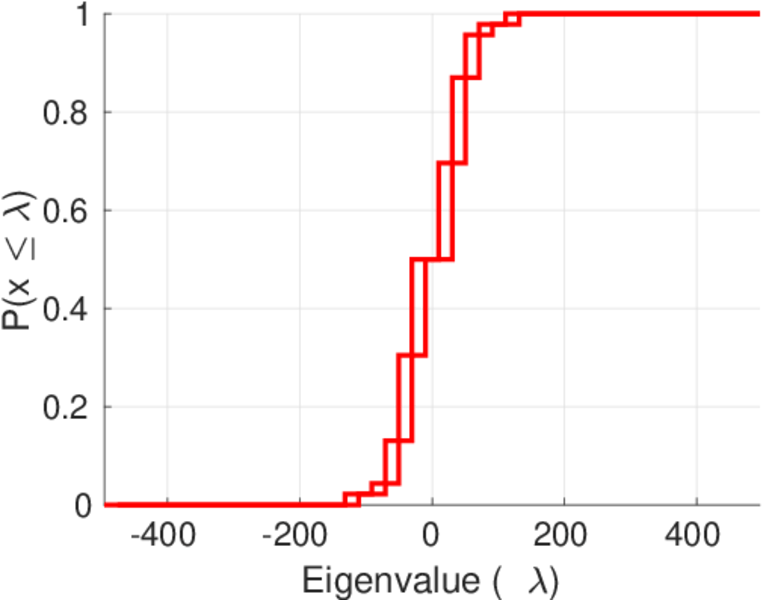
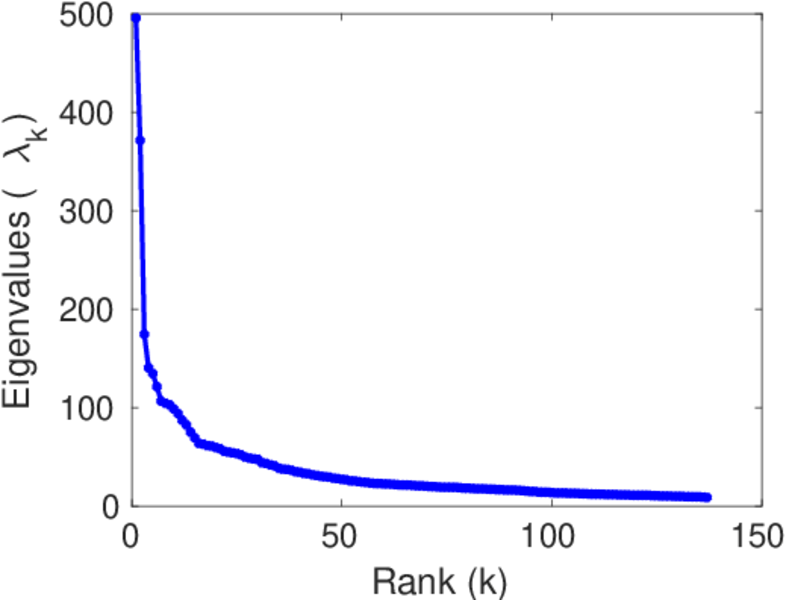
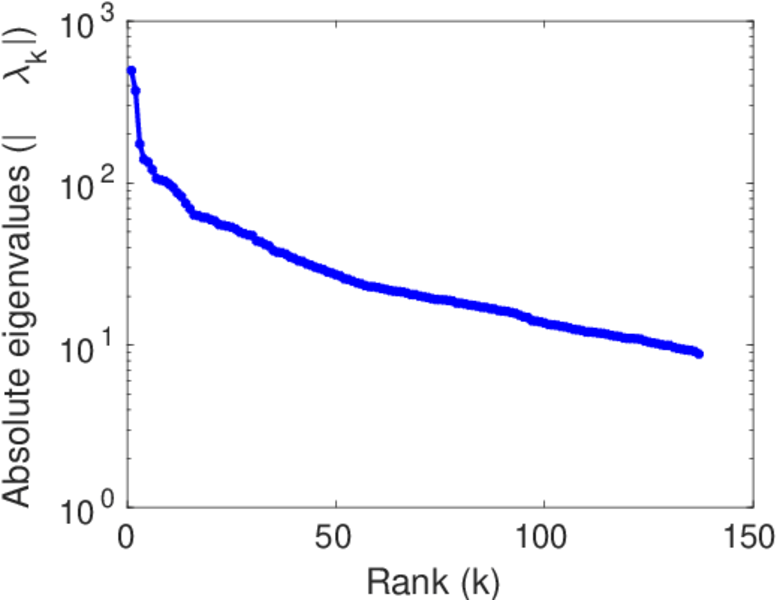
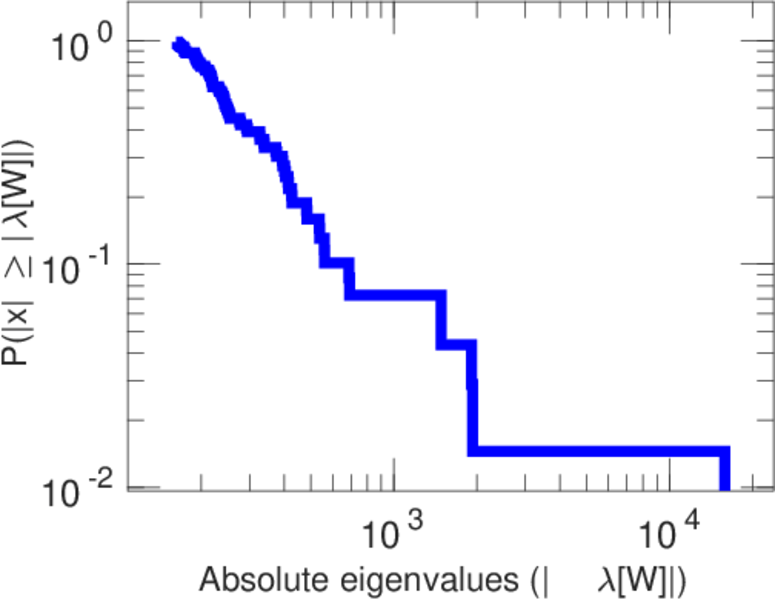
| Spectral norm | α = | 495.528
|
| Algebraic connectivity | a = | 0.029 550 4
|
| Spectral separation | |λ1[A] / λ2[A]| = | 1.334 46
|
| Controllability | C = | 12,473
|
| Relative controllability | Cr = | 0.864 679
|
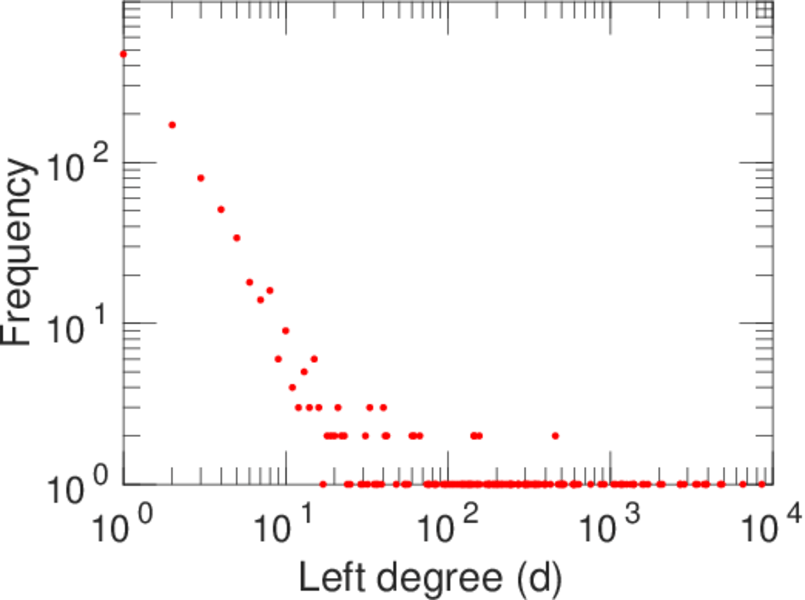
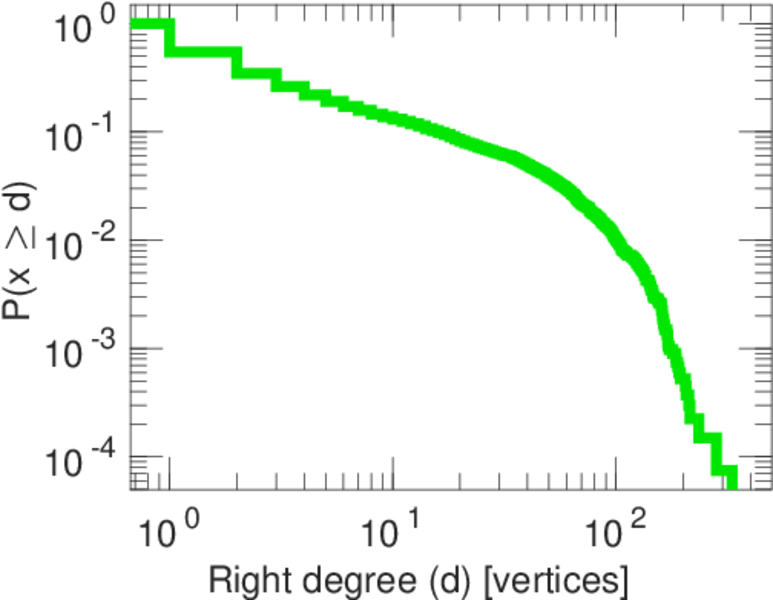
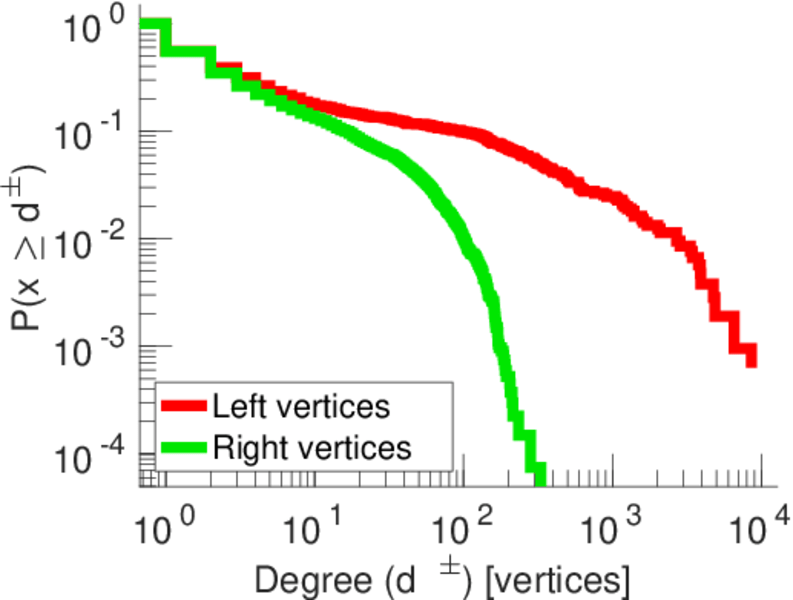
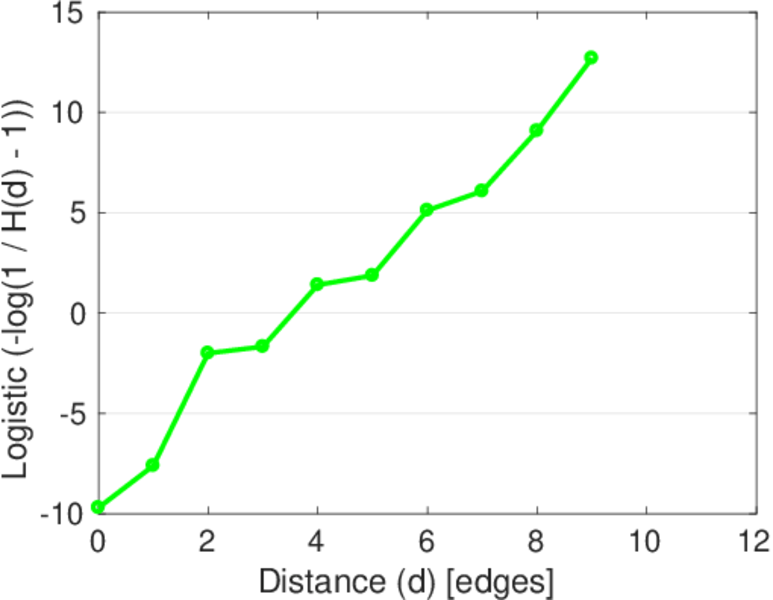
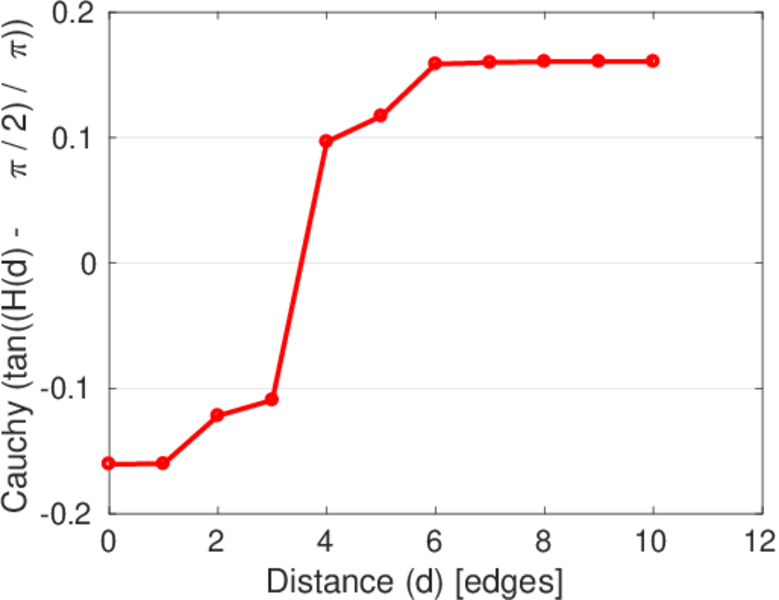
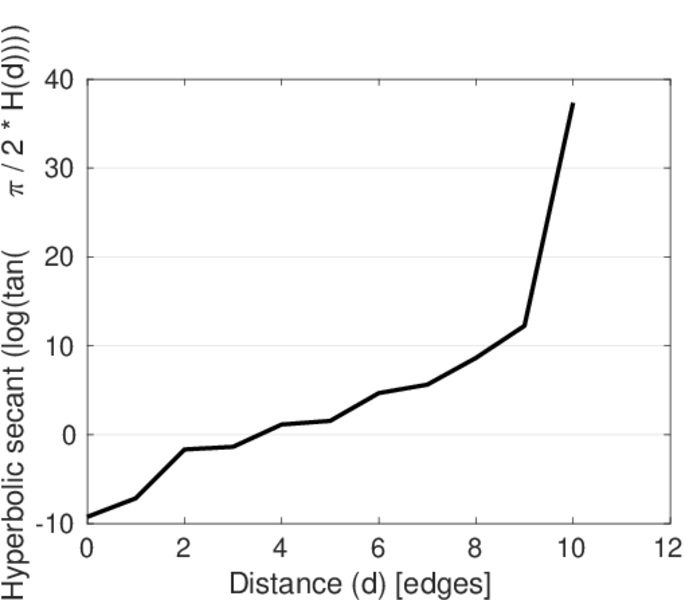
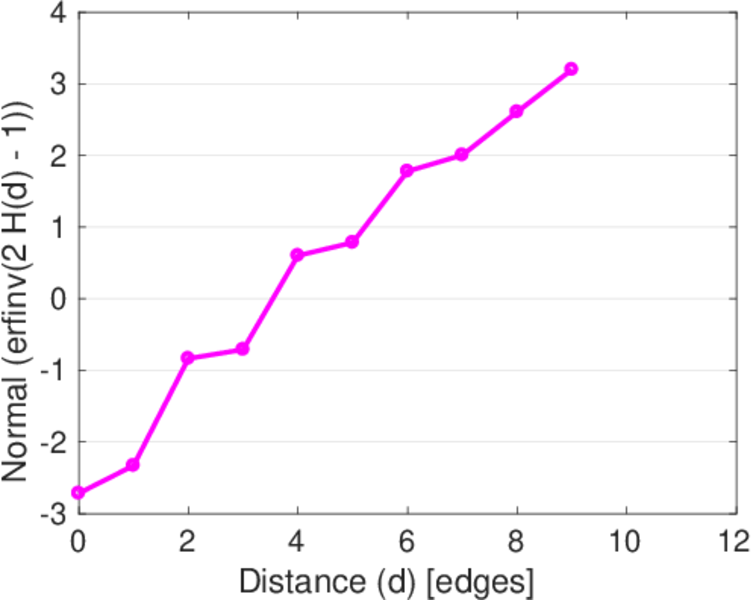
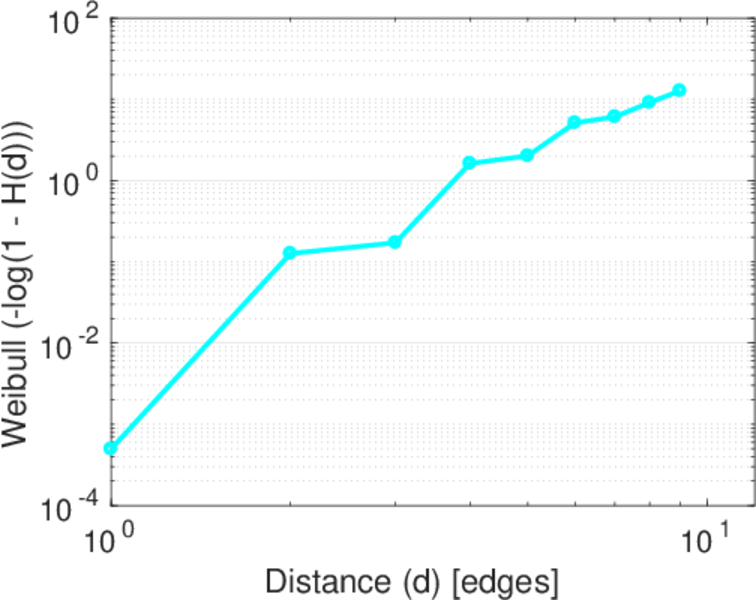
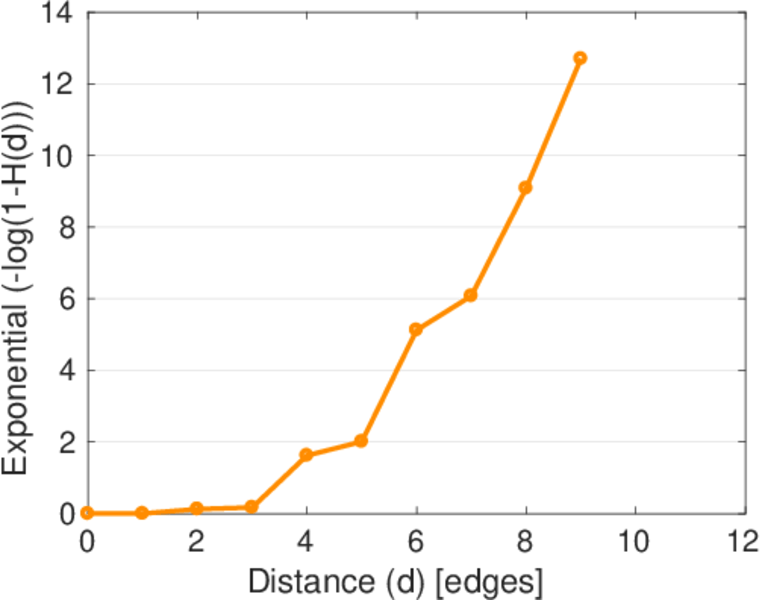
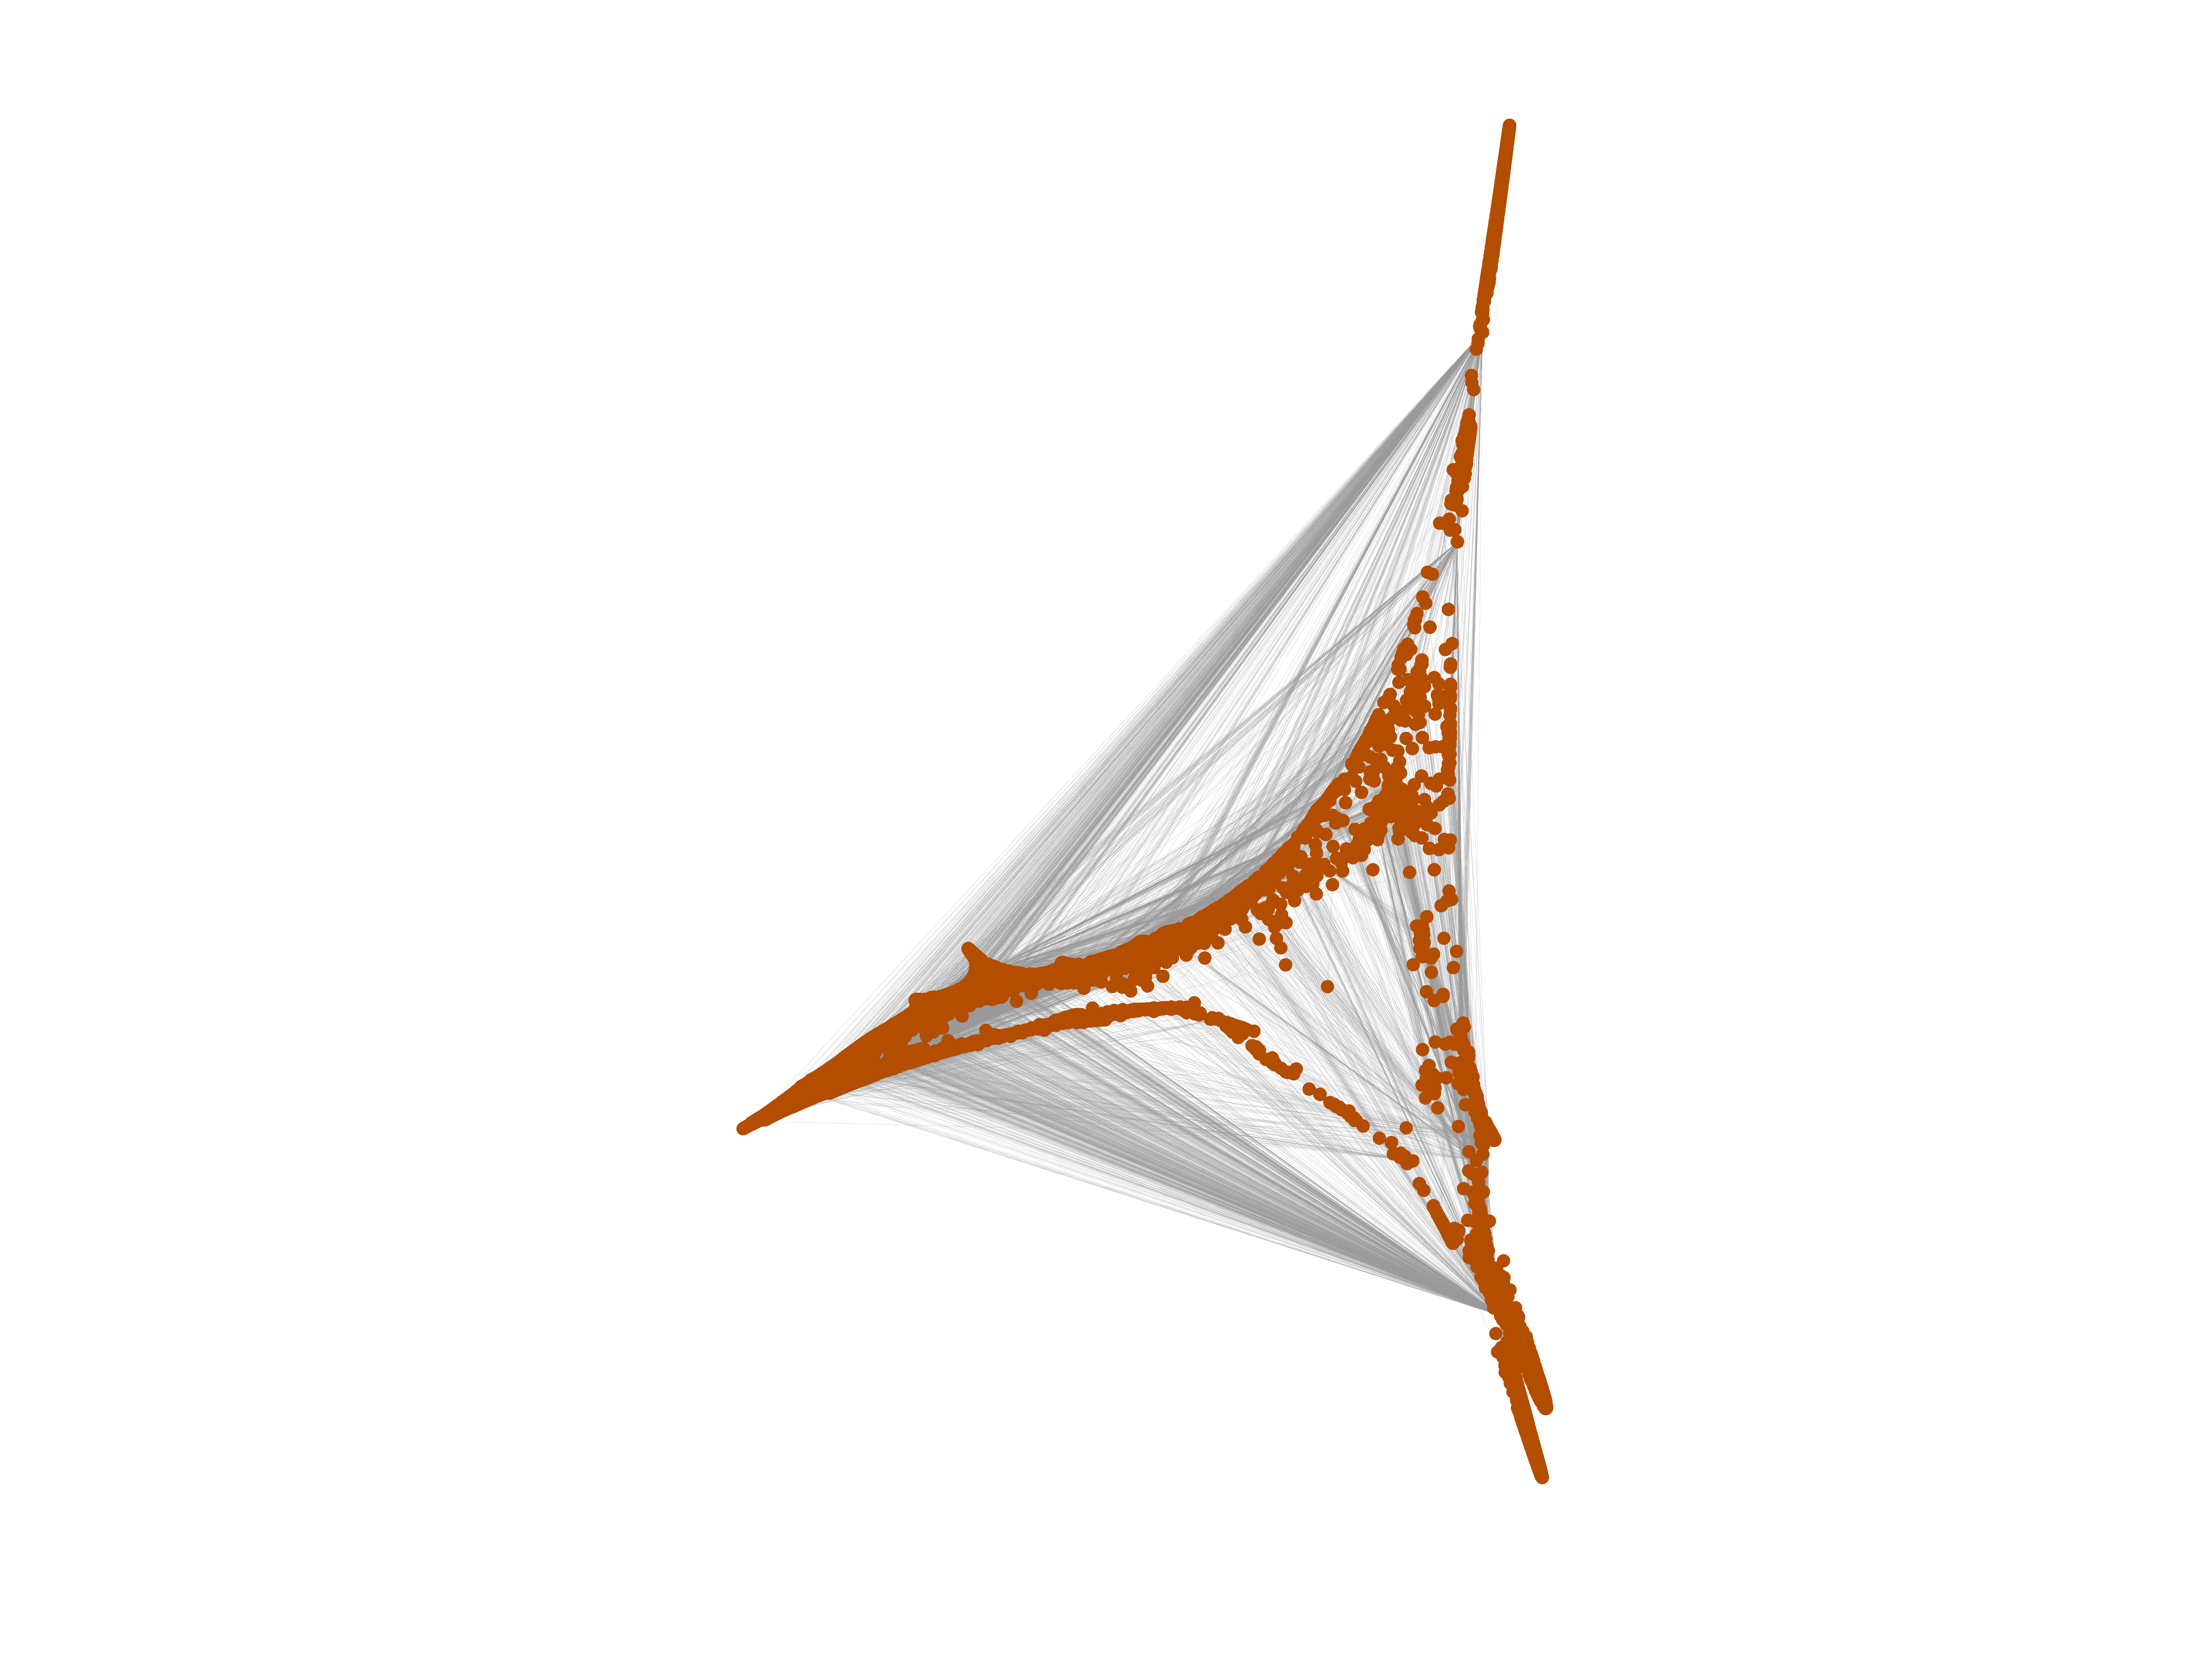
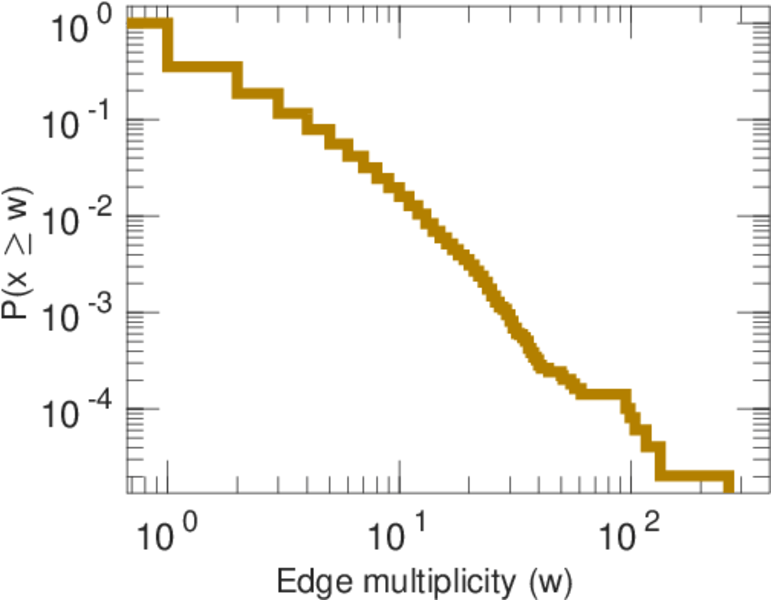
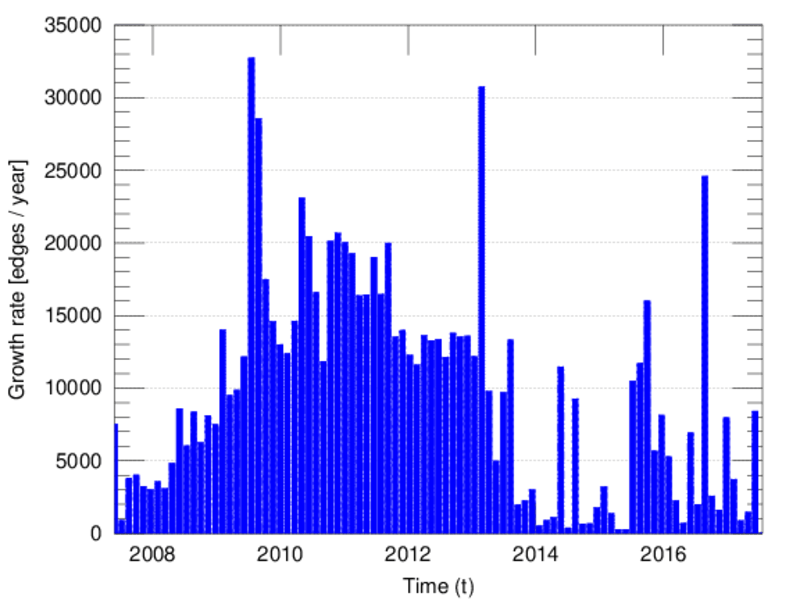
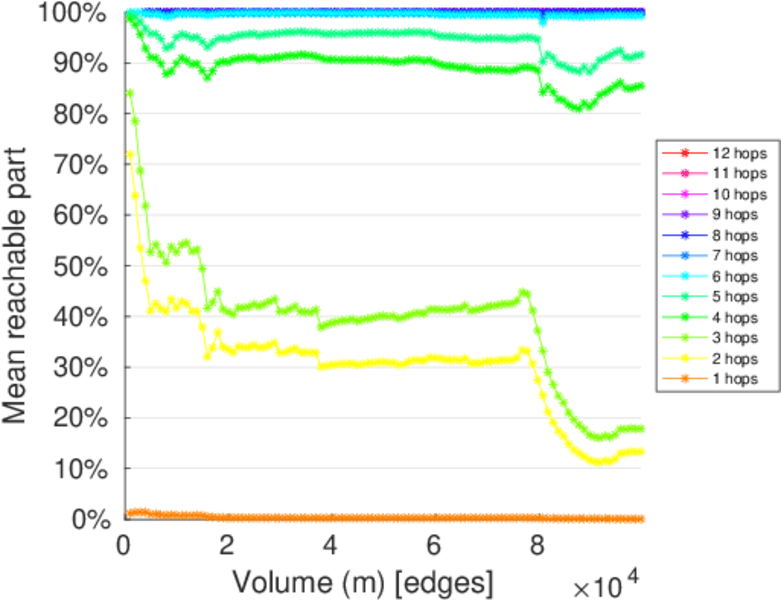
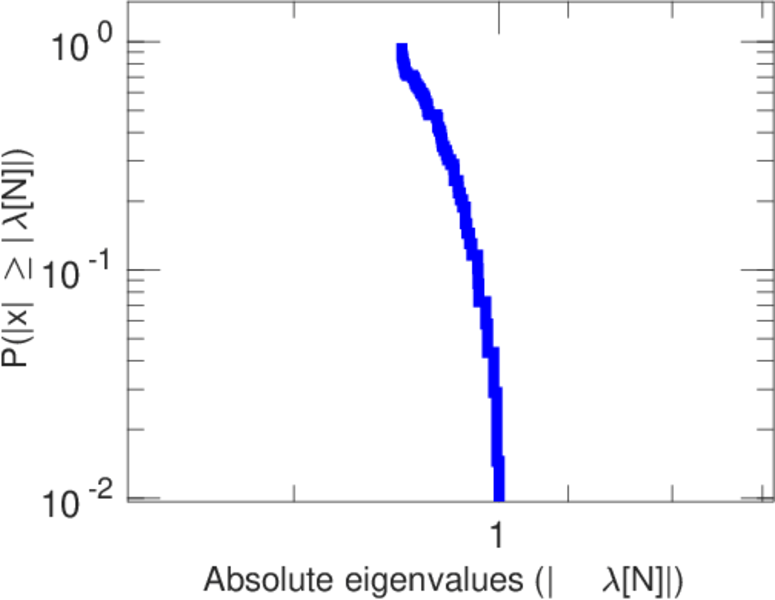
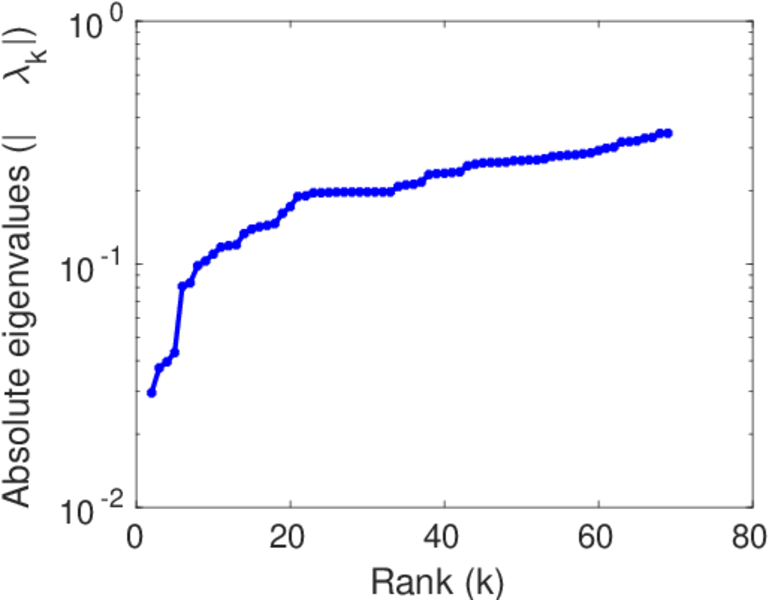
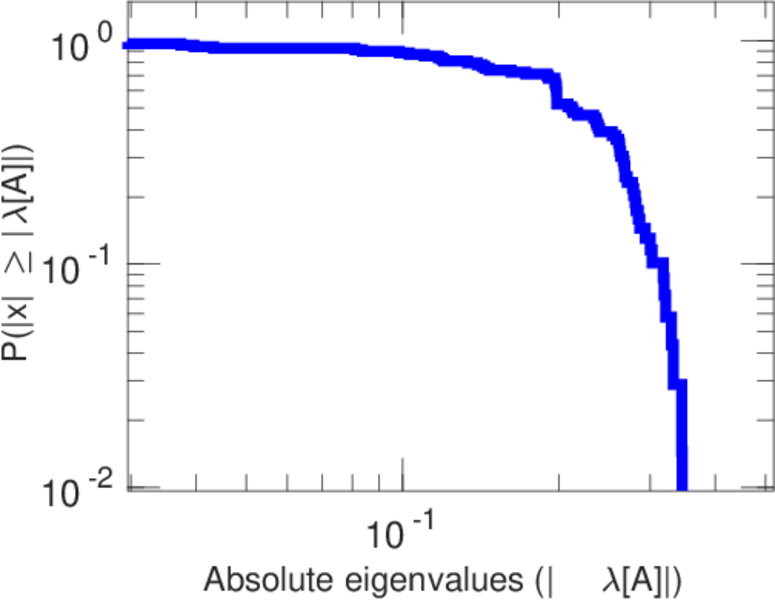
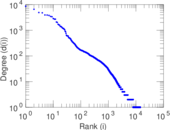
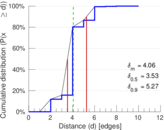
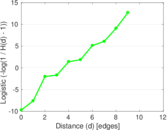
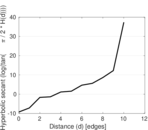
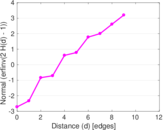
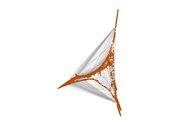
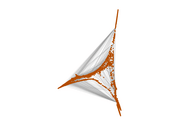
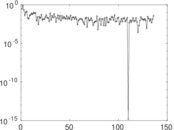
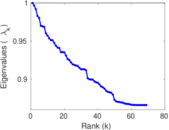
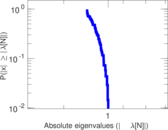
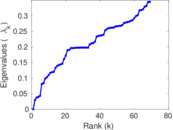
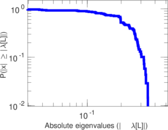
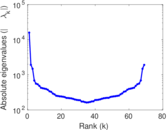
Plots


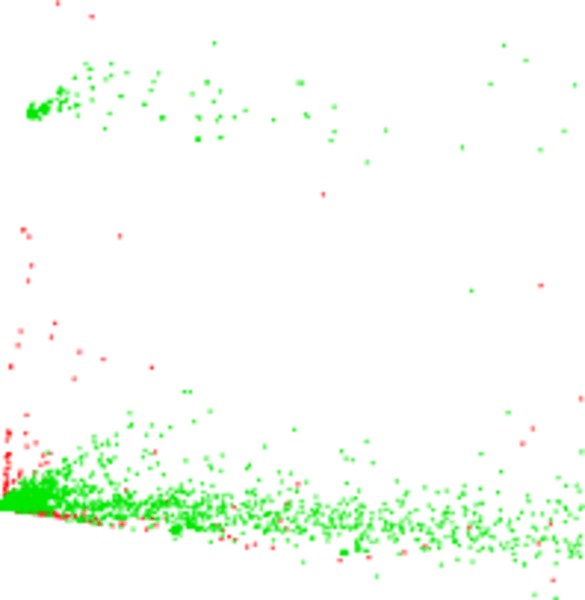
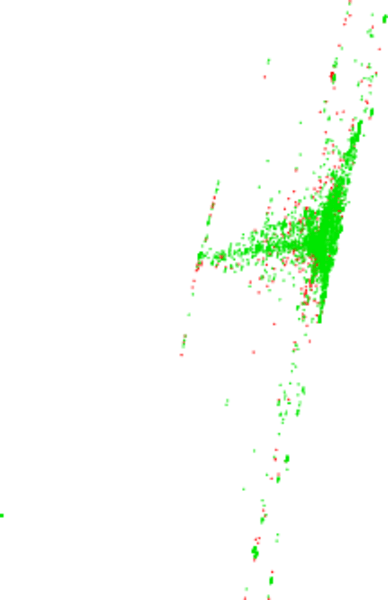
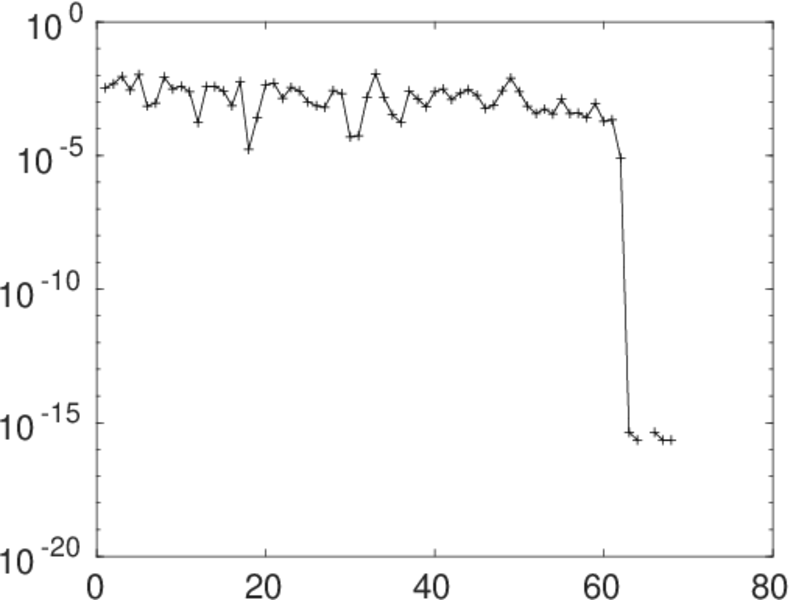
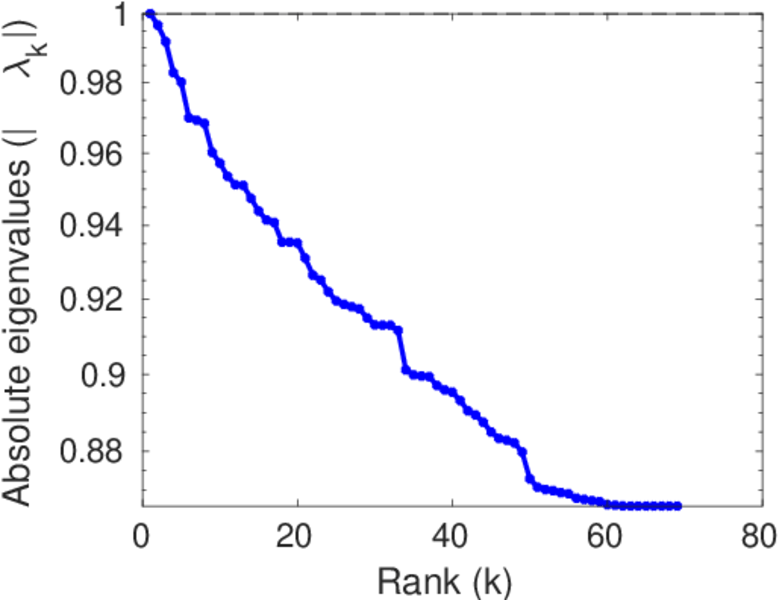
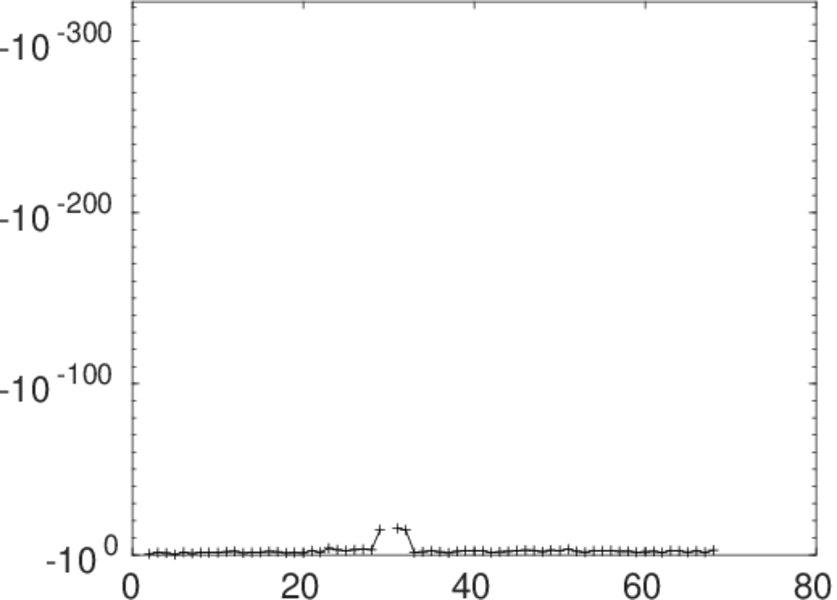
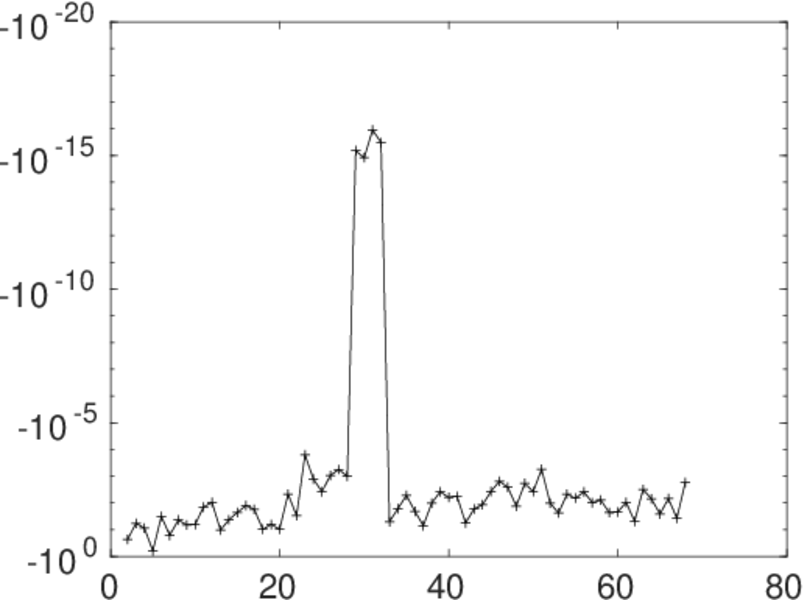
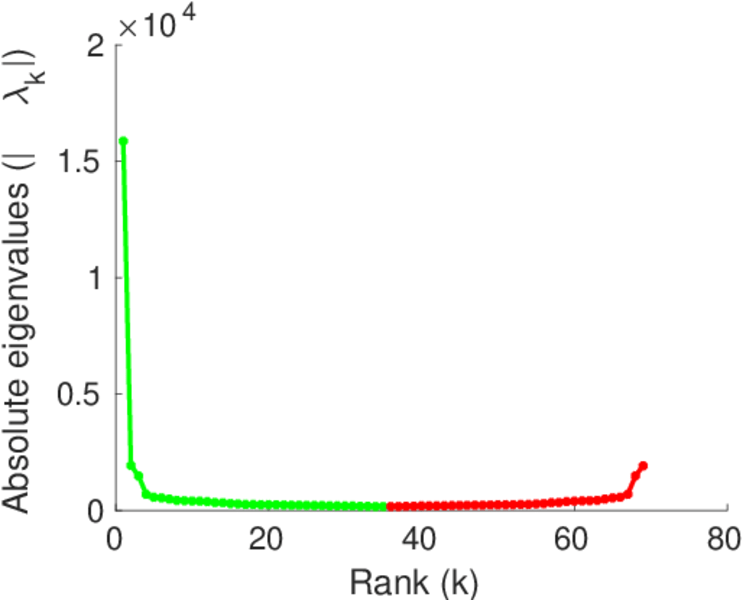
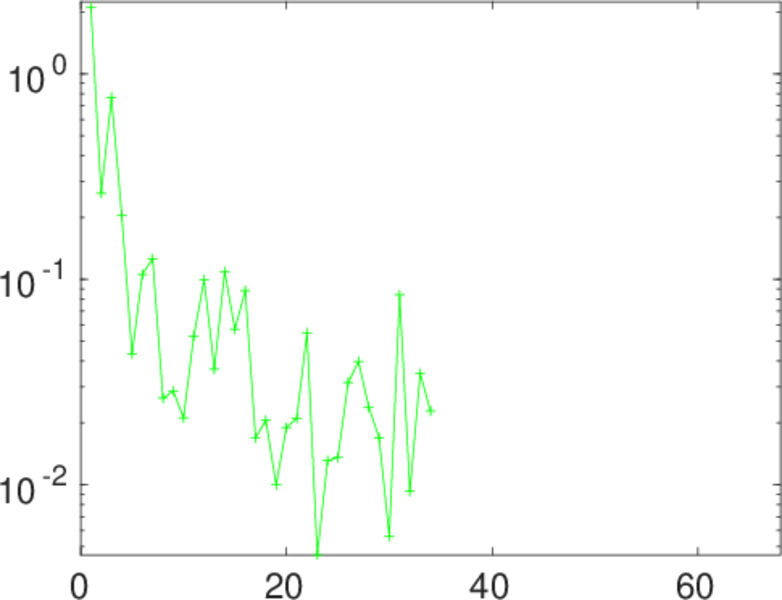
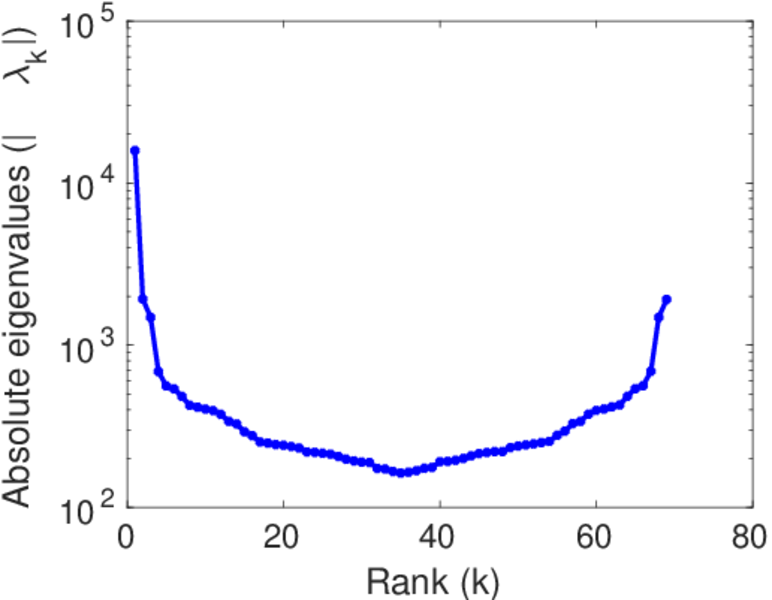
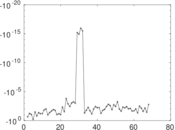
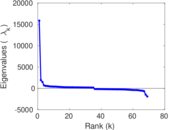
Matrix decompositions plots


Downloads
References
|
[1]
|
Jérôme Kunegis.
KONECT – The Koblenz Network Collection.
In Proc. Int. Conf. on World Wide Web Companion, pages
1343–1350, 2013.
[ http ]
|
|
[2]
|
Wikimedia Foundation.
Wikimedia downloads.
http://dumps.wikimedia.org/, January 2010.
|
 KONECT ‣ Networks ‣
Buy Me a Coffee
KONECT ‣ Networks ‣
Buy Me a Coffee