Wikipedia edits (ha)
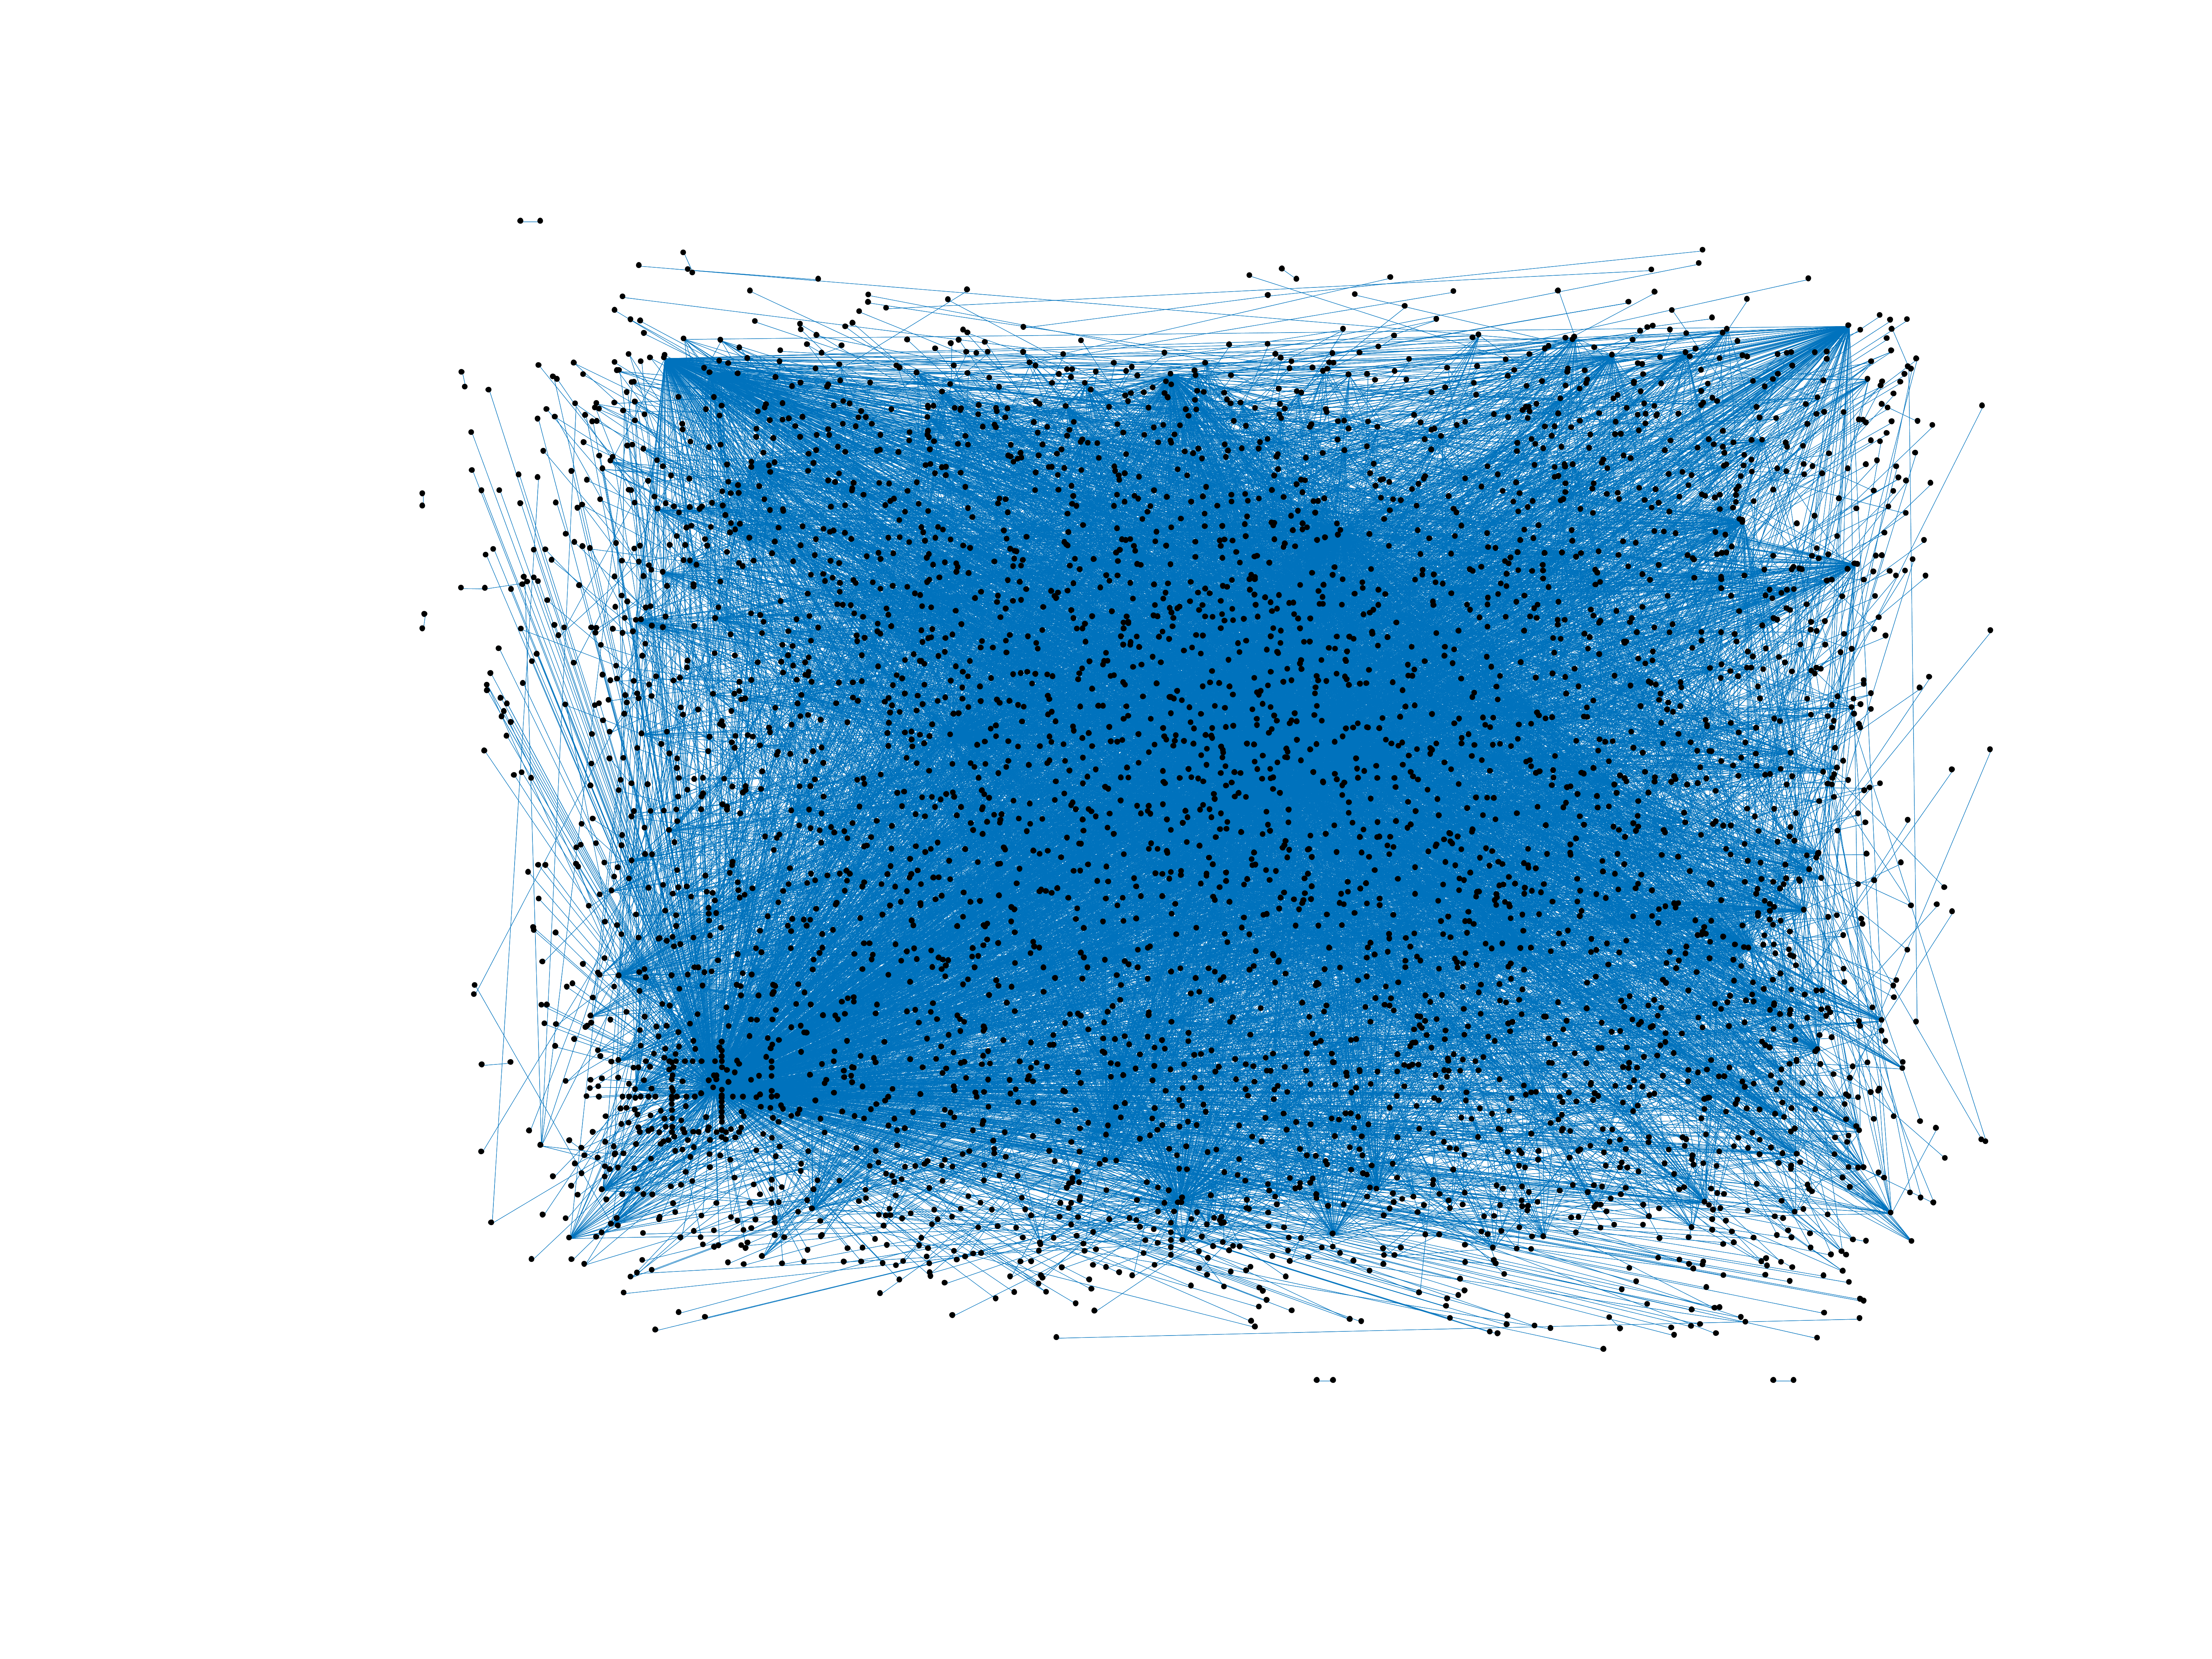
This is the bipartite edit network of the Hausa Wikipedia. It contains users
and pages from the Hausa Wikipedia, connected by edit events. Each edge
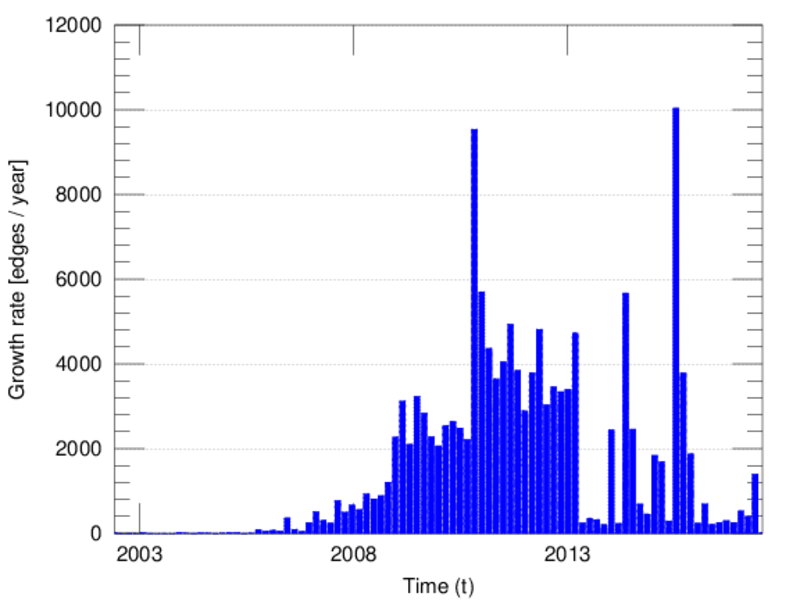
represents an edit. The dataset includes the timestamp of each edit.
Metadata
Statistics
| Size | n = | 4,286
|
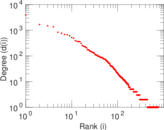
| Left size | n1 = | 771
|
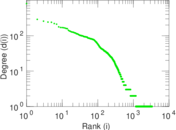
| Right size | n2 = | 3,515
|
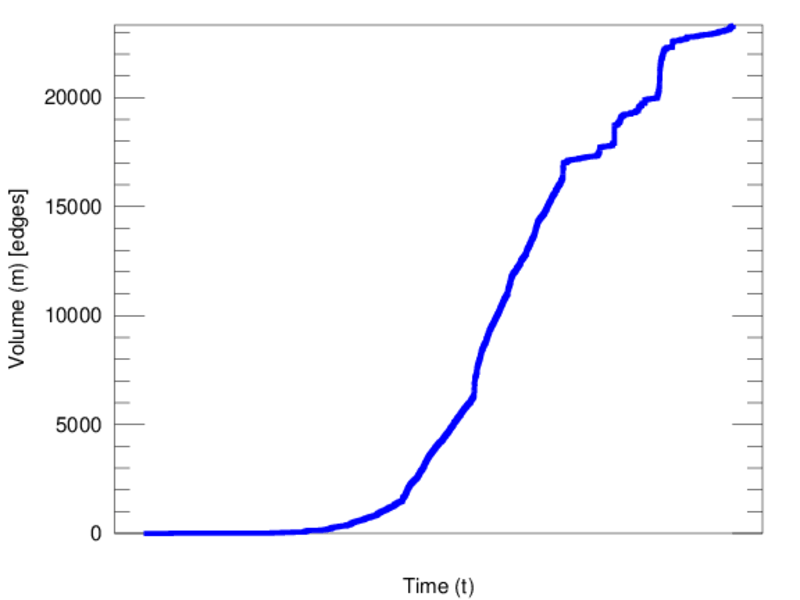
| Volume | m = | 23,338
|
| Unique edge count | m̿ = | 9,911
|
| Wedge count | s = | 1,330,759
|
| Claw count | z = | 316,248,271
|
| Cross count | x = | 82,444,777,178
|
| Square count | q = | 1,857,755
|
| 4-Tour count | T4 = | 20,209,254
|
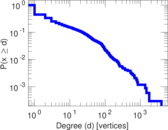
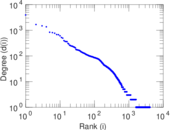
| Maximum degree | dmax = | 3,929
|
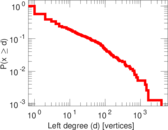
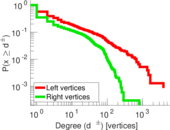
| Maximum left degree | d1max = | 3,929
|
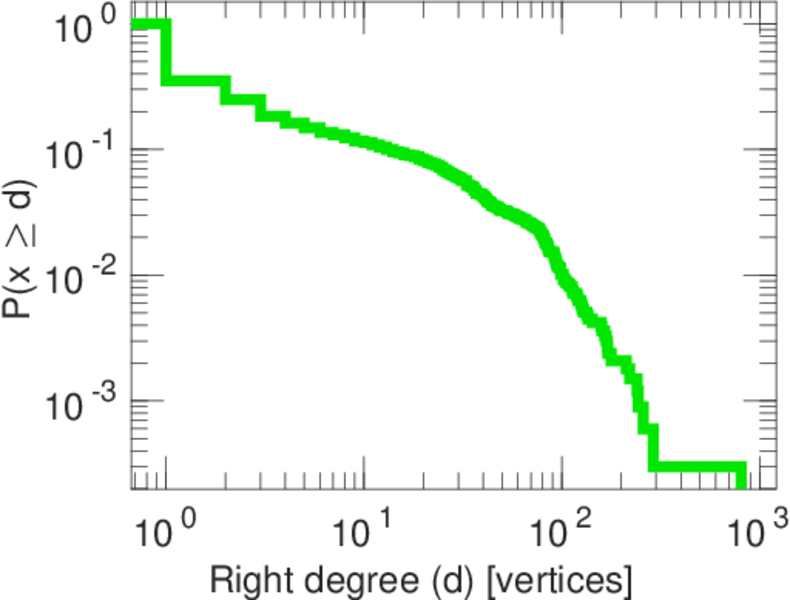
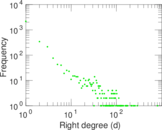
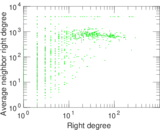
| Maximum right degree | d2max = | 808
|
| Average degree | d = | 10.890 3
|
| Average left degree | d1 = | 30.269 8
|
| Average right degree | d2 = | 6.639 54
|
| Fill | p = | 0.003 657 11
|
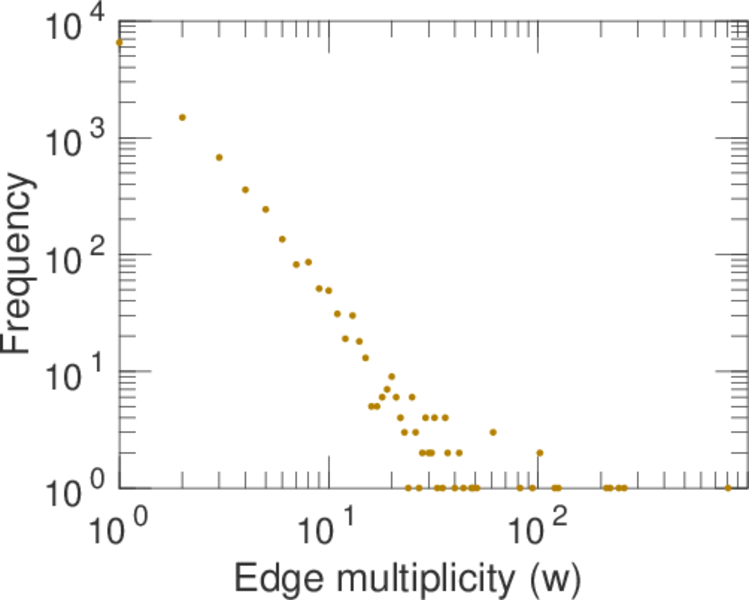
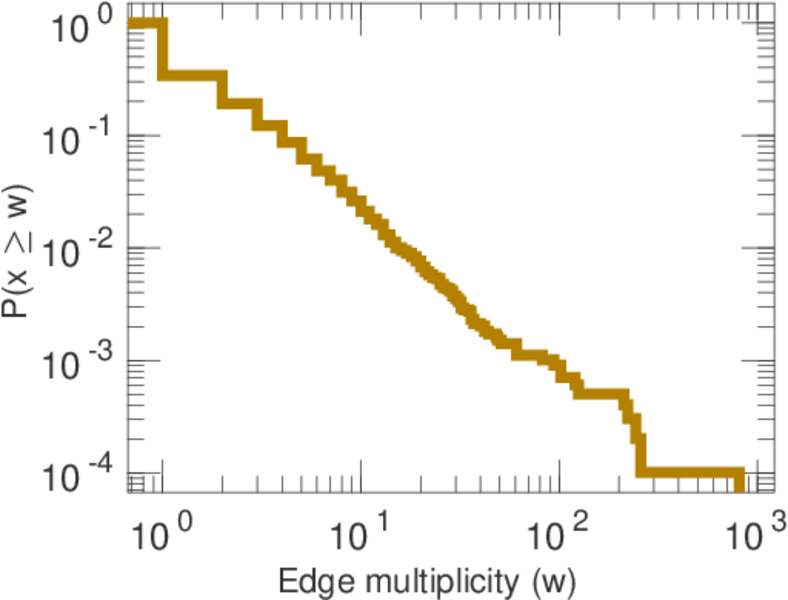
| Average edge multiplicity | m̃ = | 2.354 76
|
| Size of LCC | N = | 3,494
|
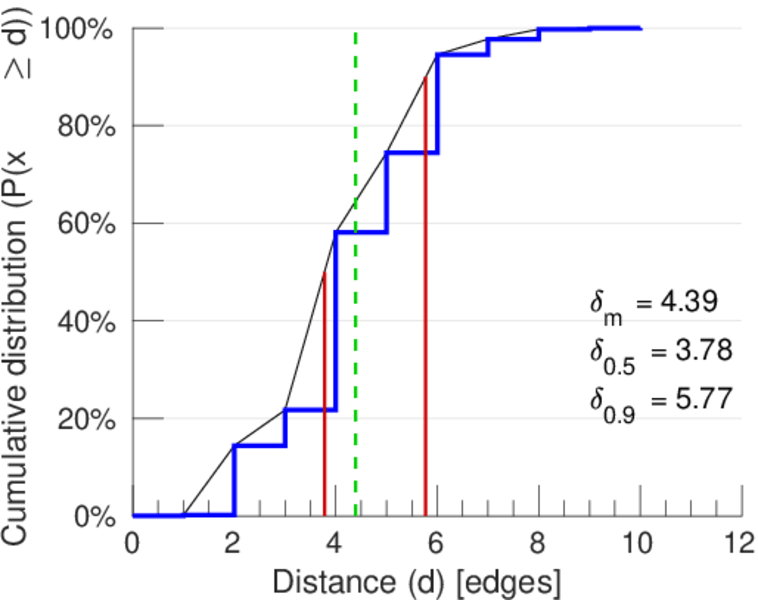
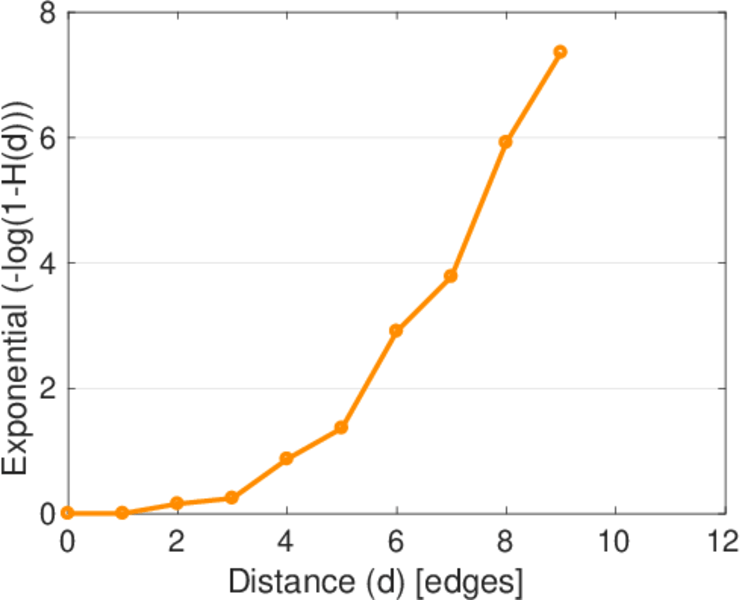
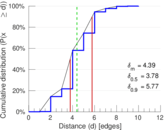
| Diameter | δ = | 13
|
| 50-Percentile effective diameter | δ0.5 = | 3.777 52
|
| 90-Percentile effective diameter | δ0.9 = | 5.774 65
|
| Median distance | δM = | 4
|
| Mean distance | δm = | 4.392 85
|
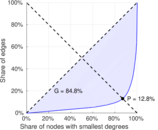
| Gini coefficient | G = | 0.853 305
|
| Balanced inequality ratio | P = | 0.131 202
|
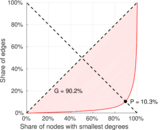
| Left balanced inequality ratio | P1 = | 0.102 622
|
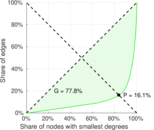
| Right balanced inequality ratio | P2 = | 0.160 811
|
| Relative edge distribution entropy | Her = | 0.798 576
|
| Power law exponent | γ = | 3.000 23
|
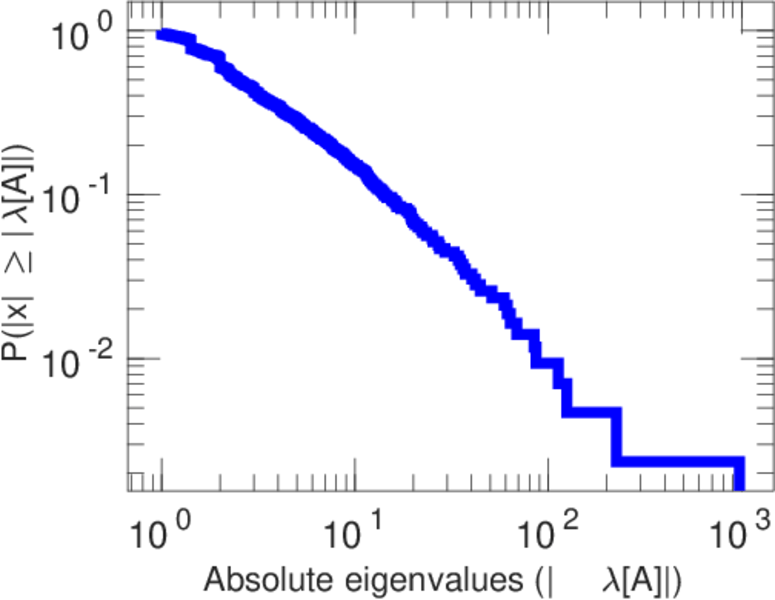
| Tail power law exponent | γt = | 2.361 00
|
| Tail power law exponent with p | γ3 = | 2.361 00
|
| p-value | p = | 0.820 000
|
| Left tail power law exponent with p | γ3,1 = | 1.721 00
|
| Left p-value | p1 = | 0.000 00
|
| Right tail power law exponent with p | γ3,2 = | 6.701 00
|
| Right p-value | p2 = | 0.947 000
|
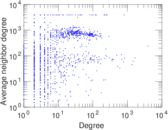
| Degree assortativity | ρ = | −0.341 017
|
| Degree assortativity p-value | pρ = | 2.267 73 × 10−268
|
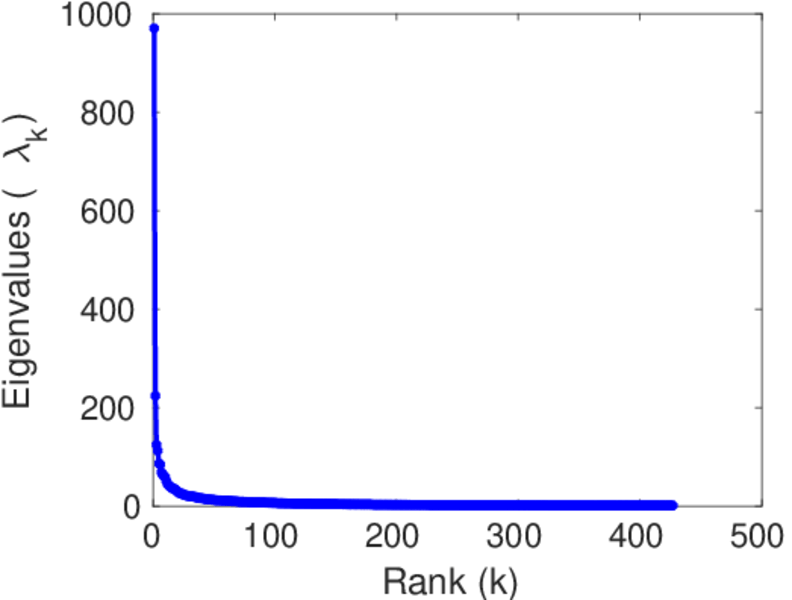
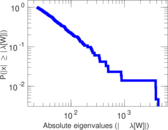
| Spectral norm | α = | 970.521
|
| Algebraic connectivity | a = | 0.028 281 6
|
| Spectral separation | |λ1[A] / λ2[A]| = | 4.331 12
|
| Controllability | C = | 2,731
|
| Relative controllability | Cr = | 0.663 347
|
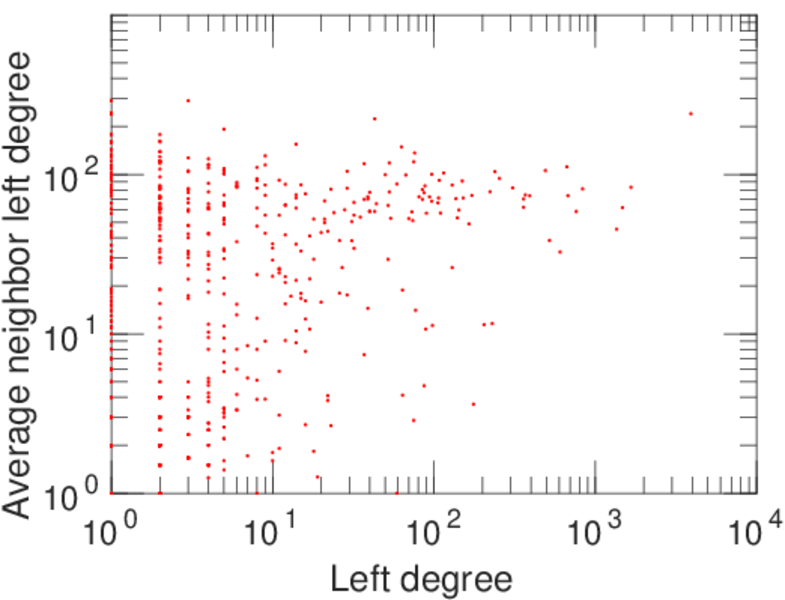
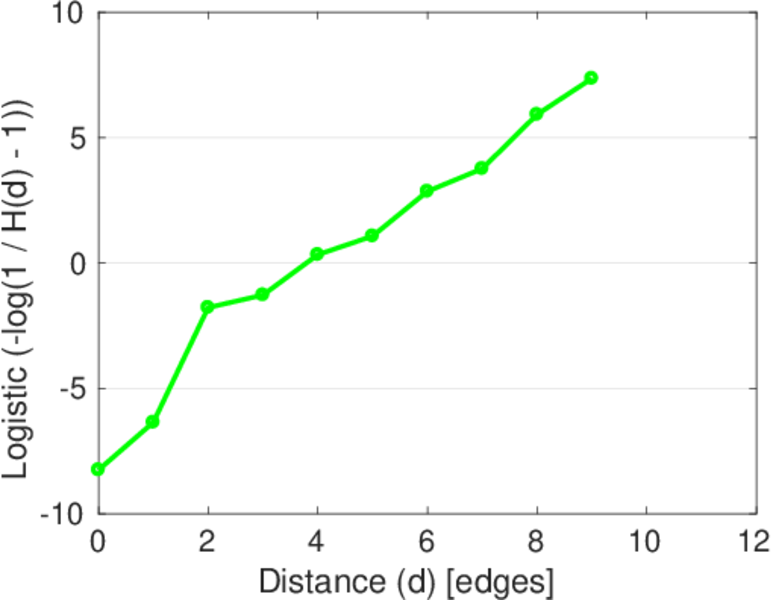
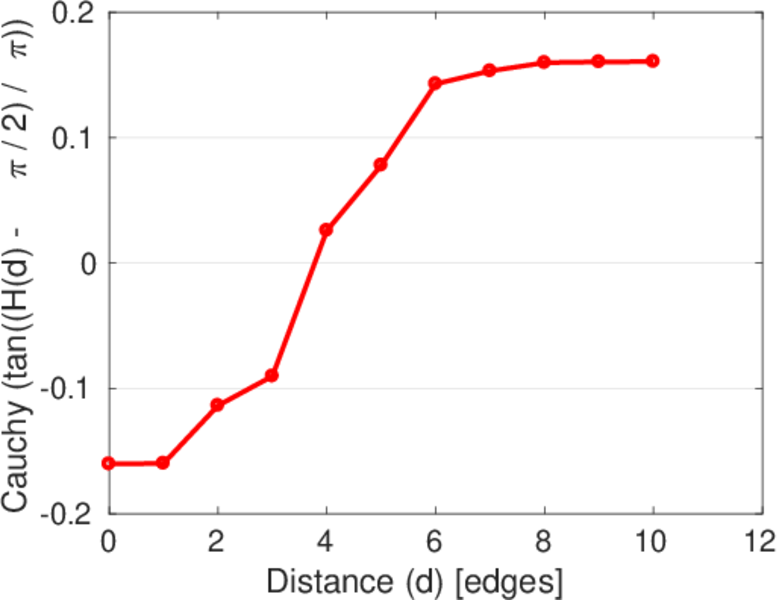
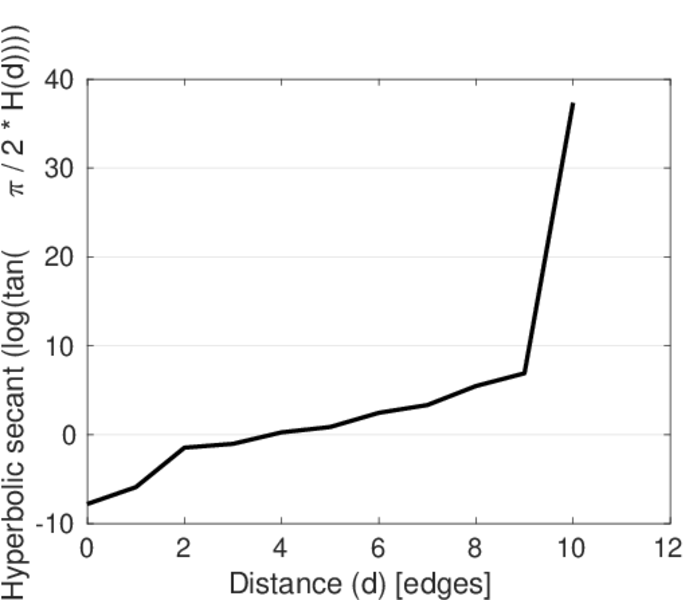
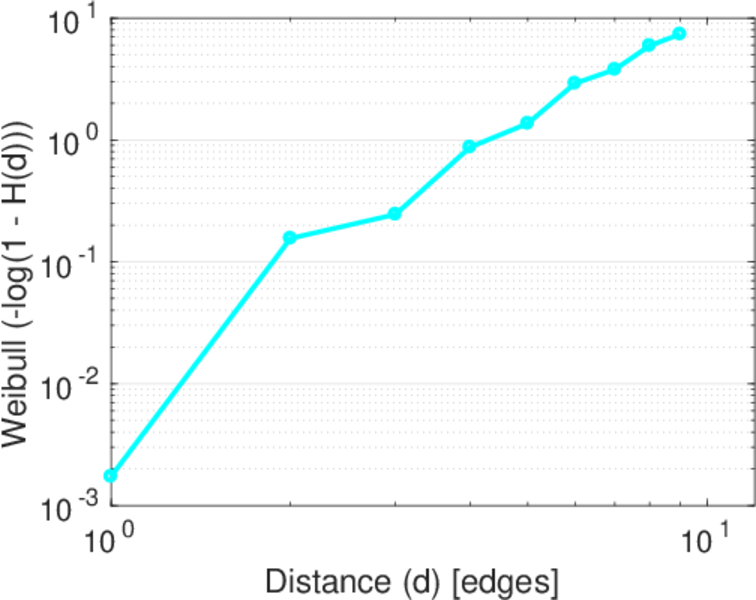
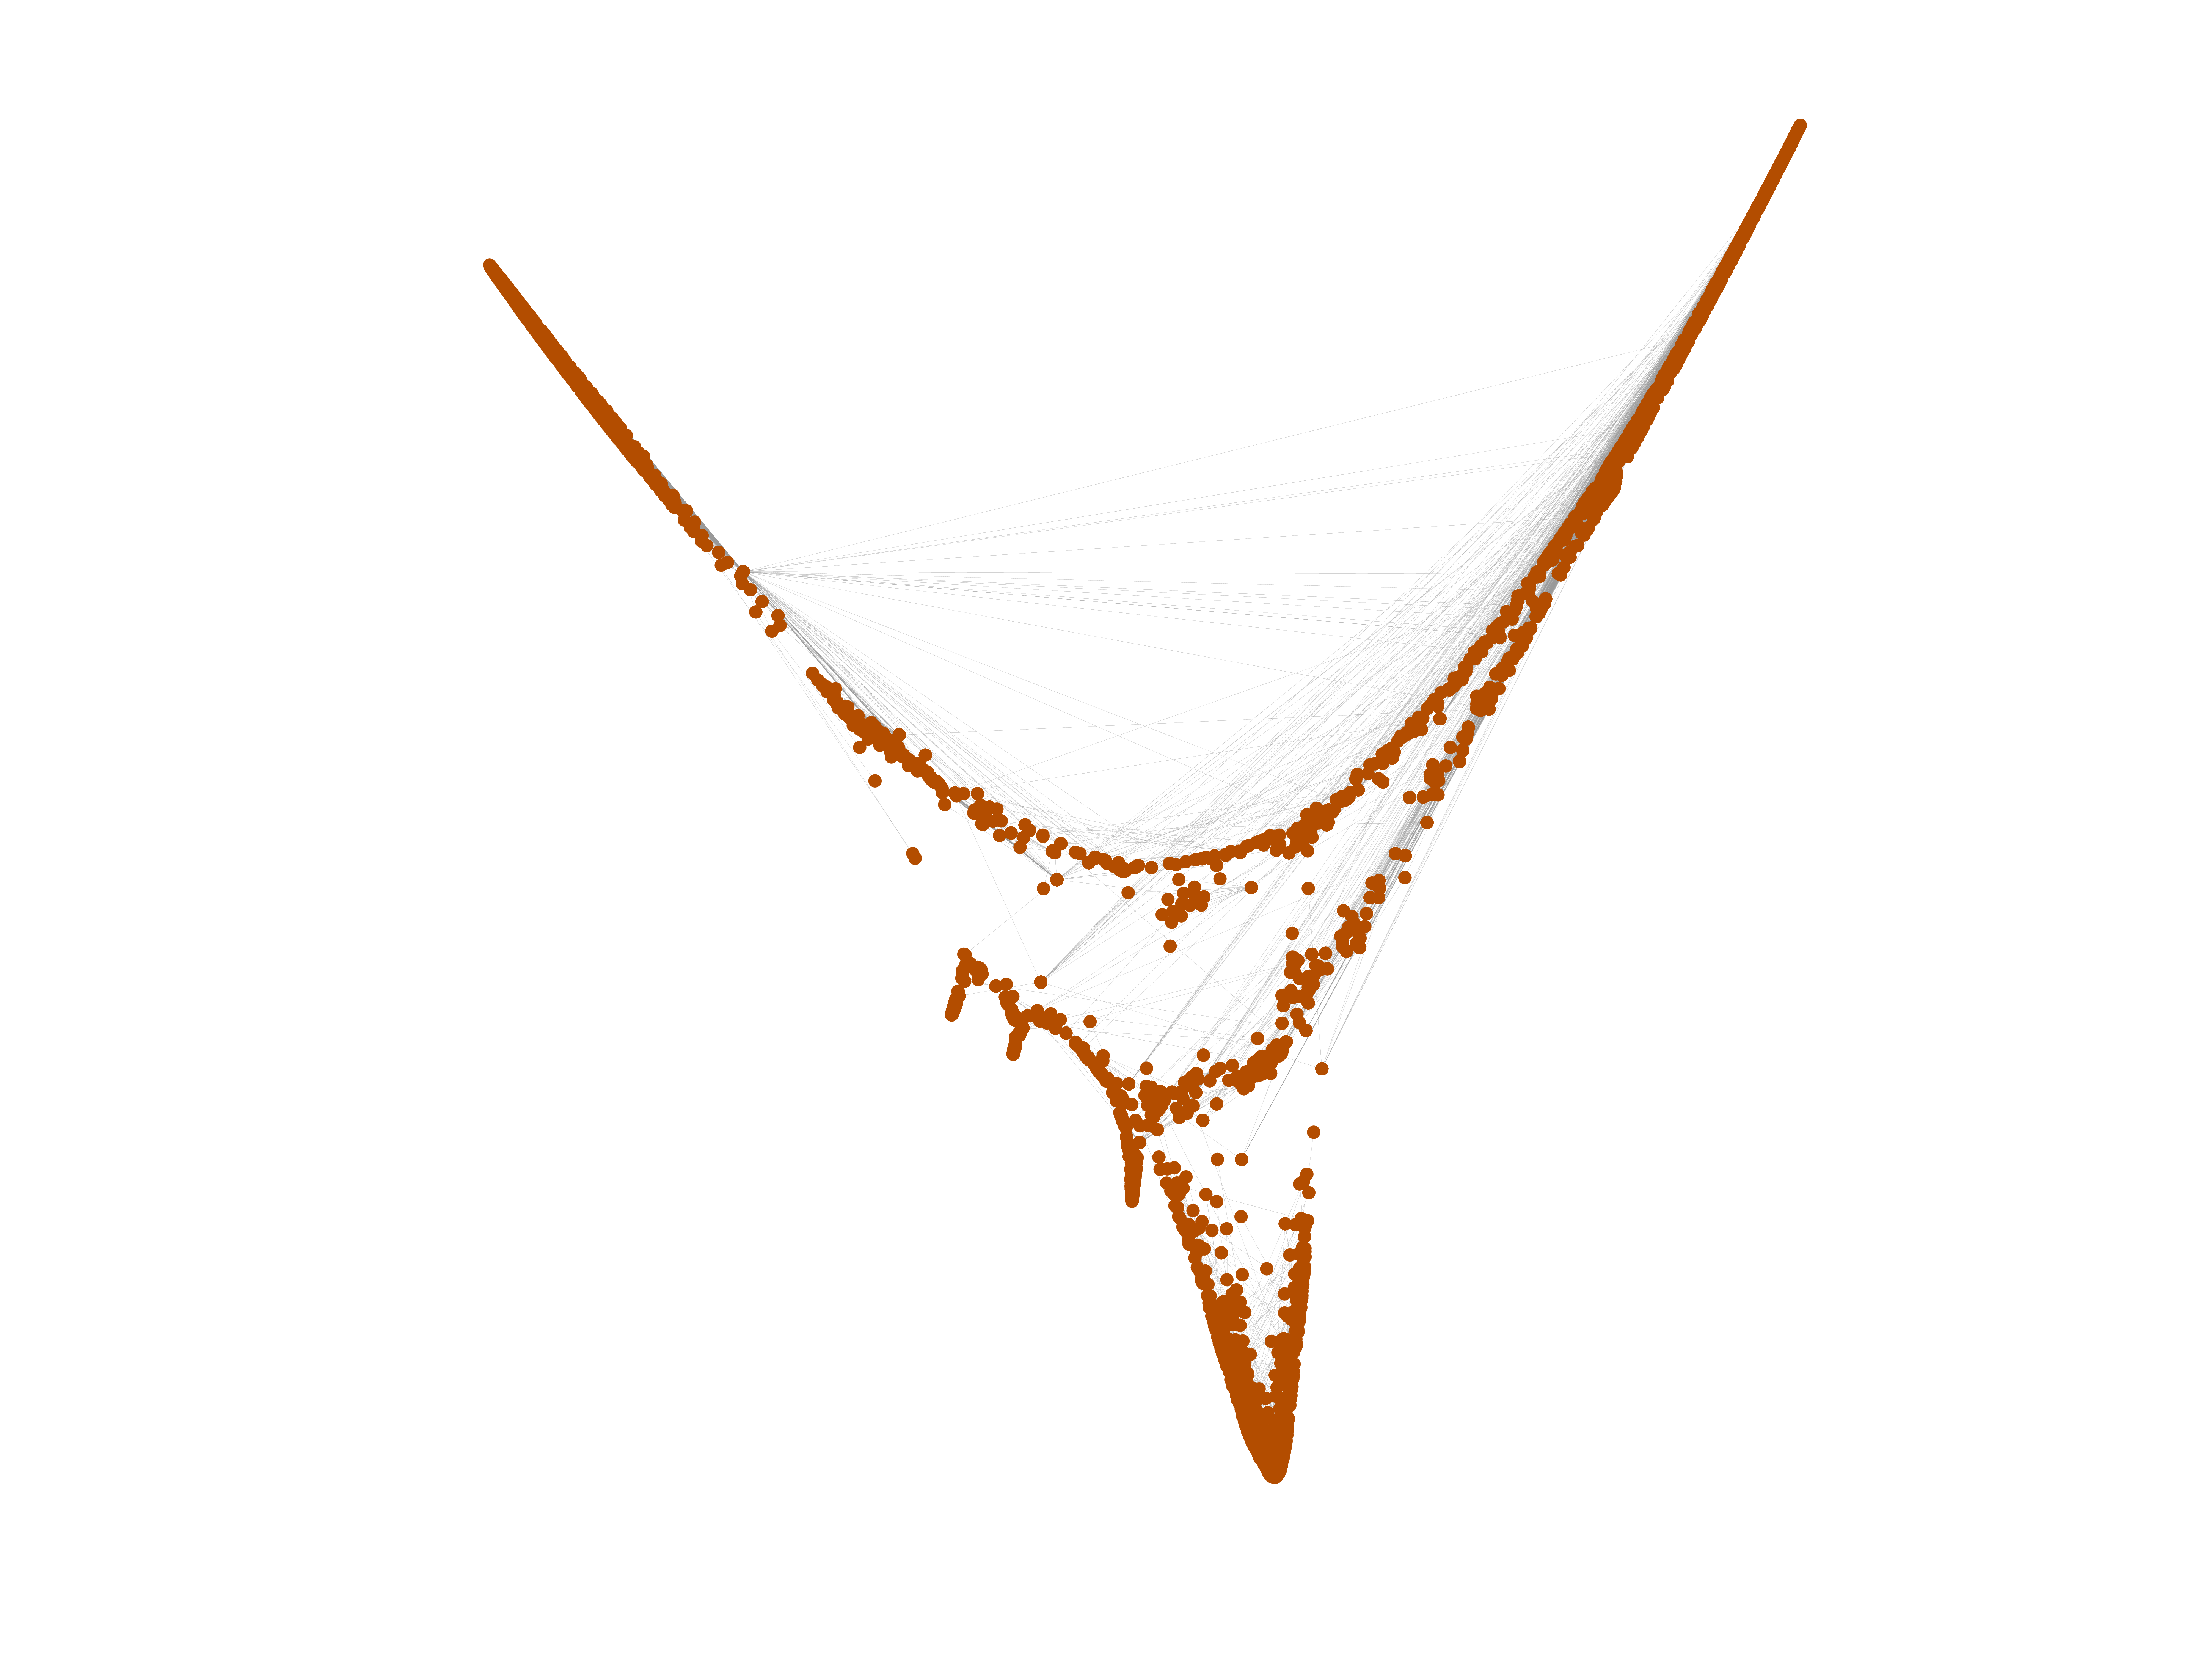
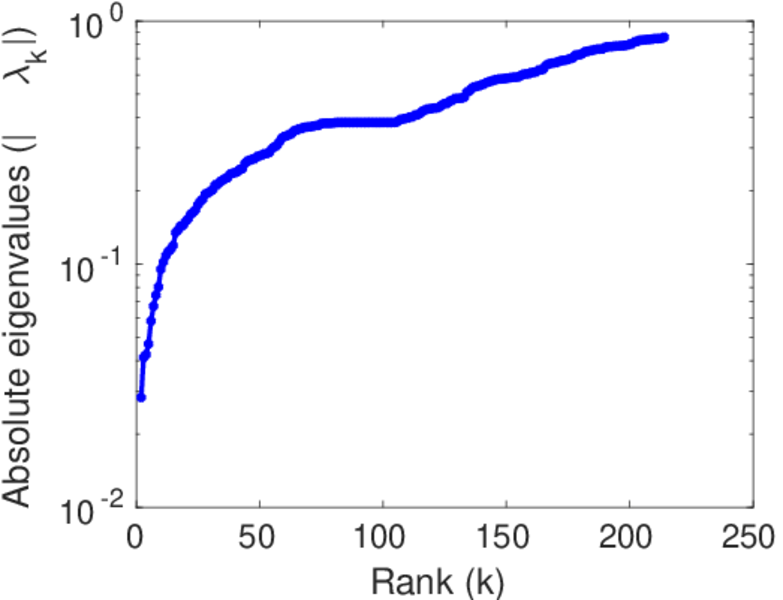
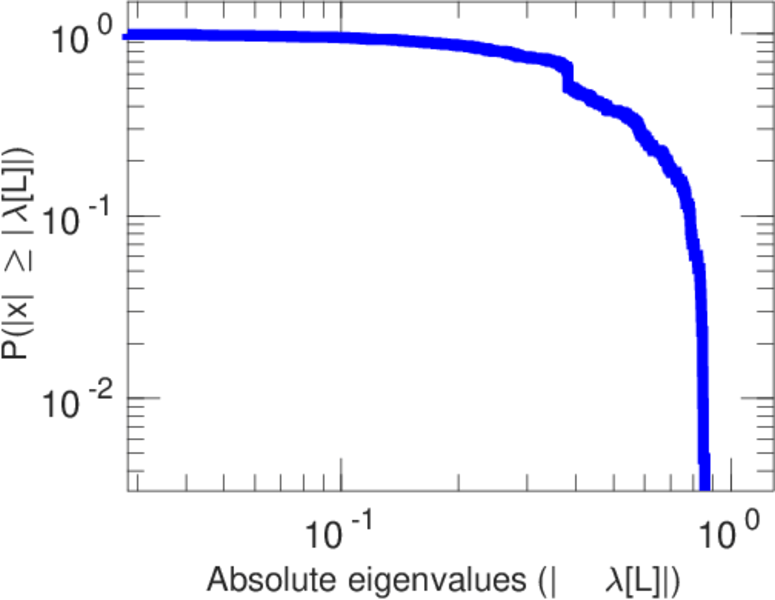
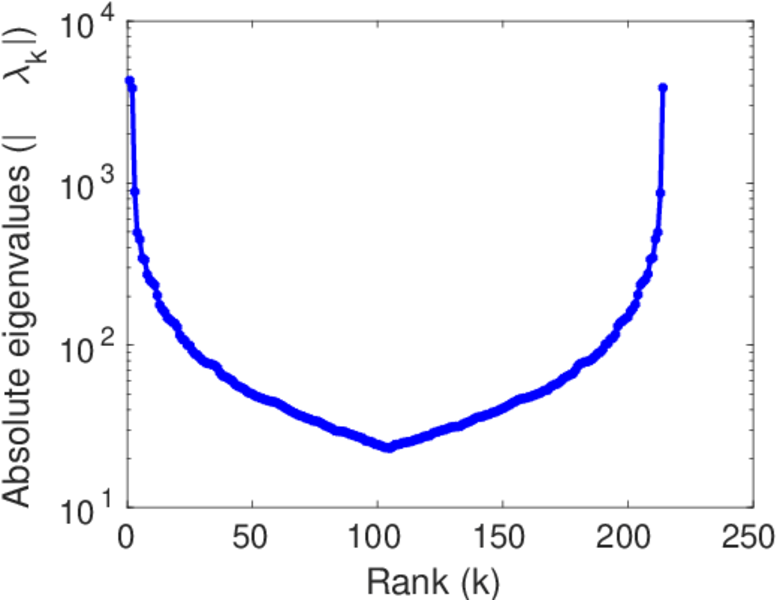
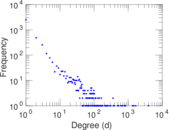
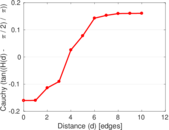
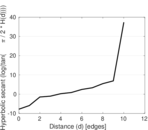
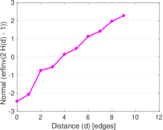
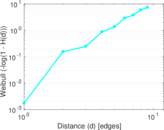
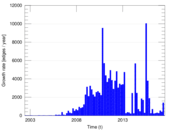
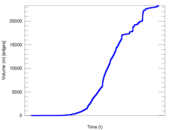
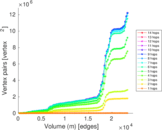
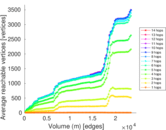
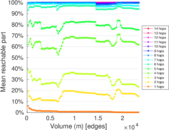
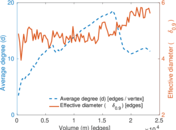
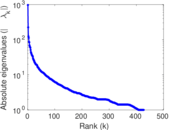
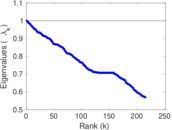
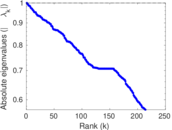
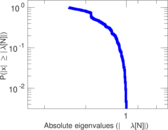
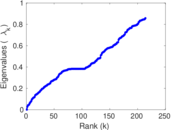
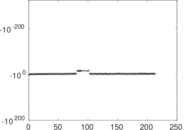
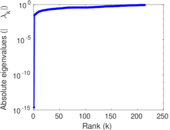
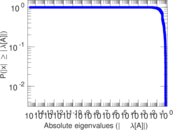
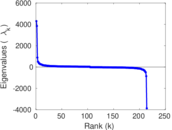
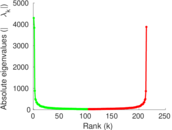
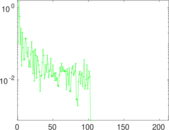
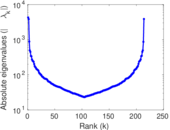
Plots


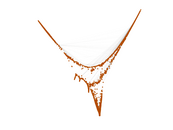


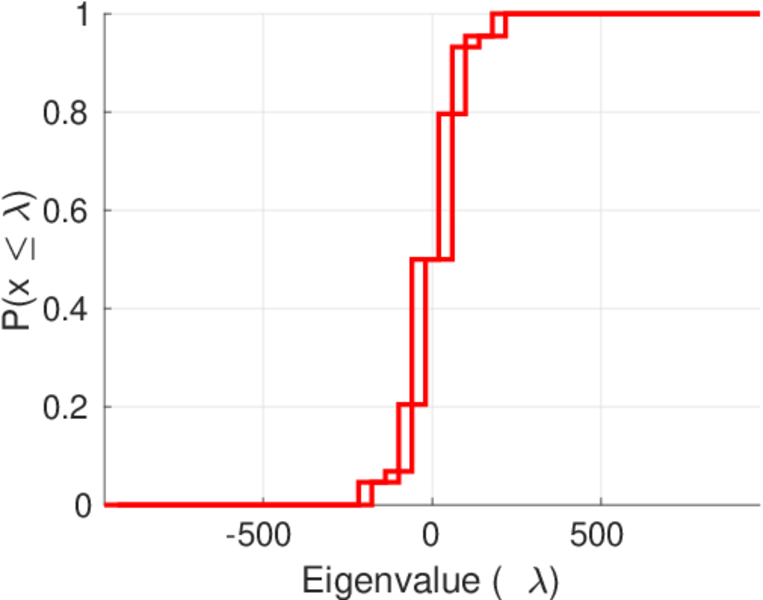
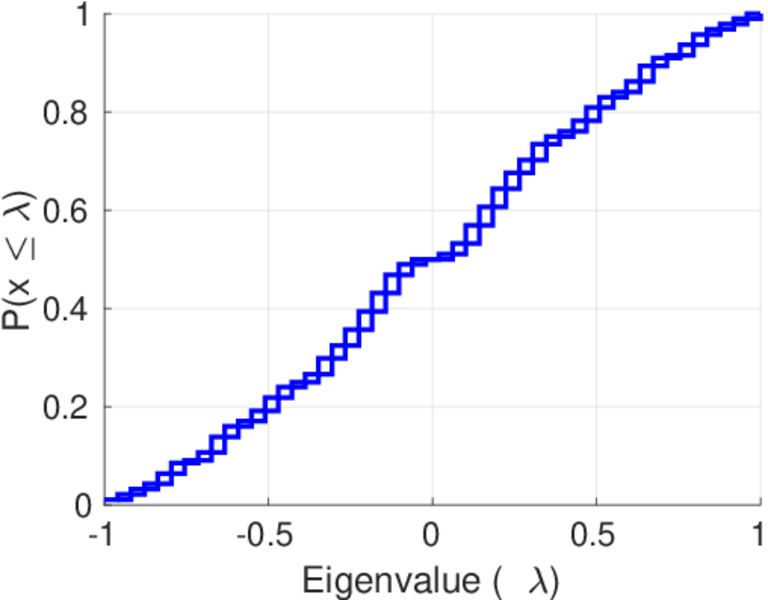
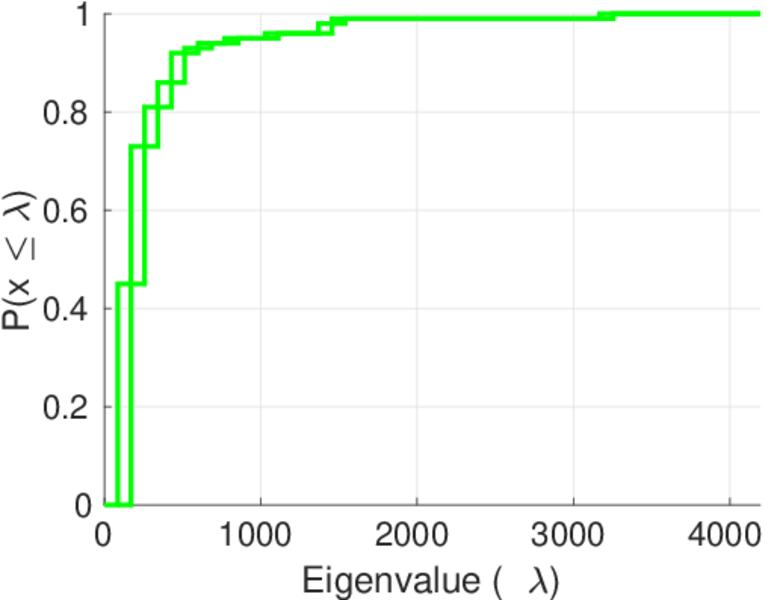
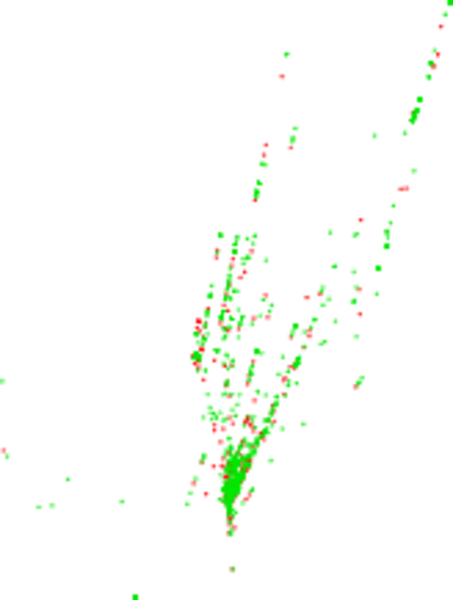
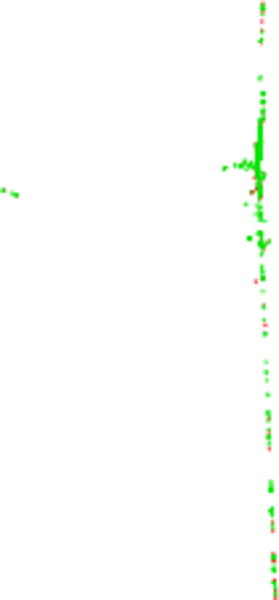
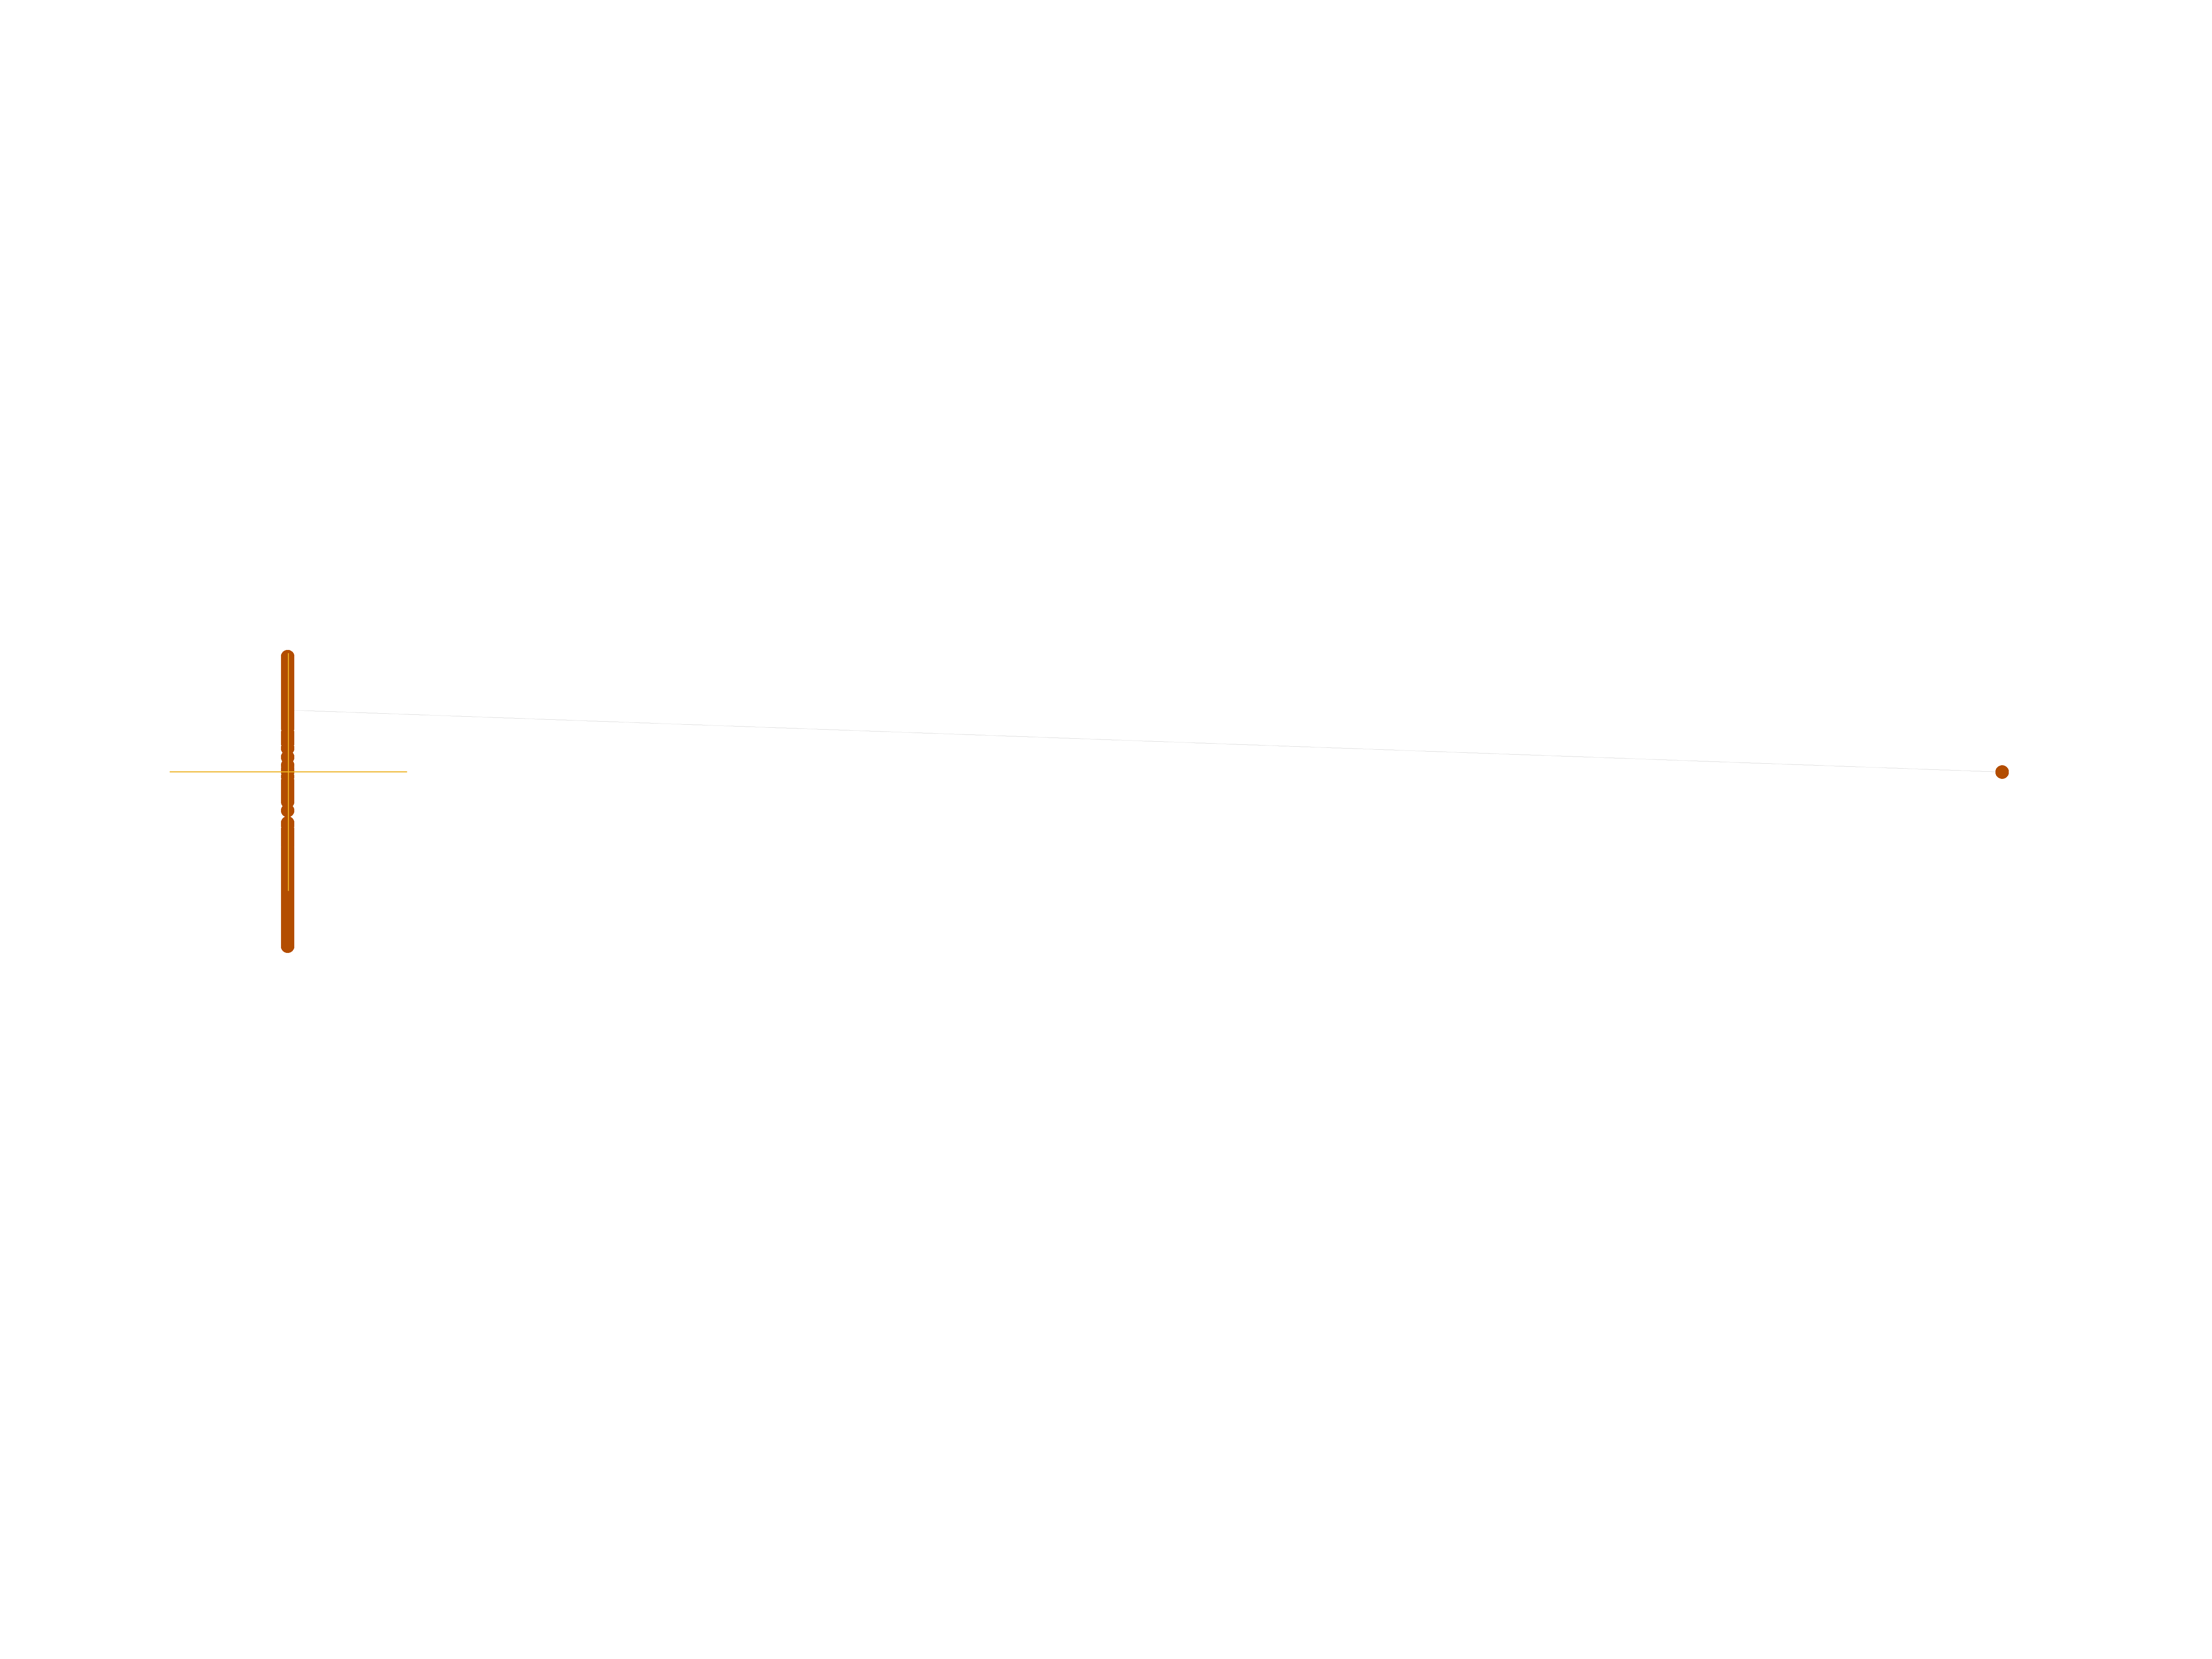
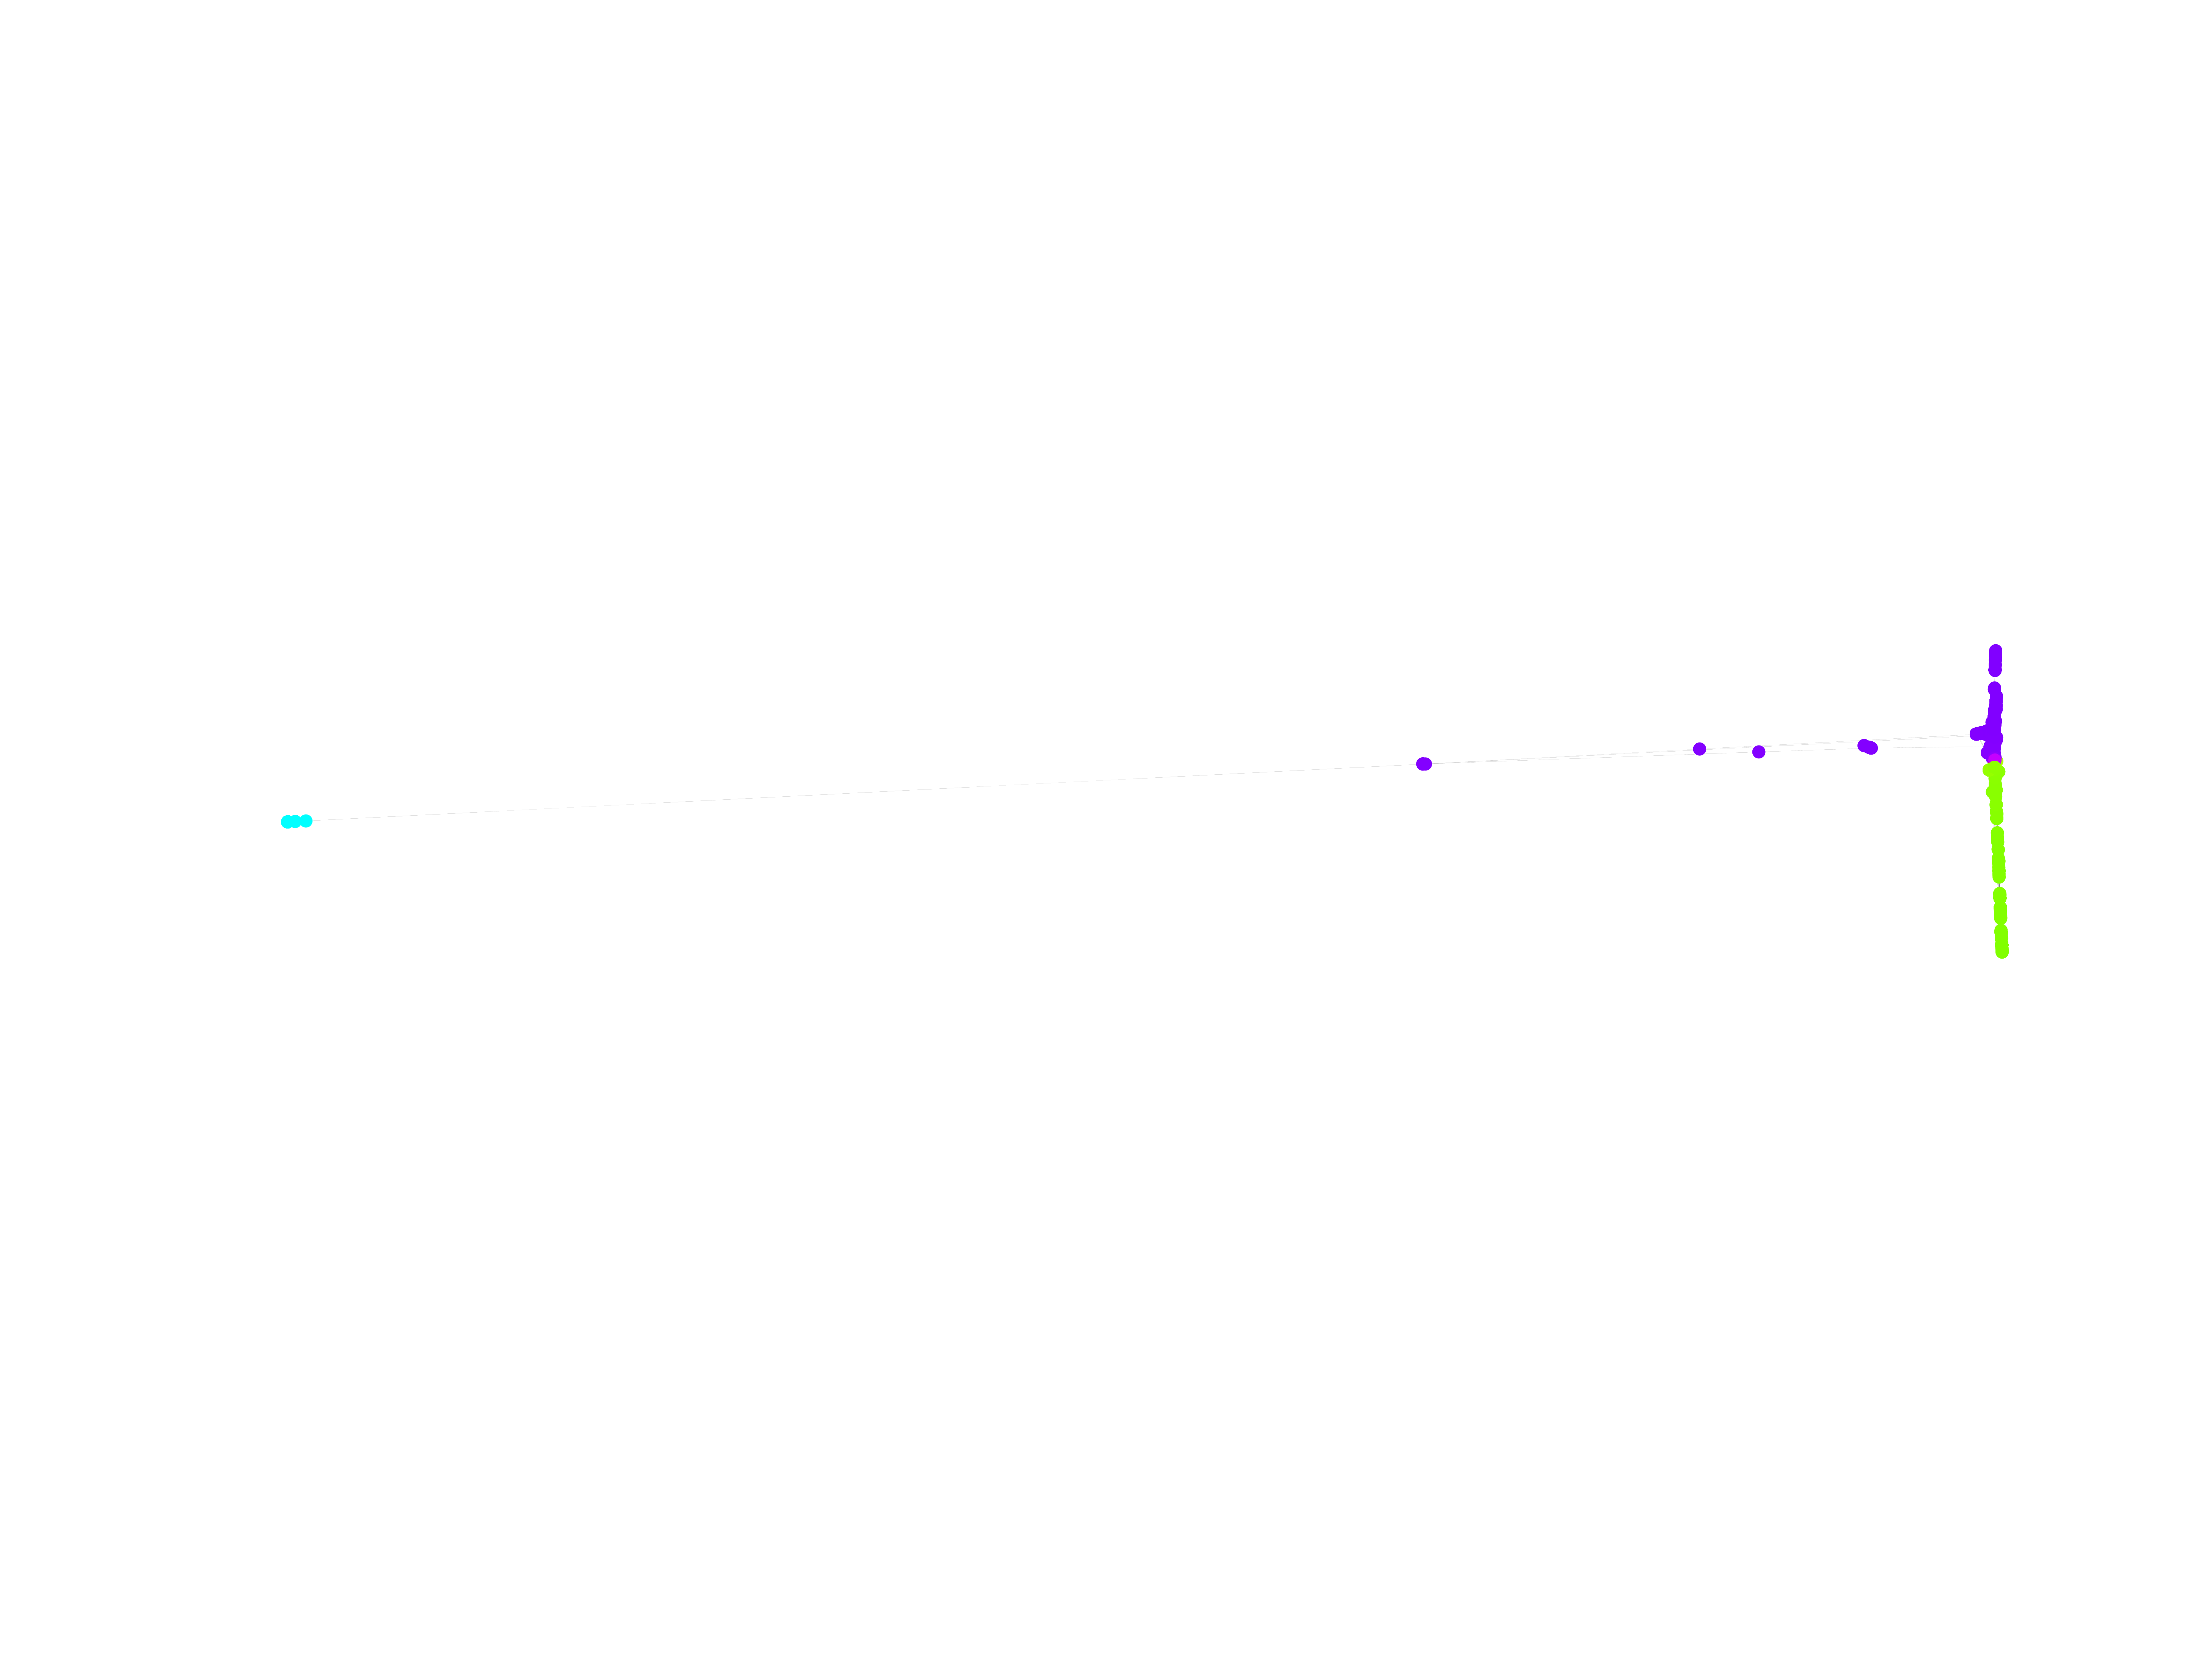
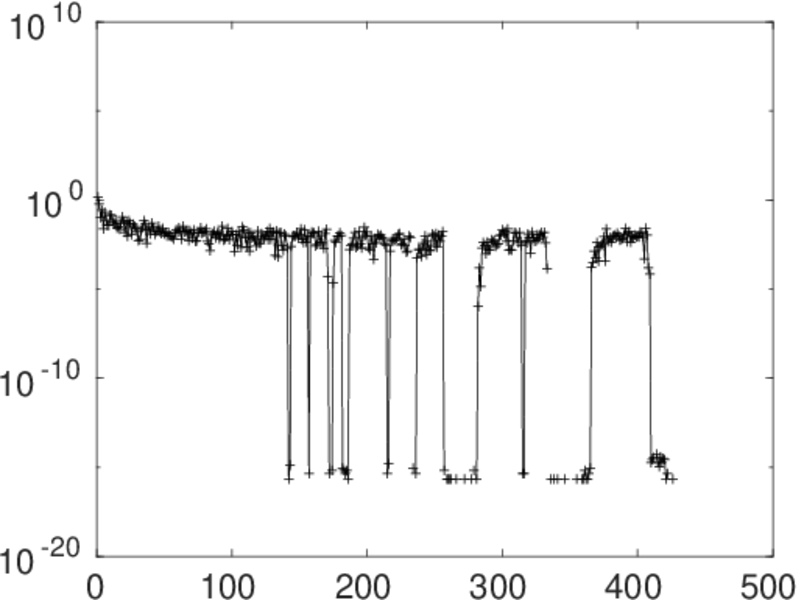
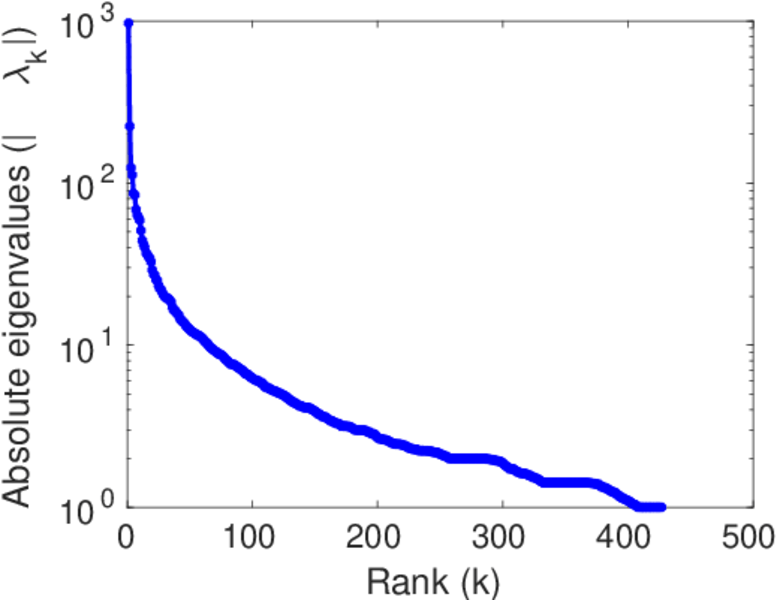
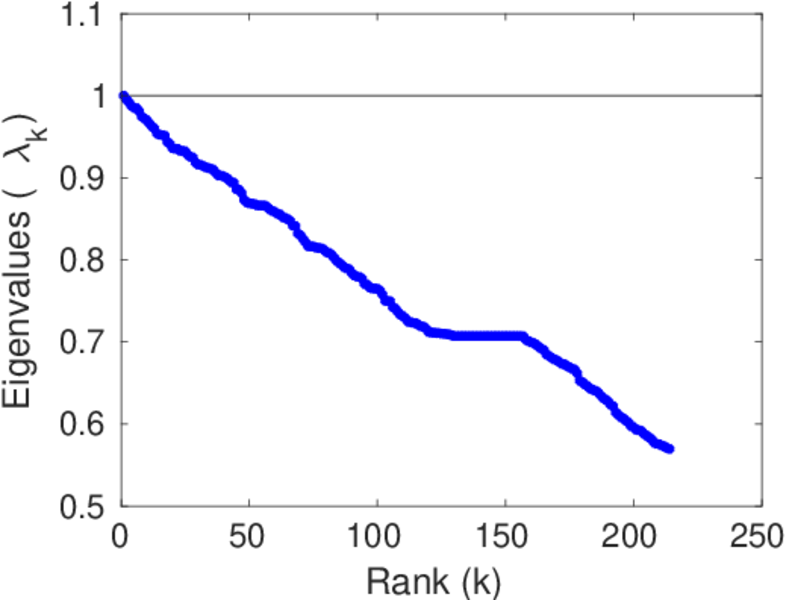
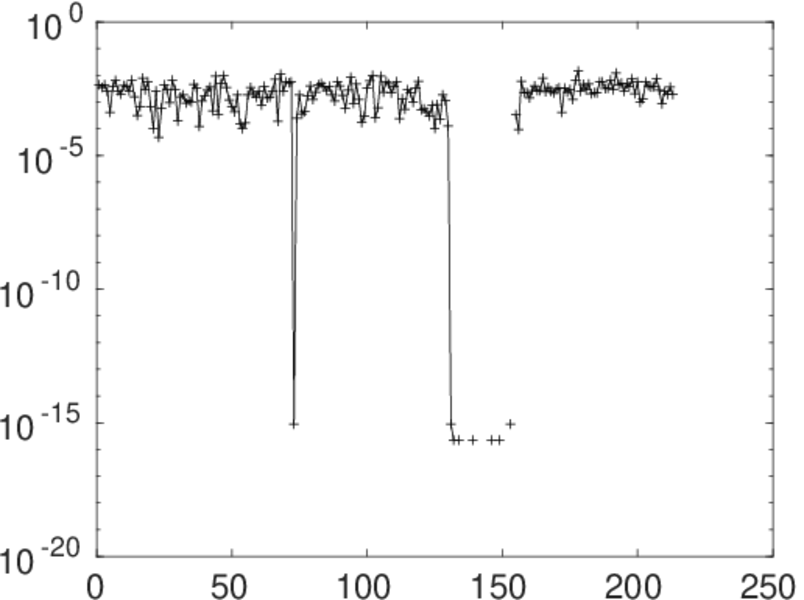
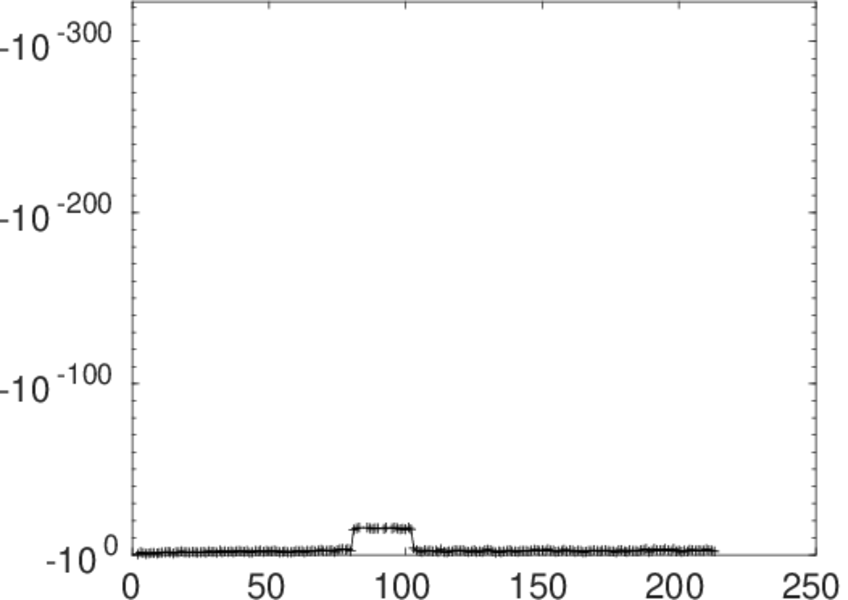
Matrix decompositions plots


Downloads
References
|
[1]
|
Jérôme Kunegis.
KONECT – The Koblenz Network Collection.
In Proc. Int. Conf. on World Wide Web Companion, pages
1343–1350, 2013.
[ http ]
|
|
[2]
|
Wikimedia Foundation.
Wikimedia downloads.
http://dumps.wikimedia.org/, January 2010.
|
 KONECT ‣ Networks ‣
Buy Me a Coffee
KONECT ‣ Networks ‣
Buy Me a Coffee