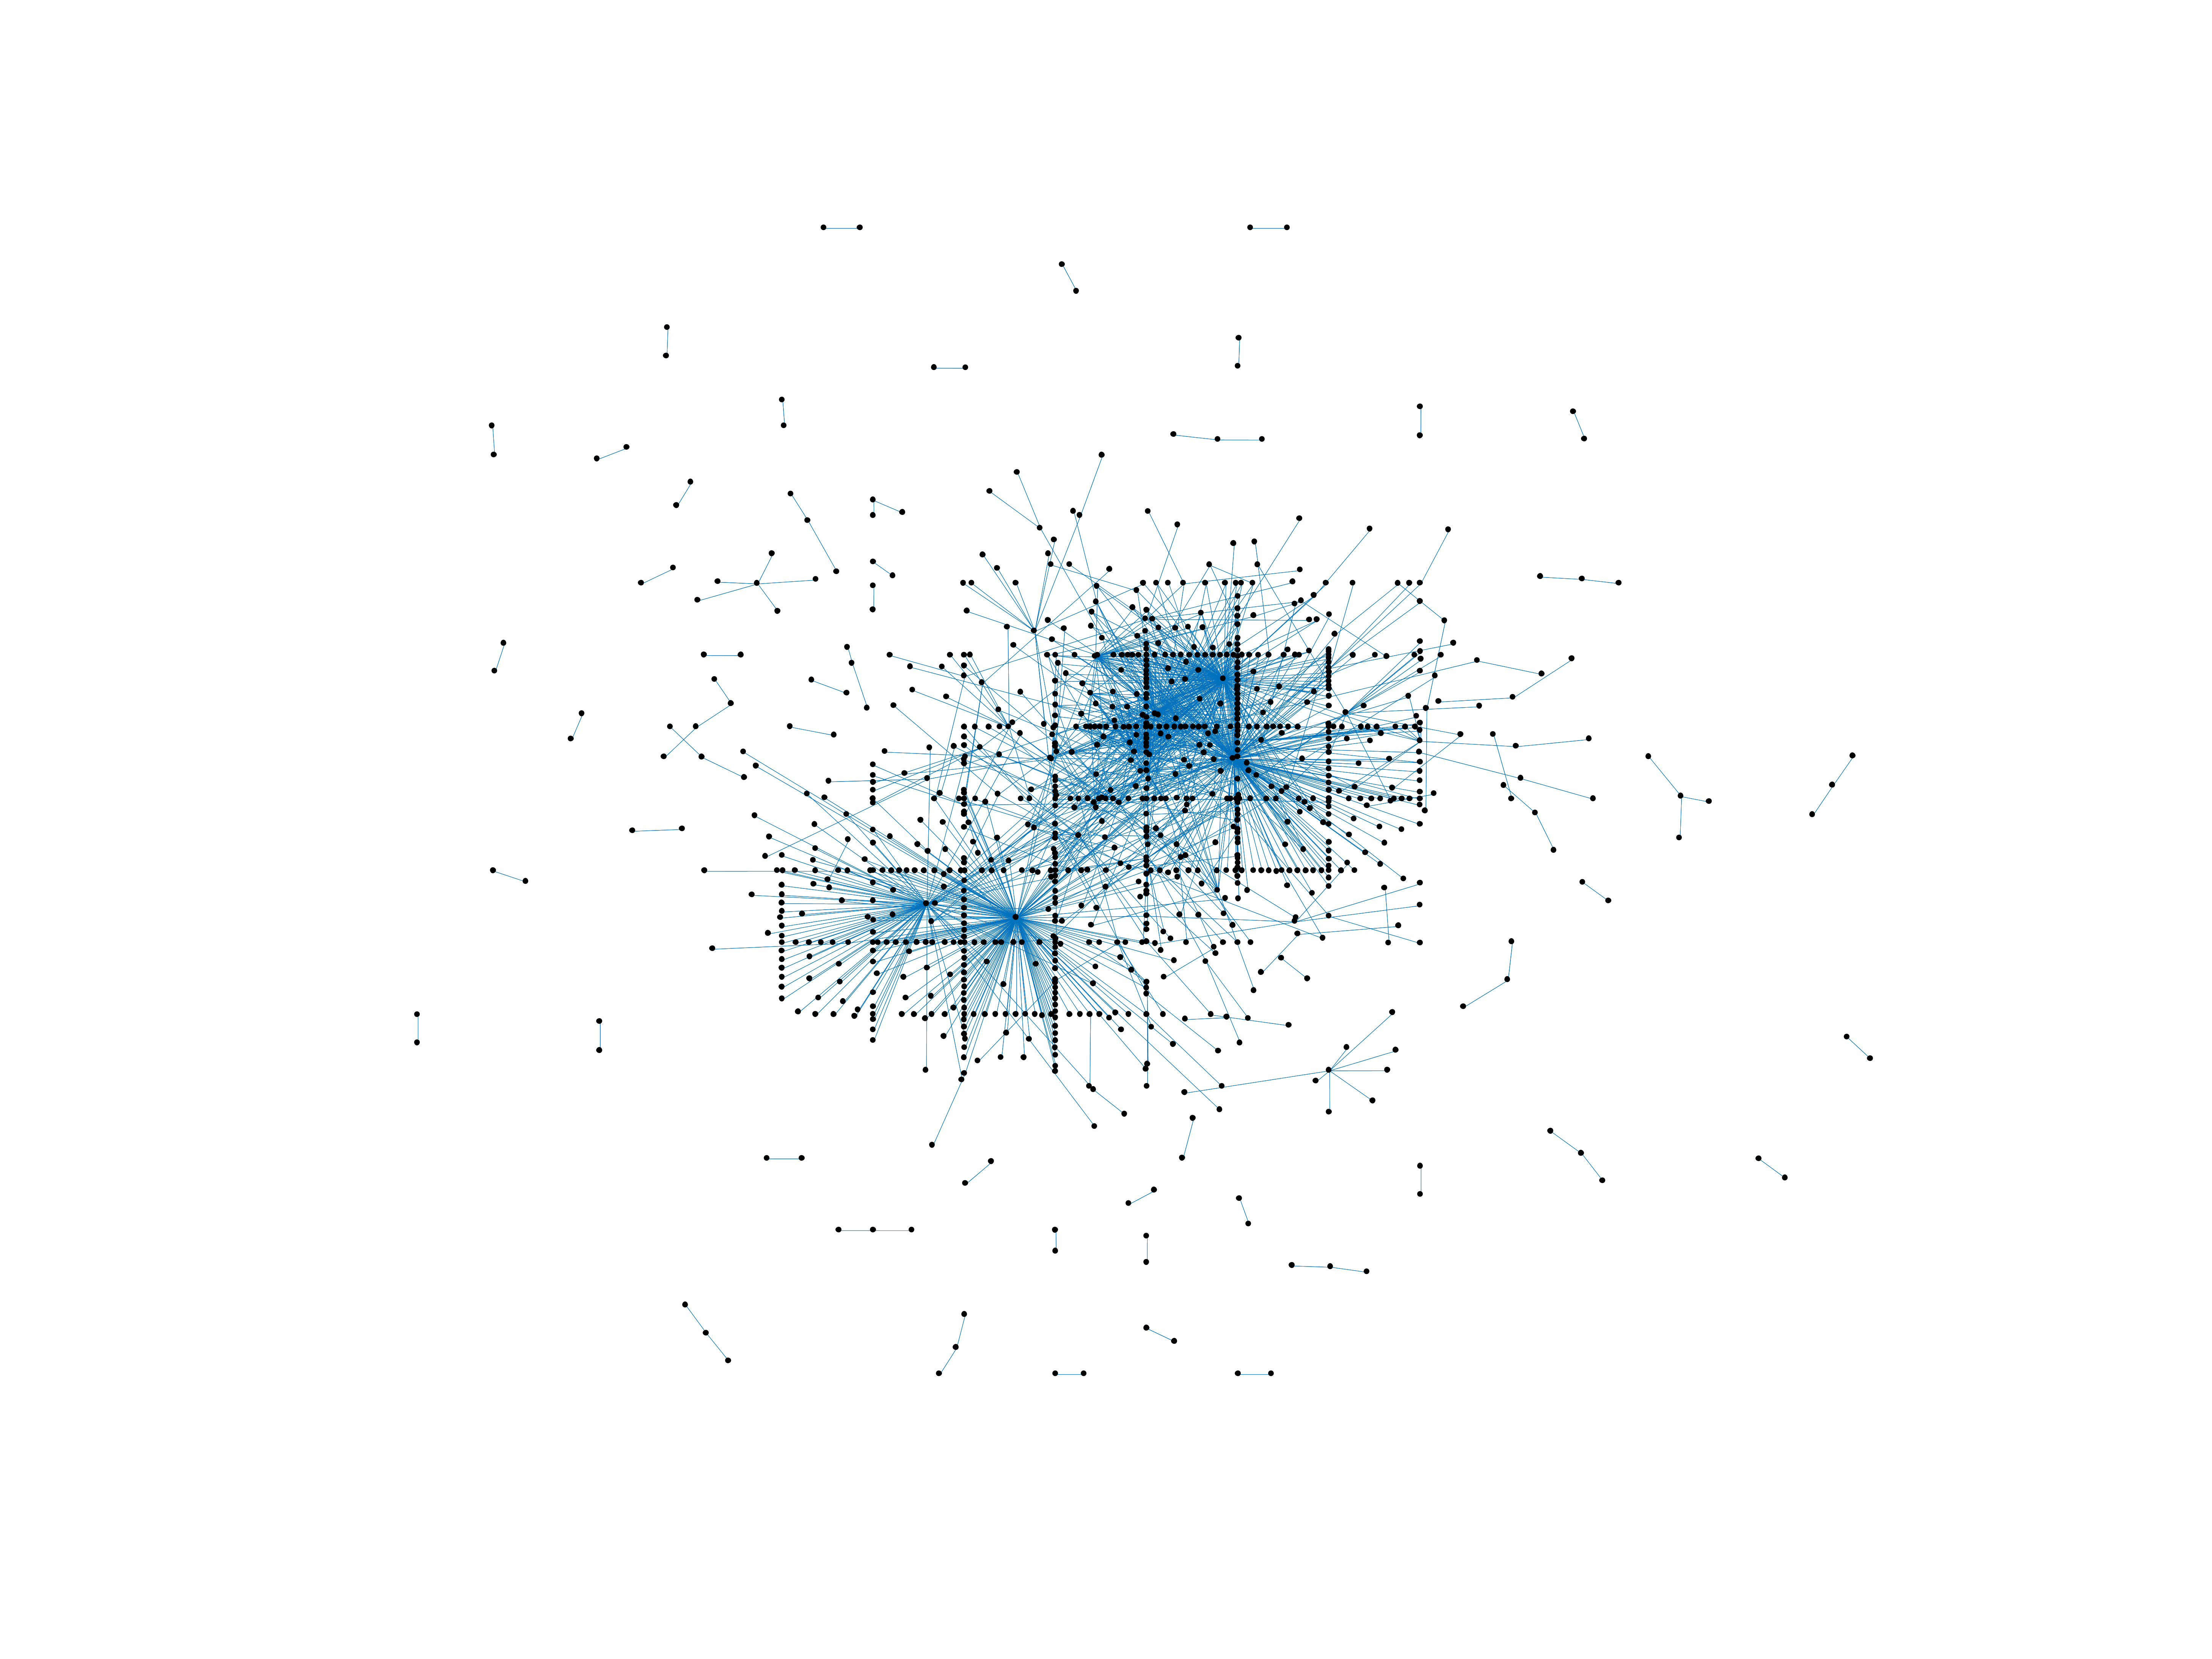
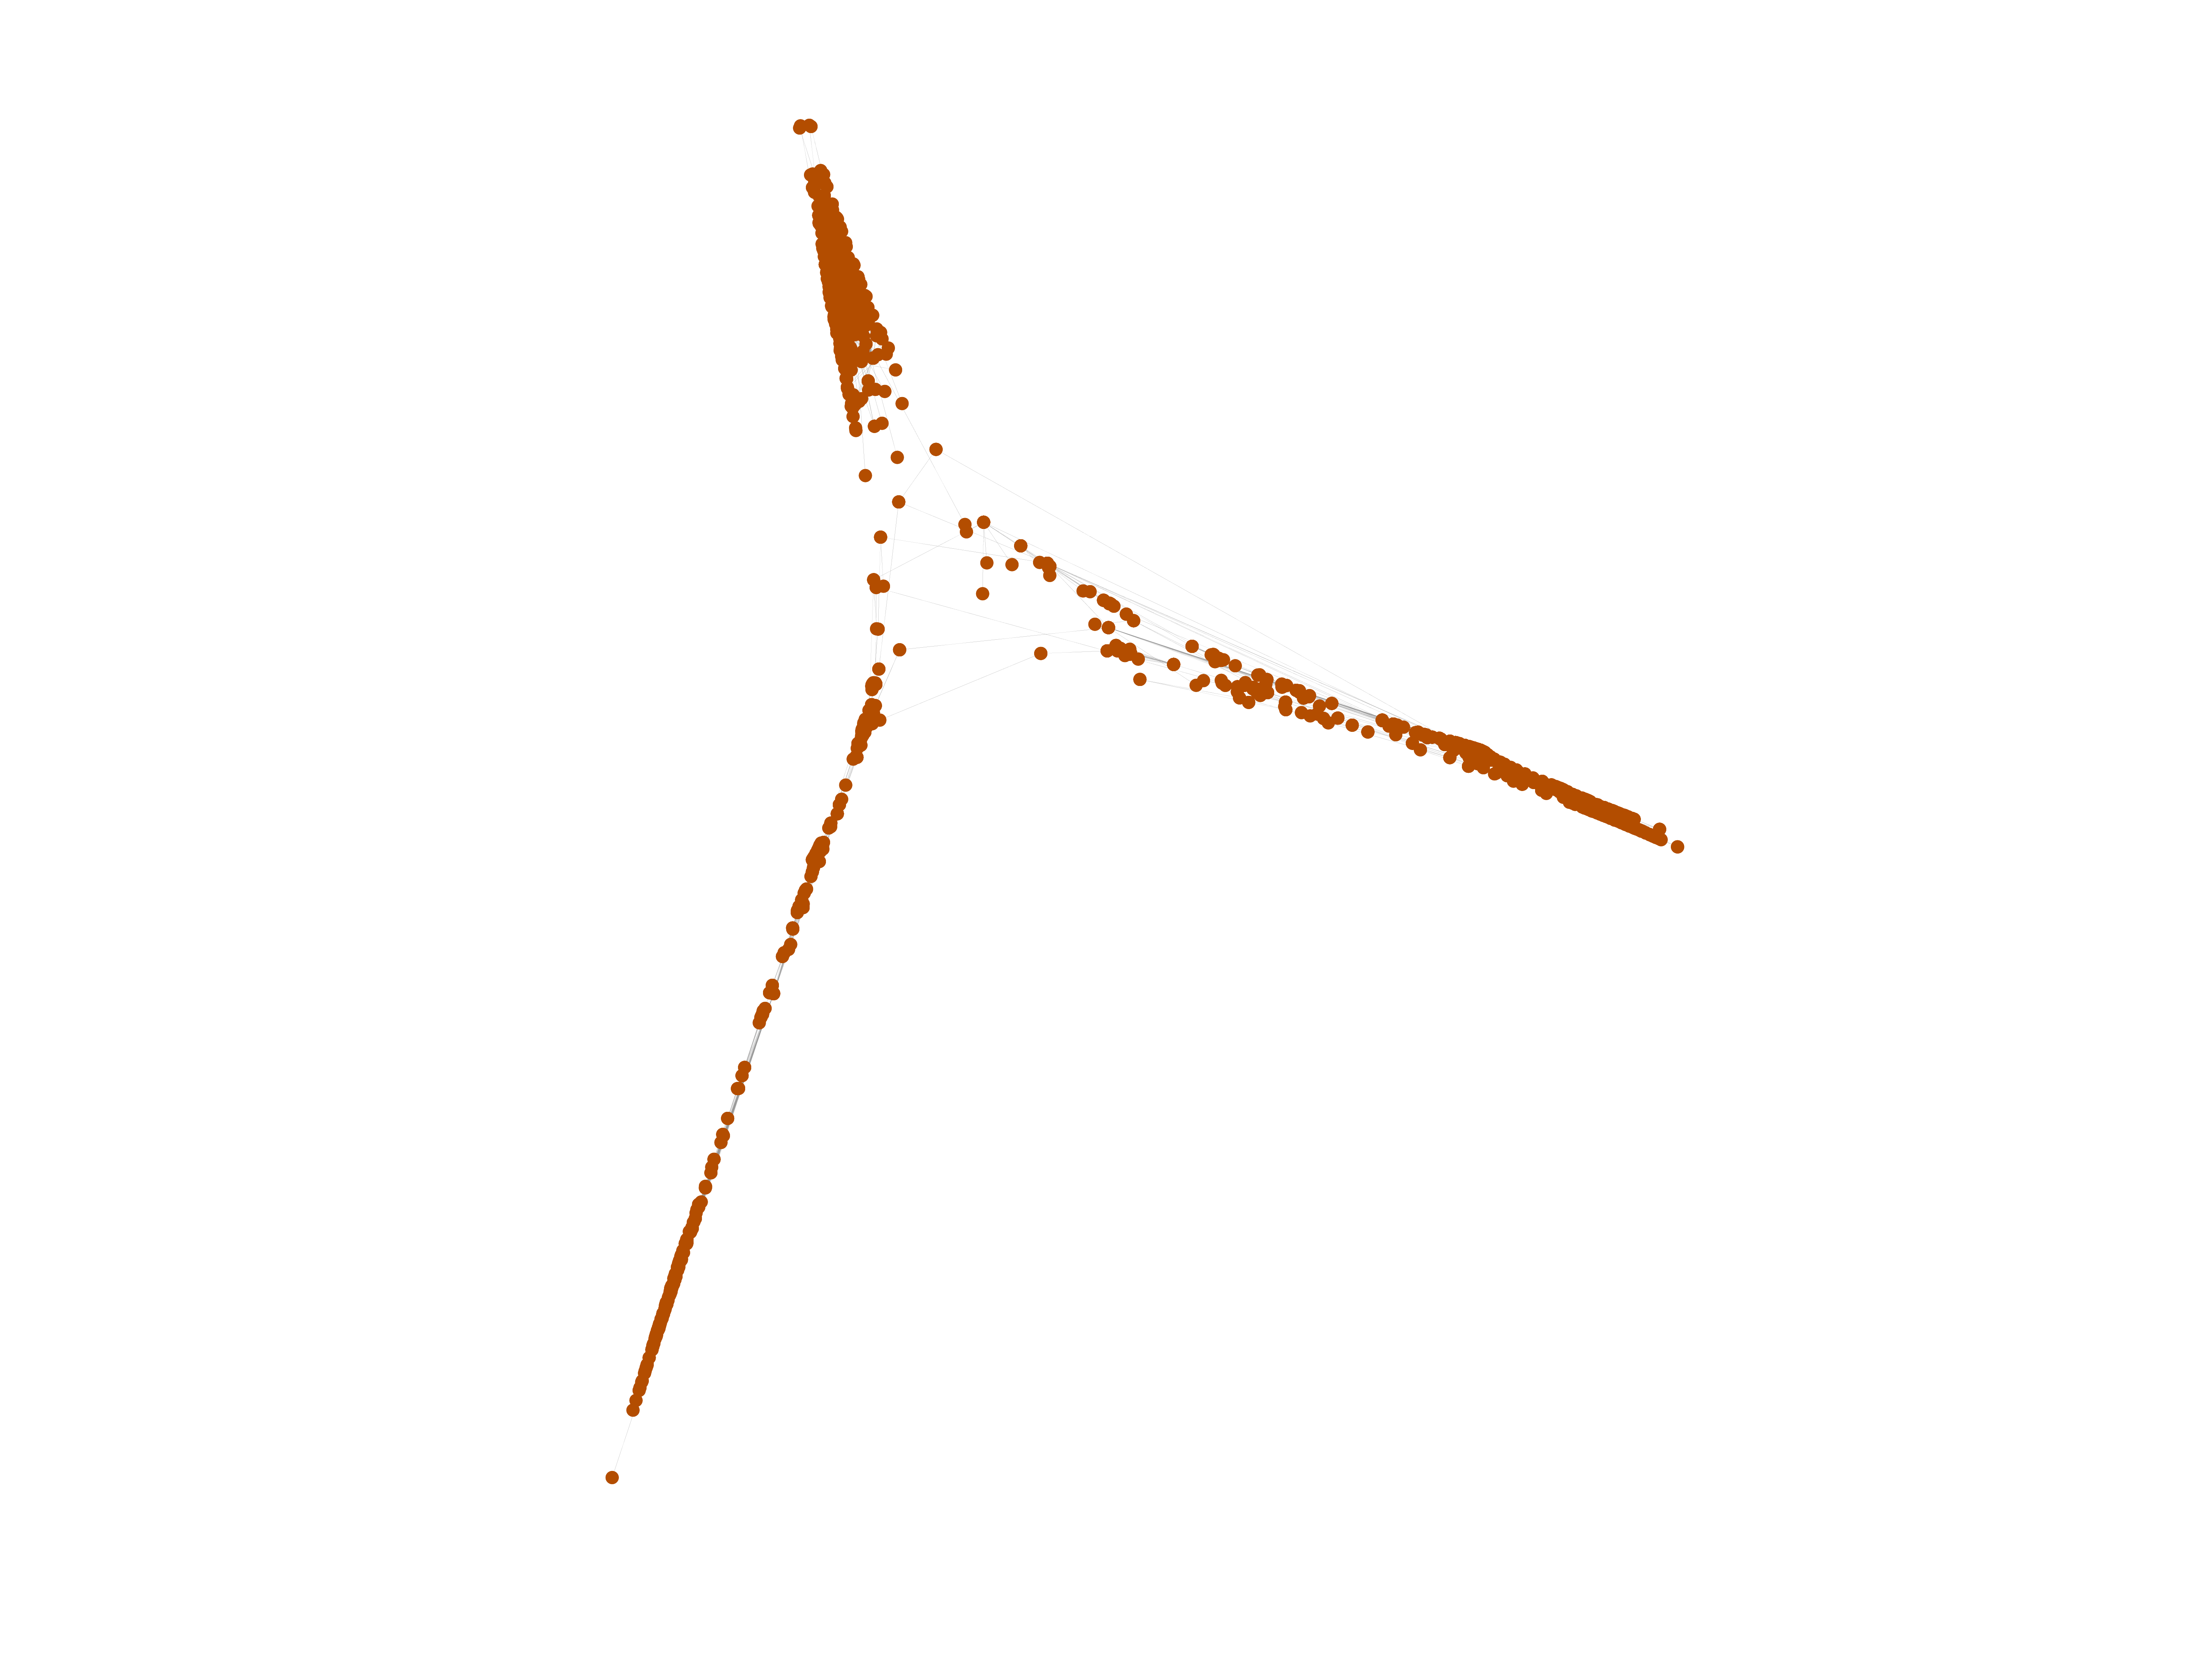
Wiktionary edits (ha)
This is the bipartite edit network of the Hausa Wiktionary. It contains users
and pages from the Hausa Wiktionary, connected by edit events. Each edge
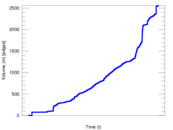
represents an edit. The dataset includes the timestamp of each edit.
Metadata
Statistics
| Size | n = | 1,017
|
| Left size | n1 = | 187
|
| Right size | n2 = | 830
|
| Volume | m = | 2,563
|
| Unique edge count | m̿ = | 1,523
|
| Wedge count | s = | 71,036
|
| Claw count | z = | 3,796,263
|
| Cross count | x = | 173,912,192
|
| Square count | q = | 24,447
|
| 4-Tour count | T4 = | 483,074
|
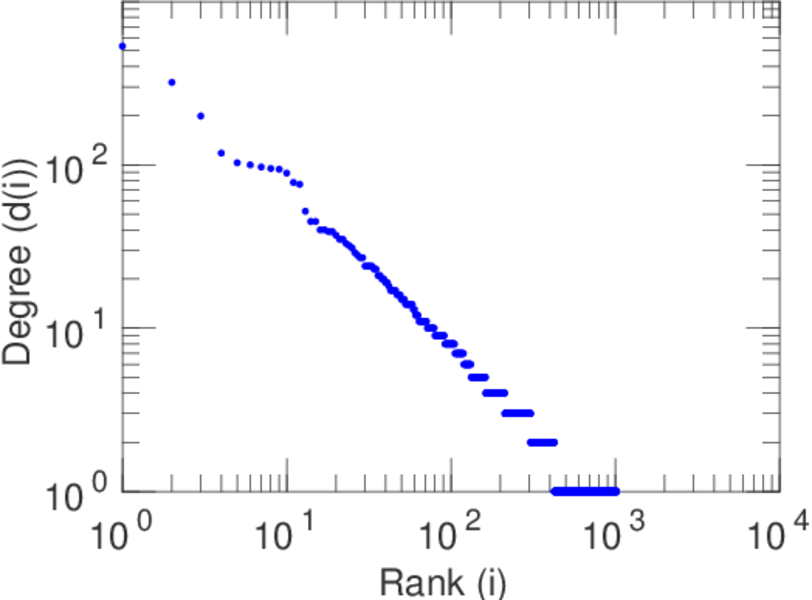
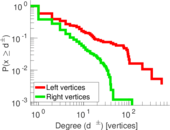
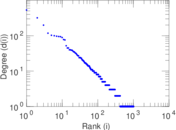
| Maximum degree | dmax = | 533
|
| Maximum left degree | d1max = | 533
|
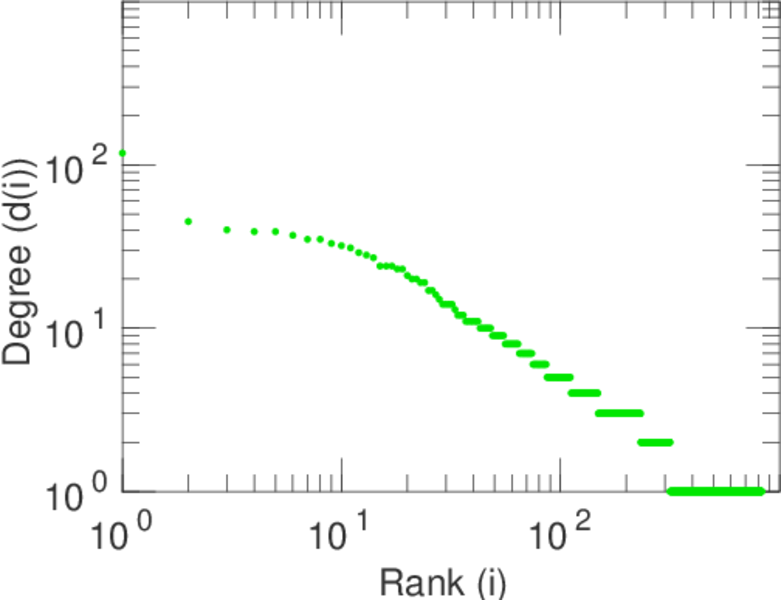
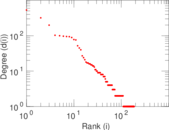
| Maximum right degree | d2max = | 118
|
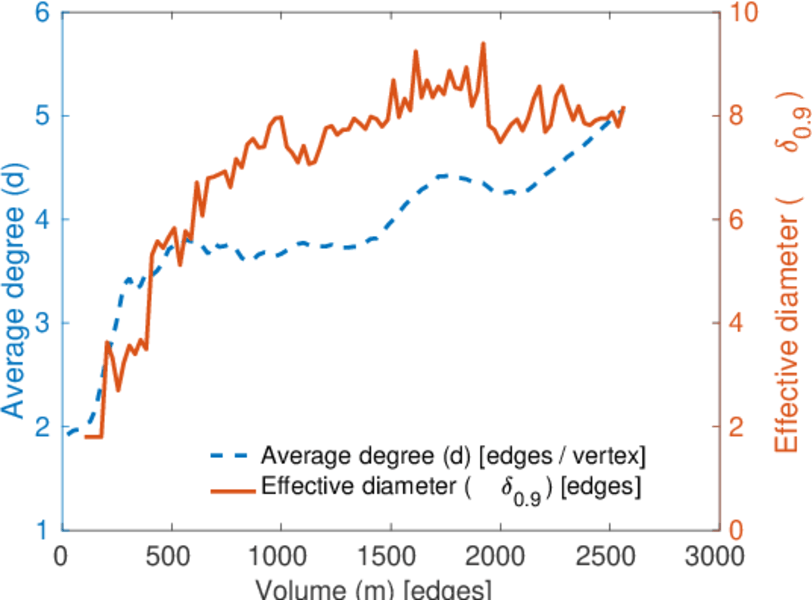
| Average degree | d = | 5.040 31
|
| Average left degree | d1 = | 13.705 9
|
| Average right degree | d2 = | 3.087 95
|
| Fill | p = | 0.009 812 51
|
| Average edge multiplicity | m̃ = | 1.682 86
|
| Size of LCC | N = | 743
|
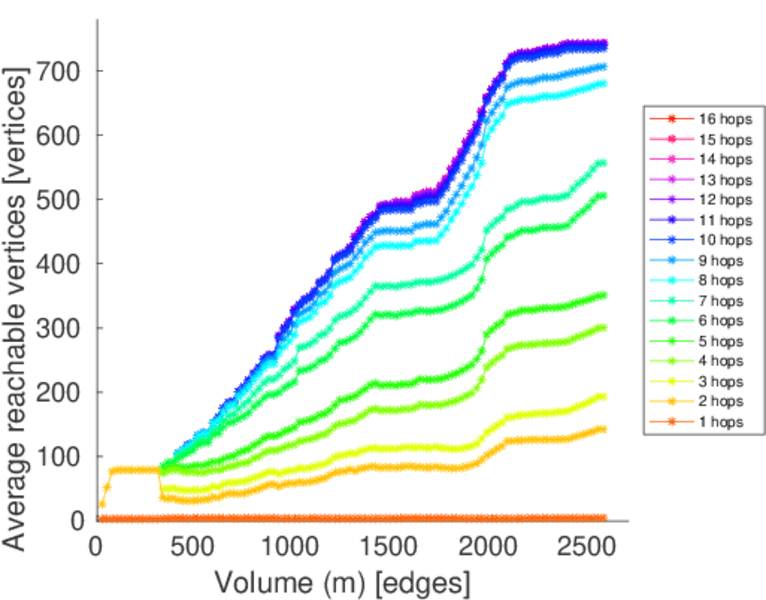
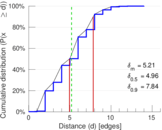
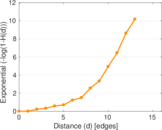
| Diameter | δ = | 15
|
| 50-Percentile effective diameter | δ0.5 = | 4.957 04
|
| 90-Percentile effective diameter | δ0.9 = | 7.843 88
|
| Median distance | δM = | 5
|
| Mean distance | δm = | 5.210 32
|
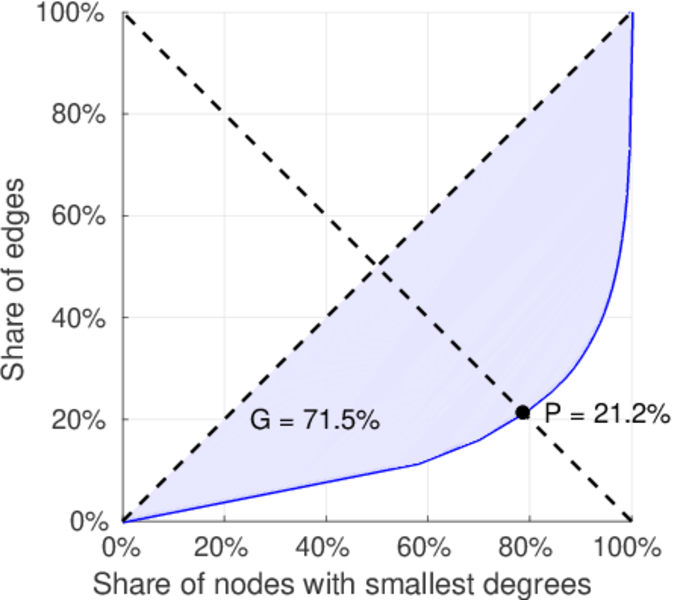
| Gini coefficient | G = | 0.724 638
|
| Balanced inequality ratio | P = | 0.210 496
|
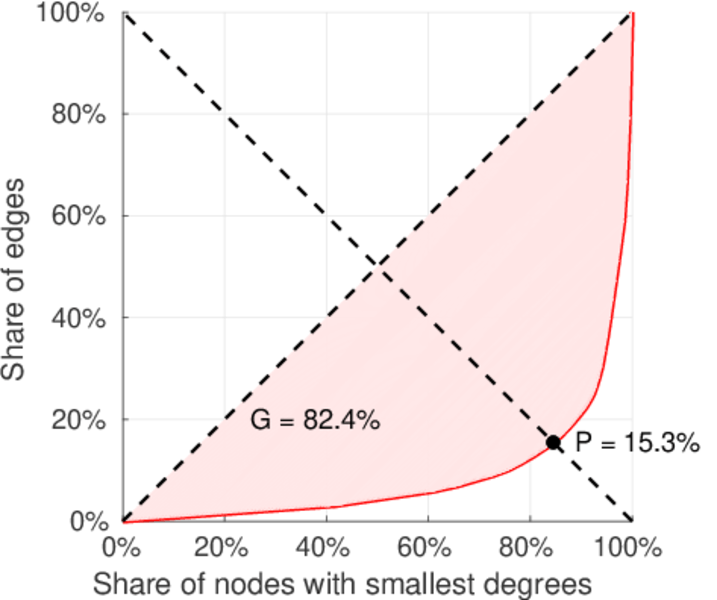
| Left balanced inequality ratio | P1 = | 0.153 336
|
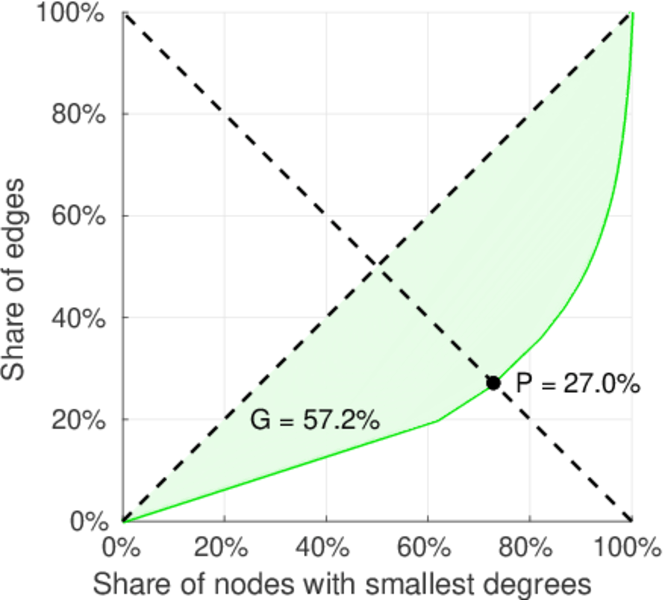
| Right balanced inequality ratio | P2 = | 0.269 996
|
| Relative edge distribution entropy | Her = | 0.828 206
|
| Power law exponent | γ = | 3.207 42
|
| Tail power law exponent | γt = | 2.151 00
|
| Tail power law exponent with p | γ3 = | 2.151 00
|
| p-value | p = | 0.000 00
|
| Left tail power law exponent with p | γ3,1 = | 1.751 00
|
| Left p-value | p1 = | 0.762 000
|
| Right tail power law exponent with p | γ3,2 = | 2.321 00
|
| Right p-value | p2 = | 0.000 00
|
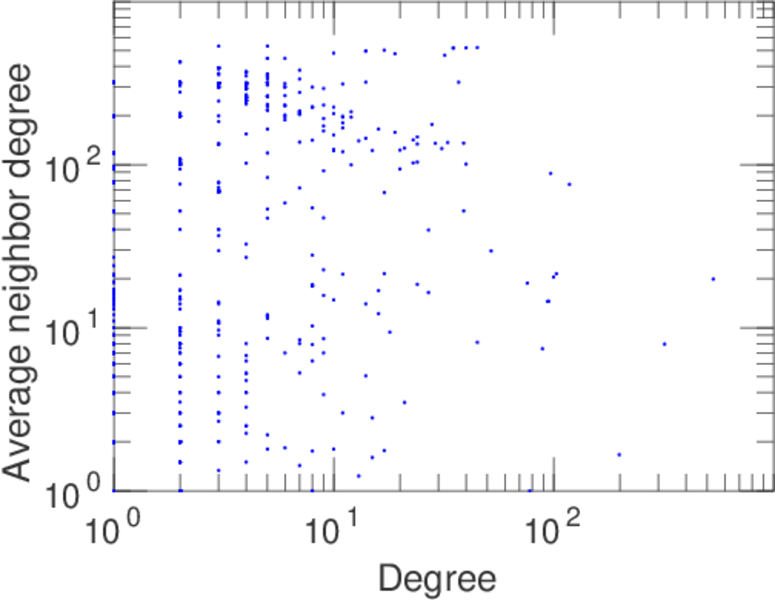
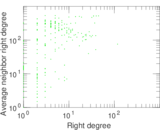
| Degree assortativity | ρ = | −0.225 561
|
| Degree assortativity p-value | pρ = | 5.080 00 × 10−19
|
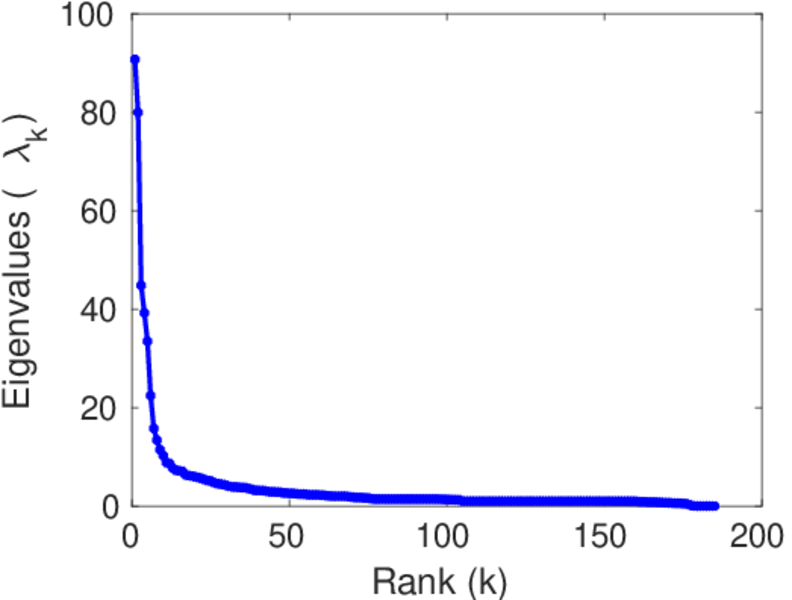
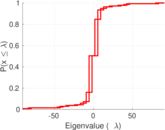
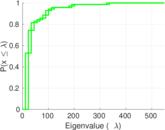
| Spectral norm | α = | 90.708 4
|
| Algebraic connectivity | a = | 0.010 206 7
|
| Spectral separation | |λ1[A] / λ2[A]| = | 1.134 55
|
| Controllability | C = | 659
|
| Relative controllability | Cr = | 0.649 261
|
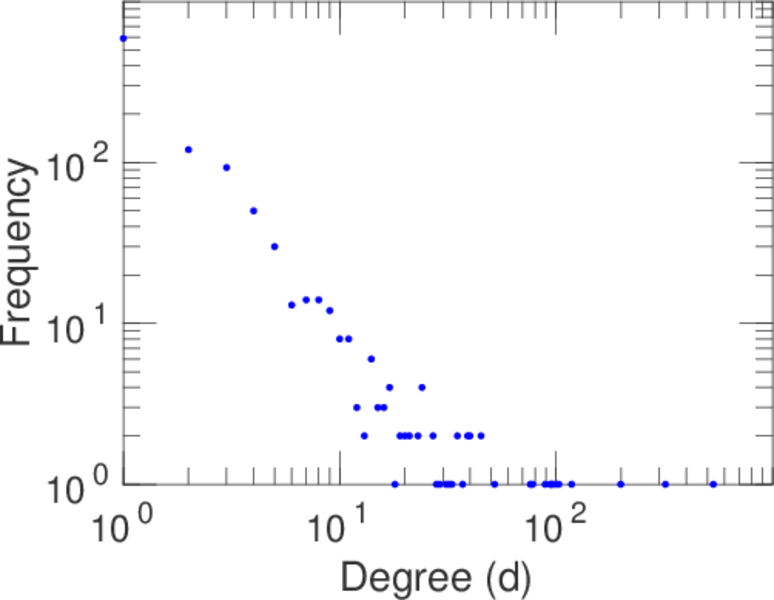
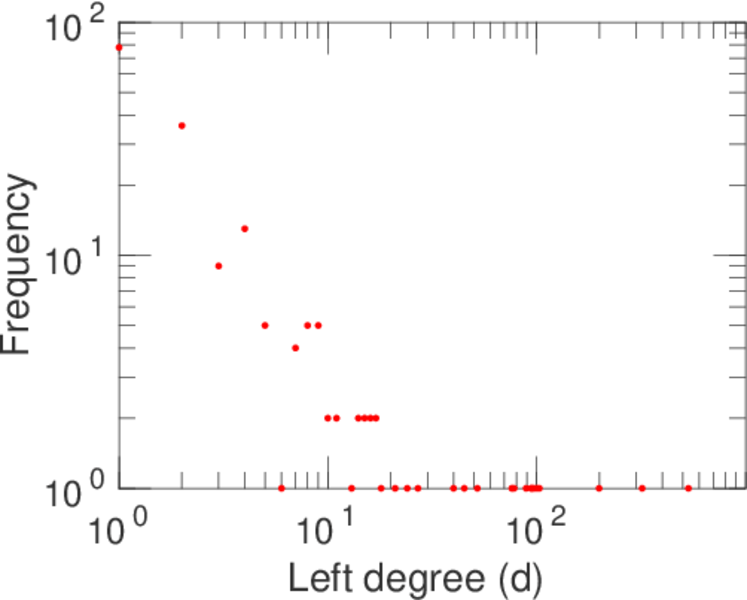
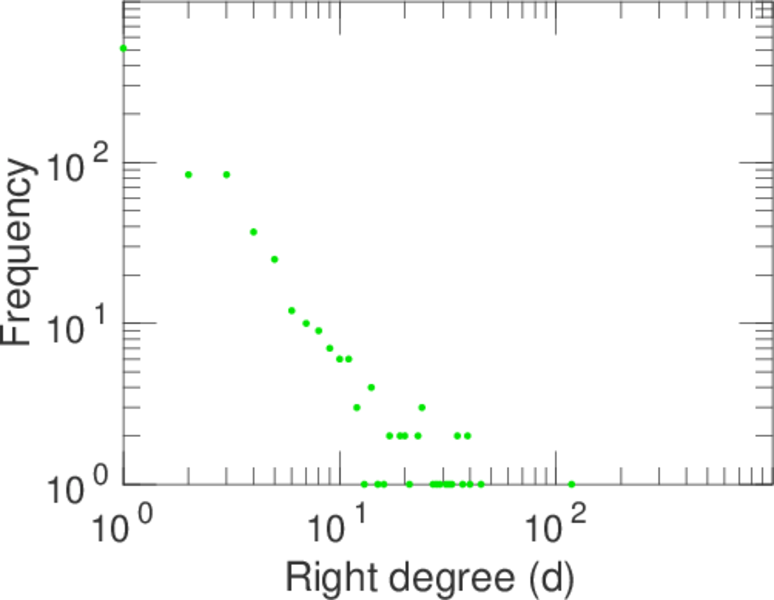
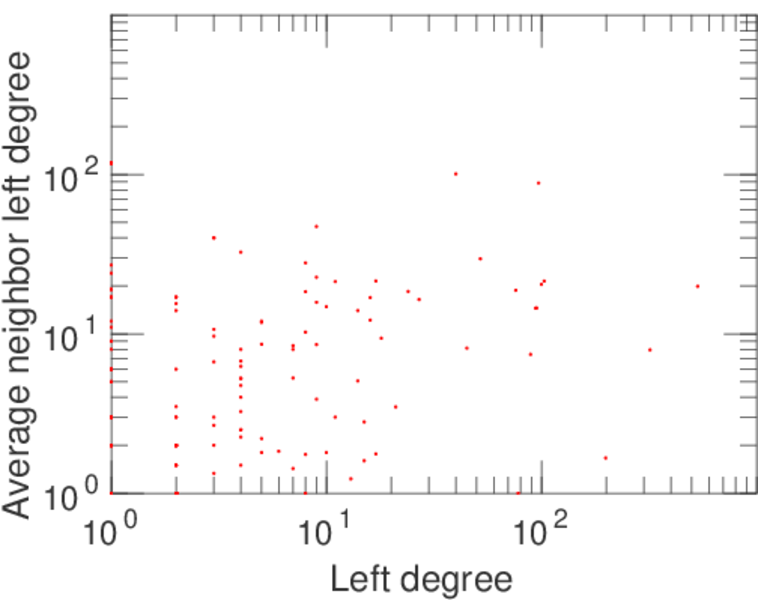
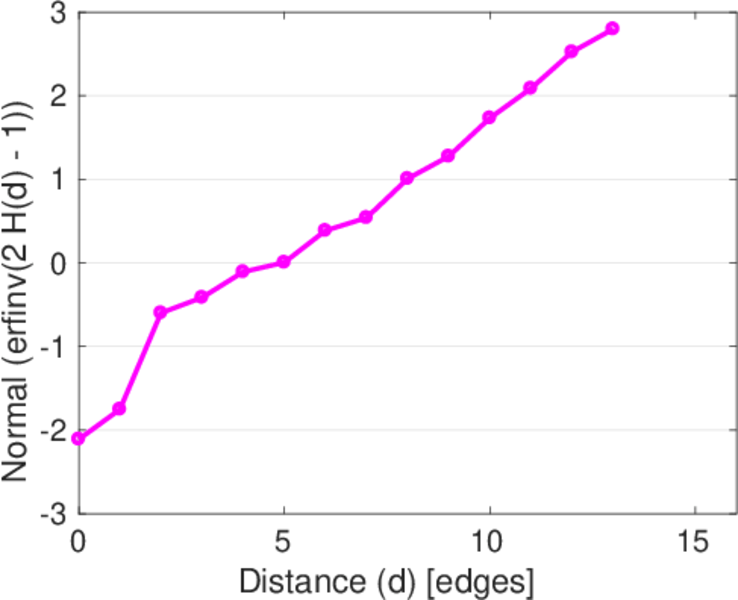
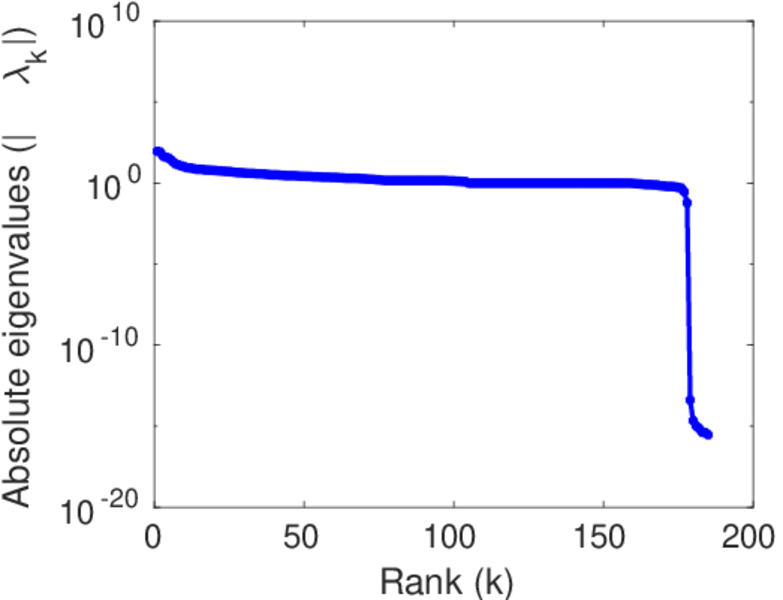
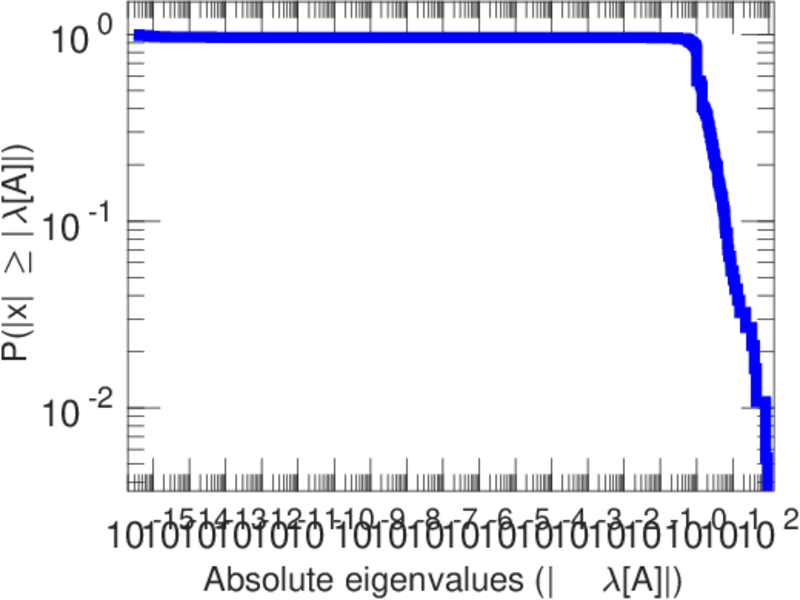
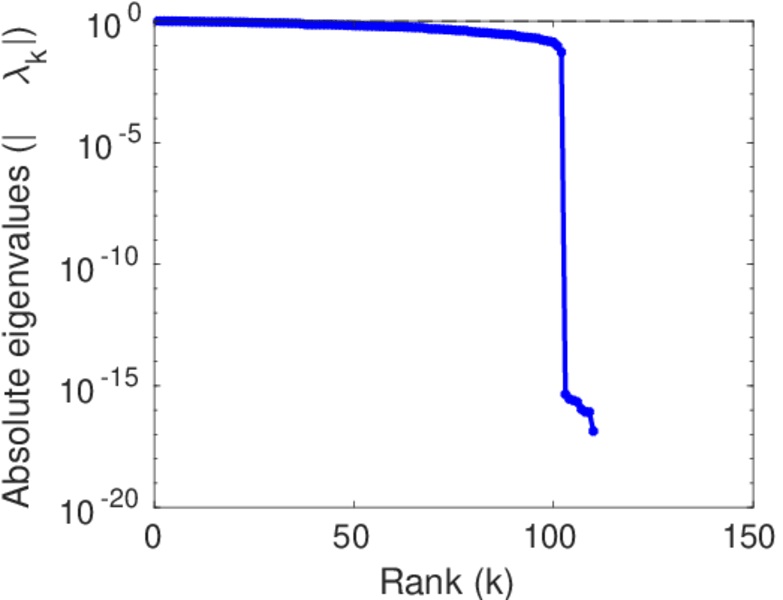
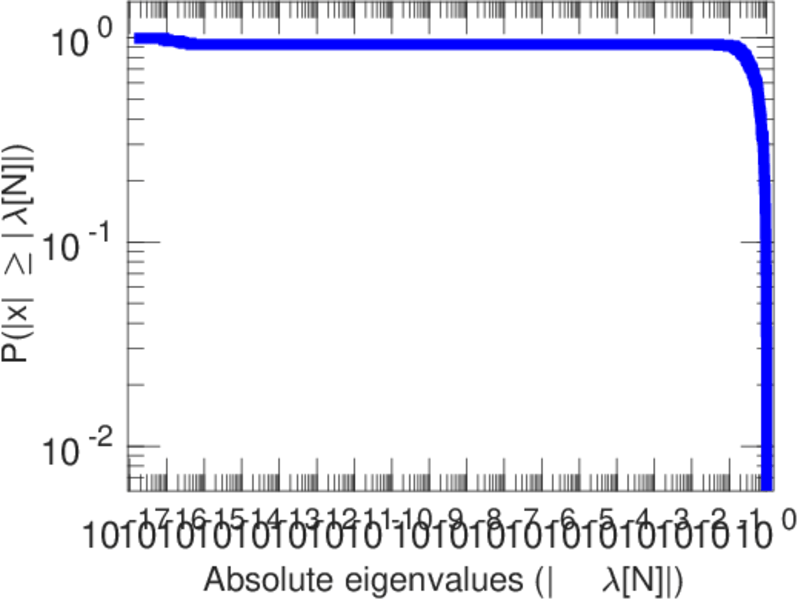
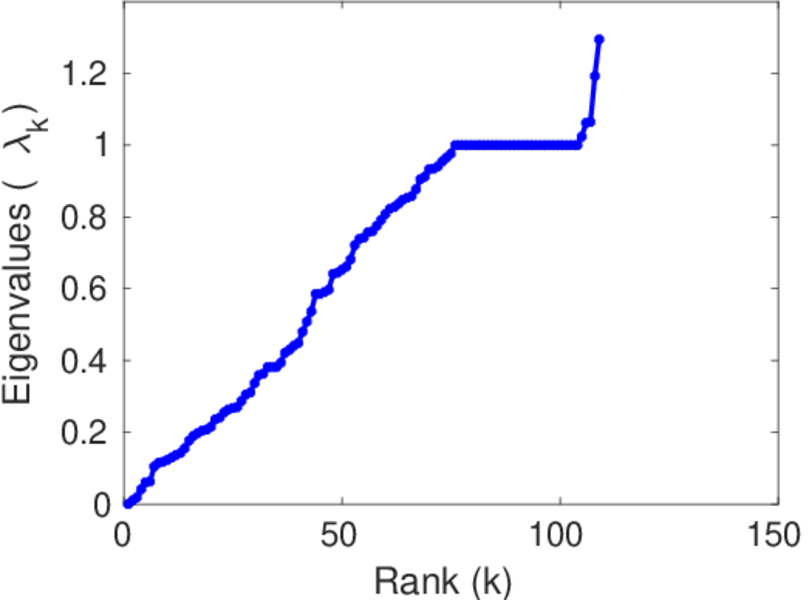
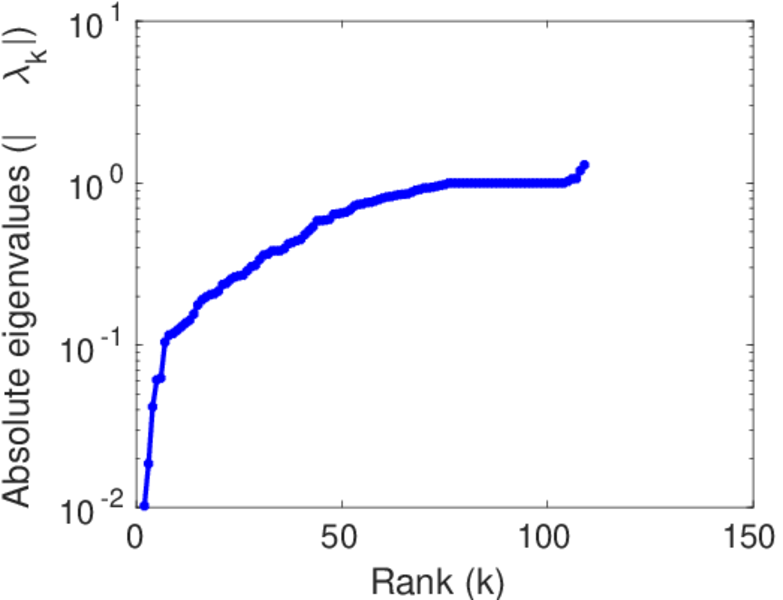
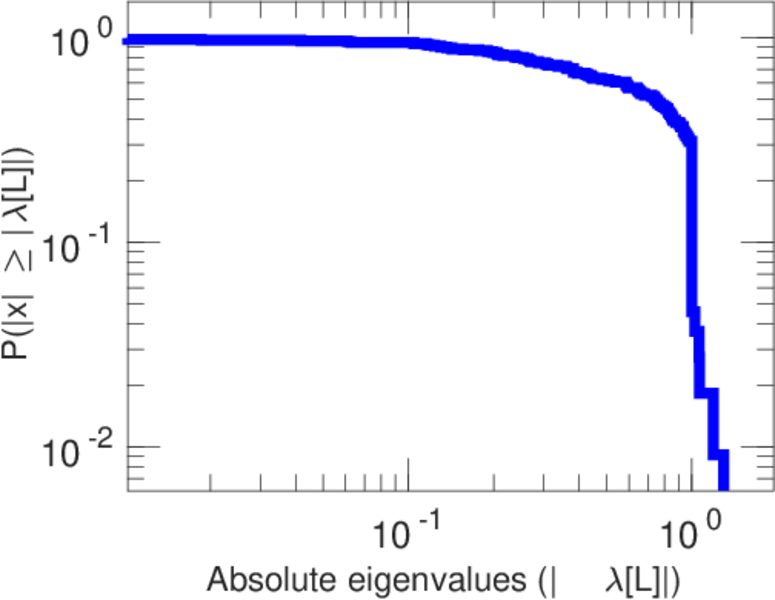
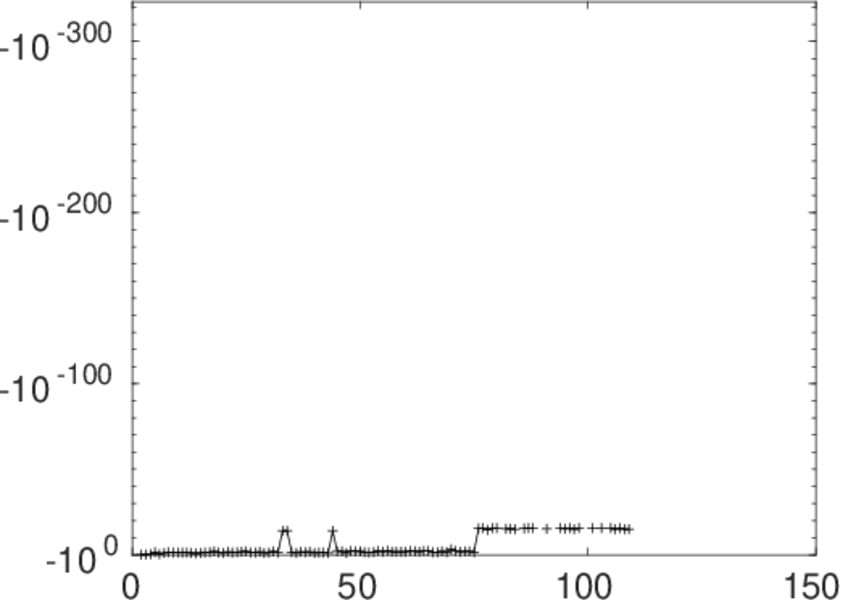
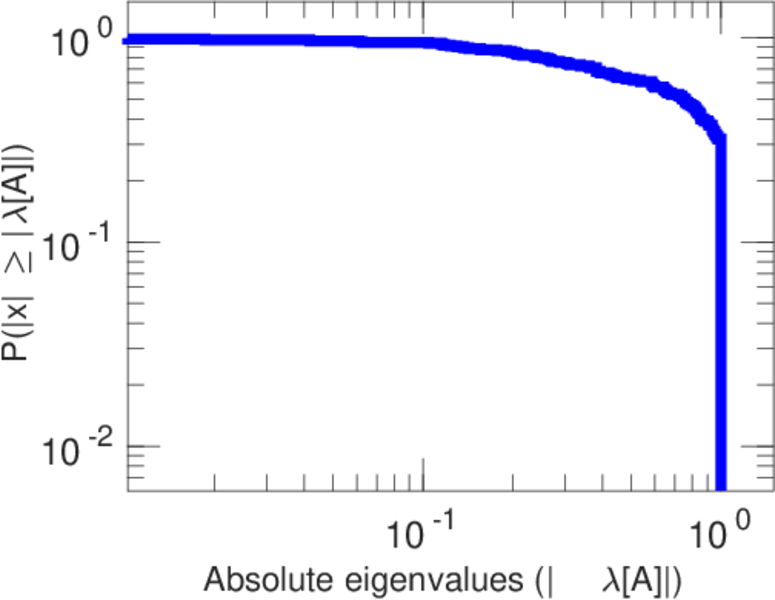
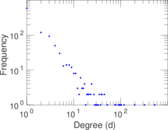
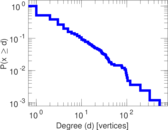
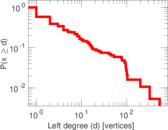
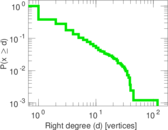
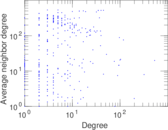
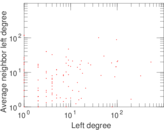
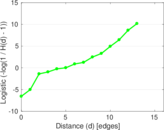
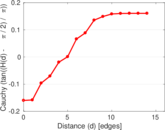
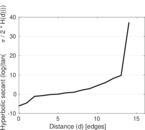
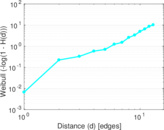
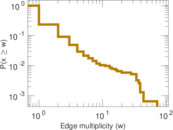
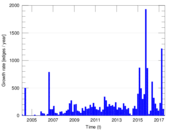
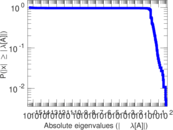
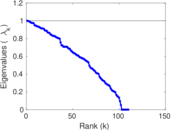
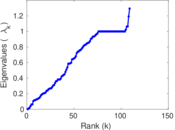
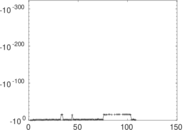
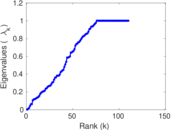
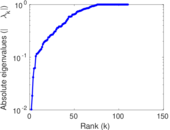
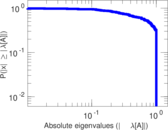
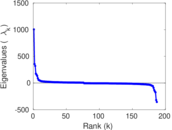
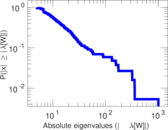
Plots


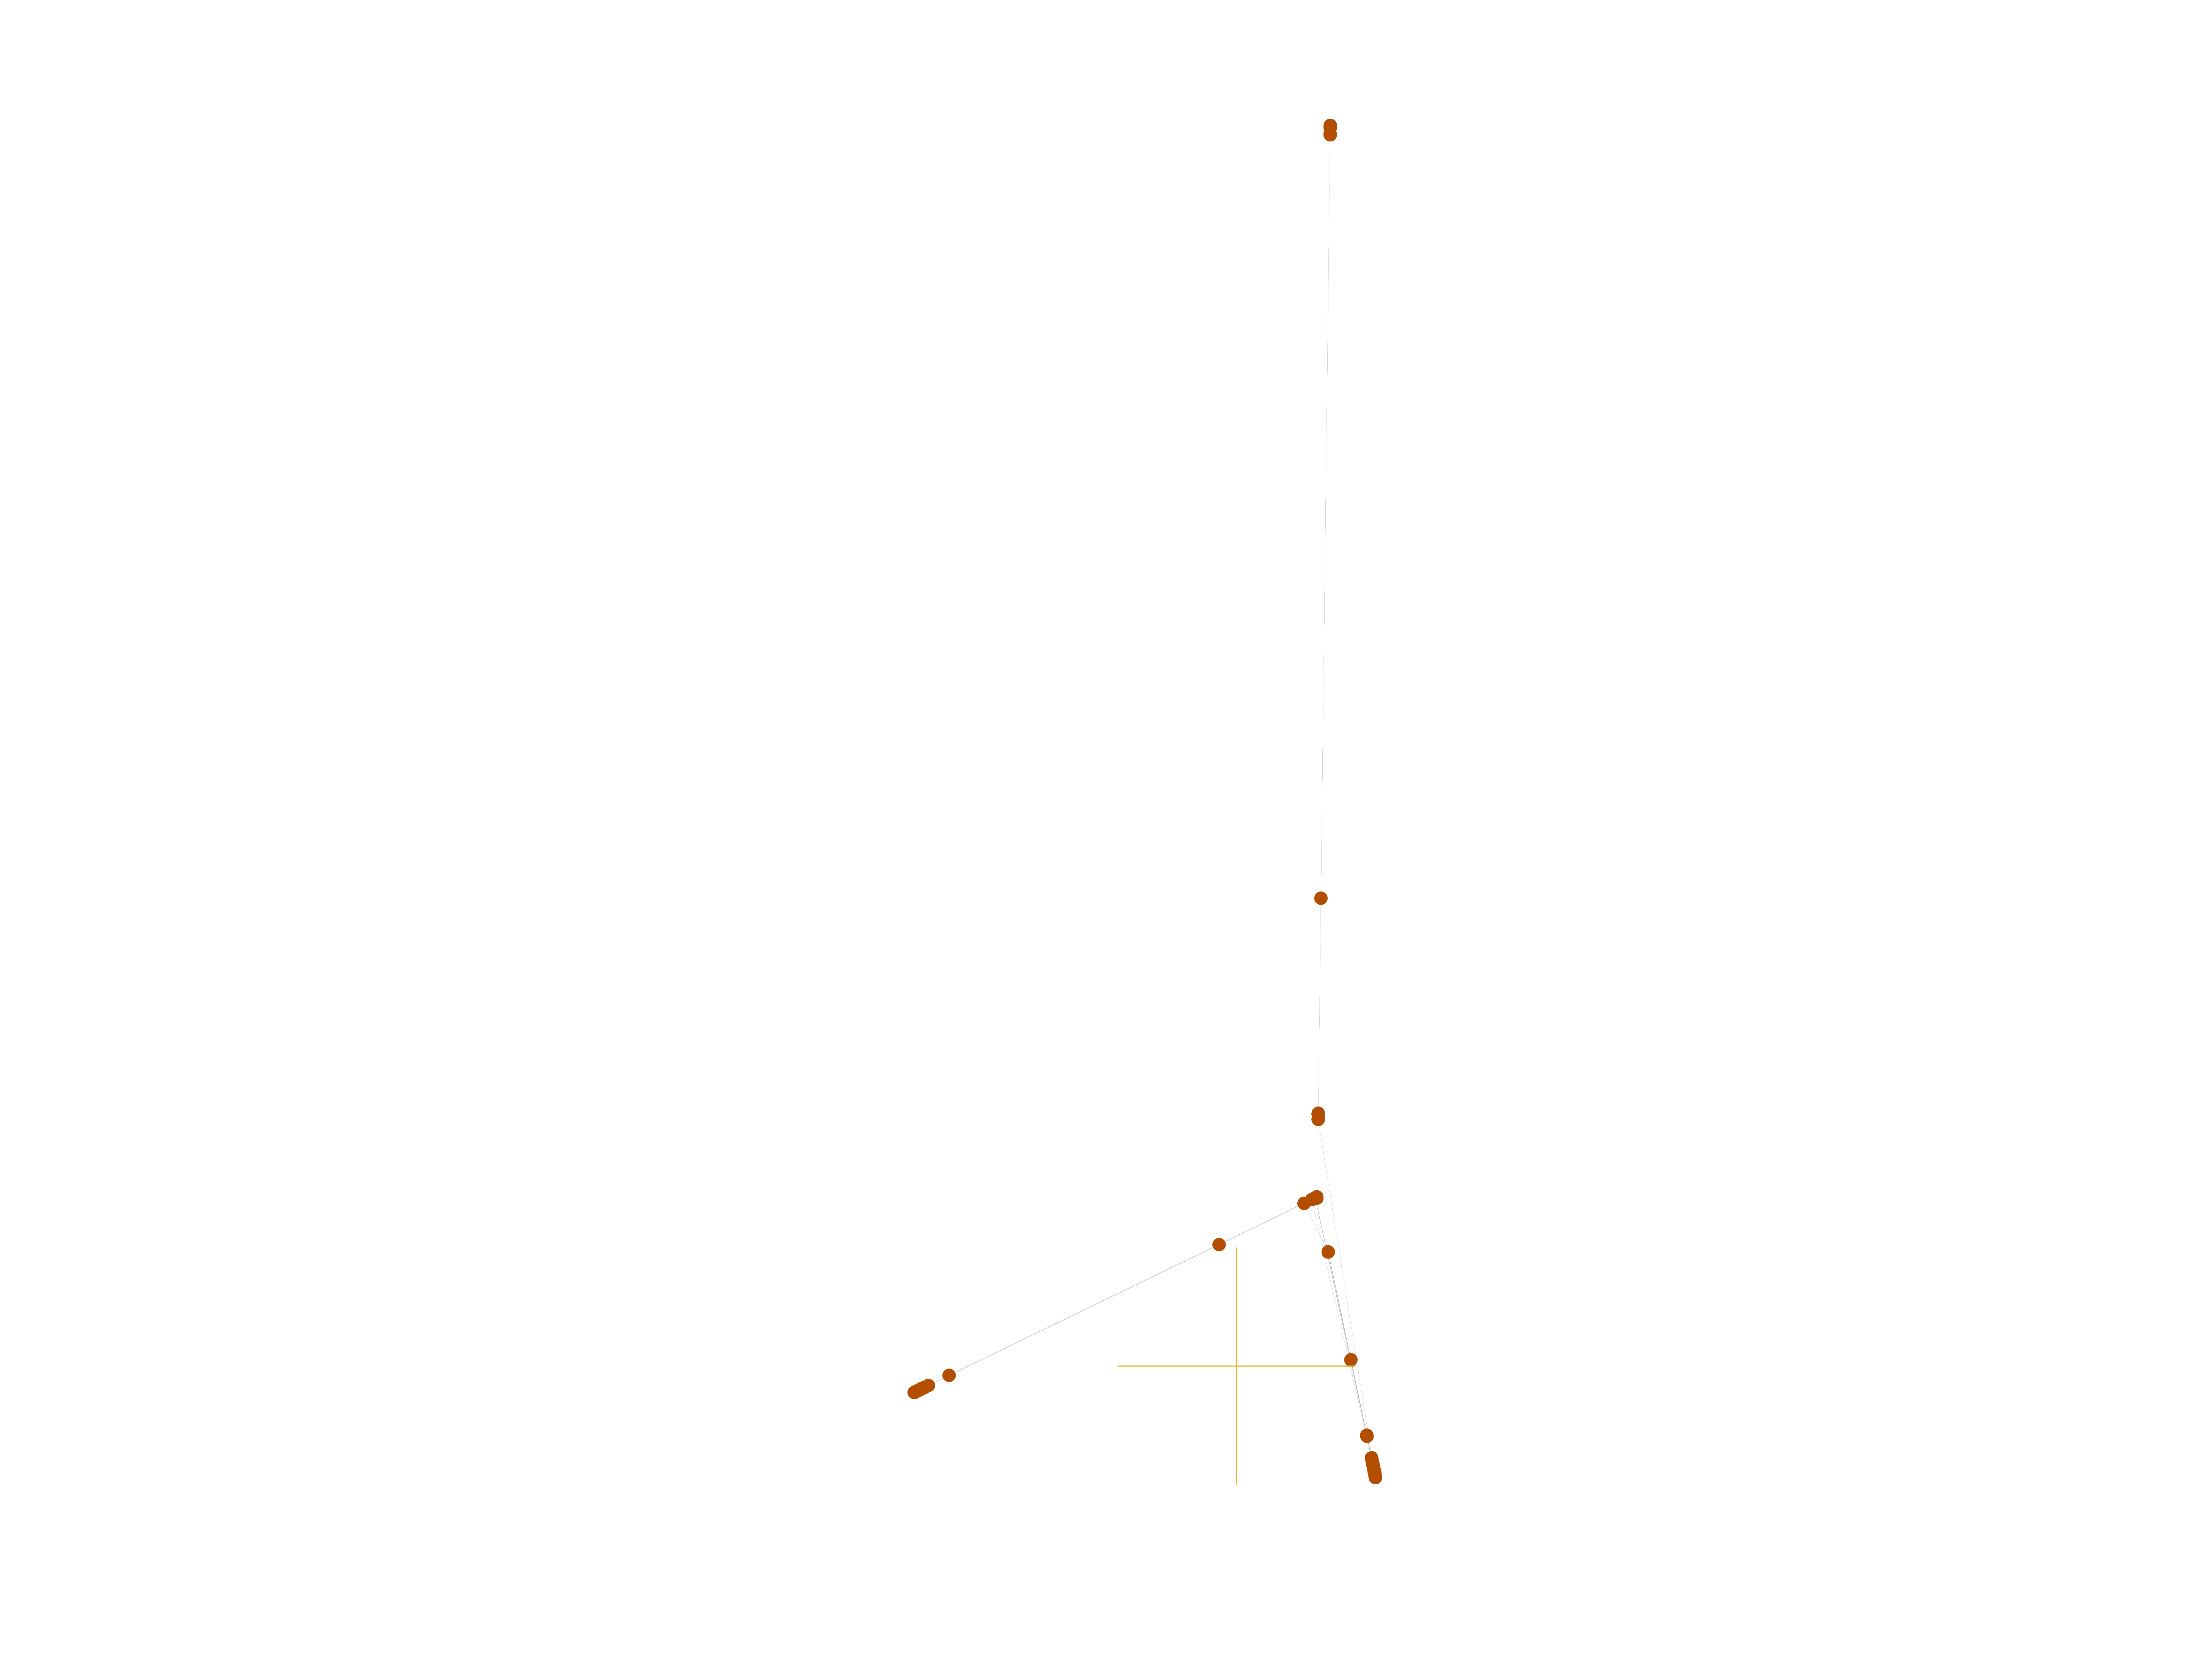
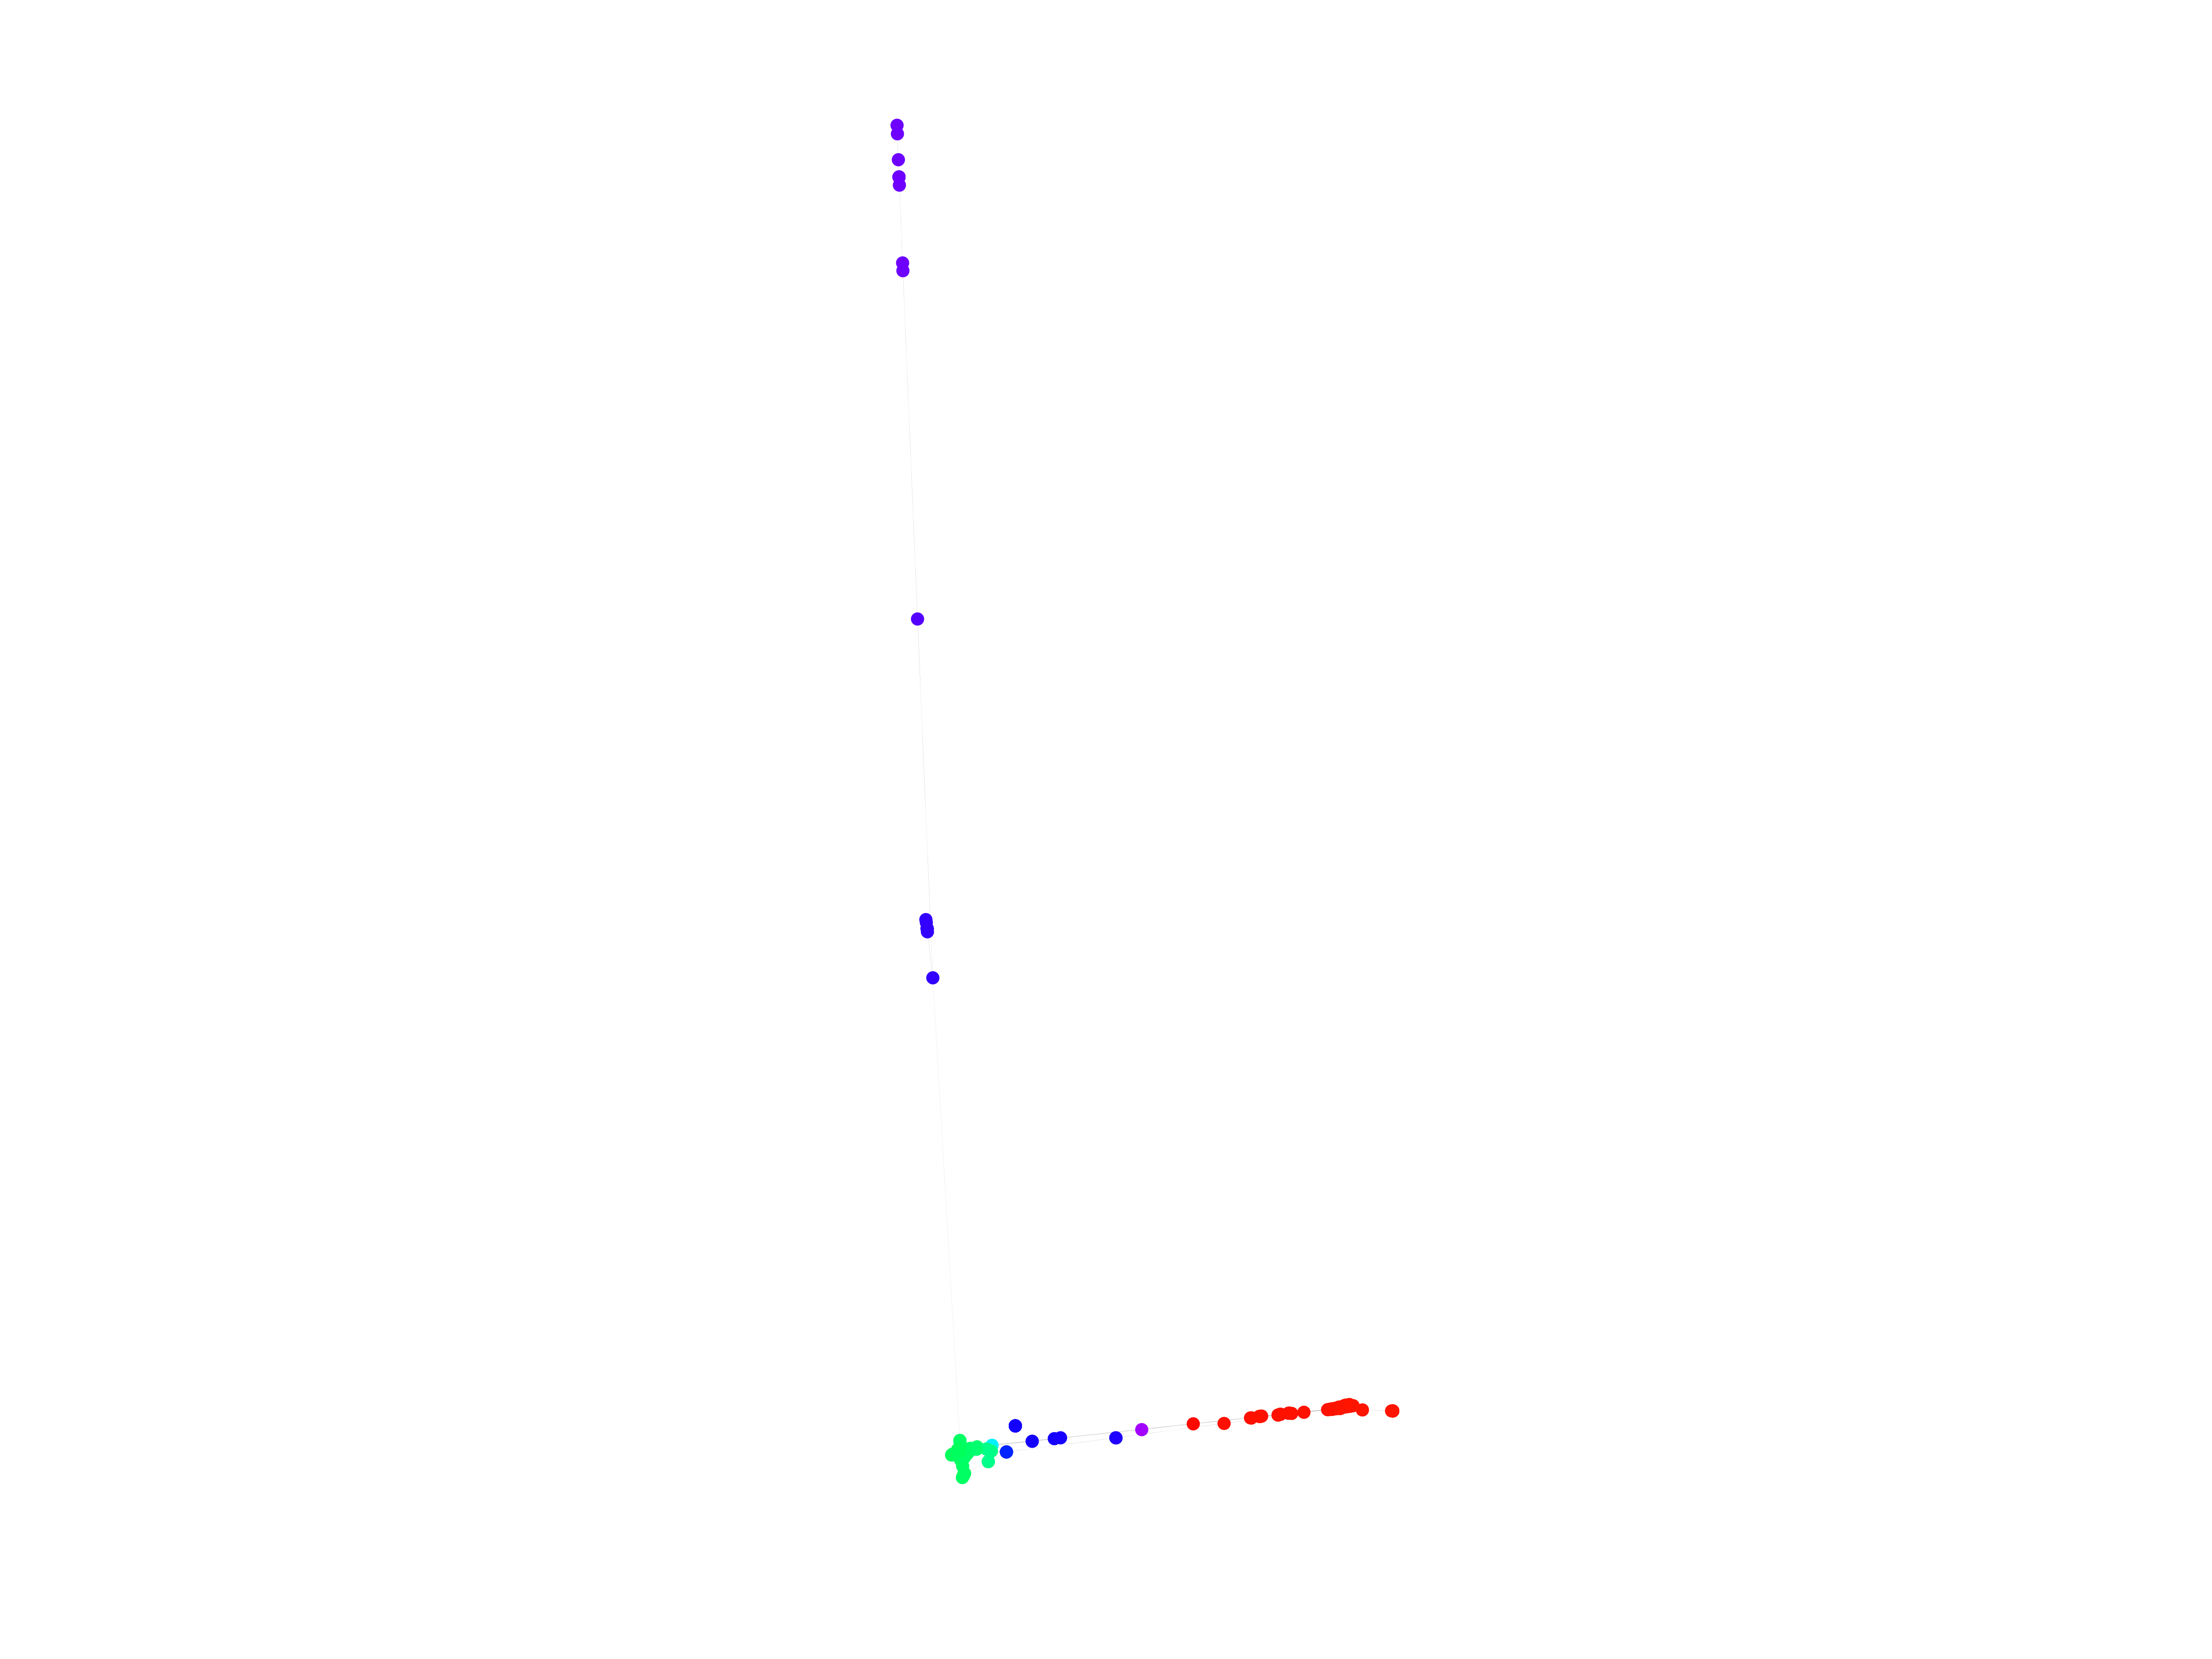
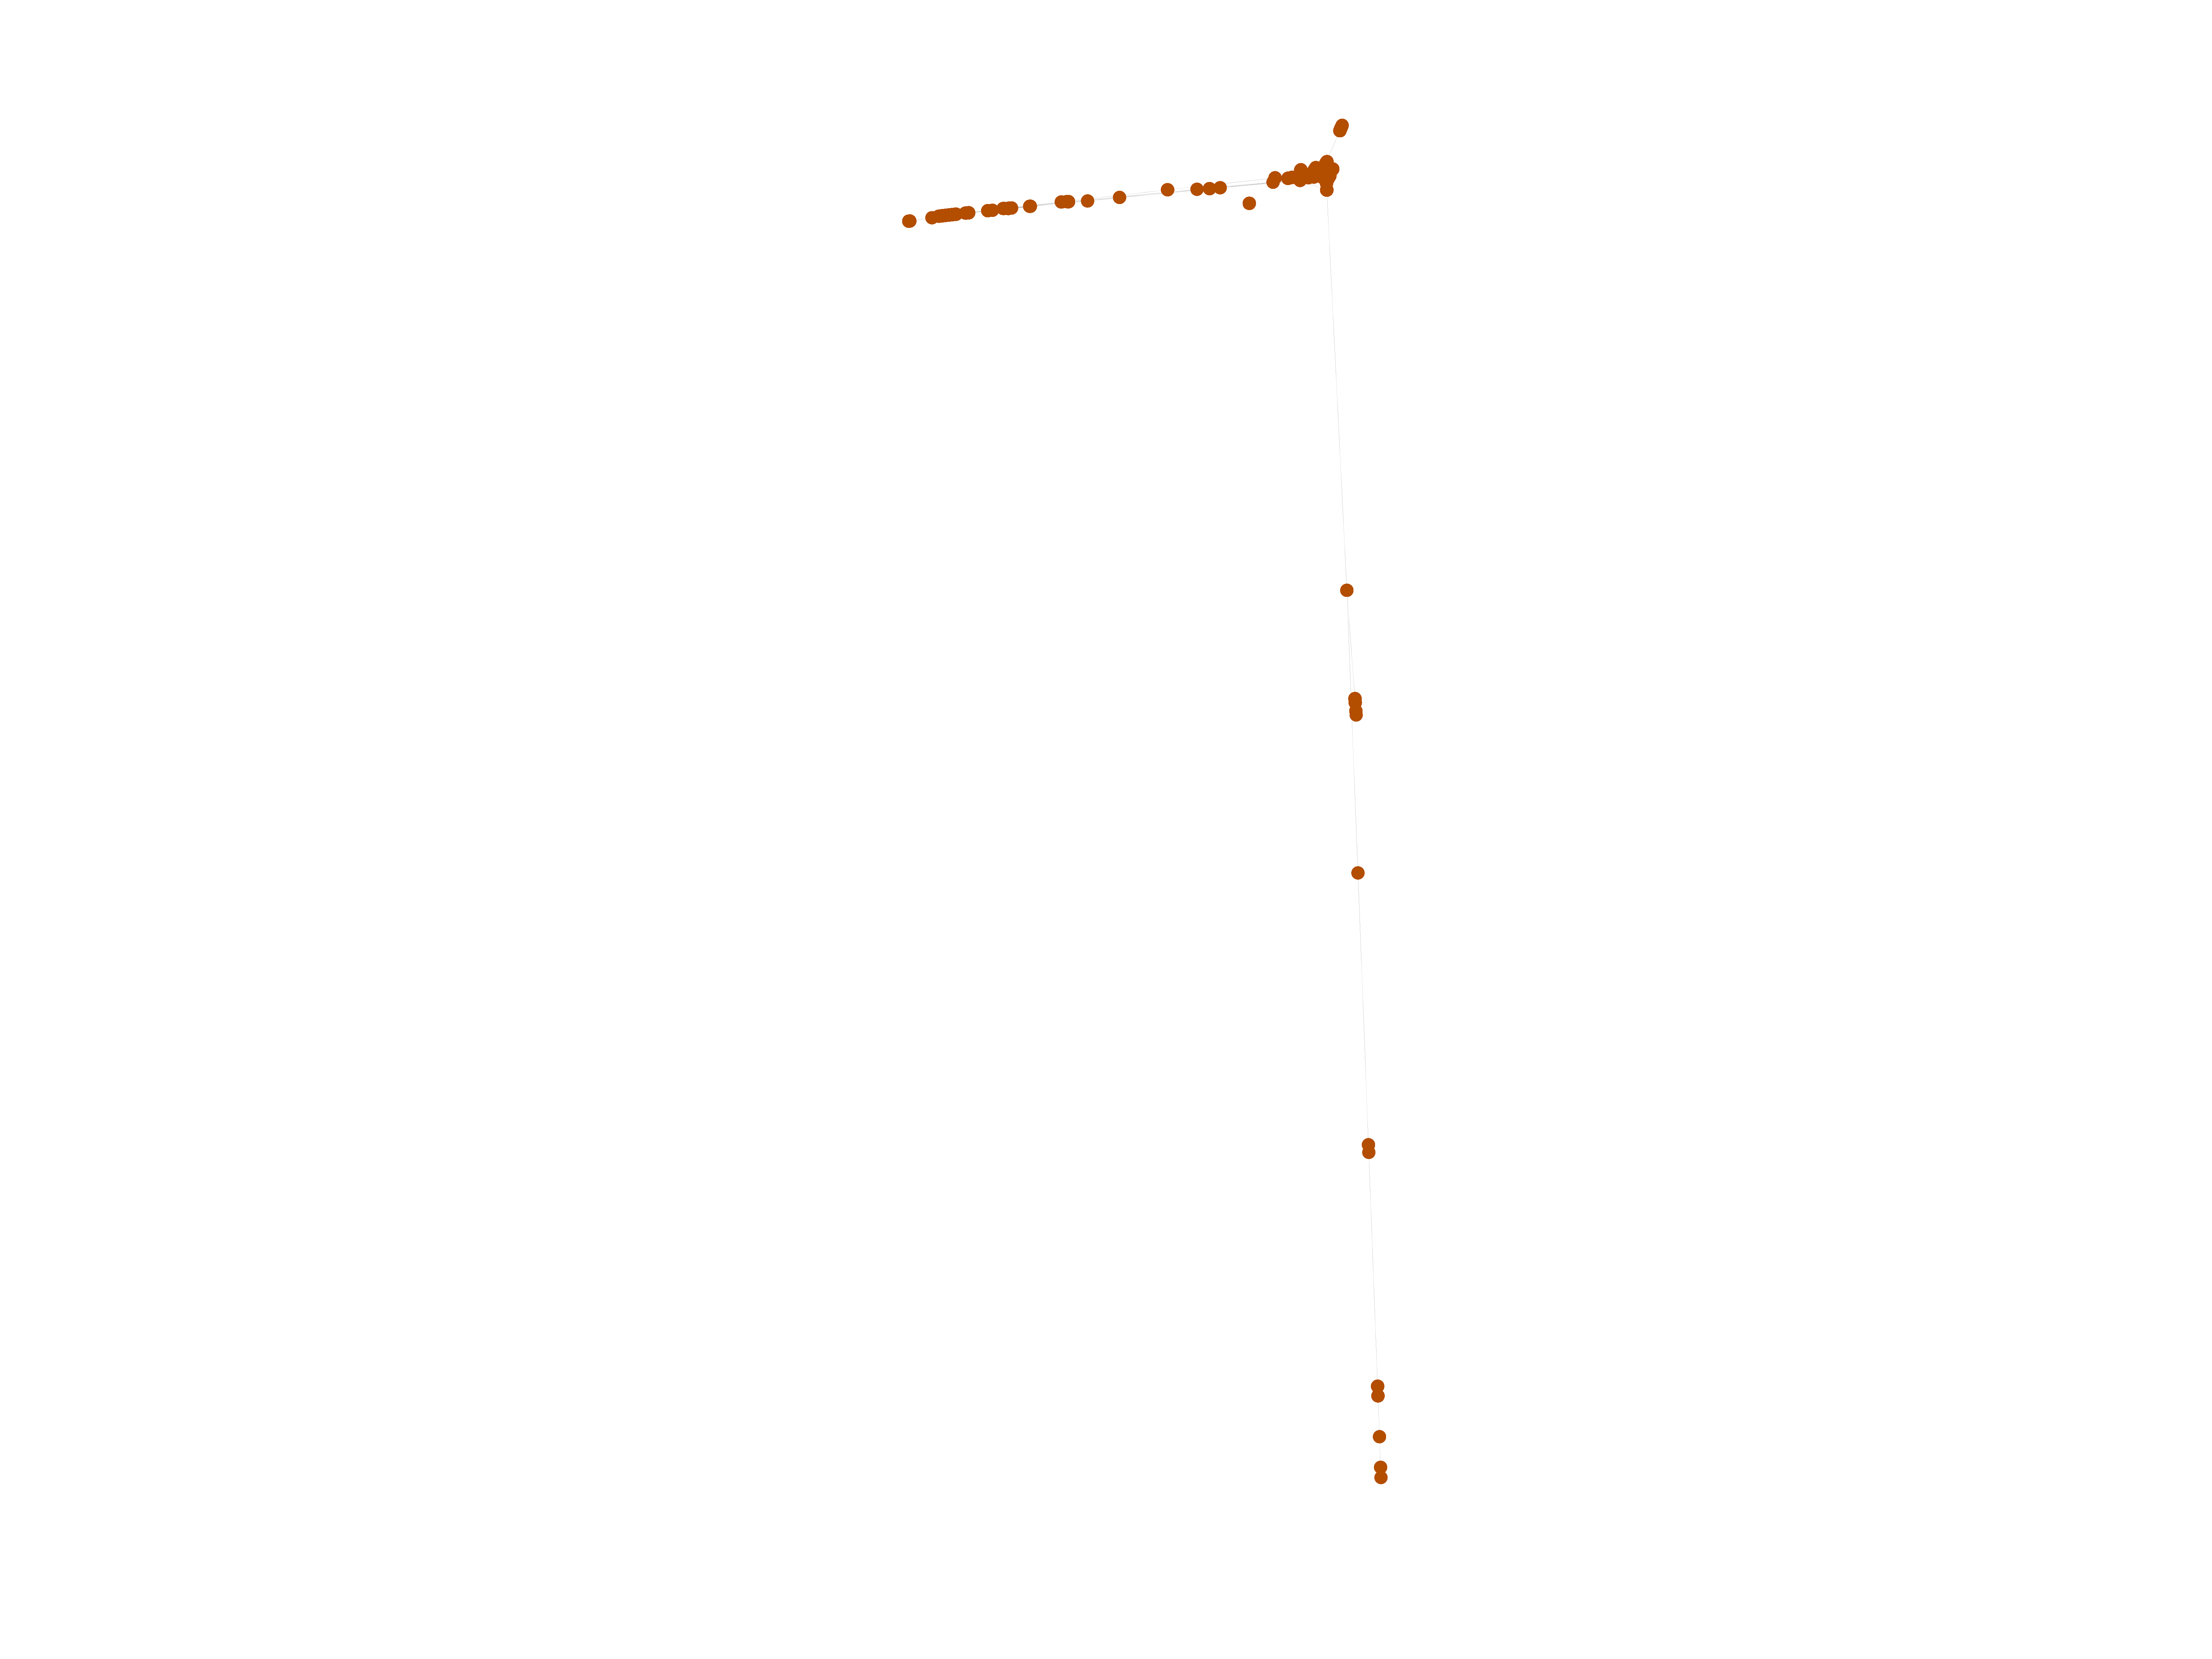
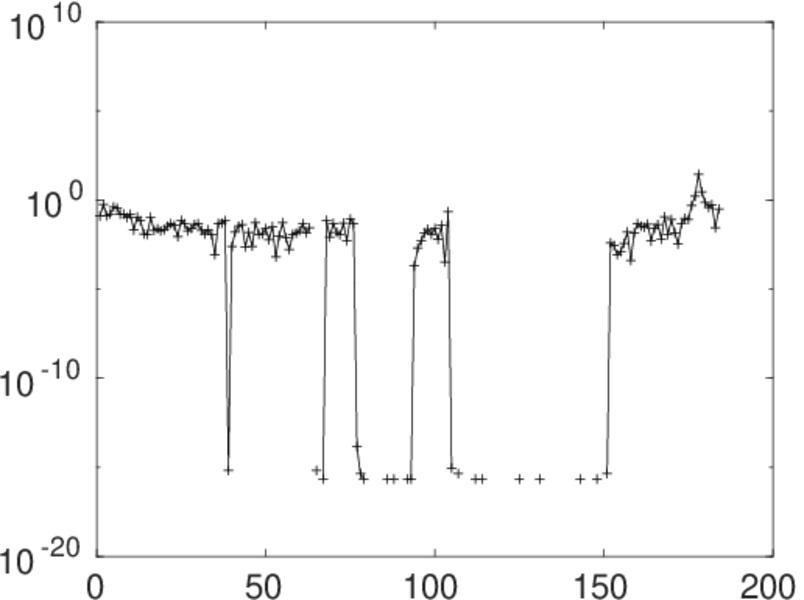
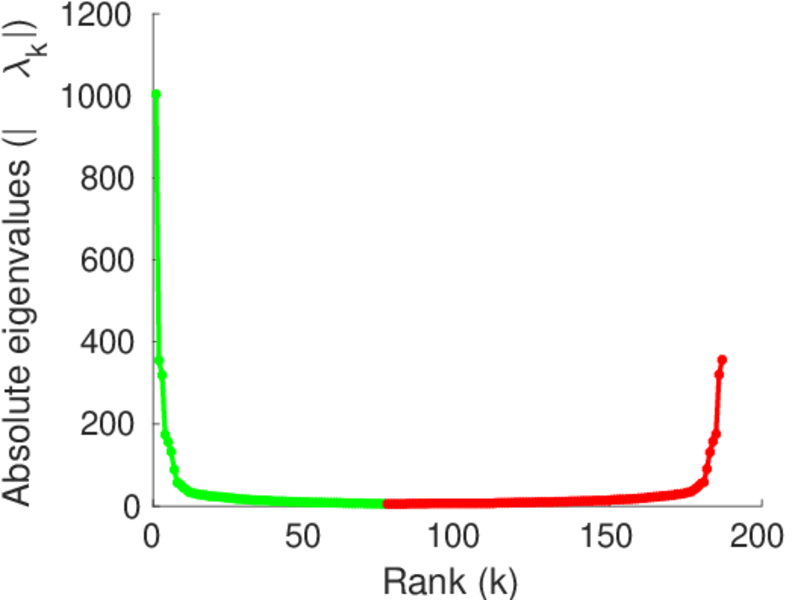
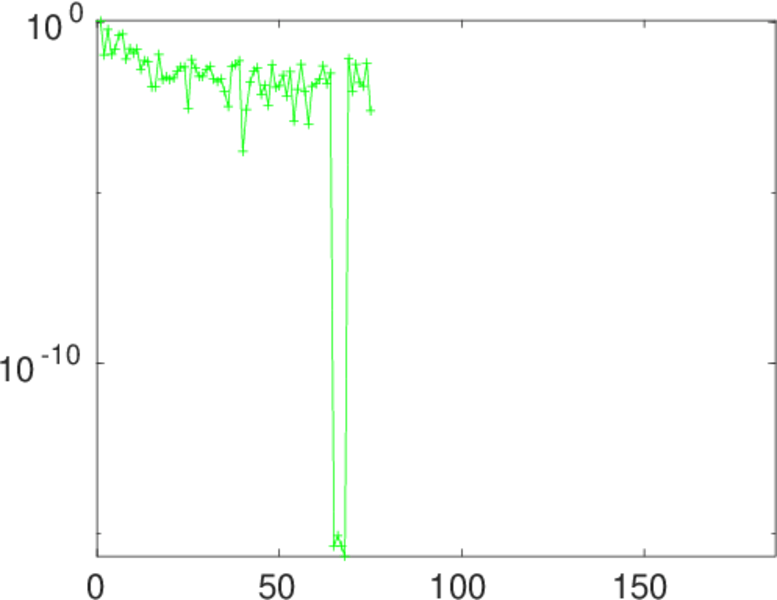
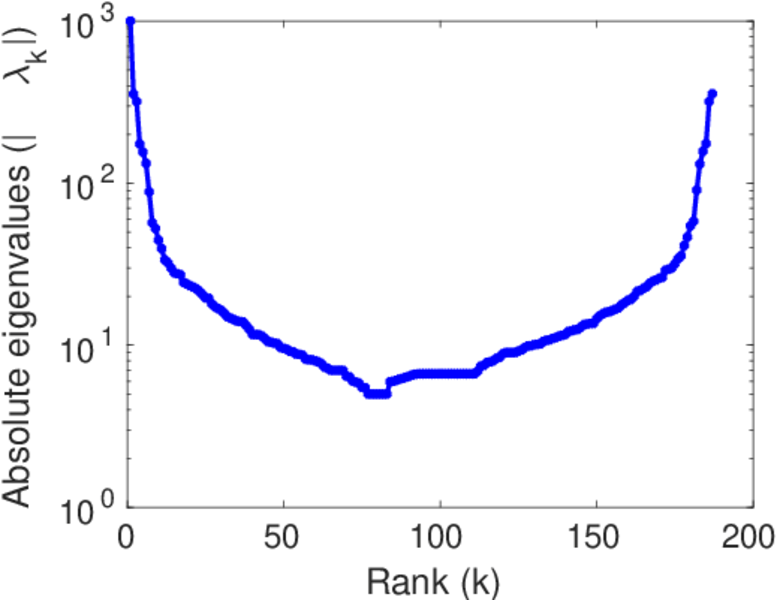
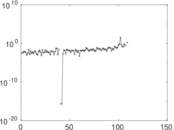
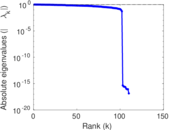
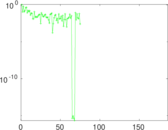
Matrix decompositions plots


Downloads
References
|
[1]
|
Jérôme Kunegis.
KONECT – The Koblenz Network Collection.
In Proc. Int. Conf. on World Wide Web Companion, pages
1343–1350, 2013.
[ http ]
|
|
[2]
|
Wikimedia Foundation.
Wikimedia downloads.
http://dumps.wikimedia.org/, January 2010.
|
 KONECT ‣ Networks ‣
Buy Me a Coffee
KONECT ‣ Networks ‣
Buy Me a Coffee