Wikipedia edits (hif)
This is the bipartite edit network of the Fiji Hindi Wikipedia. It contains
users and pages from the Fiji Hindi Wikipedia, connected by edit events. Each
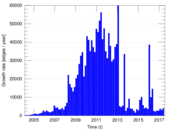
edge represents an edit. The dataset includes the timestamp of each edit.
Metadata
Statistics
| Size | n = | 31,566
|
| Left size | n1 = | 3,858
|
| Right size | n2 = | 27,708
|
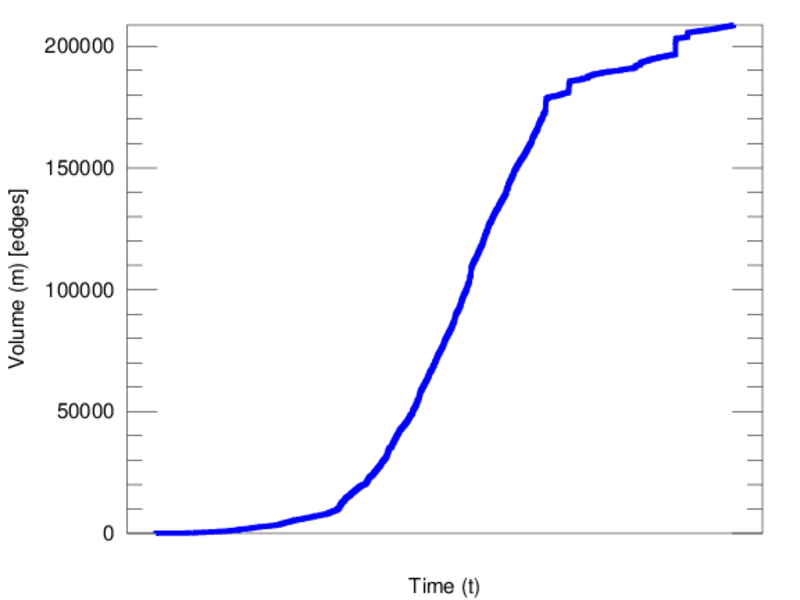
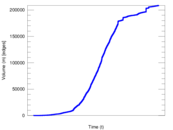
| Volume | m = | 208,674
|
| Unique edge count | m̿ = | 114,017
|
| Wedge count | s = | 147,300,679
|
| Claw count | z = | 257,974,980,342
|
| Cross count | x = | 430,582,252,687,979
|
| Square count | q = | 206,593,730
|
| 4-Tour count | T4 = | 2,242,223,098
|
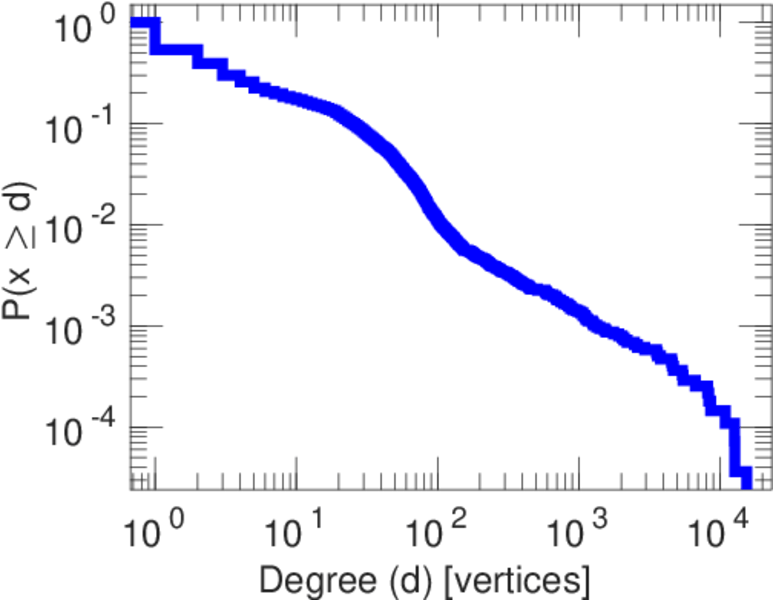
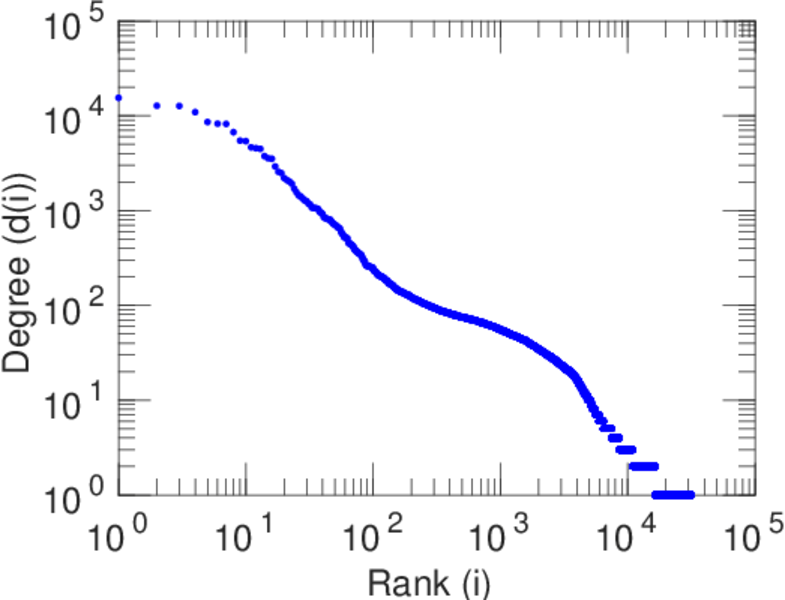
| Maximum degree | dmax = | 15,472
|
| Maximum left degree | d1max = | 15,472
|
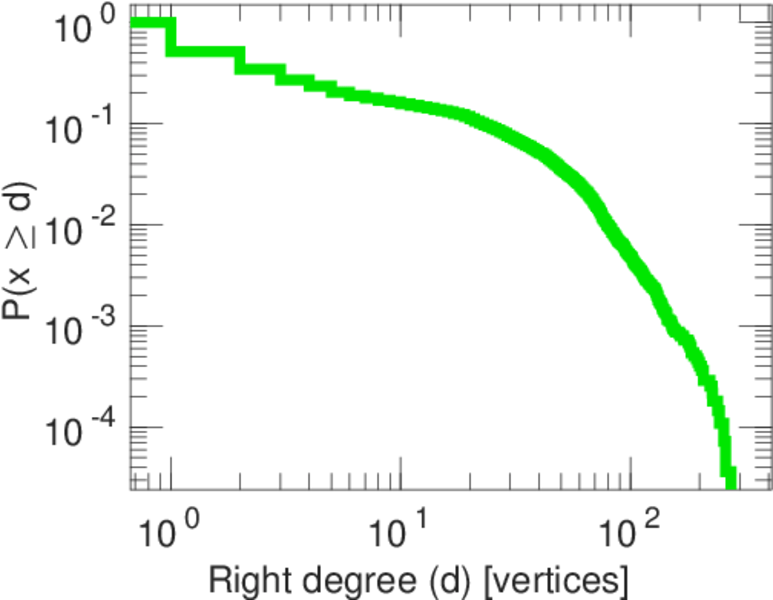
| Maximum right degree | d2max = | 274
|
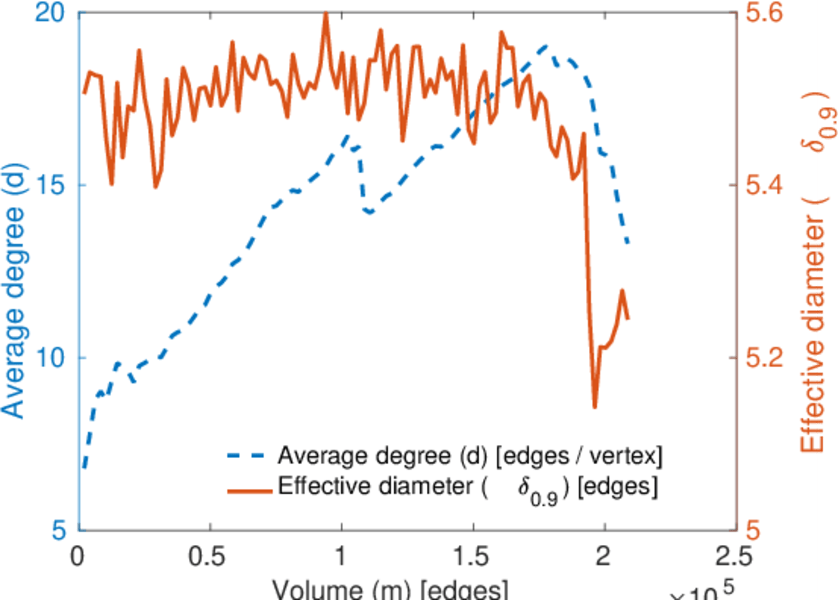
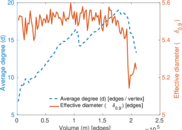
| Average degree | d = | 13.221 4
|
| Average left degree | d1 = | 54.088 6
|
| Average right degree | d2 = | 7.531 18
|
| Fill | p = | 0.001 066 60
|
| Average edge multiplicity | m̃ = | 1.830 20
|
| Size of LCC | N = | 30,758
|
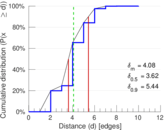
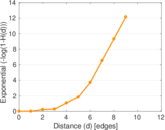
| Diameter | δ = | 11
|
| 50-Percentile effective diameter | δ0.5 = | 3.621 52
|
| 90-Percentile effective diameter | δ0.9 = | 5.436 45
|
| Median distance | δM = | 4
|
| Mean distance | δm = | 4.084 58
|
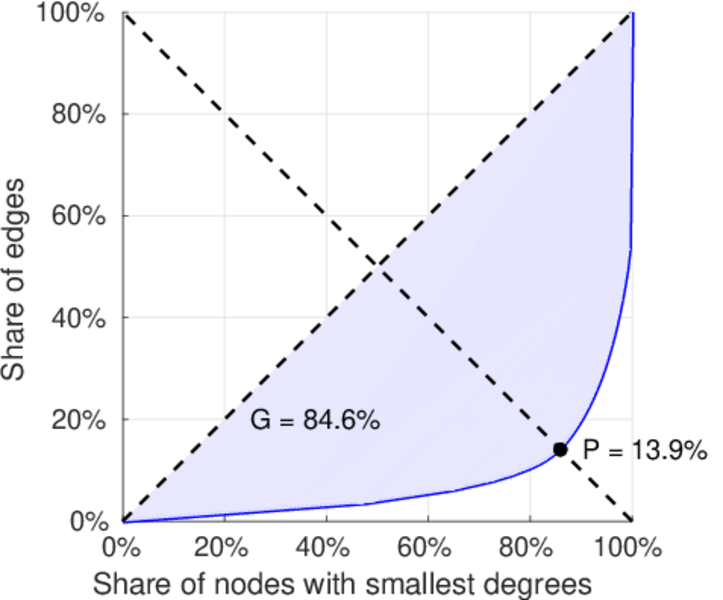
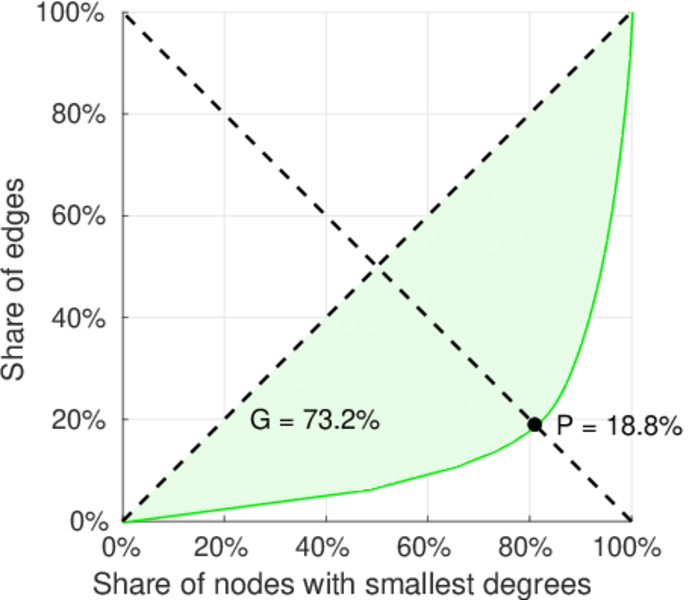
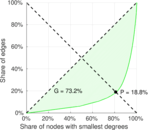
| Gini coefficient | G = | 0.851 458
|
| Balanced inequality ratio | P = | 0.139 311
|
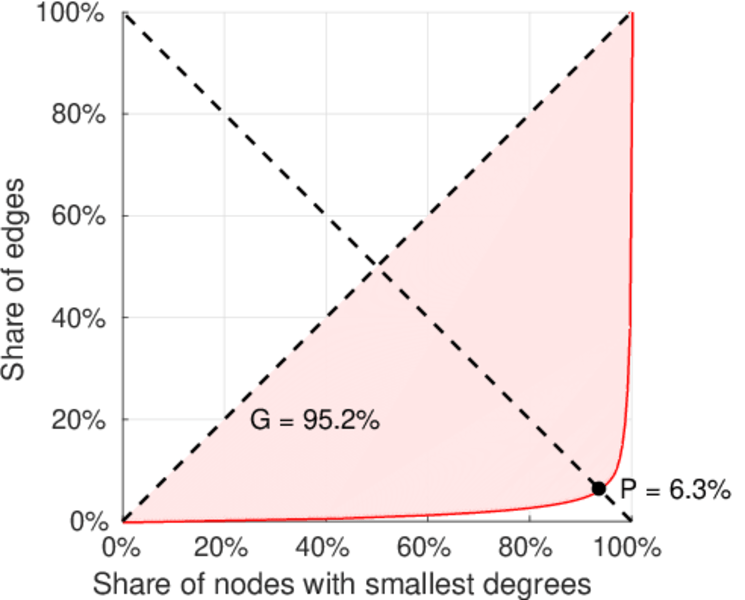
| Left balanced inequality ratio | P1 = | 0.062 537 7
|
| Right balanced inequality ratio | P2 = | 0.188 414
|
| Relative edge distribution entropy | Her = | 0.753 905
|
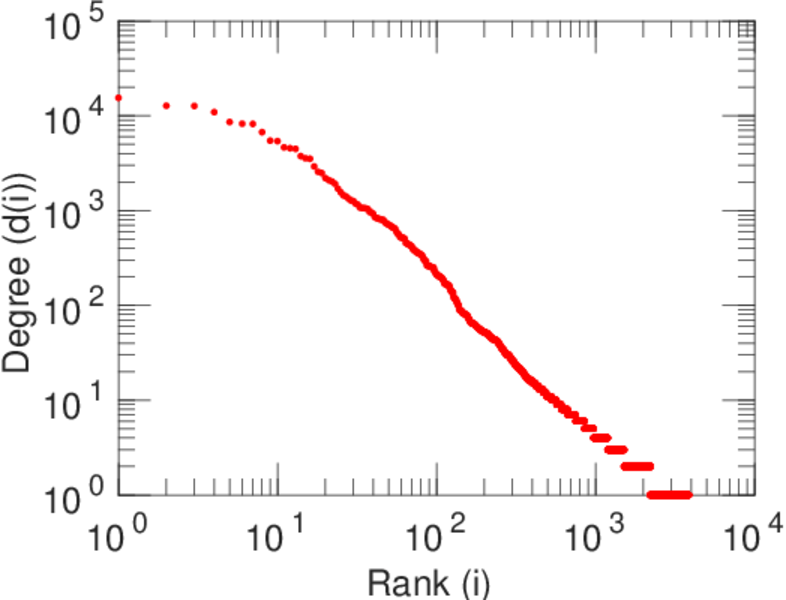
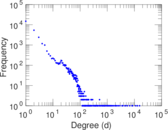
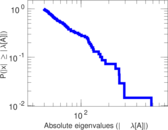
| Power law exponent | γ = | 2.373 69
|
| Tail power law exponent | γt = | 1.851 00
|
| Tail power law exponent with p | γ3 = | 1.851 00
|
| p-value | p = | 0.000 00
|
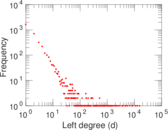
| Left tail power law exponent with p | γ3,1 = | 1.821 00
|
| Left p-value | p1 = | 0.000 00
|
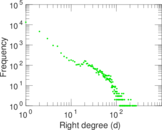
| Right tail power law exponent with p | γ3,2 = | 1.851 00
|
| Right p-value | p2 = | 0.000 00
|
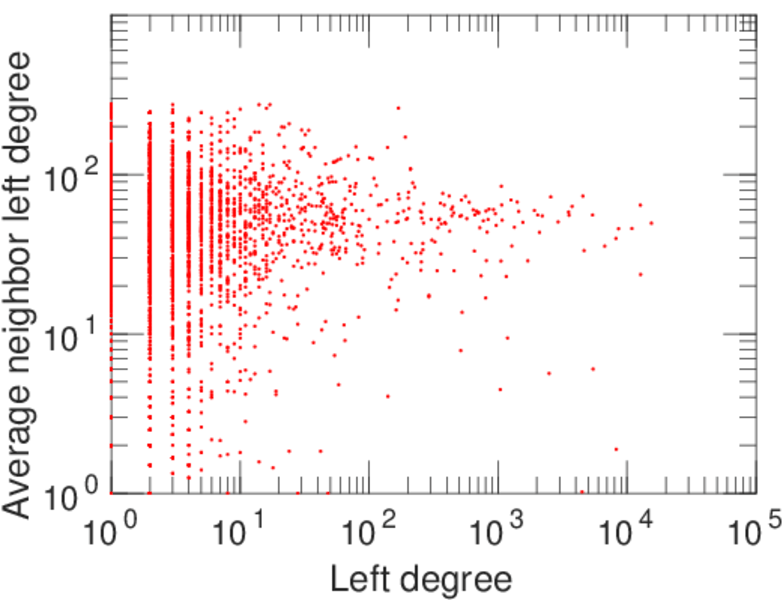
| Degree assortativity | ρ = | −0.468 393
|
| Degree assortativity p-value | pρ = | 0.000 00
|
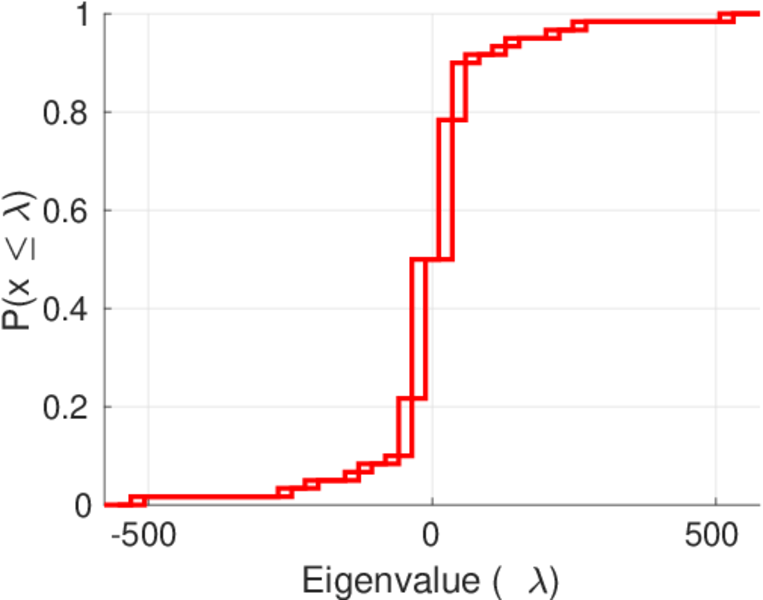
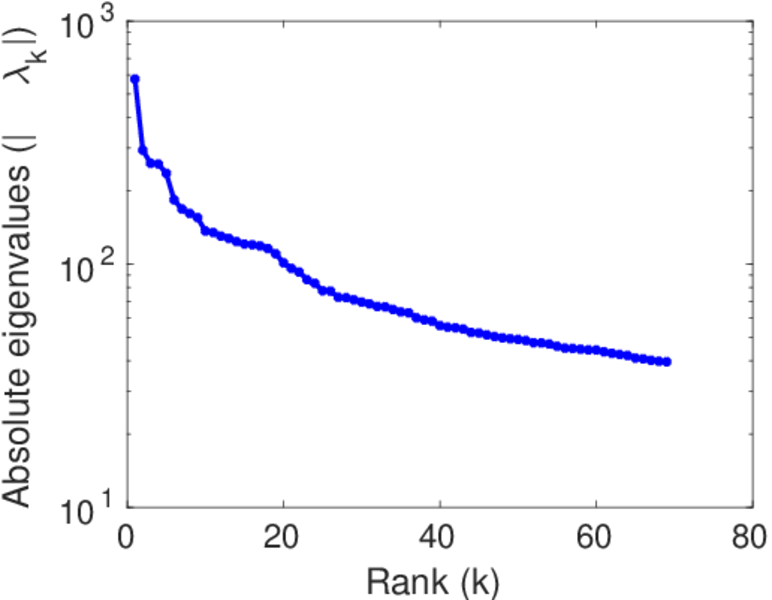
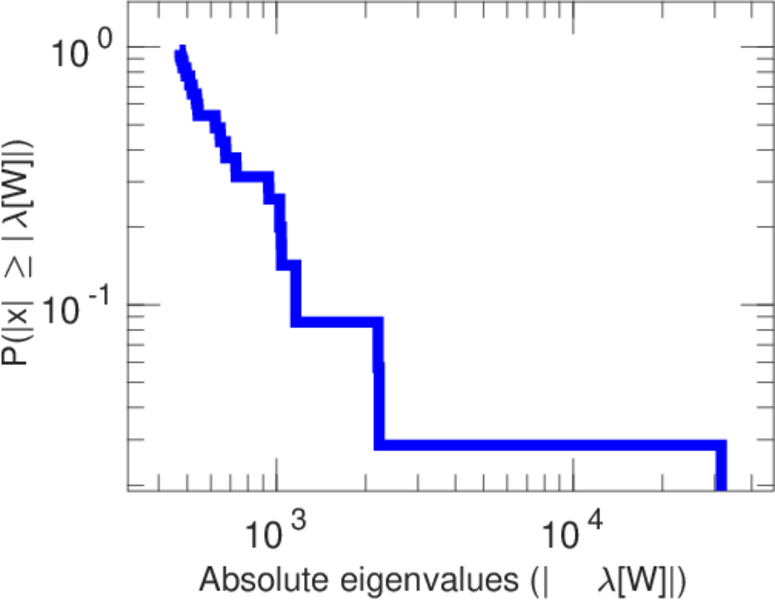
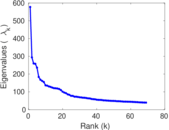
| Spectral norm | α = | 577.311
|
| Algebraic connectivity | a = | 0.005 107 62
|
| Spectral separation | |λ1[A] / λ2[A]| = | 1.963 28
|
| Controllability | C = | 27,361
|
| Relative controllability | Cr = | 0.871 980
|
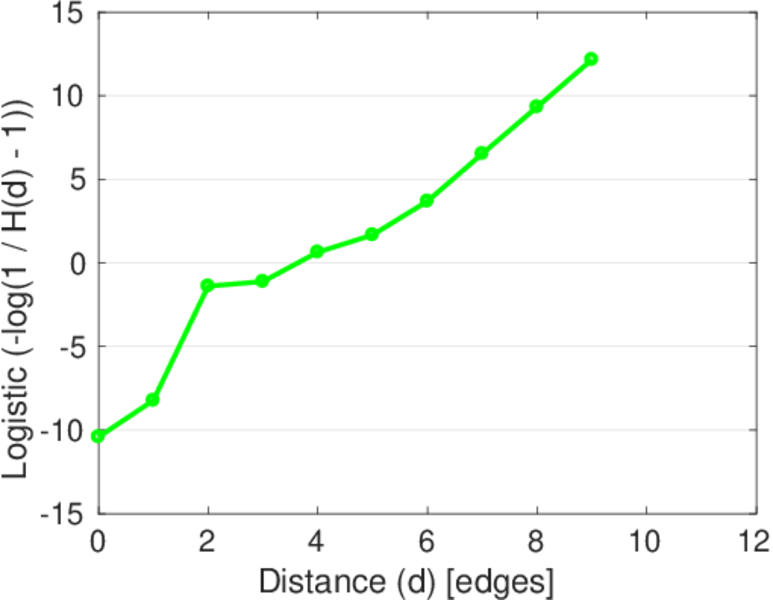
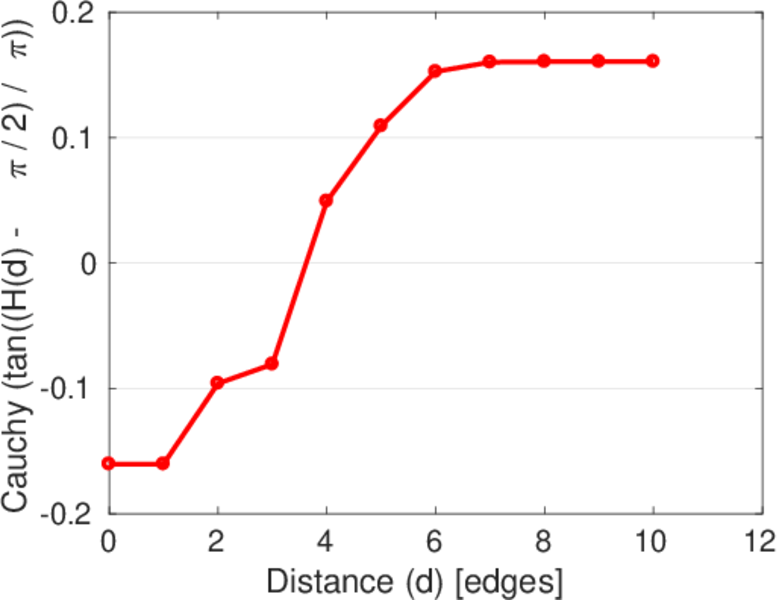
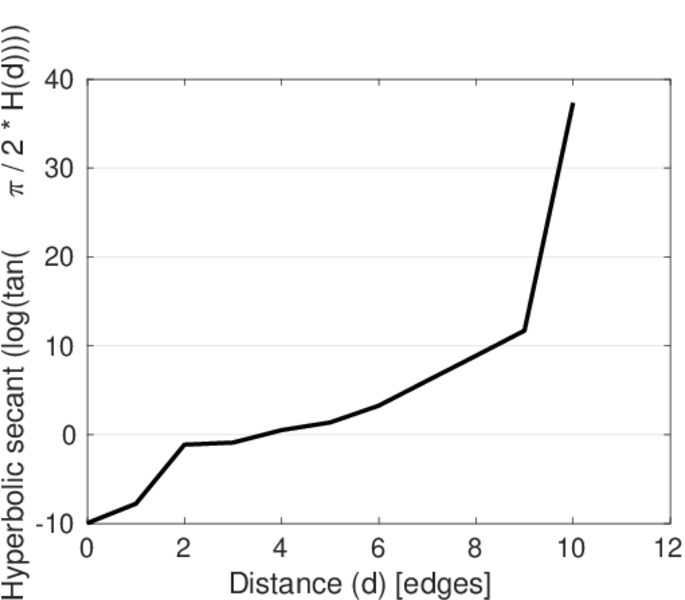
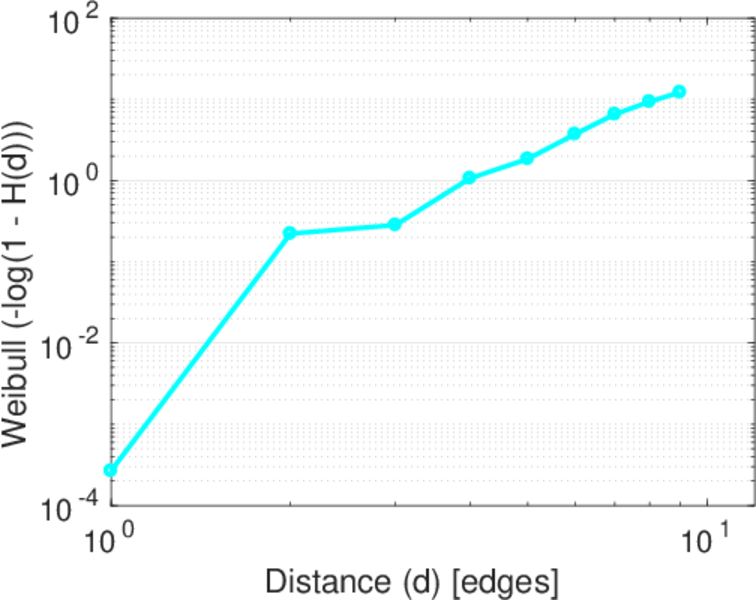
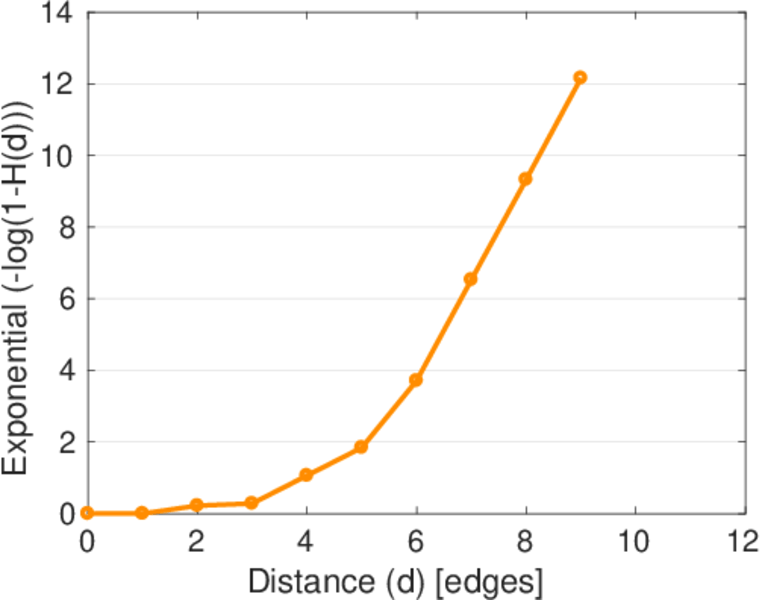
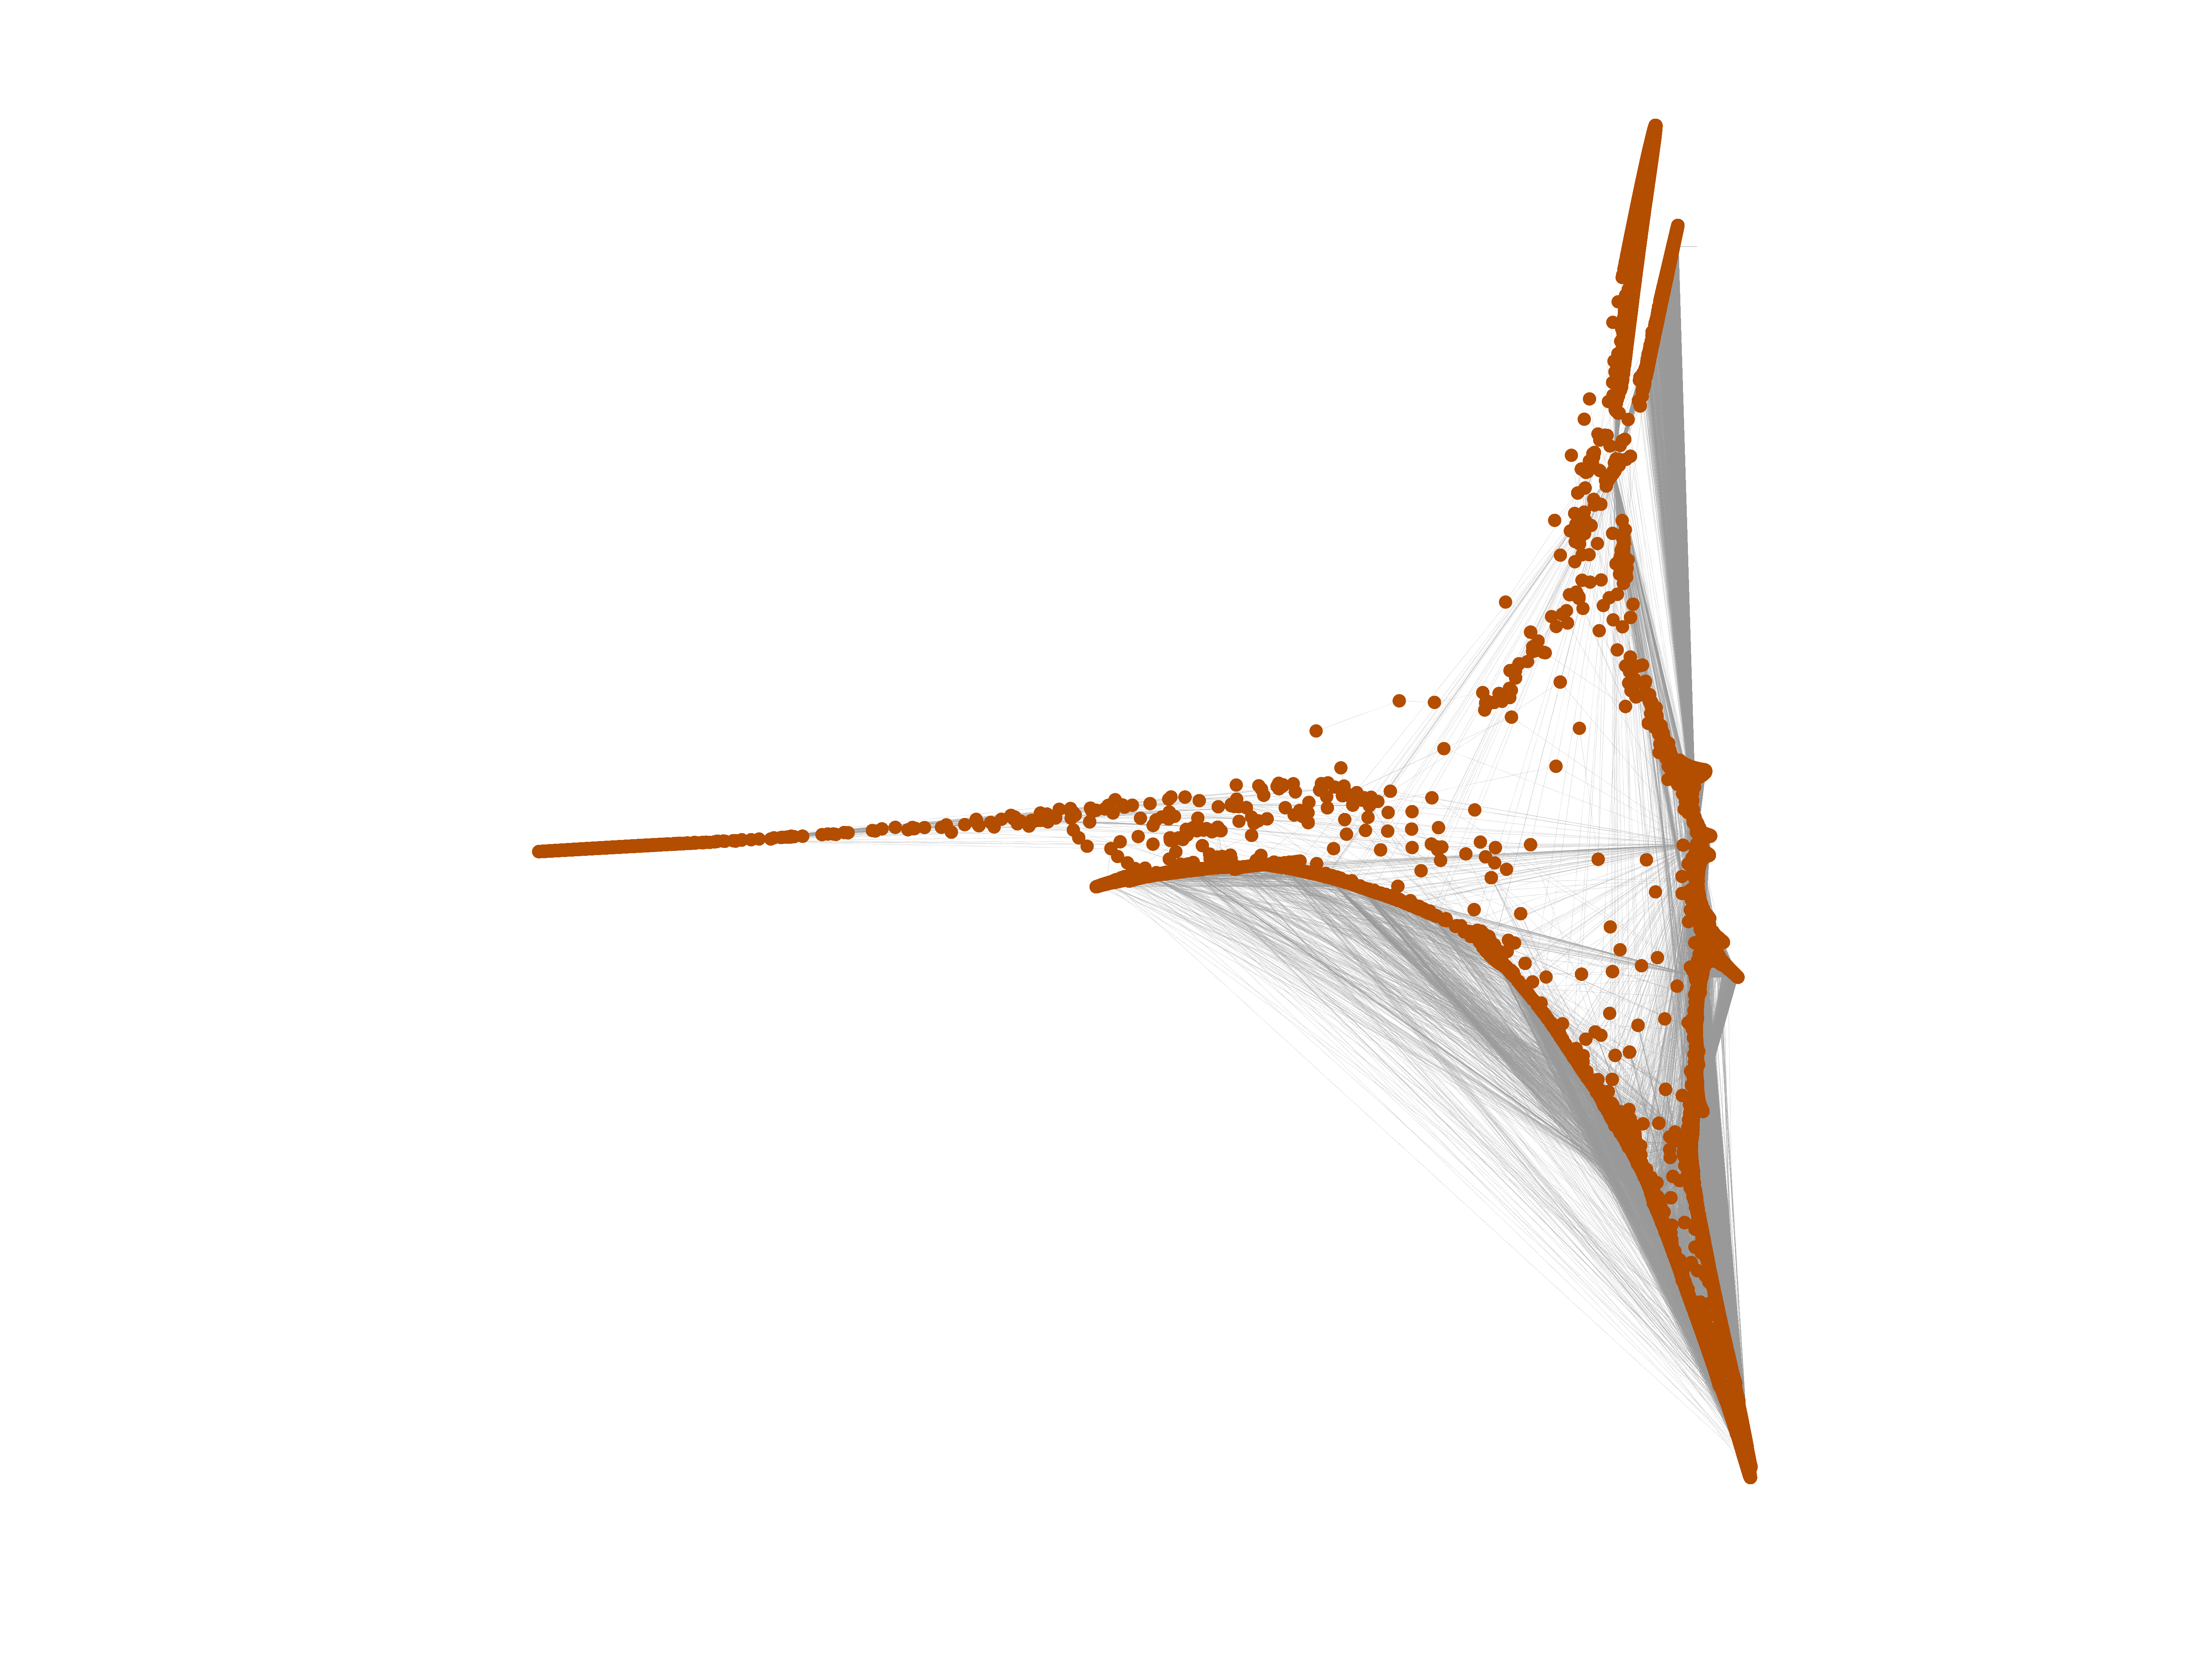
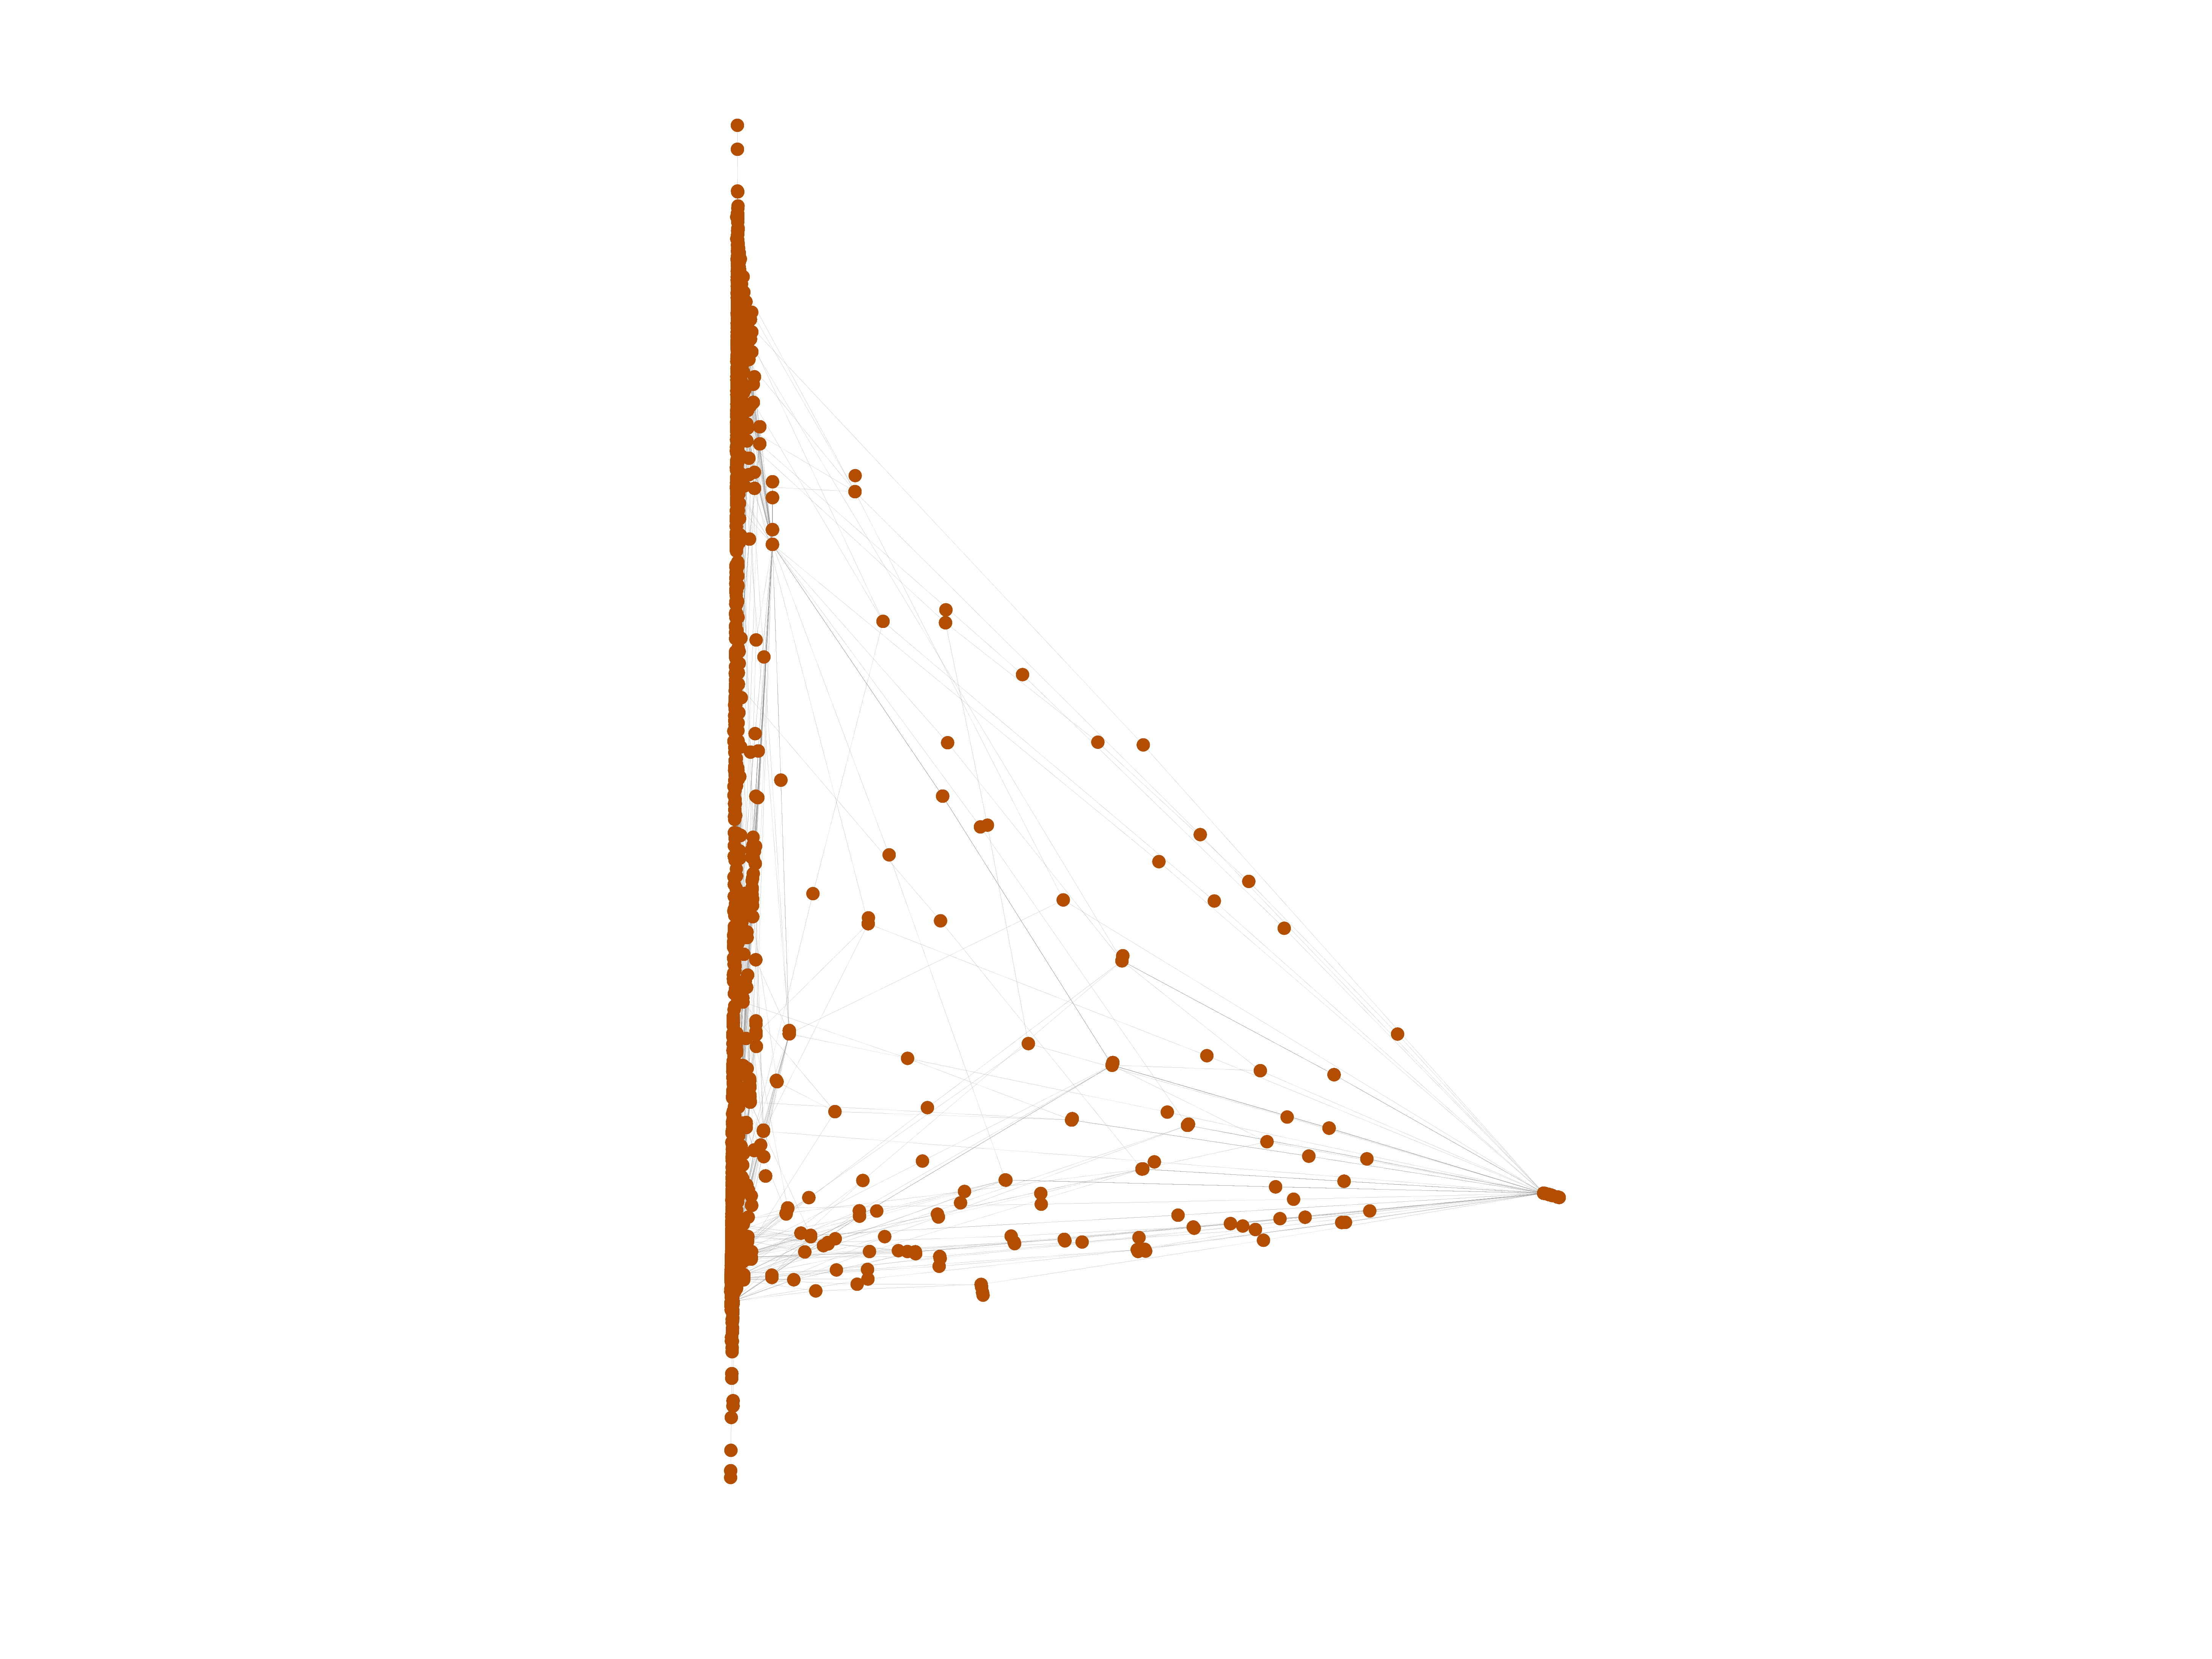
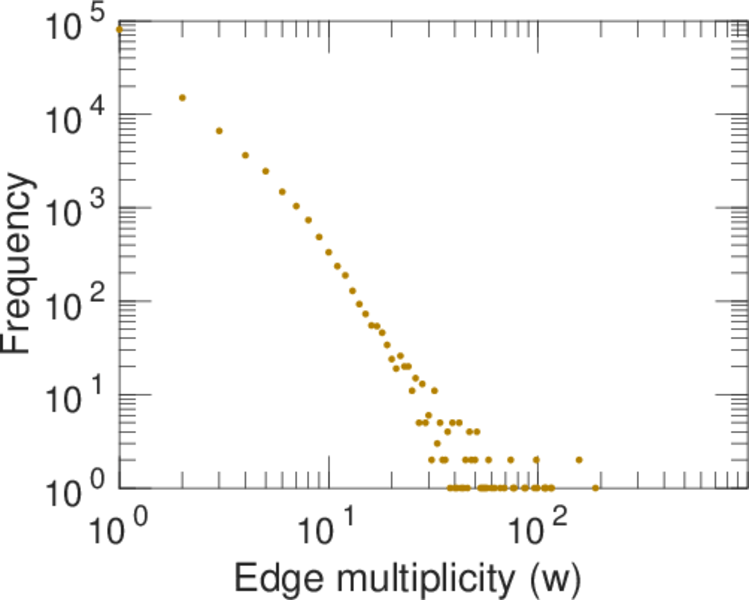
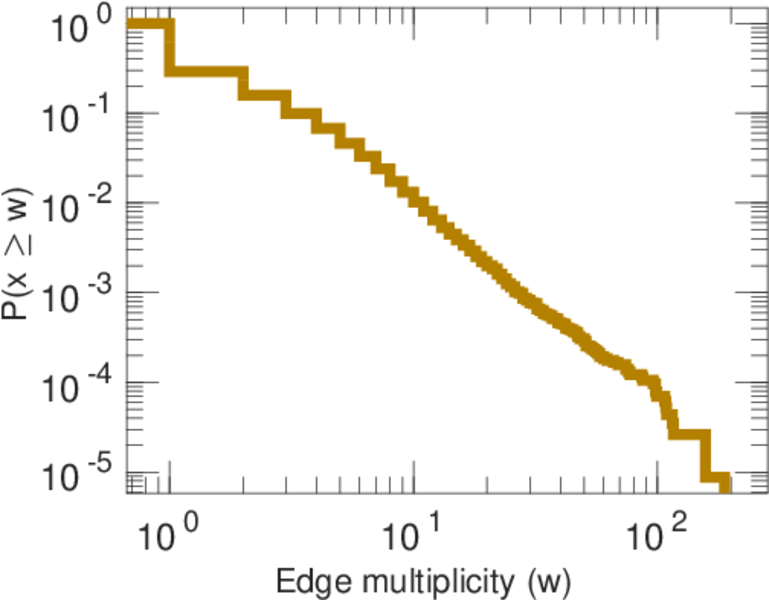
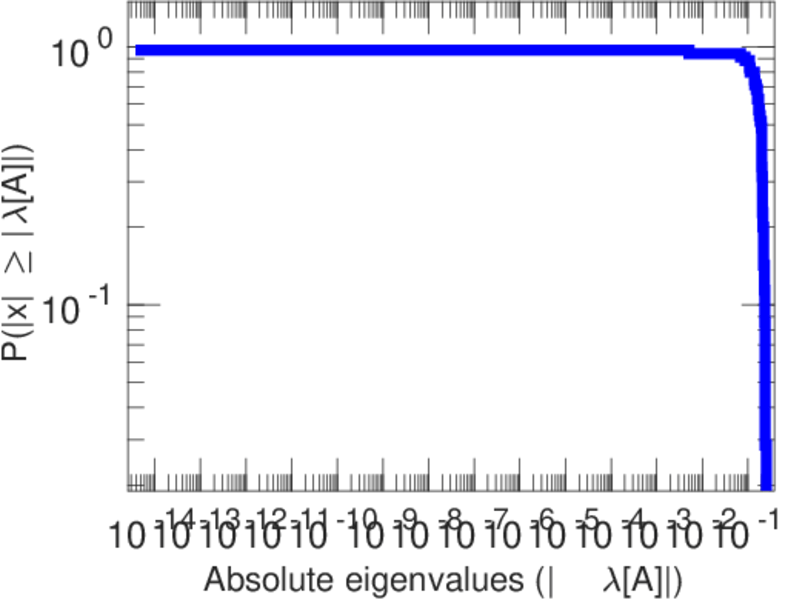
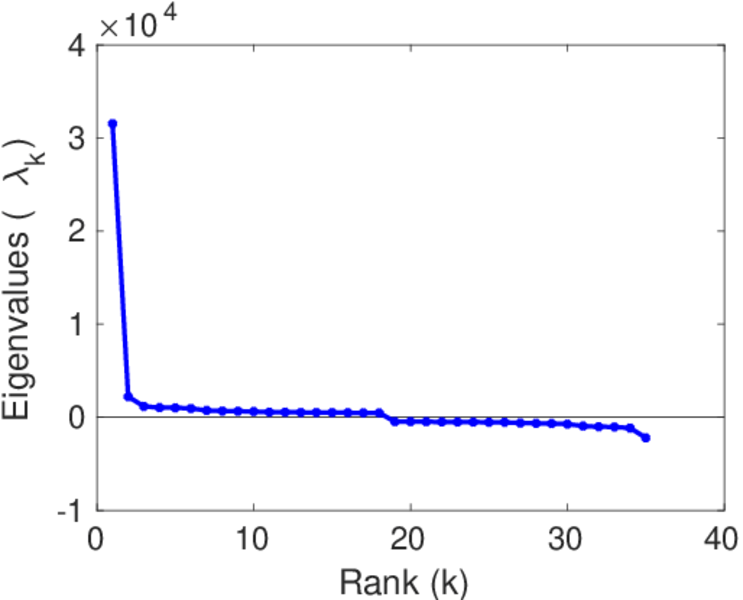
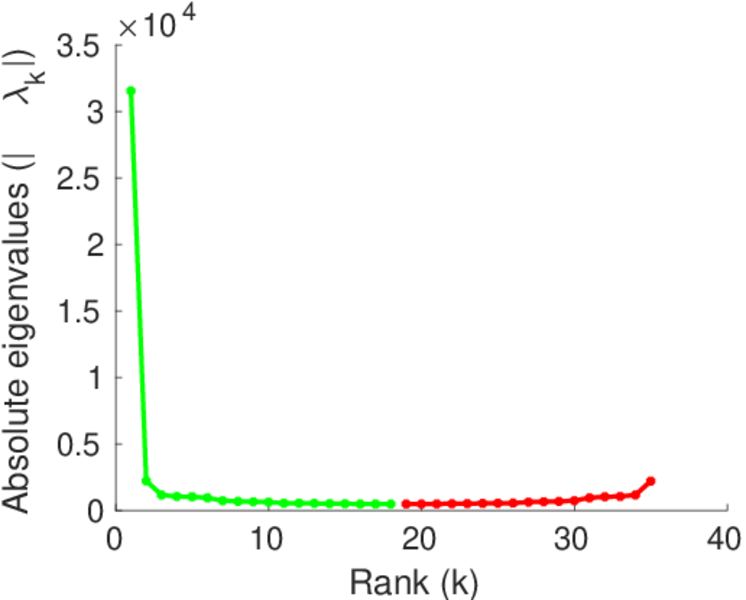
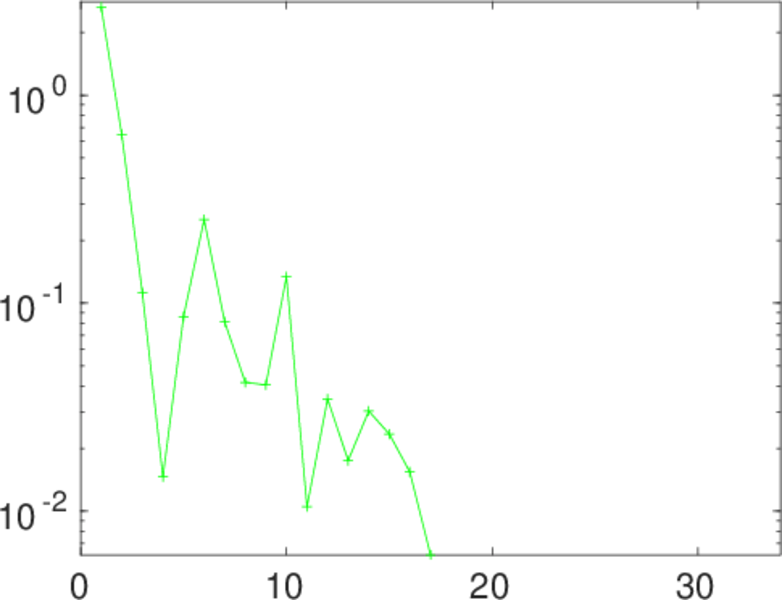
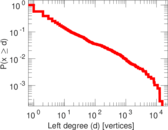
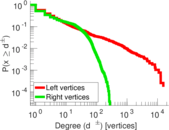
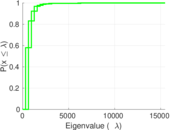
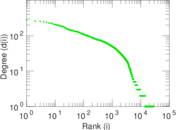
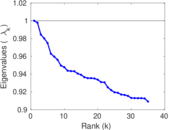
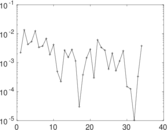
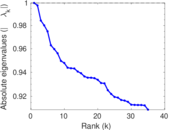
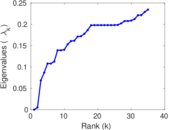
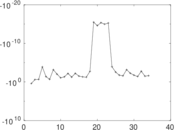
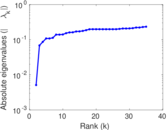
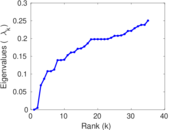
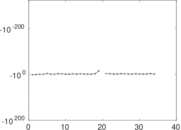
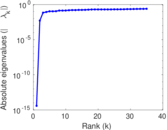
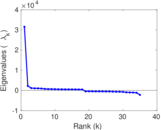
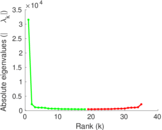
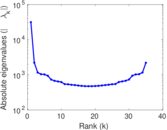
Plots


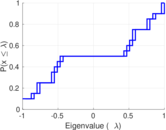

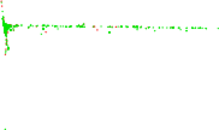
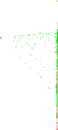


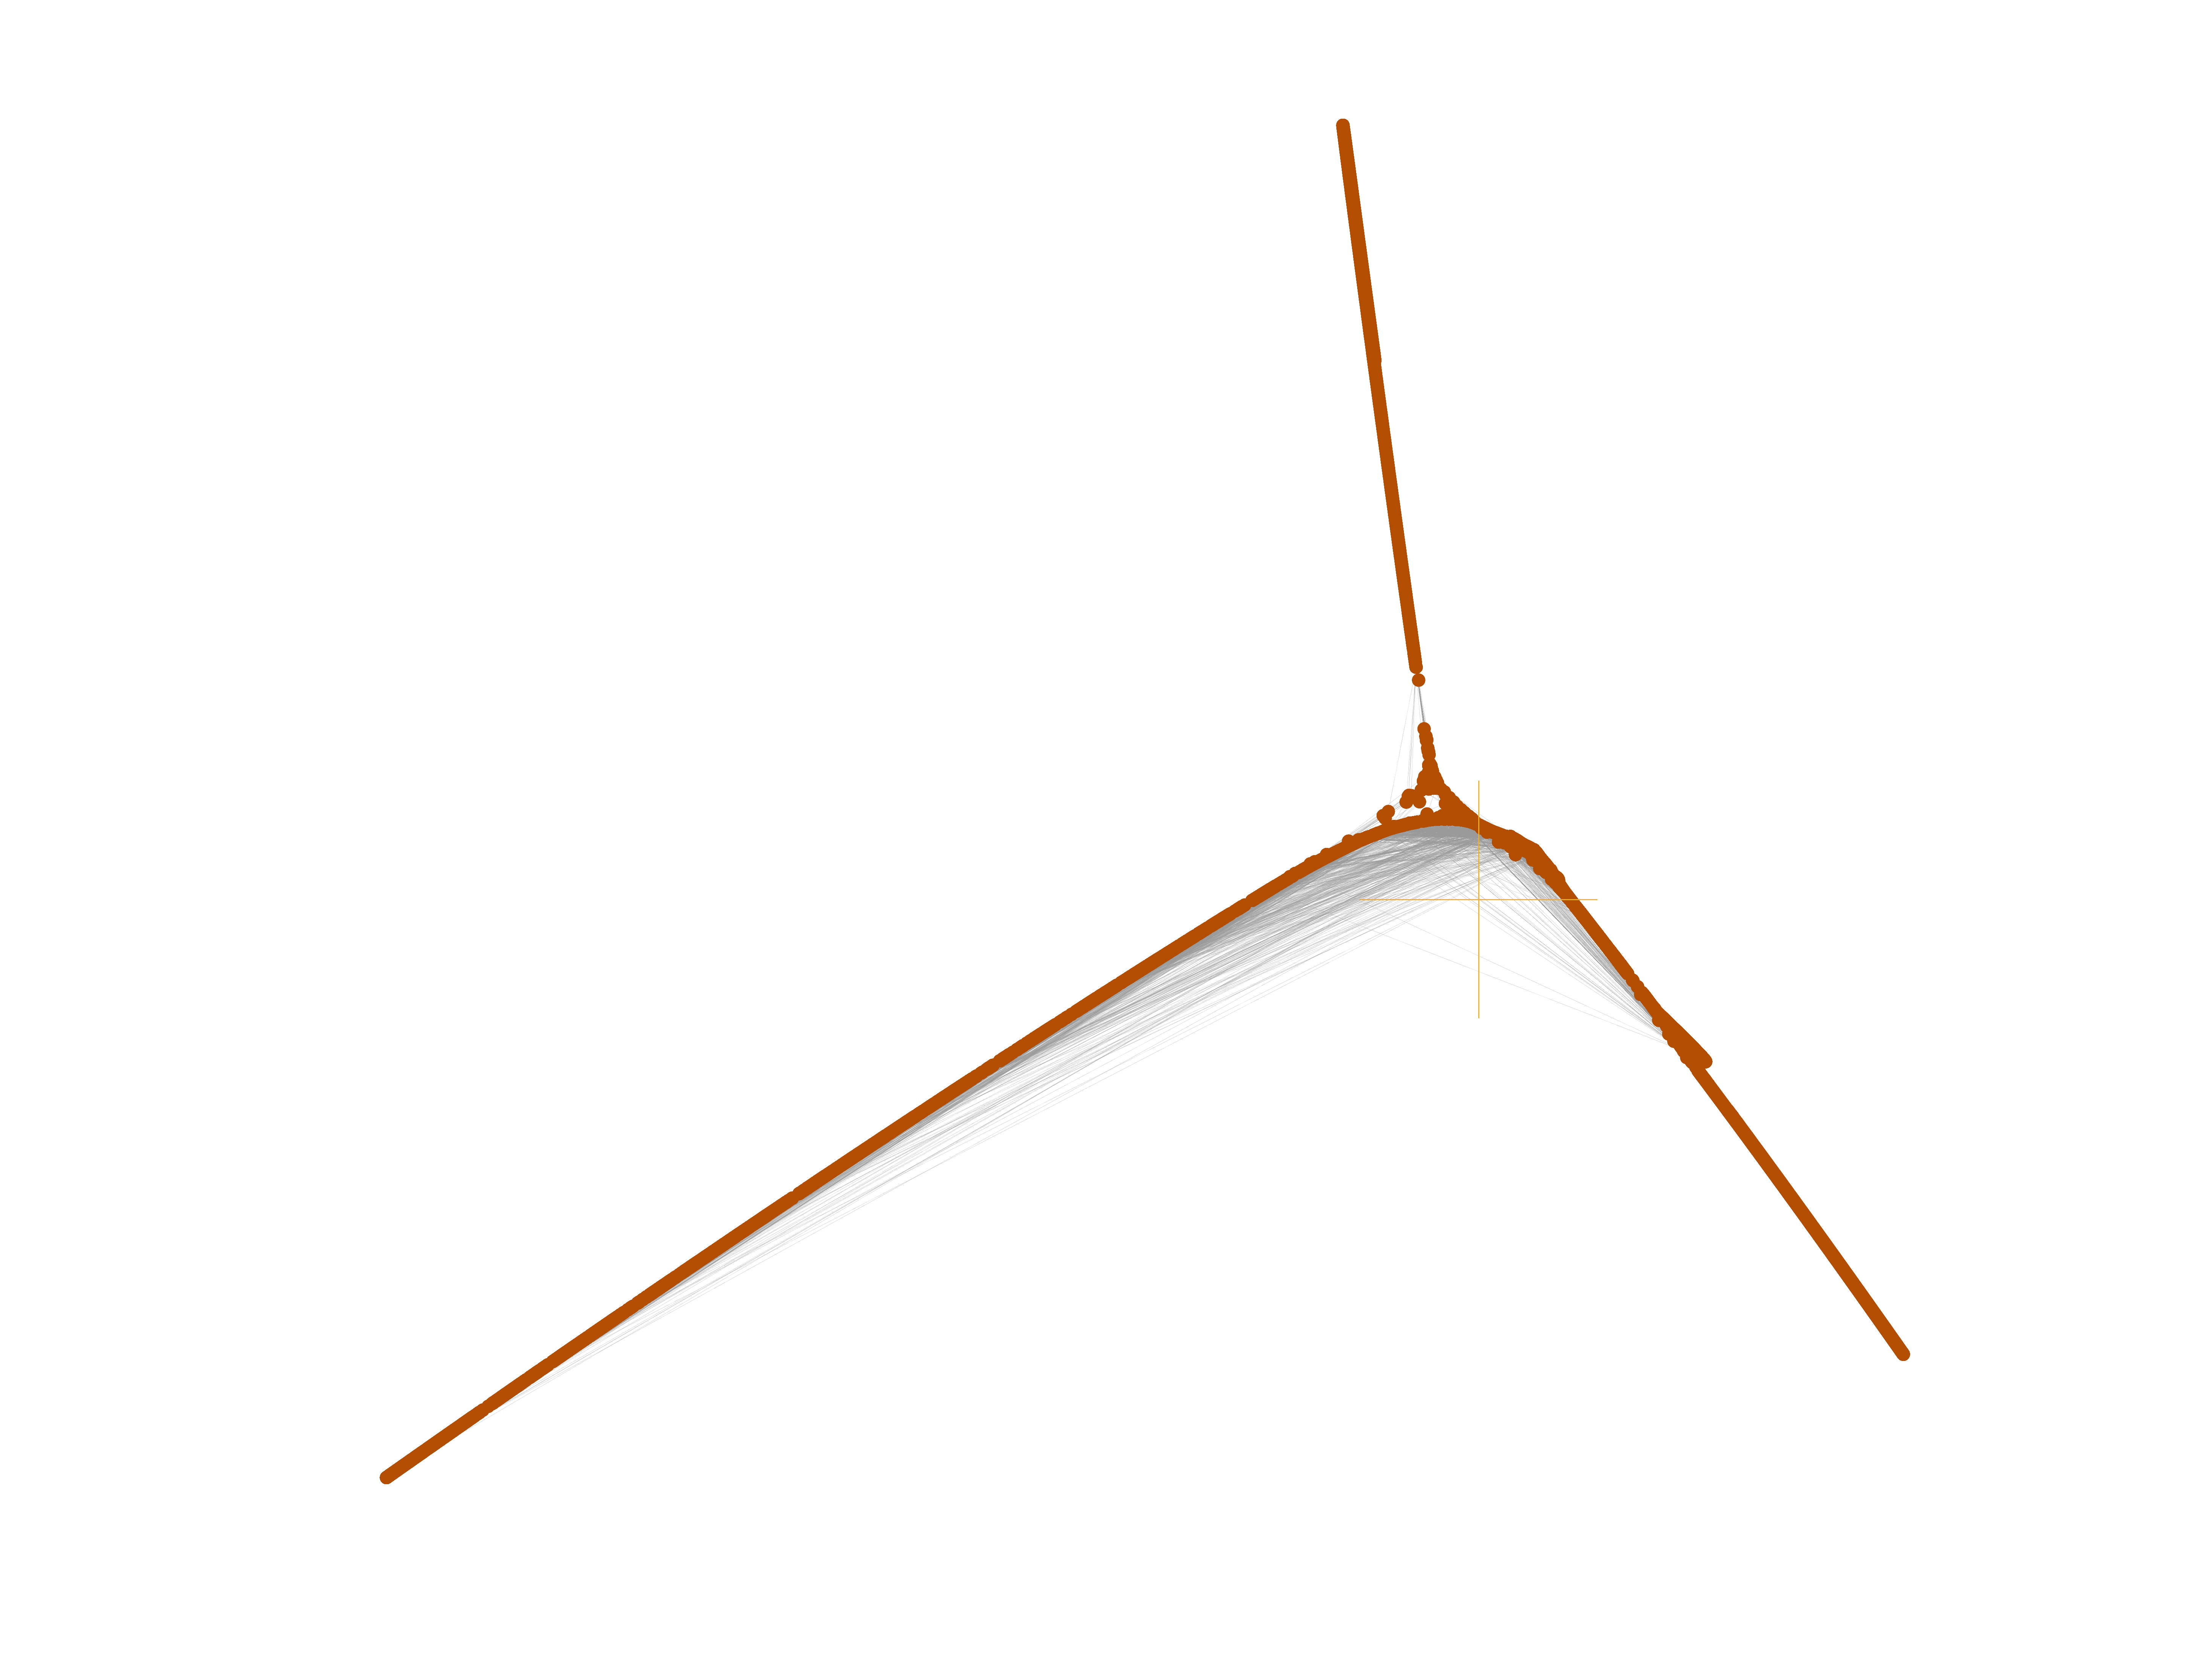
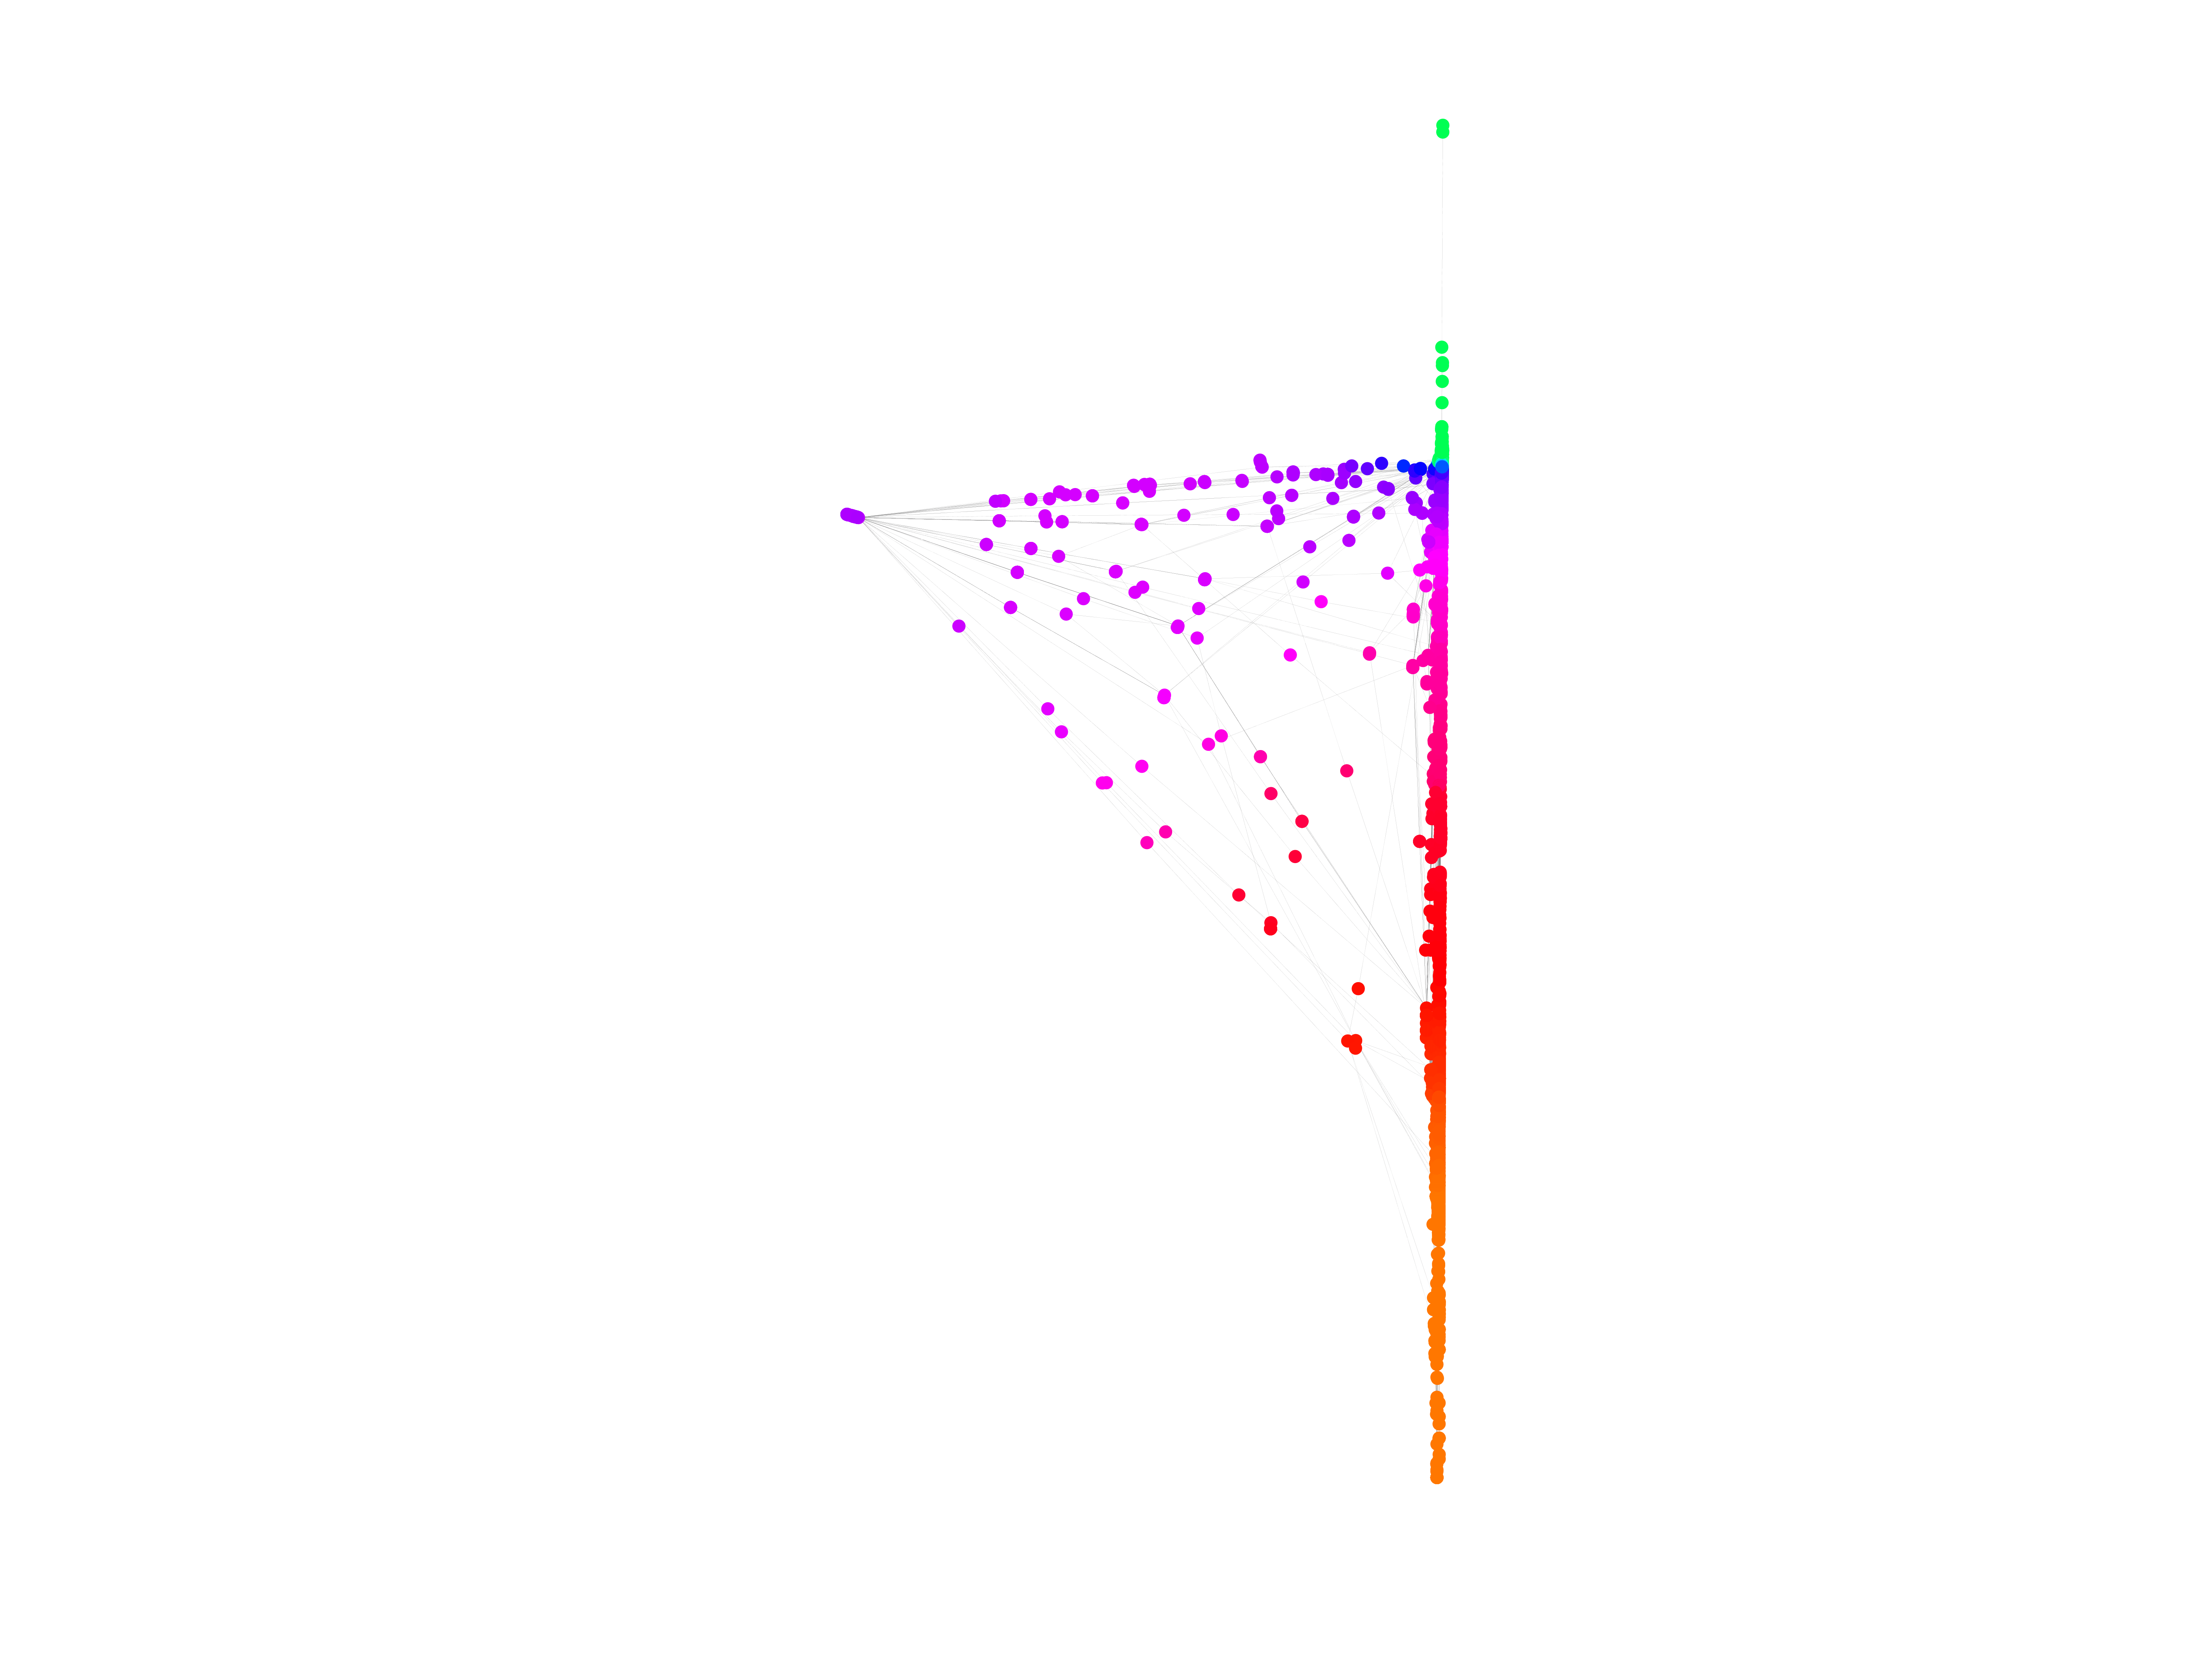
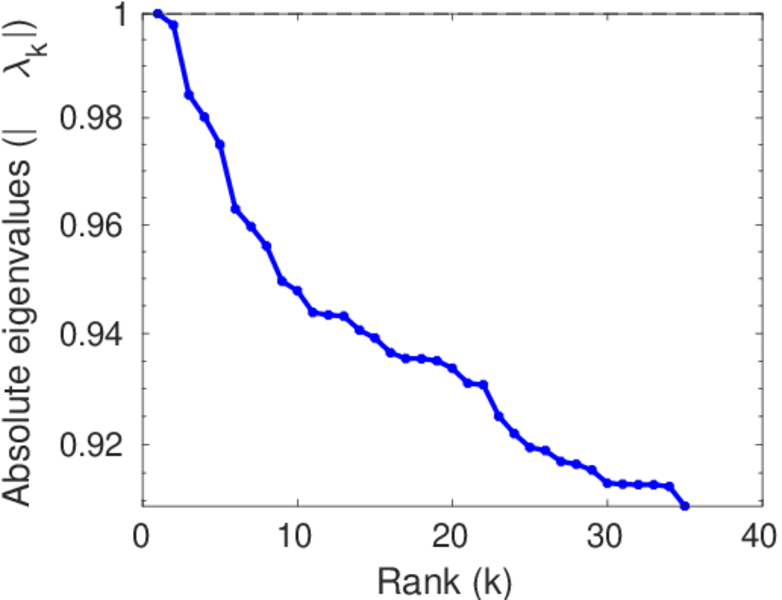
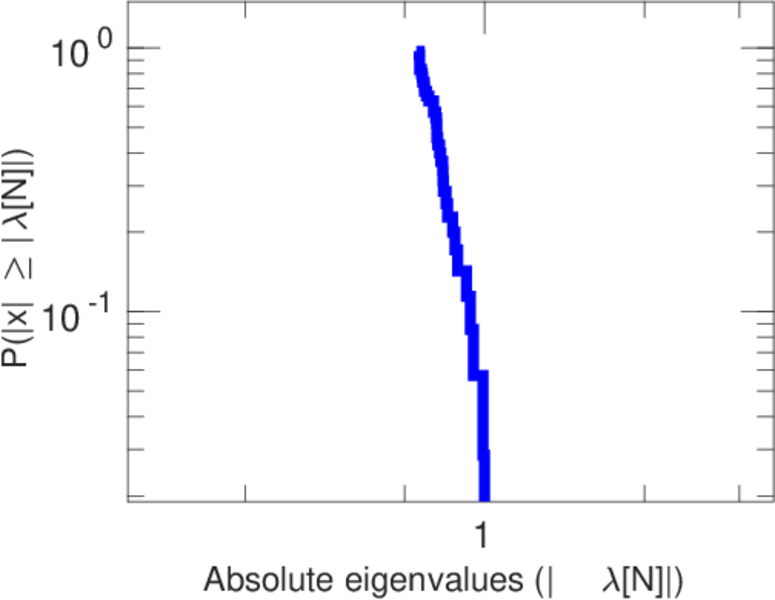
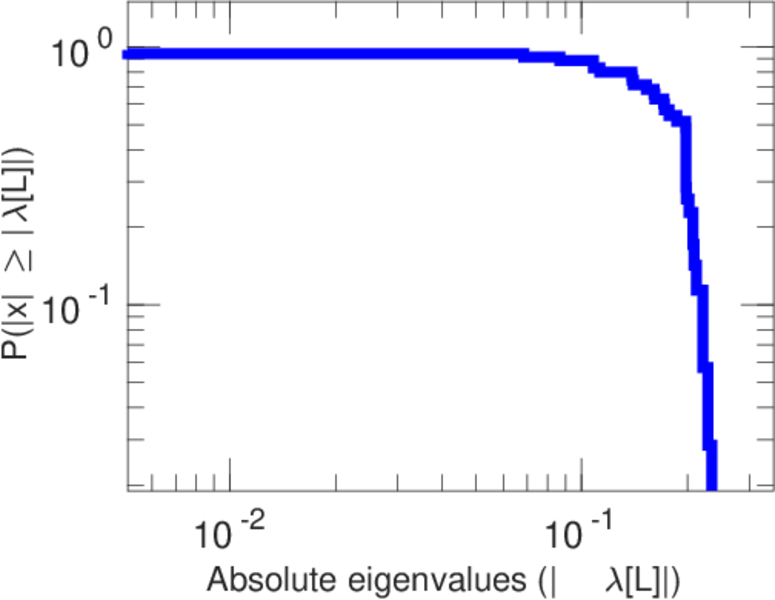
Matrix decompositions plots


Downloads
References
|
[1]
|
Jérôme Kunegis.
KONECT – The Koblenz Network Collection.
In Proc. Int. Conf. on World Wide Web Companion, pages
1343–1350, 2013.
[ http ]
|
|
[2]
|
Wikimedia Foundation.
Wikimedia downloads.
http://dumps.wikimedia.org/, January 2010.
|
 KONECT ‣ Networks ‣
Buy Me a Coffee
KONECT ‣ Networks ‣
Buy Me a Coffee