Wikipedia edits (hi)
This is the bipartite edit network of the Hindi Wikipedia. It contains users
and pages from the Hindi Wikipedia, connected by edit events. Each edge
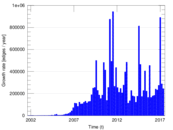
represents an edit. The dataset includes the timestamp of each edit.
Metadata
Statistics
| Size | n = | 699,316
|
| Left size | n1 = | 29,073
|
| Right size | n2 = | 670,243
|
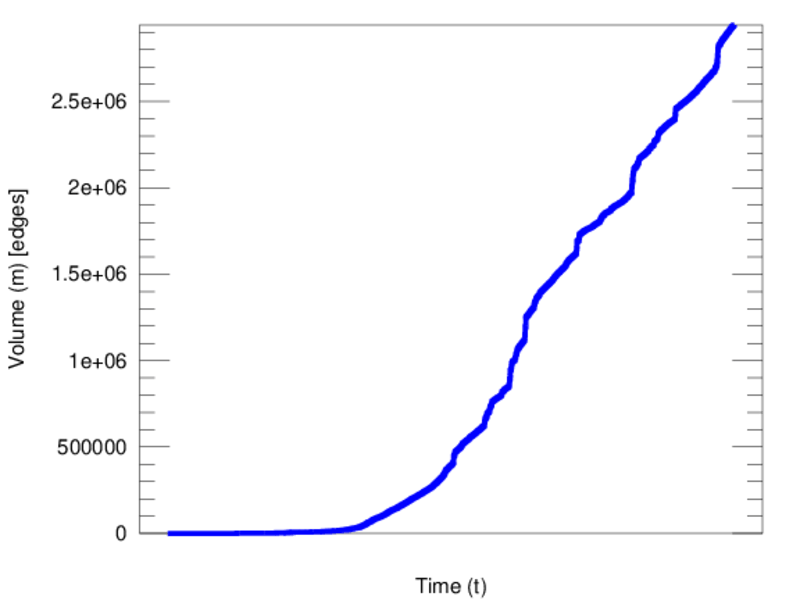
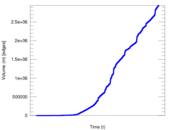
| Volume | m = | 2,942,630
|
| Unique edge count | m̿ = | 1,615,728
|
| Wedge count | s = | 56,167,534,322
|
| Cross count | x = | 1.708 25 × 1020
|
| Square count | q = | 13,676,165,567
|
| 4-Tour count | T4 = | 334,083,932,984
|
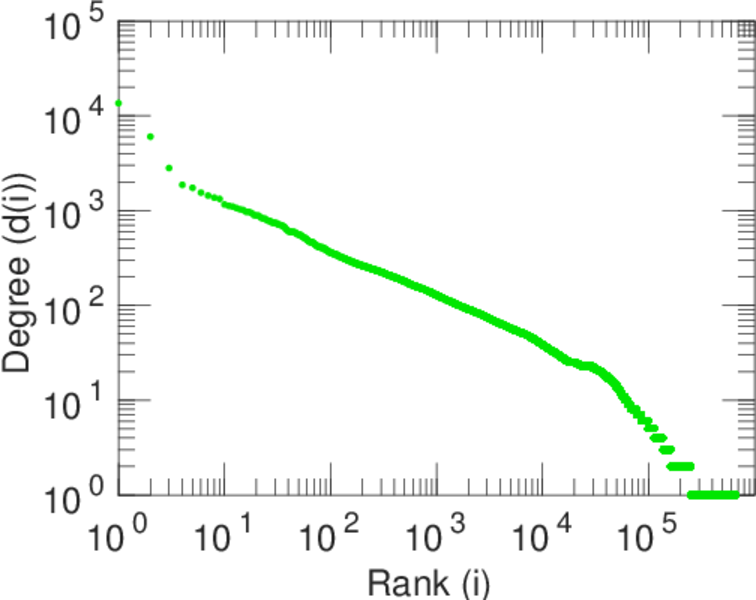
| Maximum degree | dmax = | 357,650
|
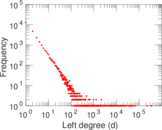
| Maximum left degree | d1max = | 357,650
|
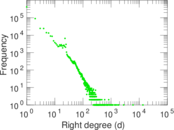
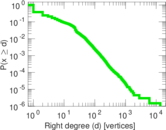
| Maximum right degree | d2max = | 13,570
|
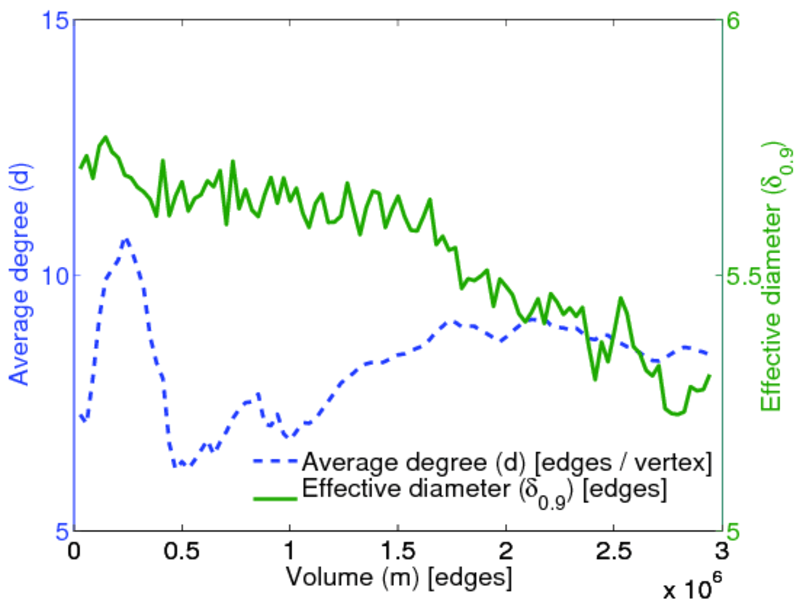
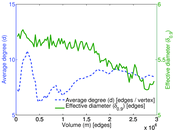
| Average degree | d = | 8.415 74
|
| Average left degree | d1 = | 101.215
|
| Average right degree | d2 = | 4.390 39
|
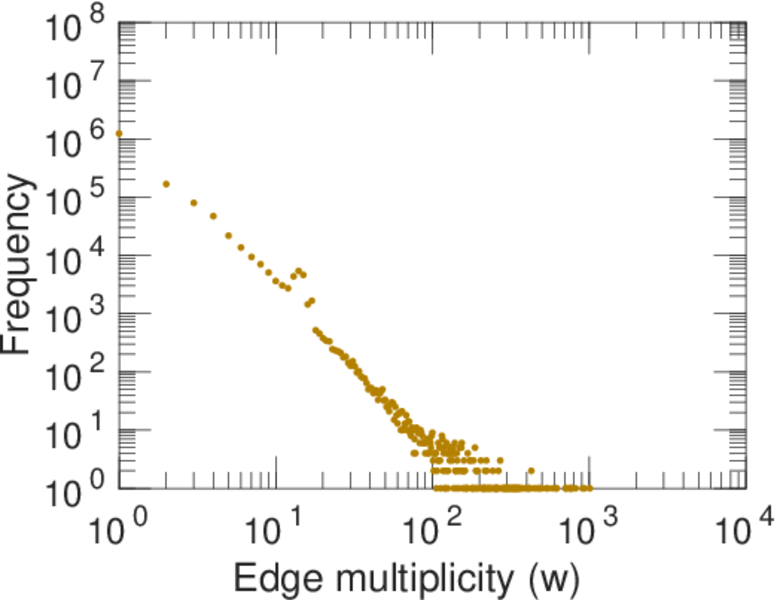
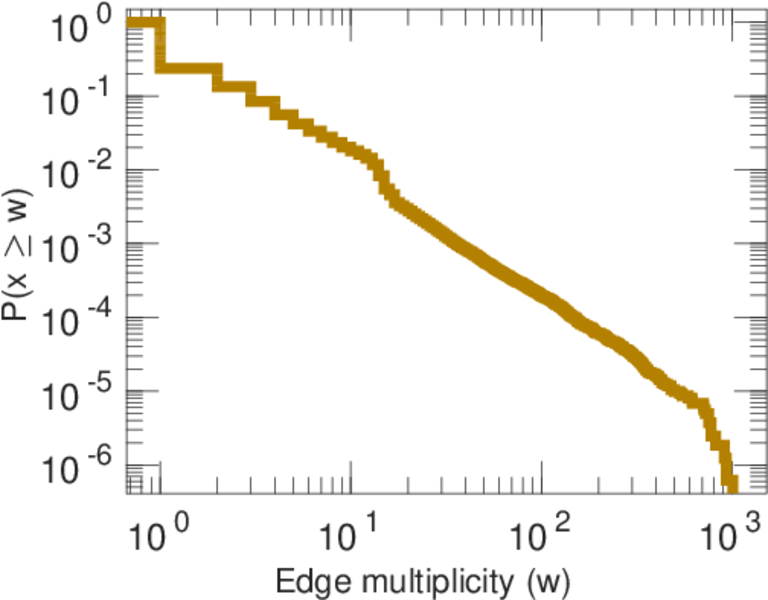
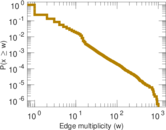
| Average edge multiplicity | m̃ = | 1.821 24
|
| Size of LCC | N = | 688,223
|
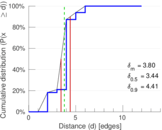
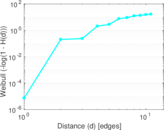
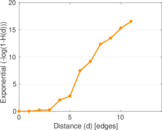
| Diameter | δ = | 15
|
| 50-Percentile effective diameter | δ0.5 = | 3.437 17
|
| 90-Percentile effective diameter | δ0.9 = | 4.414 02
|
| Median distance | δM = | 4
|
| Mean distance | δm = | 3.796 37
|
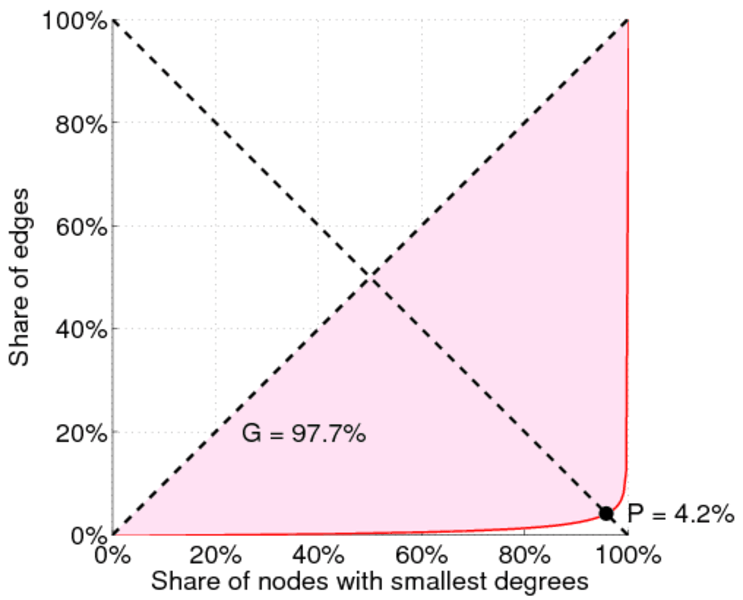
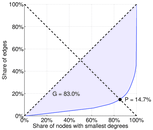
| Gini coefficient | G = | 0.835 703
|
| Balanced inequality ratio | P = | 0.144 880
|
| Left balanced inequality ratio | P1 = | 0.041 542 4
|
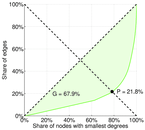
| Right balanced inequality ratio | P2 = | 0.217 580
|
| Relative edge distribution entropy | Her = | 0.697 560
|
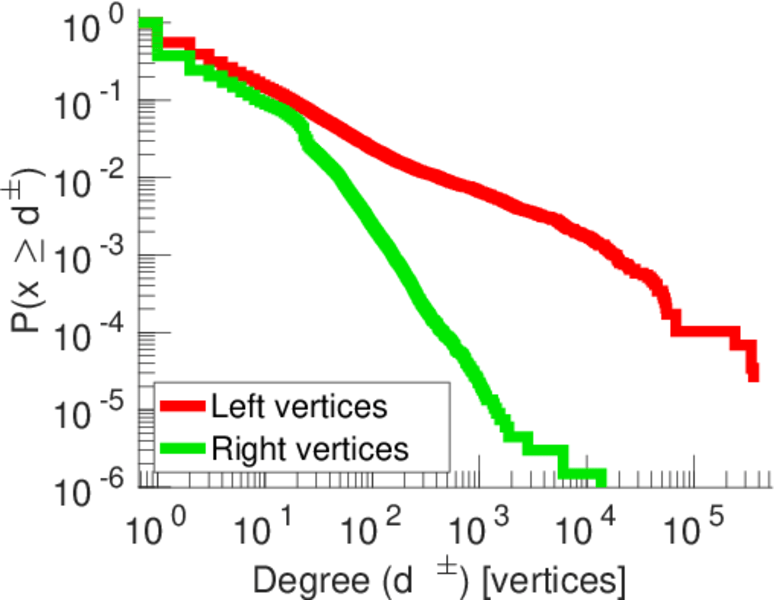
| Power law exponent | γ = | 3.247 10
|
| Tail power law exponent | γt = | 2.171 00
|
| Degree assortativity | ρ = | −0.230 550
|
| Degree assortativity p-value | pρ = | 0.000 00
|
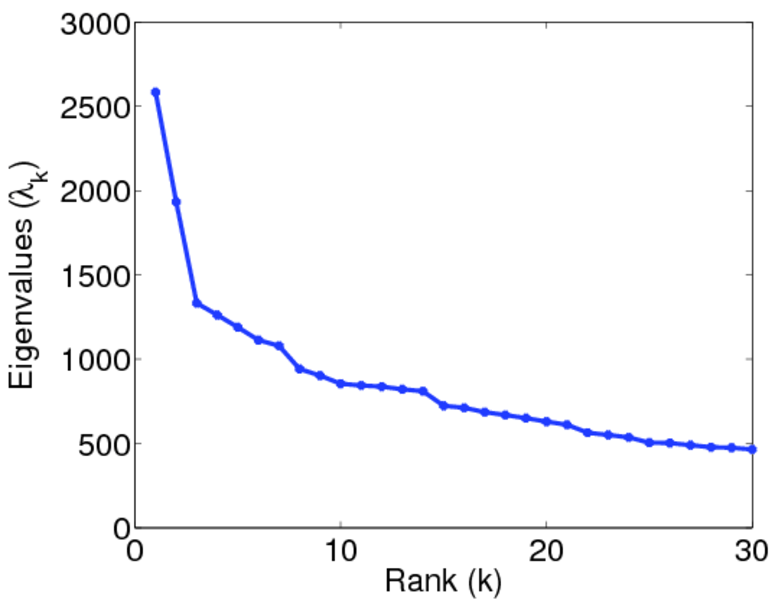
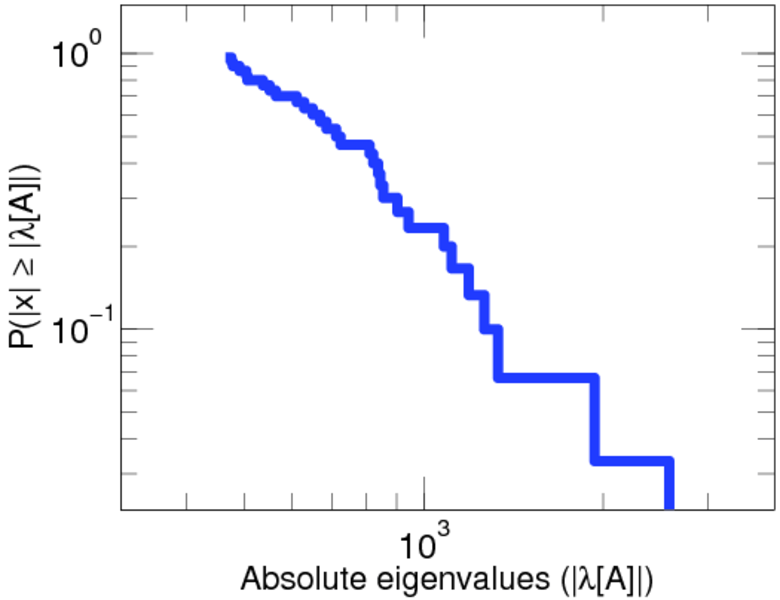
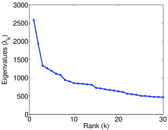
| Spectral norm | α = | 2,584.31
|
| Algebraic connectivity | a = | 0.018 266 4
|
| Controllability | C = | 656,159
|
| Relative controllability | Cr = | 0.941 718
|
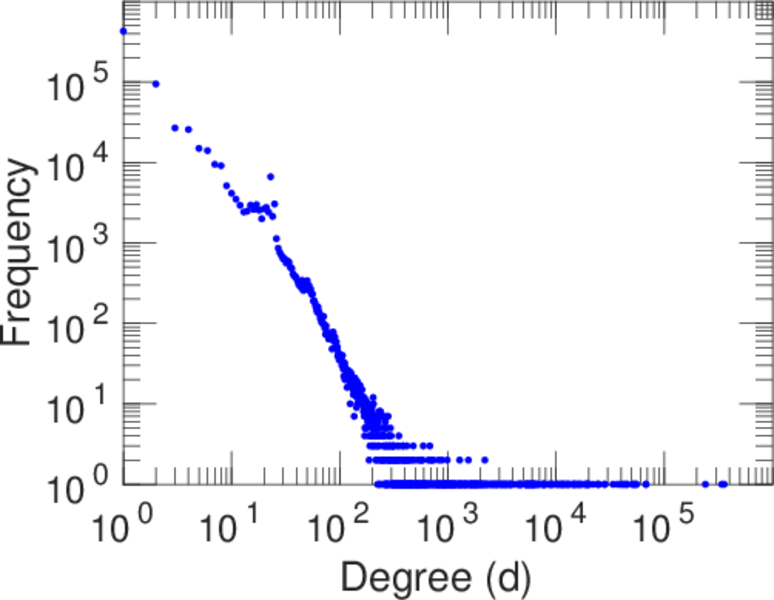
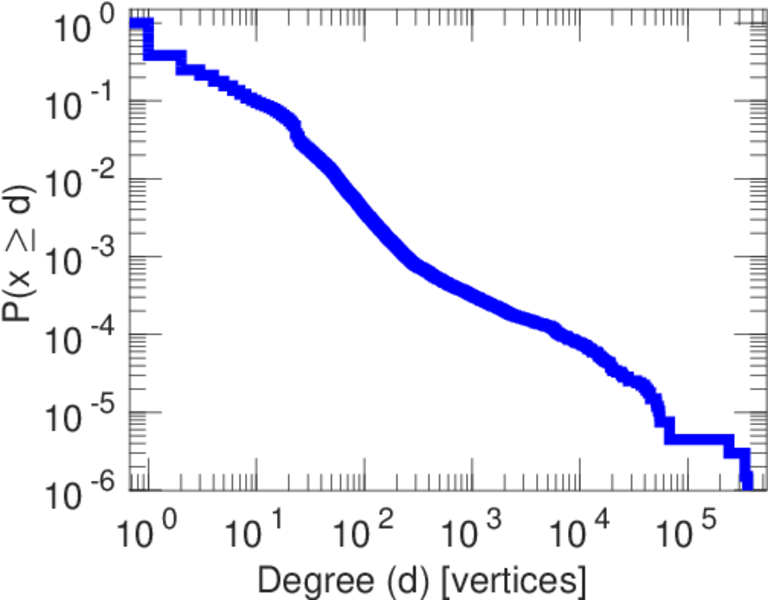
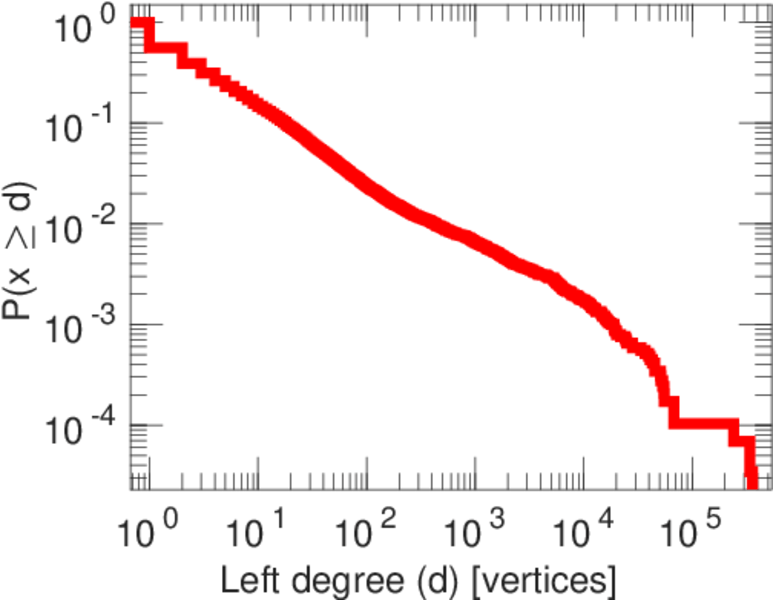
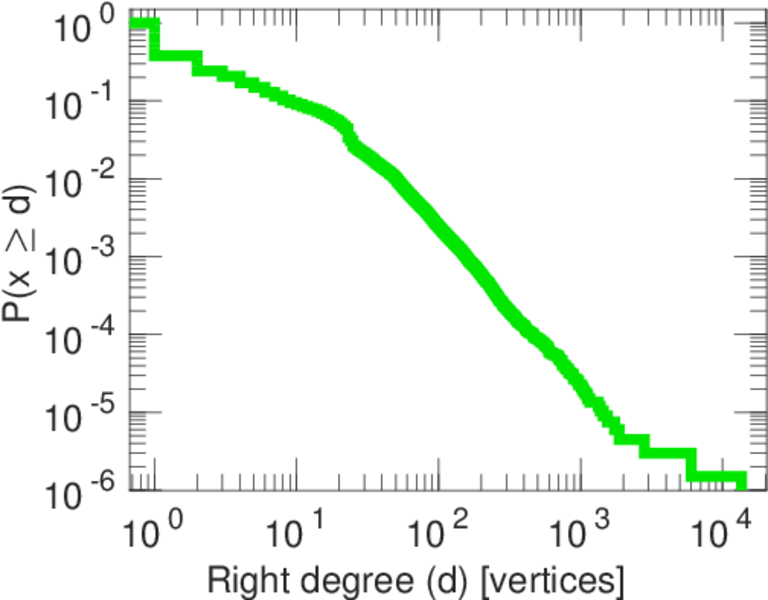
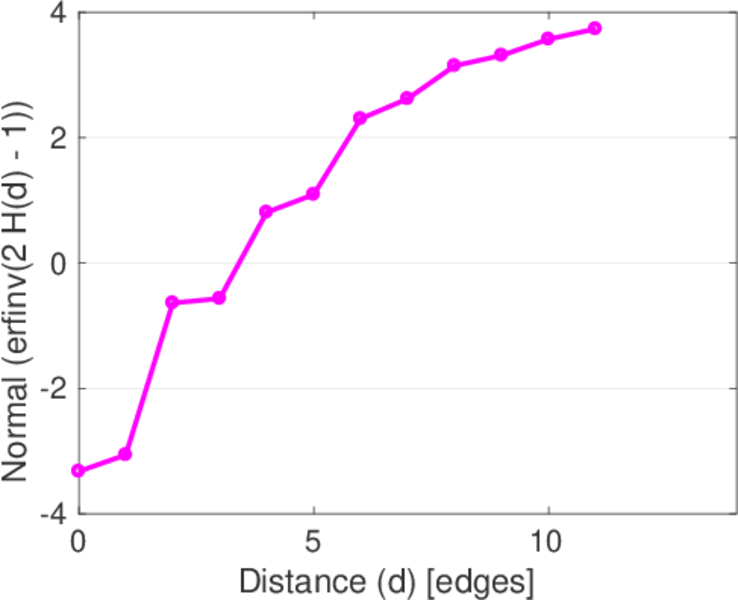
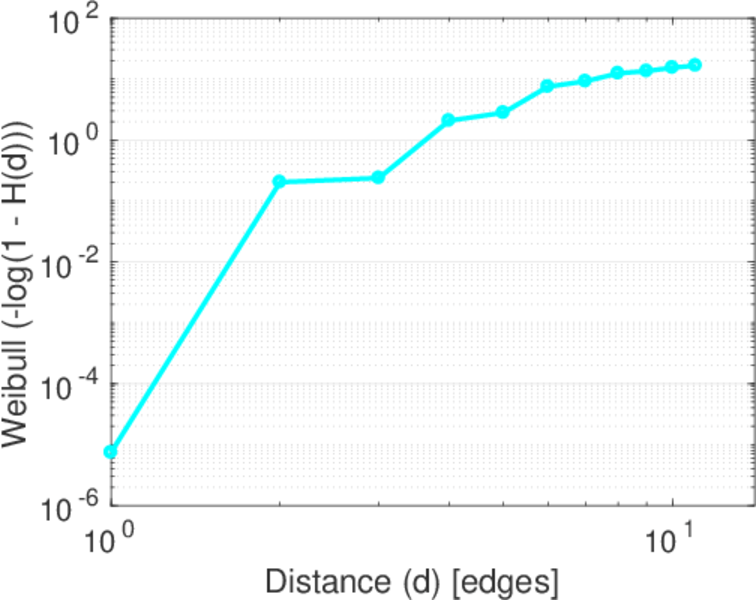
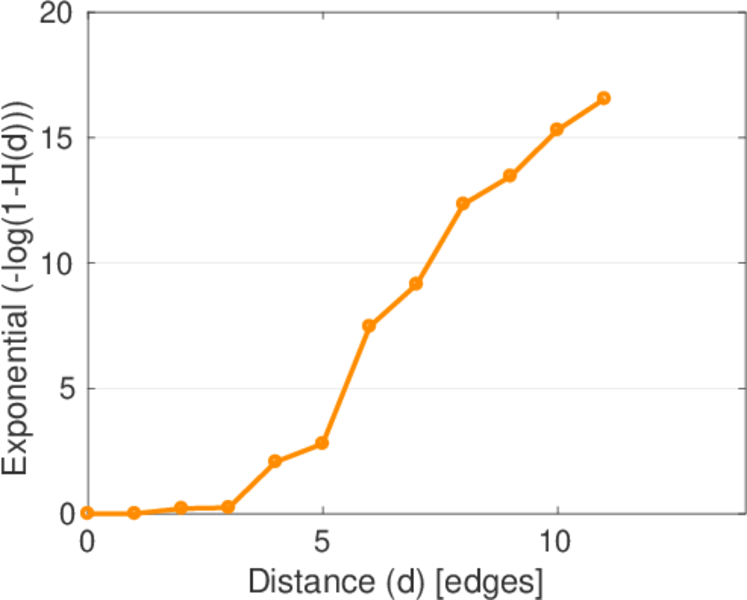
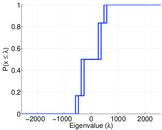
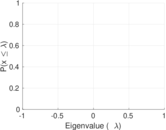
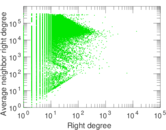
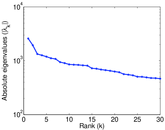
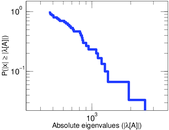
Plots


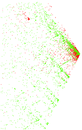


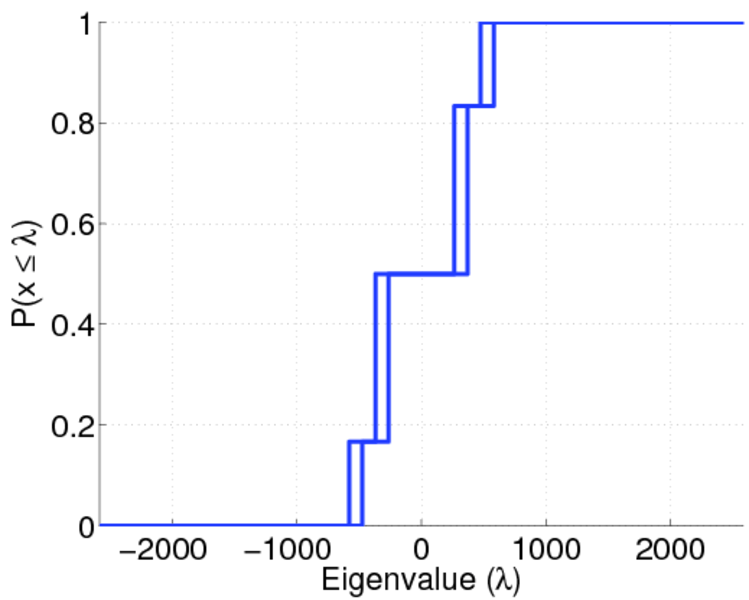
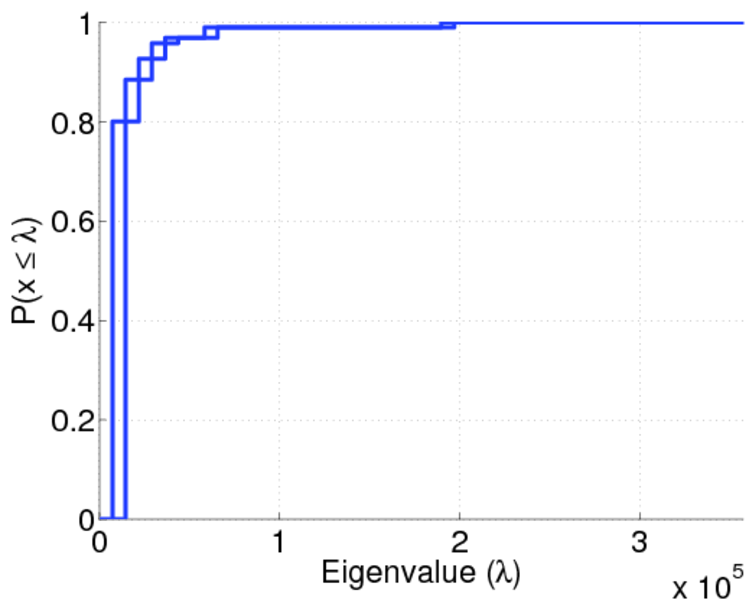
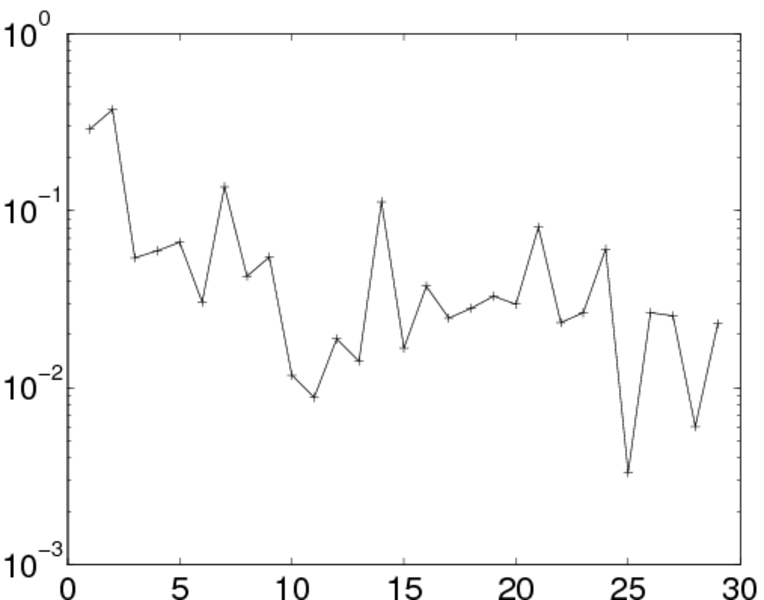
Matrix decompositions plots
Downloads
References
|
[1]
|
Jérôme Kunegis.
KONECT – The Koblenz Network Collection.
In Proc. Int. Conf. on World Wide Web Companion, pages
1343–1350, 2013.
[ http ]
|
|
[2]
|
Wikimedia Foundation.
Wikimedia downloads.
http://dumps.wikimedia.org/, January 2010.
|
 KONECT ‣ Networks ‣
Buy Me a Coffee
KONECT ‣ Networks ‣
Buy Me a Coffee