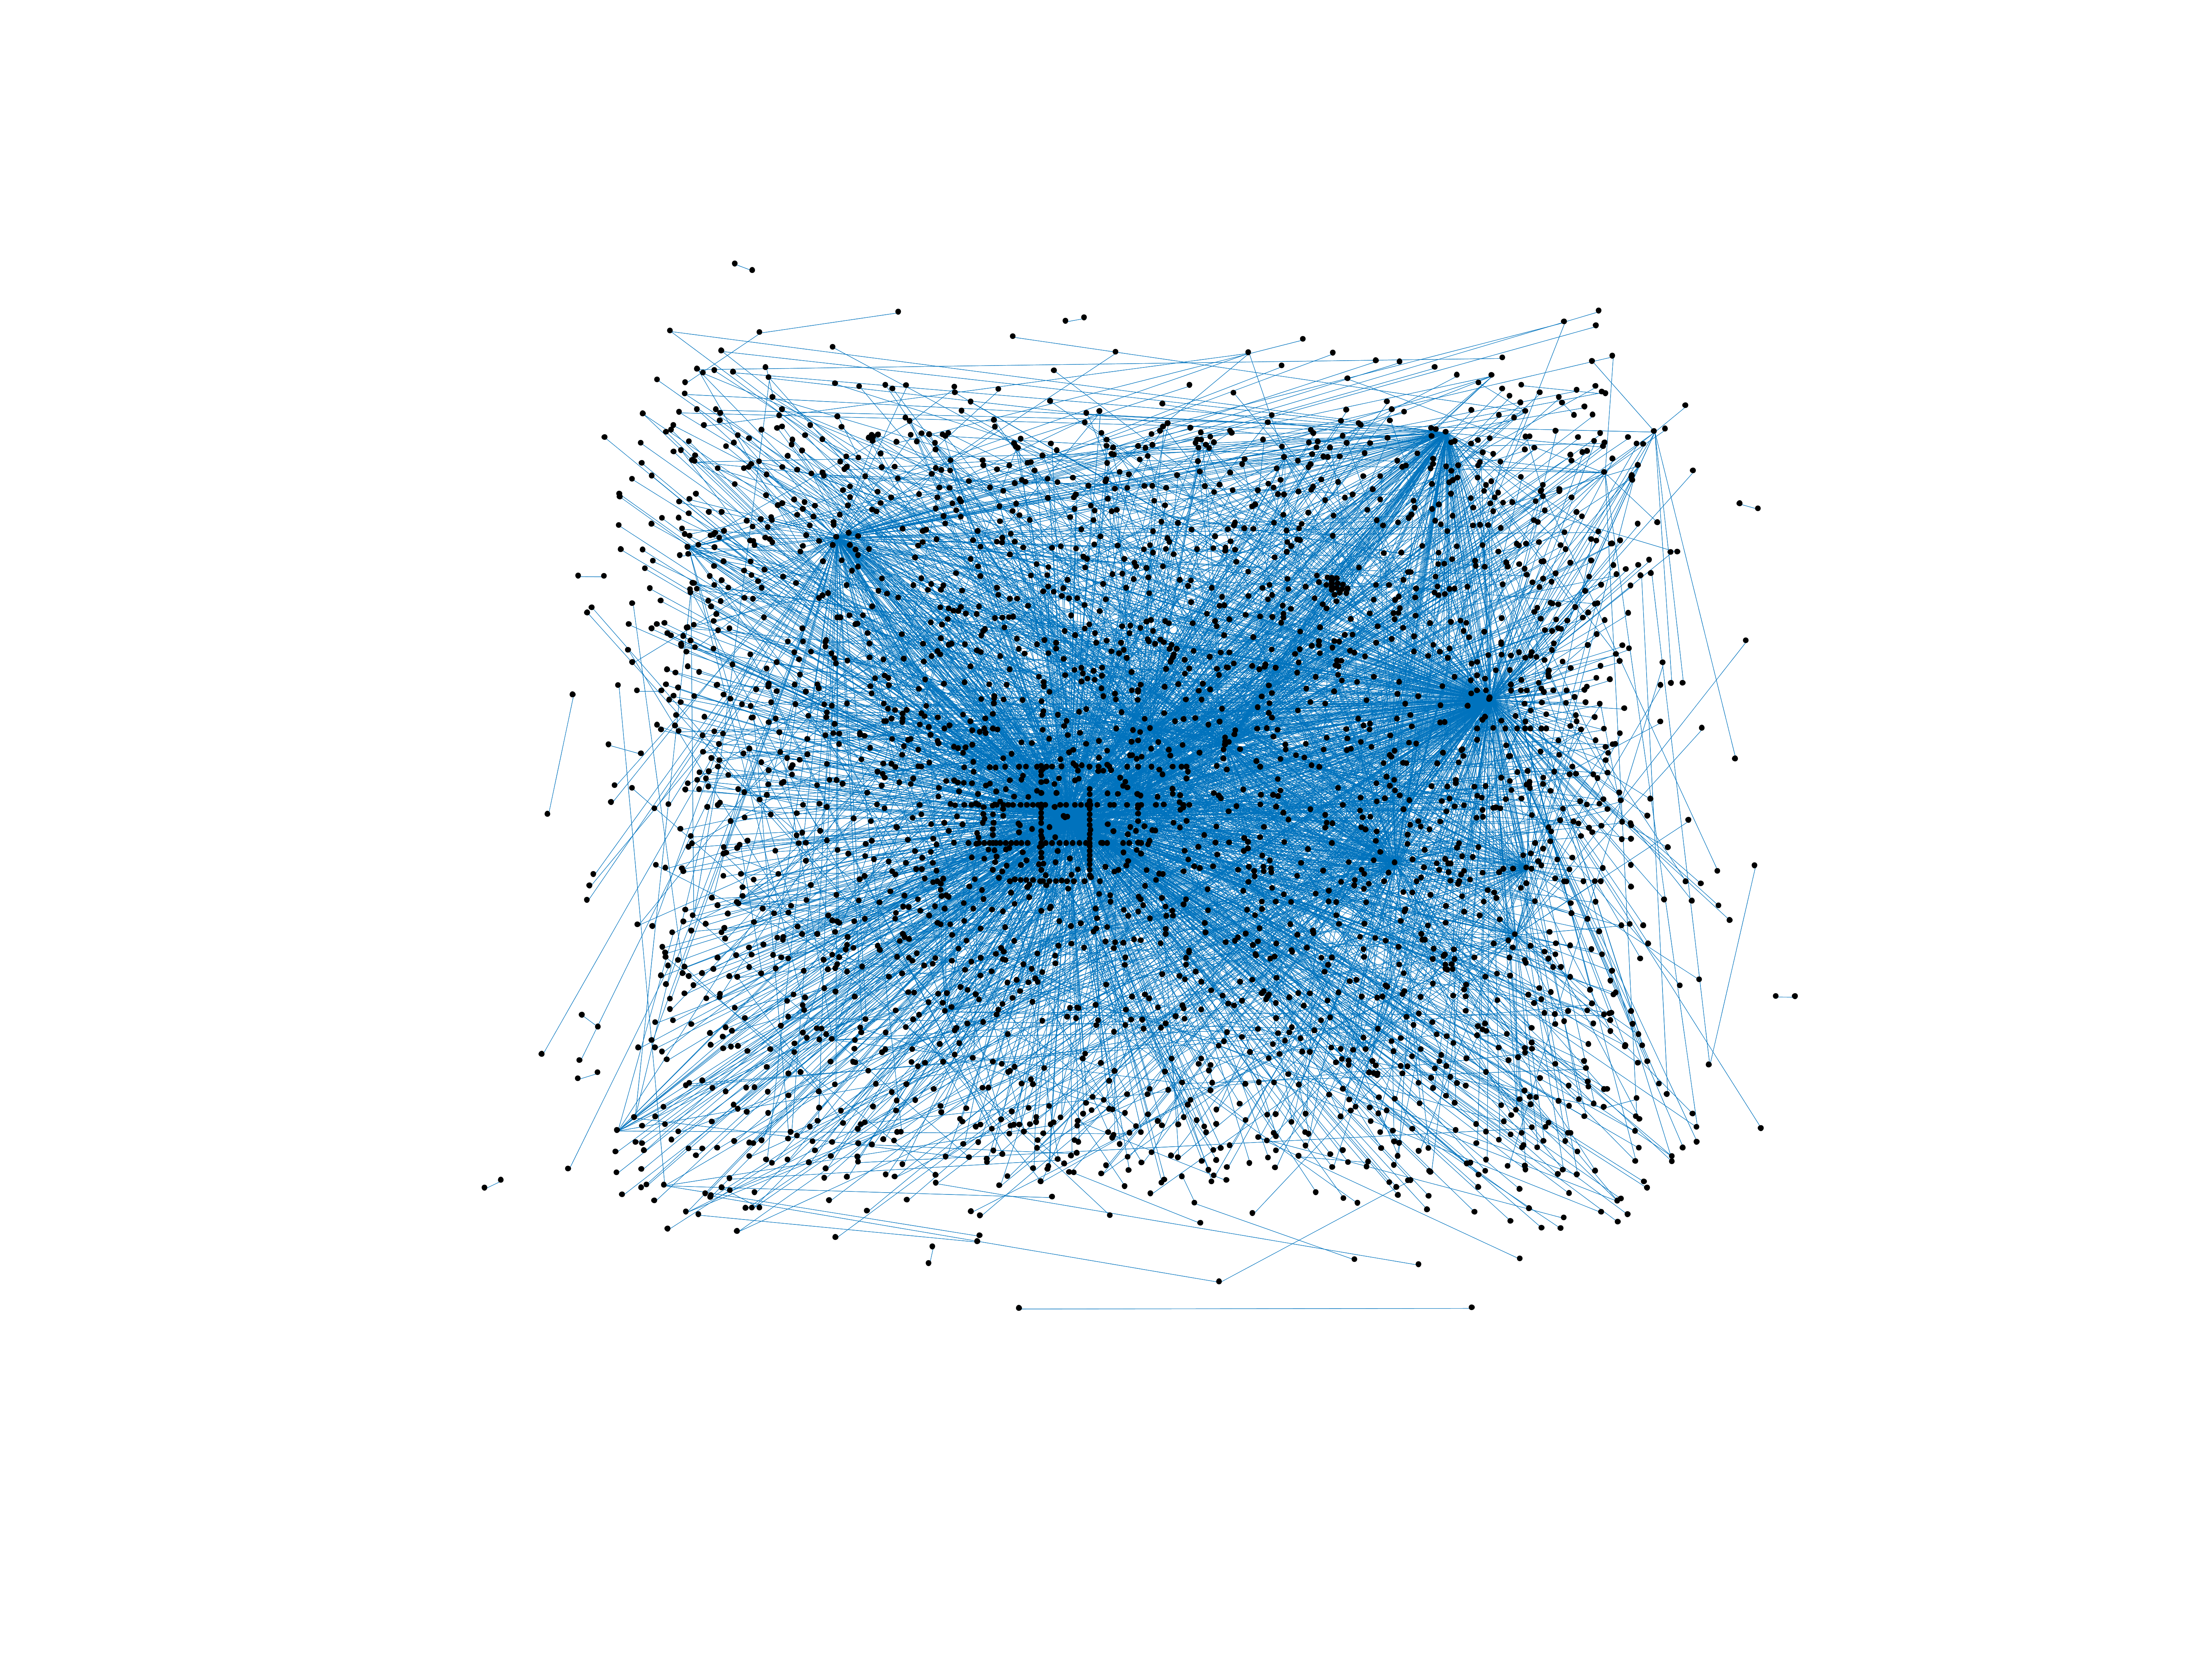
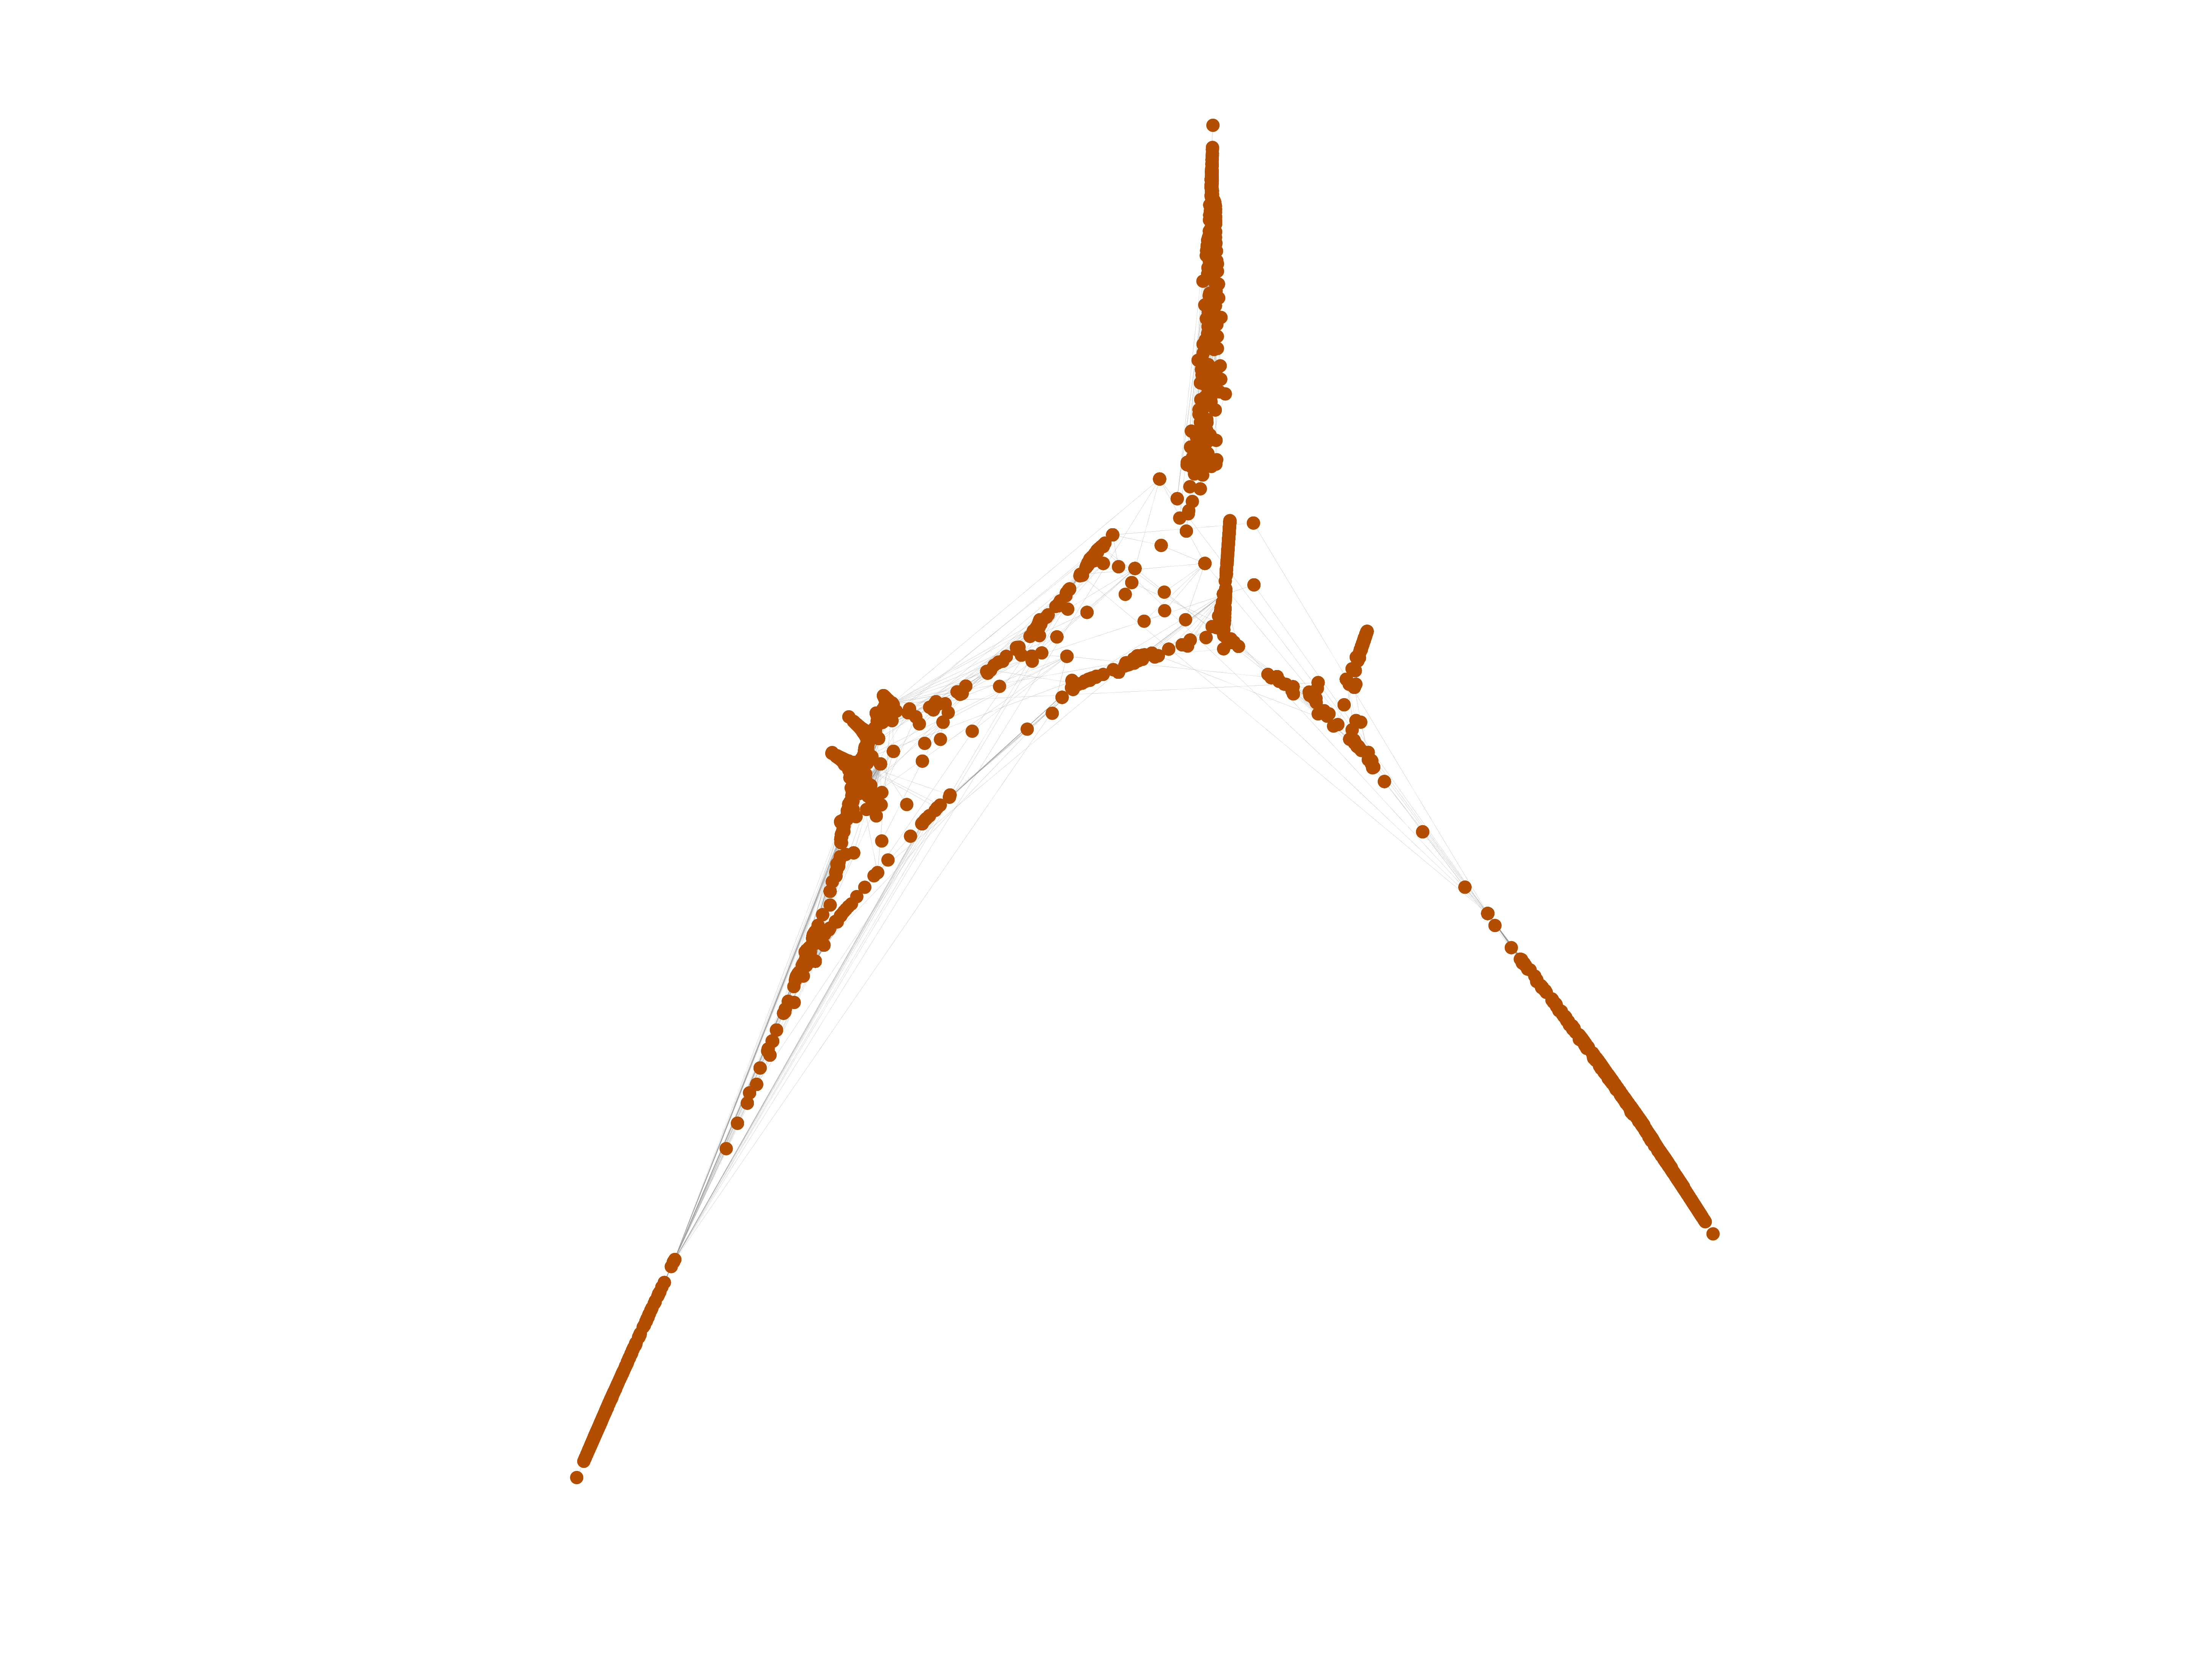
Wikibooks edits (hi)
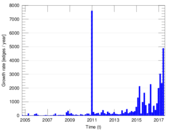
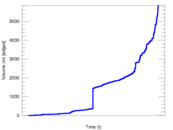
This is the bipartite edit network of the Hindi Wikibooks. It contains users
and pages from the Hindi Wikibooks, connected by edit events. Each edge
represents an edit. The dataset includes the timestamp of each edit.
Metadata
Statistics
| Size | n = | 3,189
|
| Left size | n1 = | 299
|
| Right size | n2 = | 2,890
|
| Volume | m = | 5,850
|
| Unique edge count | m̿ = | 3,286
|
| Wedge count | s = | 609,852
|
| Claw count | z = | 145,629,247
|
| Cross count | x = | 30,593,373,586
|
| Square count | q = | 11,933
|
| 4-Tour count | T4 = | 2,541,640
|
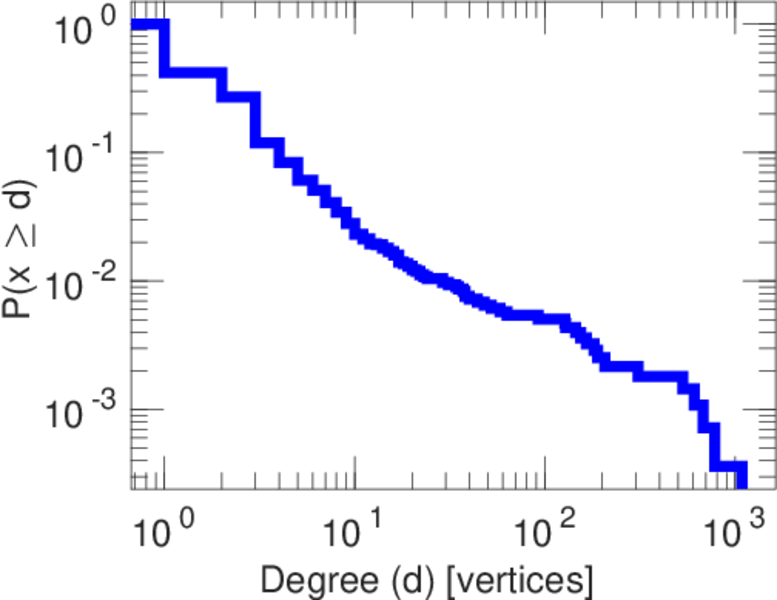
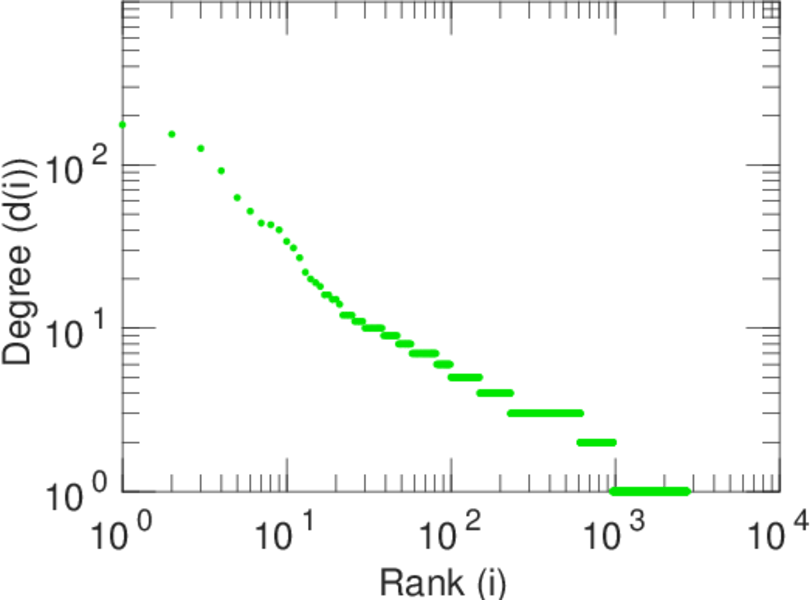
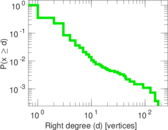
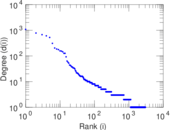
| Maximum degree | dmax = | 1,080
|
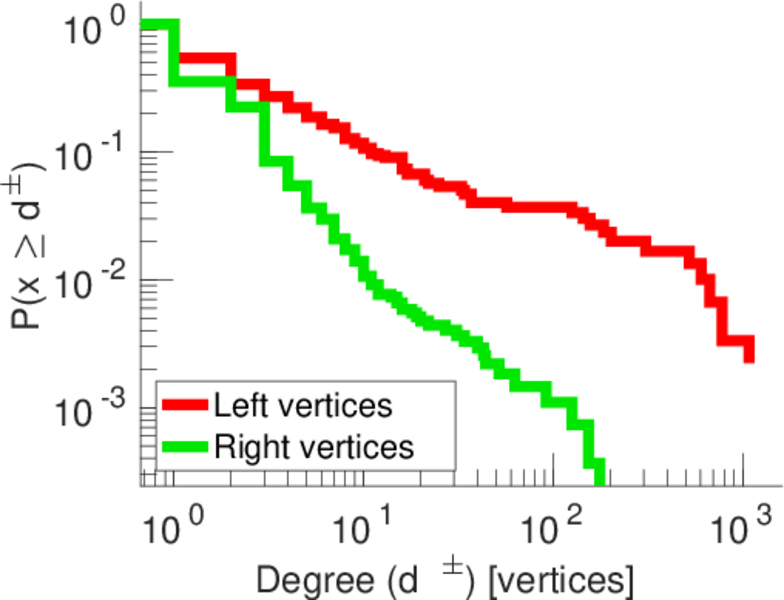
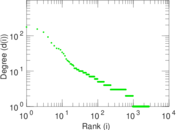
| Maximum left degree | d1max = | 1,080
|
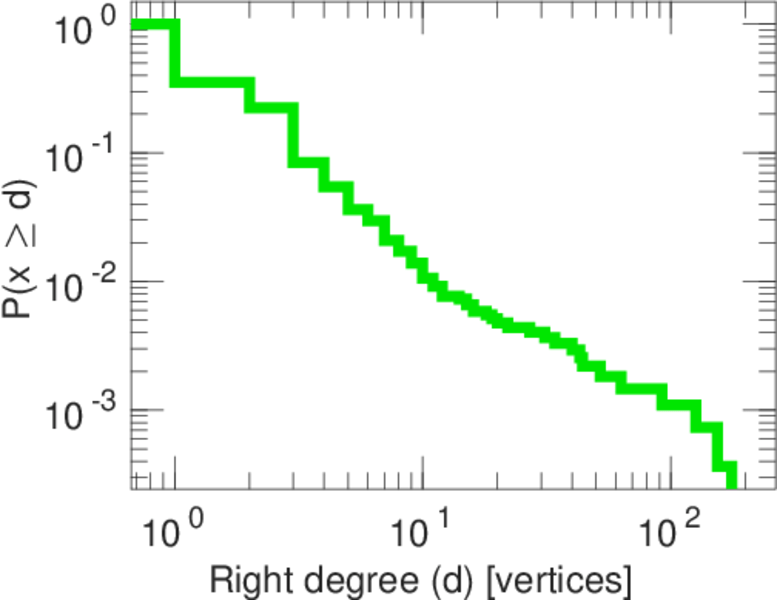
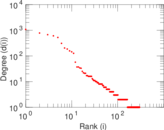
| Maximum right degree | d2max = | 176
|
| Average degree | d = | 3.668 86
|
| Average left degree | d1 = | 19.565 2
|
| Average right degree | d2 = | 2.024 22
|
| Fill | p = | 0.003 802 76
|
| Average edge multiplicity | m̃ = | 1.780 28
|
| Size of LCC | N = | 2,713
|
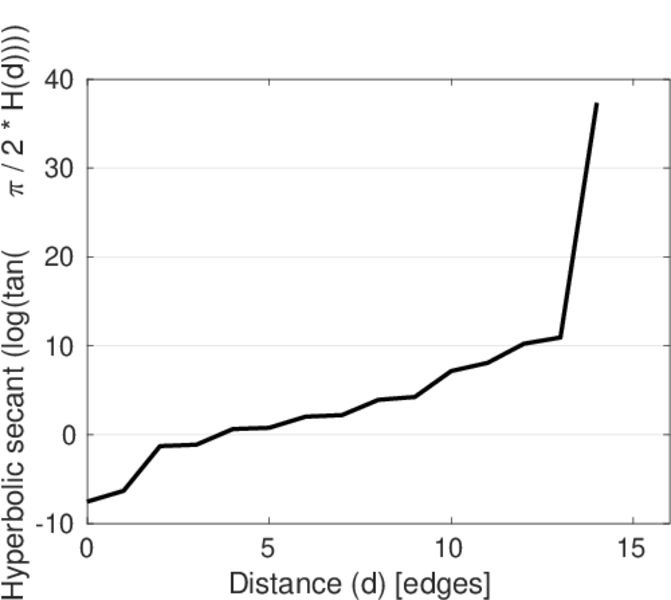
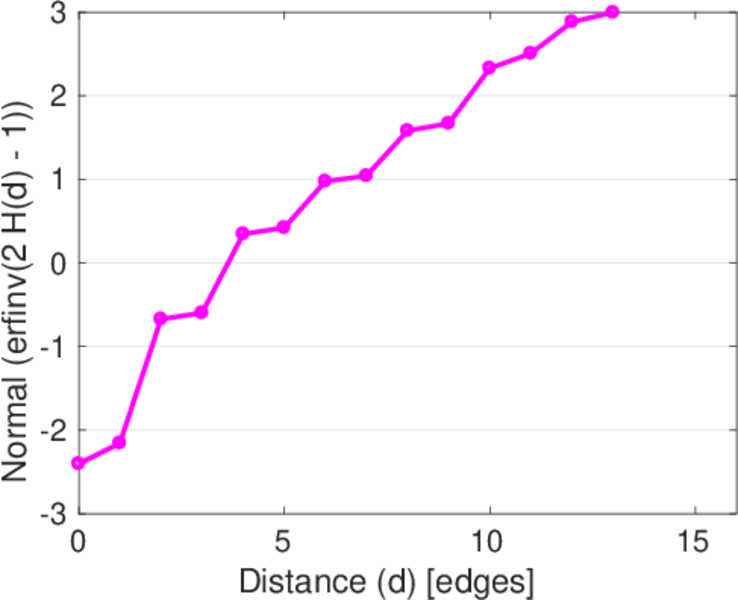
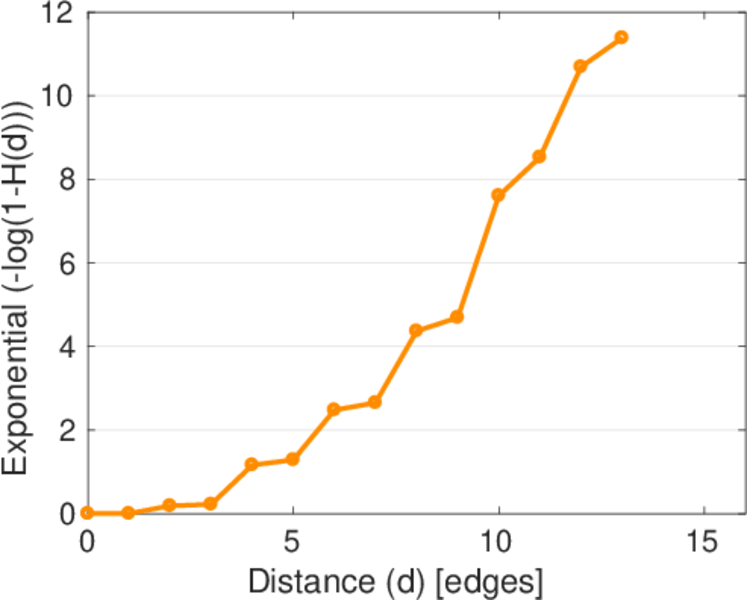
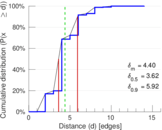
| Diameter | δ = | 15
|
| 50-Percentile effective diameter | δ0.5 = | 3.617 13
|
| 90-Percentile effective diameter | δ0.9 = | 5.916 12
|
| Median distance | δM = | 4
|
| Mean distance | δm = | 4.395 83
|
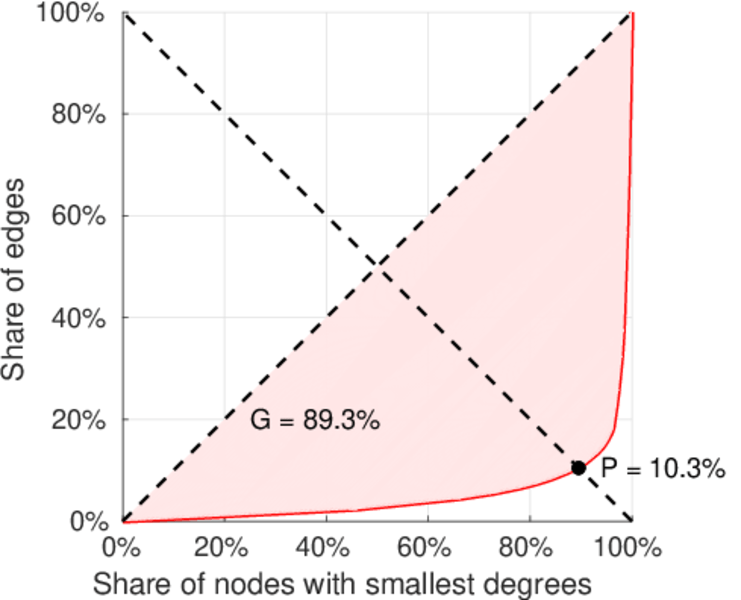
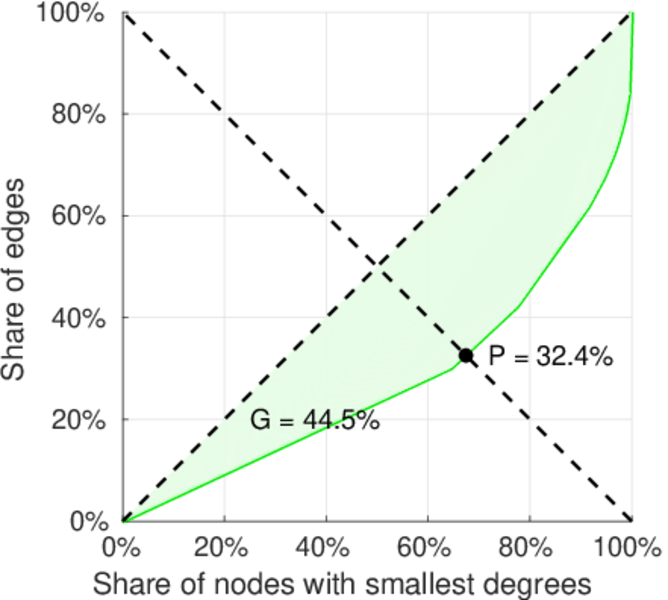
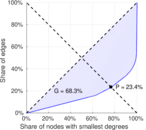
| Gini coefficient | G = | 0.694 660
|
| Balanced inequality ratio | P = | 0.232 991
|
| Left balanced inequality ratio | P1 = | 0.103 077
|
| Right balanced inequality ratio | P2 = | 0.324 103
|
| Relative edge distribution entropy | Her = | 0.774 176
|
| Power law exponent | γ = | 6.825 72
|
| Tail power law exponent | γt = | 2.961 00
|
| Tail power law exponent with p | γ3 = | 2.961 00
|
| p-value | p = | 0.000 00
|
| Left tail power law exponent with p | γ3,1 = | 1.911 00
|
| Left p-value | p1 = | 0.090 000 0
|
| Right tail power law exponent with p | γ3,2 = | 3.331 00
|
| Right p-value | p2 = | 0.000 00
|
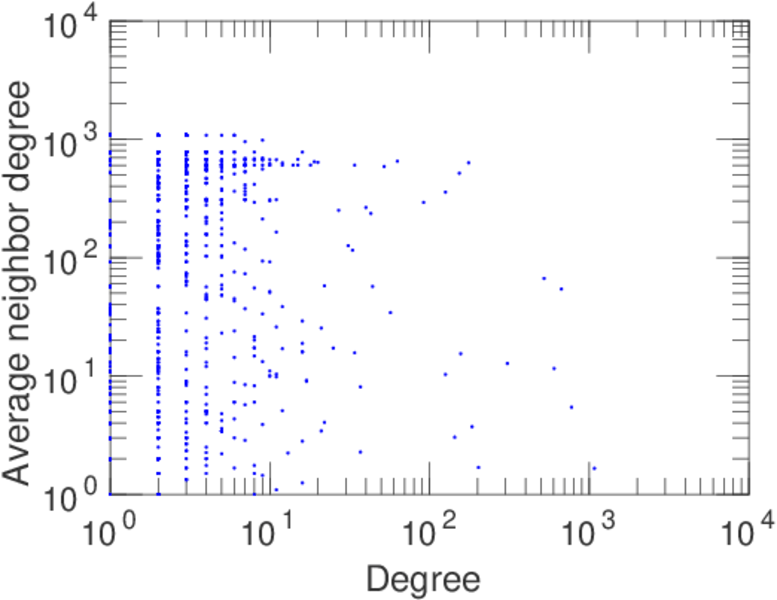
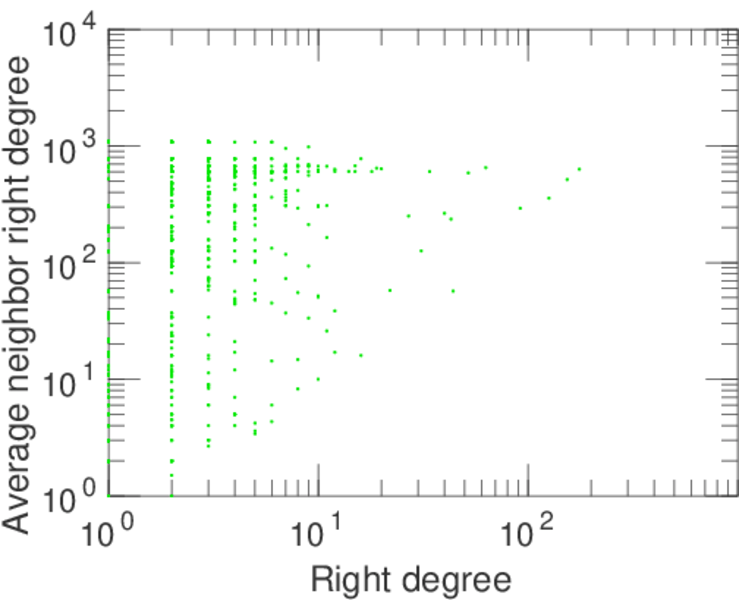
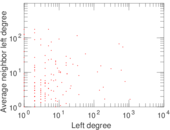
| Degree assortativity | ρ = | −0.239 062
|
| Degree assortativity p-value | pρ = | 6.273 24 × 10−44
|
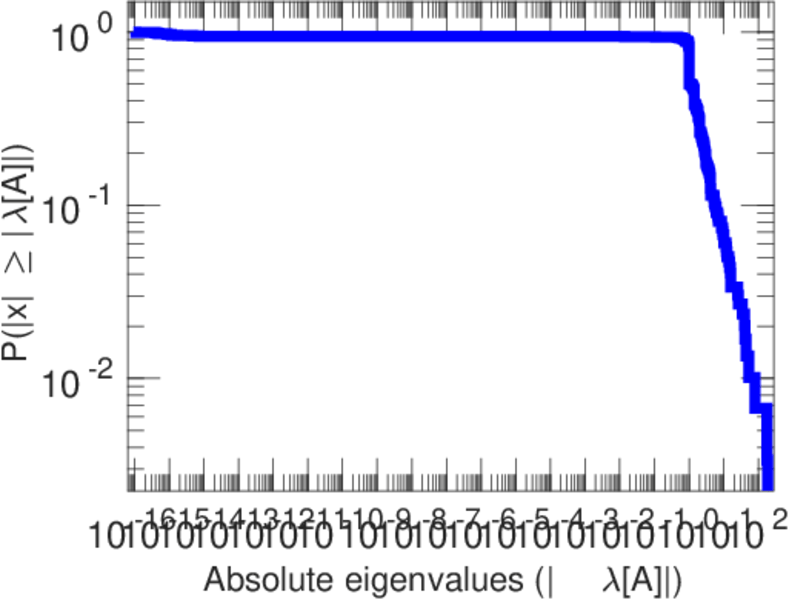
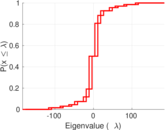
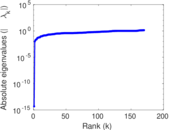
| Spectral norm | α = | 184.030
|
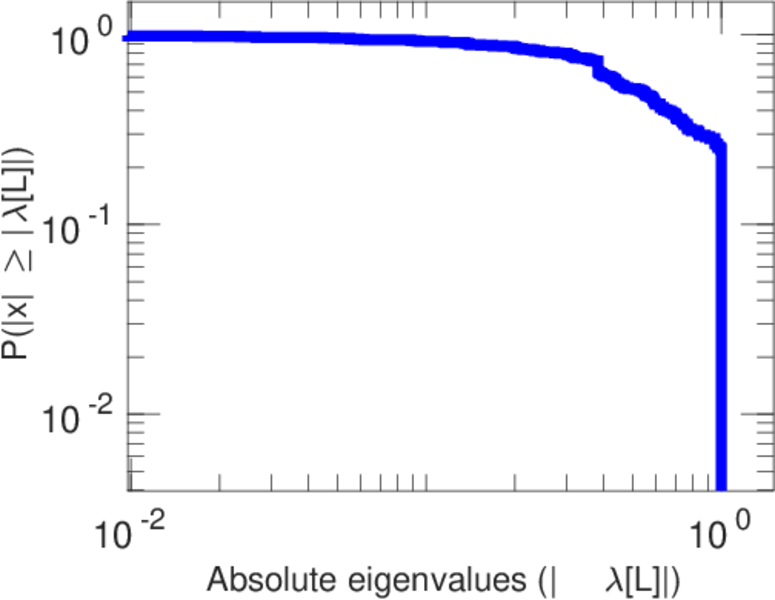
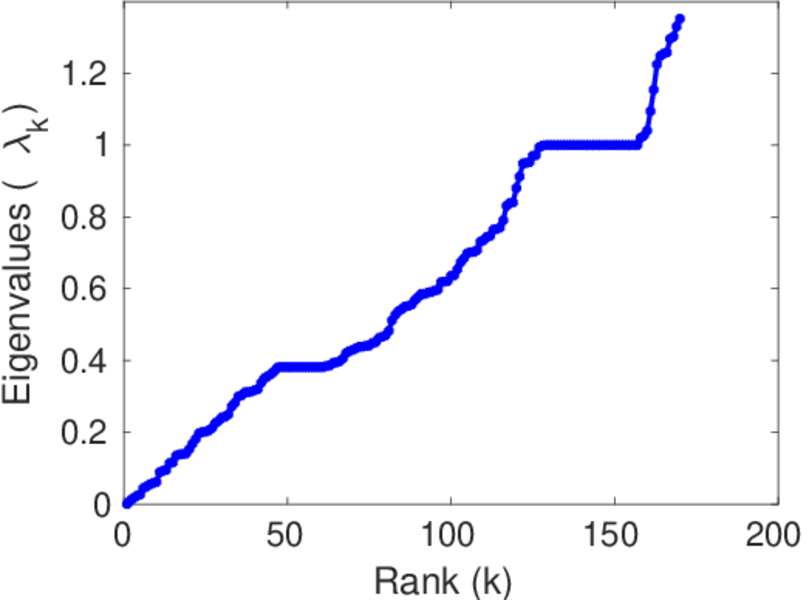
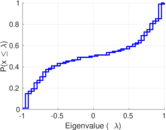
| Algebraic connectivity | a = | 0.009 760 09
|
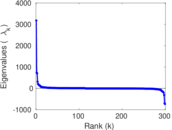
| Spectral separation | |λ1[A] / λ2[A]| = | 1.046 02
|
| Controllability | C = | 2,469
|
| Relative controllability | Cr = | 0.815 121
|
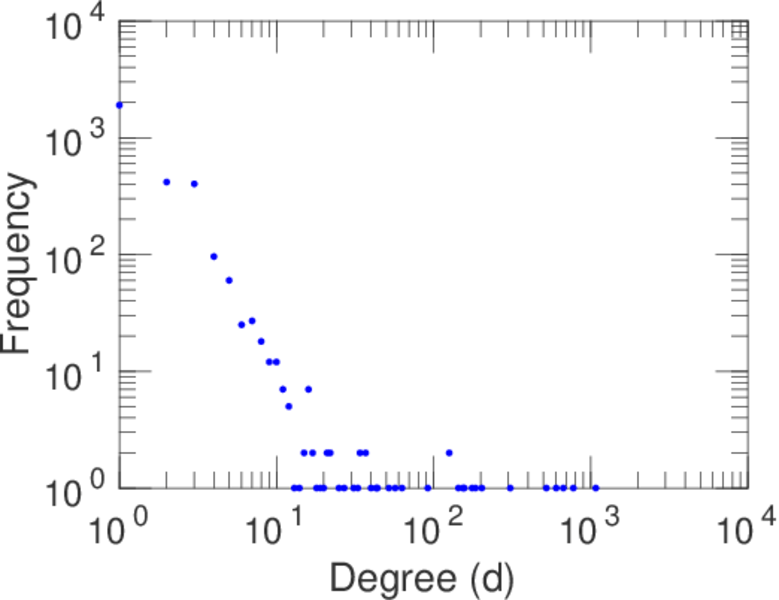
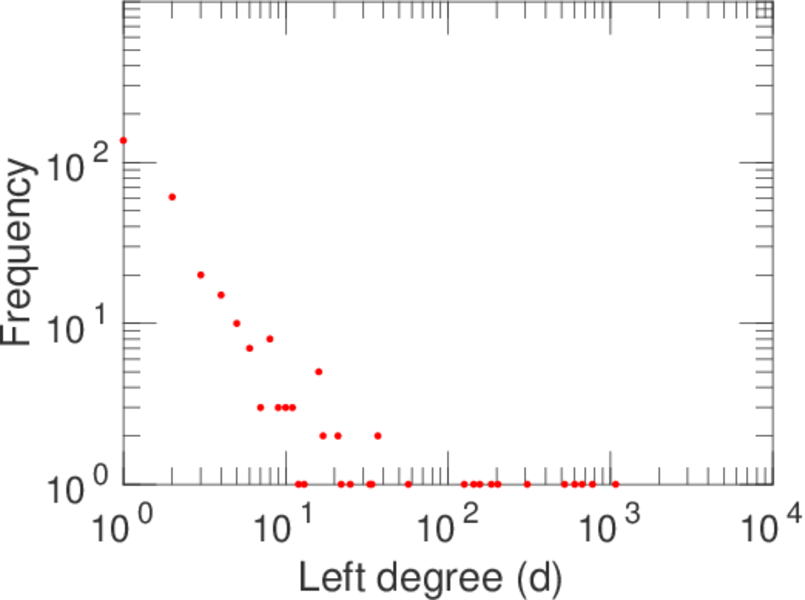
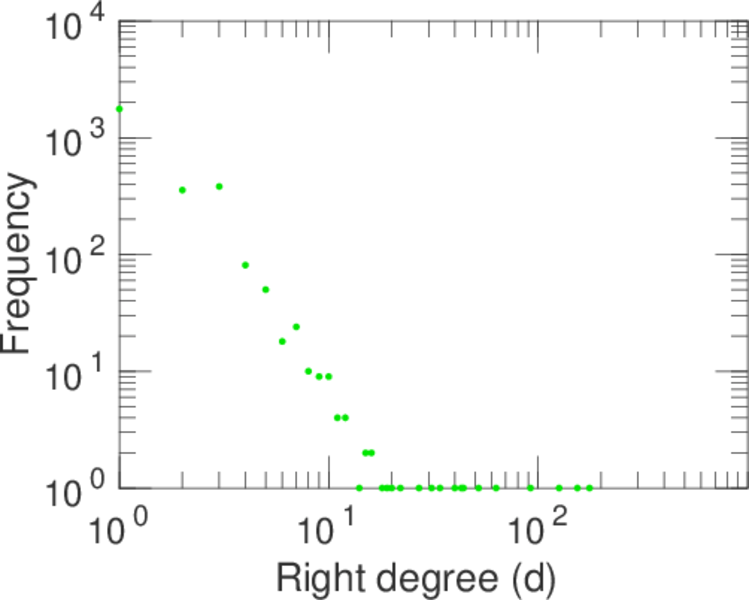
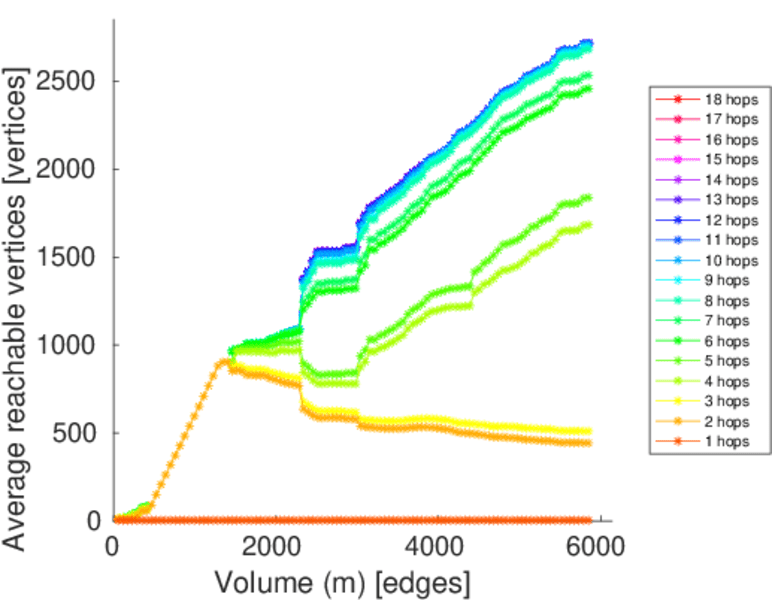
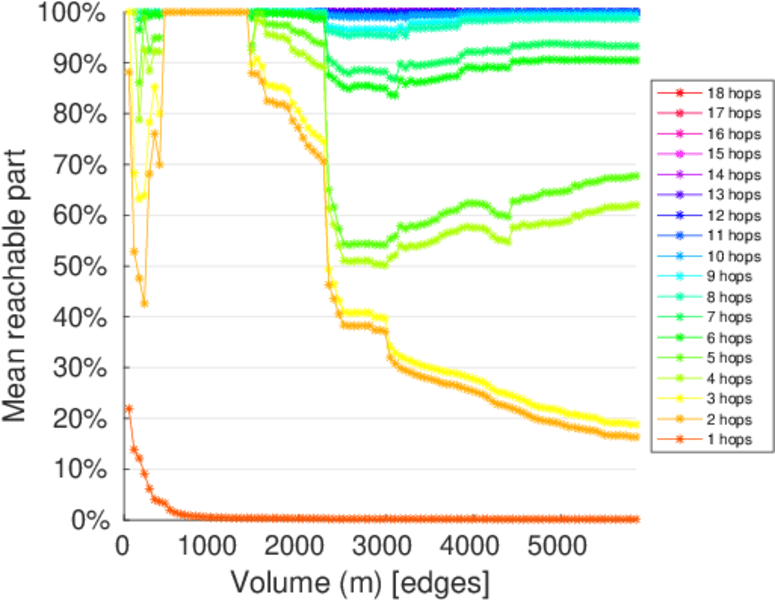
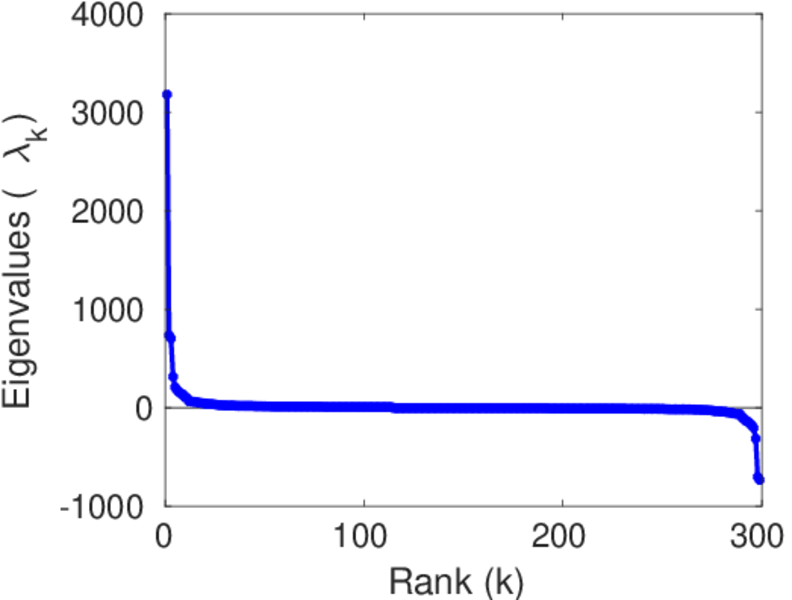
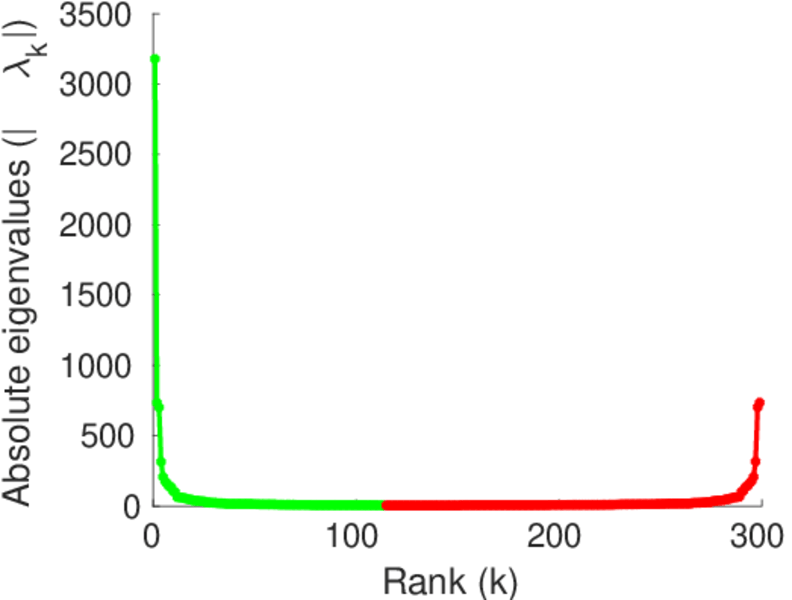
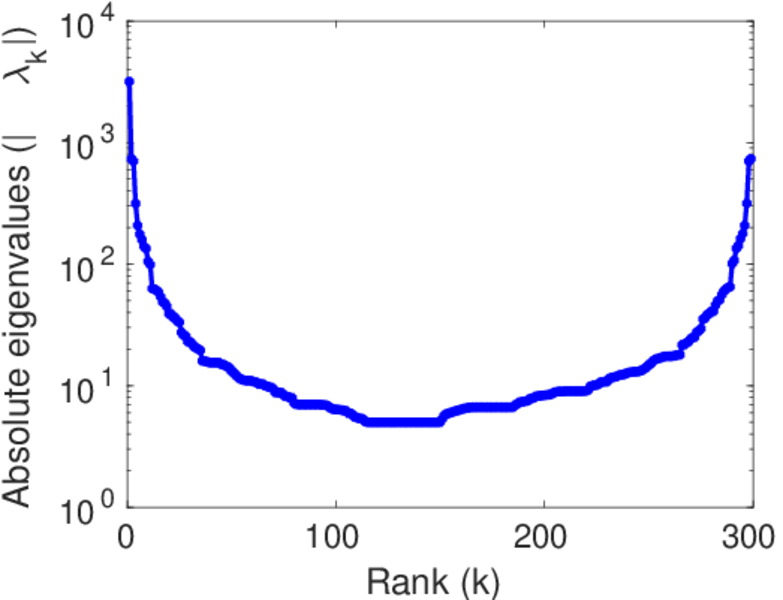
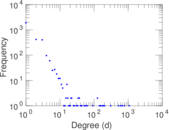
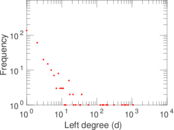
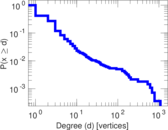
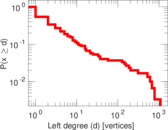
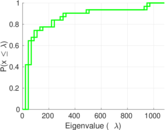
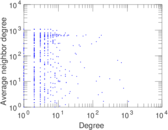
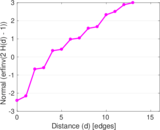
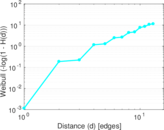
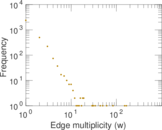
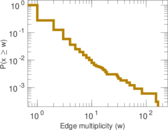
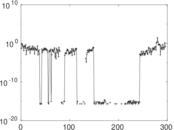
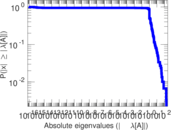
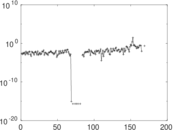
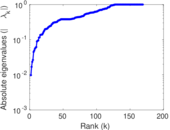
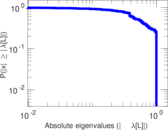
Plots


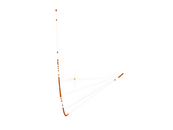
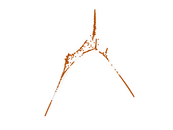


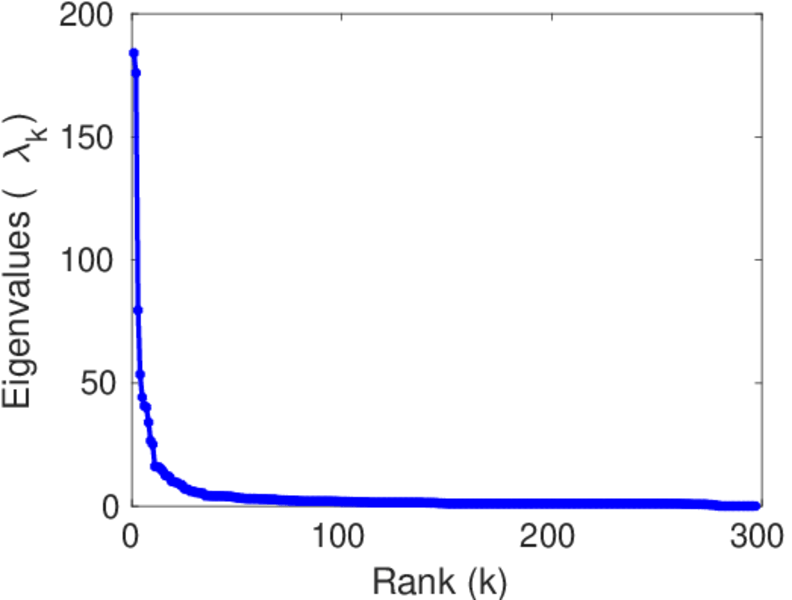
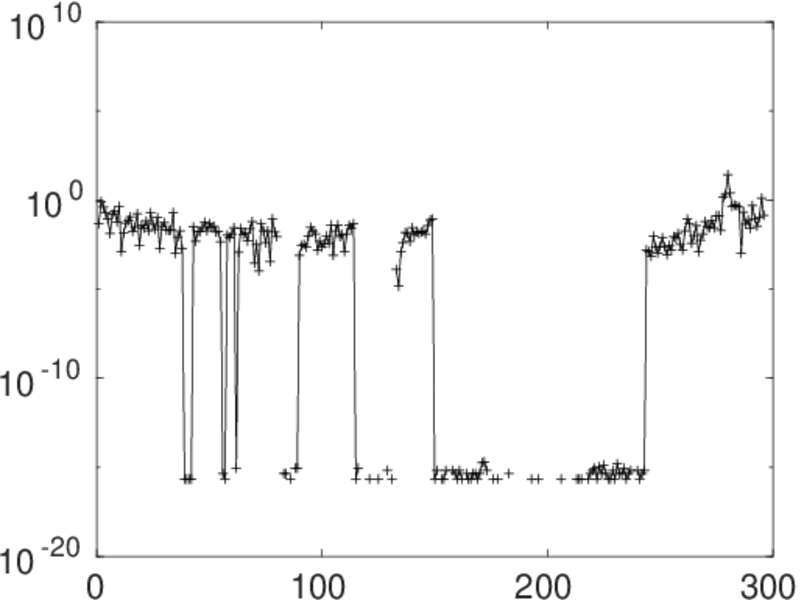
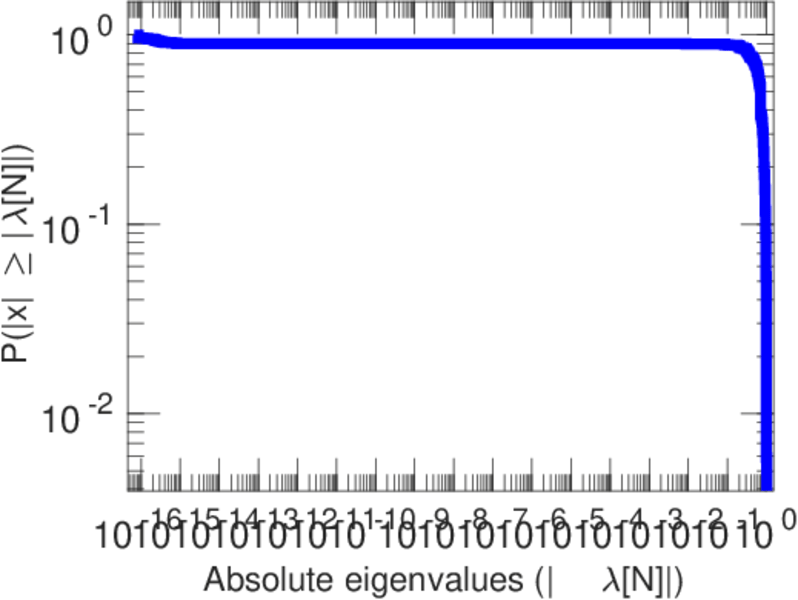
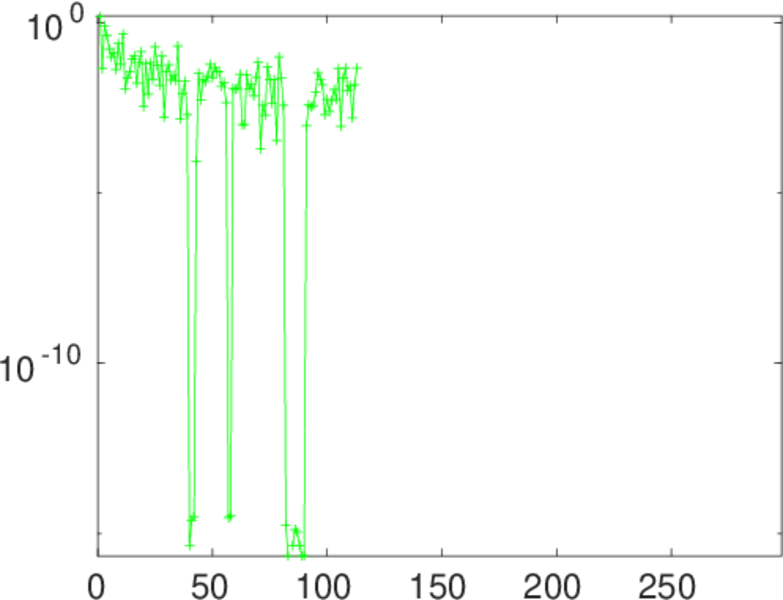
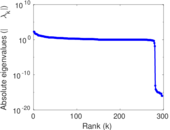
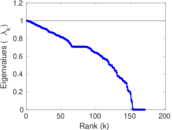
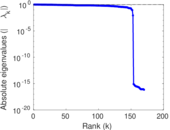
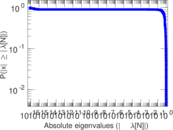
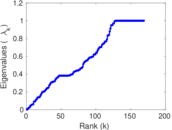
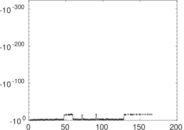
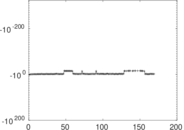
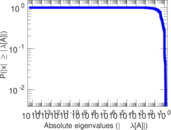
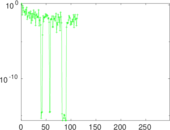
Matrix decompositions plots


Downloads
References
|
[1]
|
Jérôme Kunegis.
KONECT – The Koblenz Network Collection.
In Proc. Int. Conf. on World Wide Web Companion, pages
1343–1350, 2013.
[ http ]
|
|
[2]
|
Wikimedia Foundation.
Wikimedia downloads.
http://dumps.wikimedia.org/, January 2010.
|
 KONECT ‣ Networks ‣
Buy Me a Coffee
KONECT ‣ Networks ‣
Buy Me a Coffee