Wikiquote edits (hi)
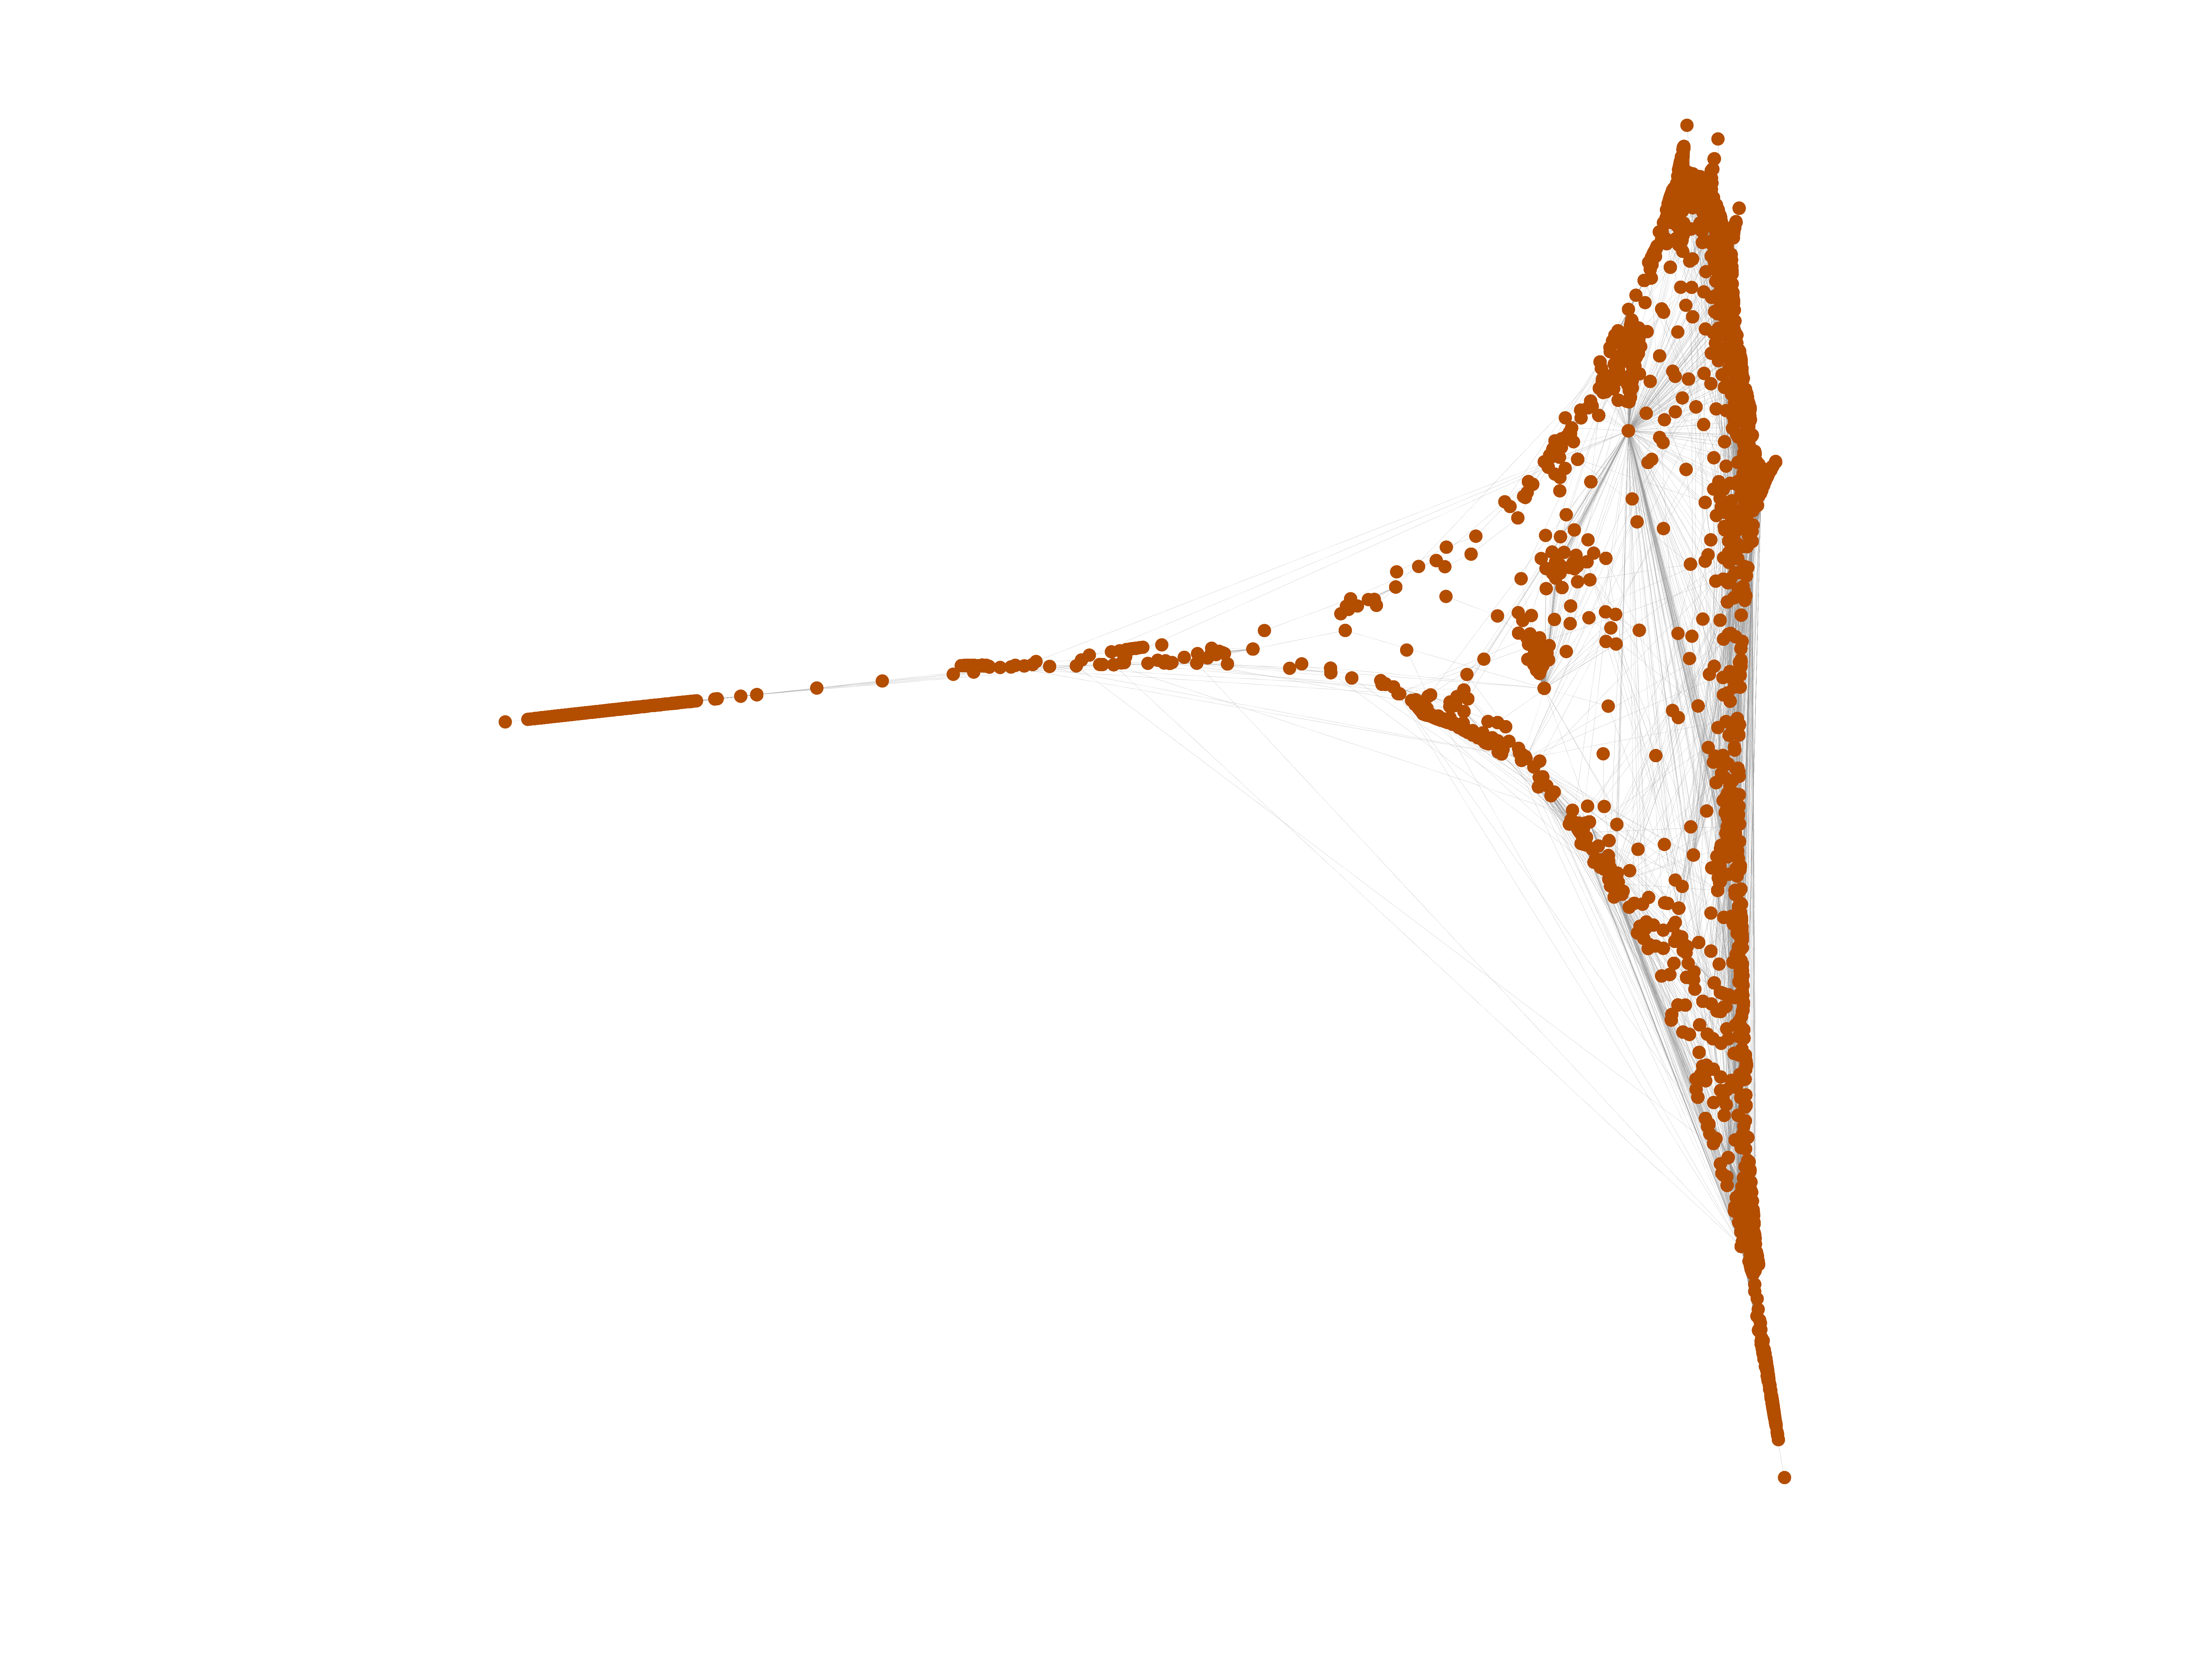
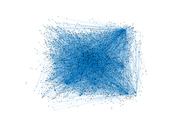
This is the bipartite edit network of the Hindi Wikiquote. It contains users
and pages from the Hindi Wikiquote, connected by edit events. Each edge
represents an edit. The dataset includes the timestamp of each edit.
Metadata
Statistics
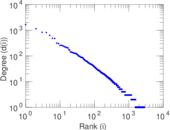
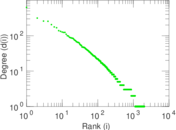
| Size | n = | 2,838
|
| Left size | n1 = | 800
|
| Right size | n2 = | 2,038
|
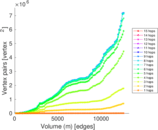
| Volume | m = | 12,426
|
| Unique edge count | m̿ = | 4,955
|
| Wedge count | s = | 389,494
|
| Claw count | z = | 38,482,082
|
| Cross count | x = | 3,291,264,386
|
| Square count | q = | 53,419
|
| 4-Tour count | T4 = | 1,999,082
|
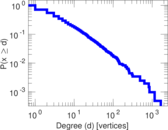
| Maximum degree | dmax = | 1,662
|
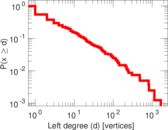
| Maximum left degree | d1max = | 1,662
|
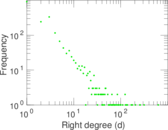
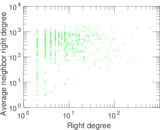
| Maximum right degree | d2max = | 630
|
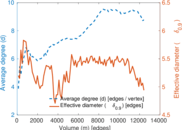
| Average degree | d = | 8.756 87
|
| Average left degree | d1 = | 15.532 5
|
| Average right degree | d2 = | 6.097 15
|
| Fill | p = | 0.003 039 13
|
| Average edge multiplicity | m̃ = | 2.507 77
|
| Size of LCC | N = | 2,682
|
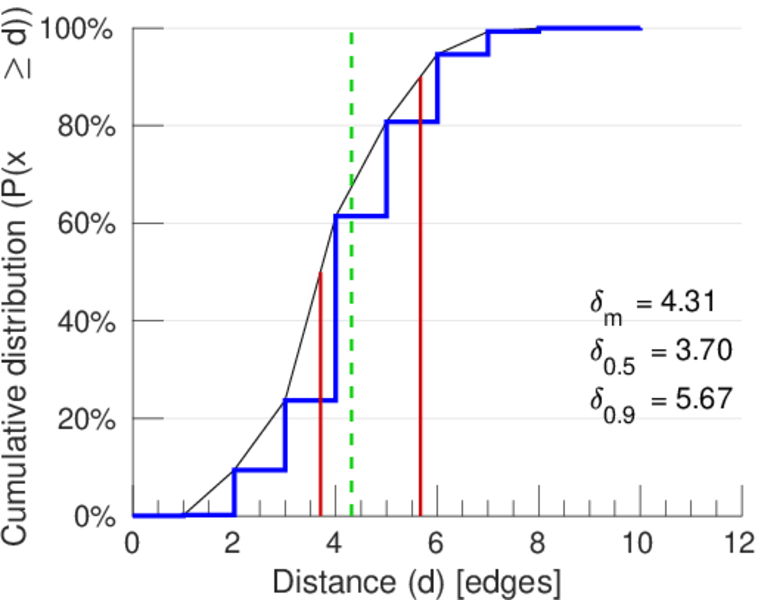
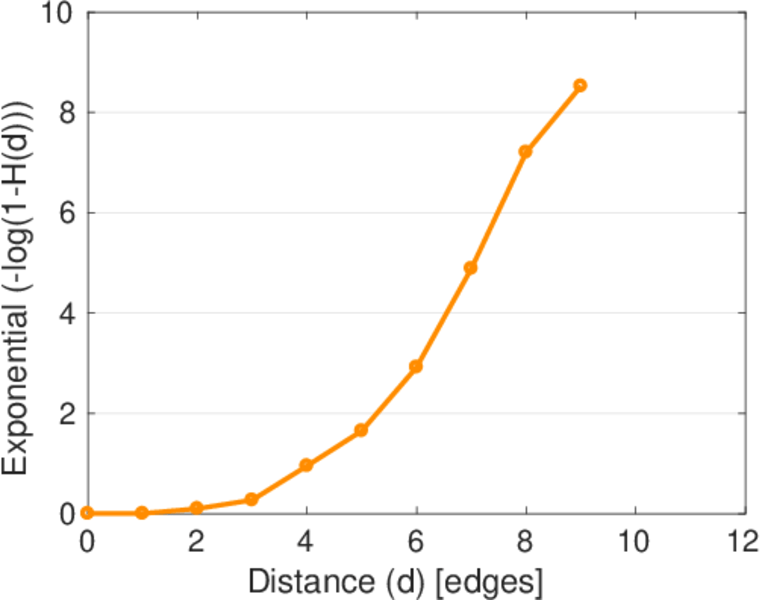
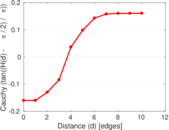
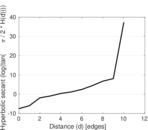
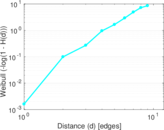
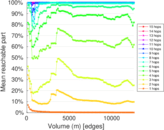
| Diameter | δ = | 11
|
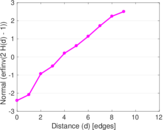
| 50-Percentile effective diameter | δ0.5 = | 3.697 78
|
| 90-Percentile effective diameter | δ0.9 = | 5.666 58
|
| Median distance | δM = | 4
|
| Mean distance | δm = | 4.307 88
|
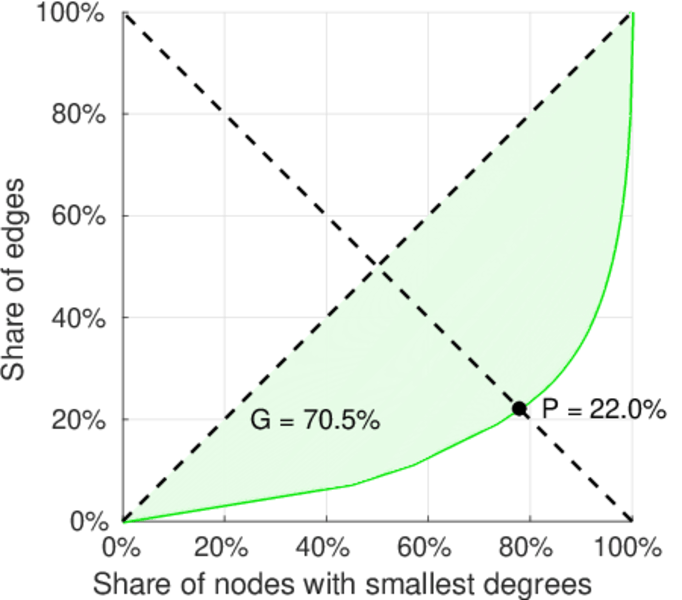
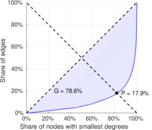
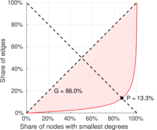
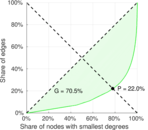
| Gini coefficient | G = | 0.776 661
|
| Balanced inequality ratio | P = | 0.187 751
|
| Left balanced inequality ratio | P1 = | 0.132 867
|
| Right balanced inequality ratio | P2 = | 0.219 862
|
| Relative edge distribution entropy | Her = | 0.830 611
|
| Power law exponent | γ = | 2.883 03
|
| Tail power law exponent | γt = | 2.221 00
|
| Tail power law exponent with p | γ3 = | 2.221 00
|
| p-value | p = | 0.247 000
|
| Left tail power law exponent with p | γ3,1 = | 1.971 00
|
| Left p-value | p1 = | 0.201 000
|
| Right tail power law exponent with p | γ3,2 = | 2.431 00
|
| Right p-value | p2 = | 0.014 000 0
|
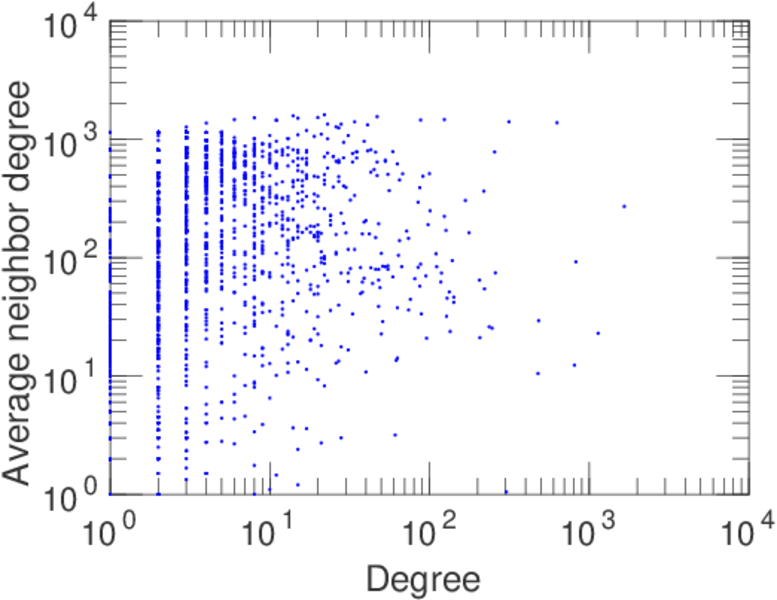
| Degree assortativity | ρ = | −0.364 857
|
| Degree assortativity p-value | pρ = | 7.028 62 × 10−156
|
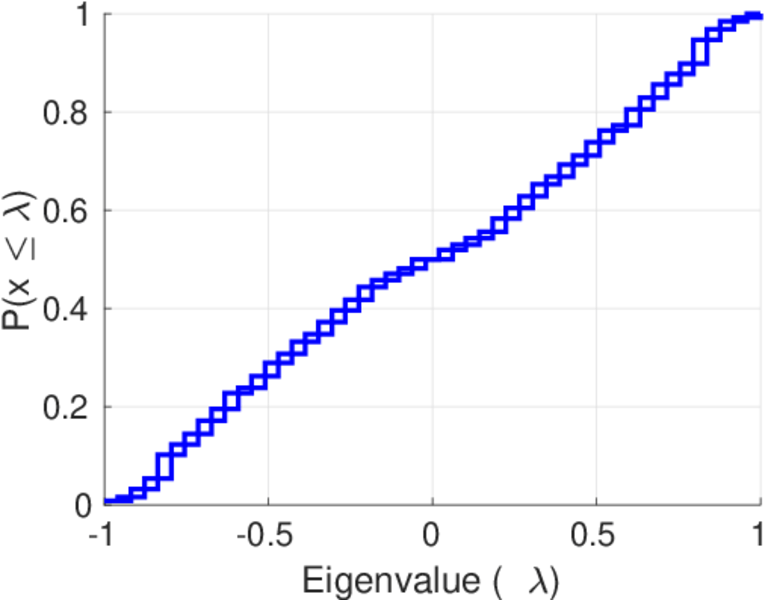
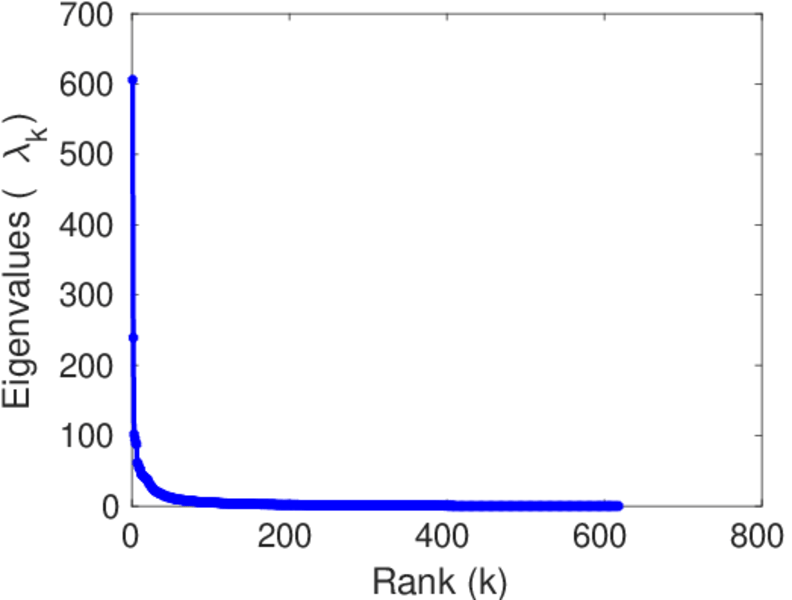
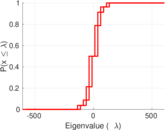
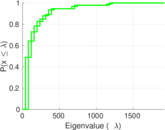
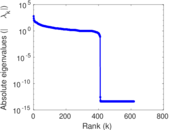
| Spectral norm | α = | 605.809
|
| Algebraic connectivity | a = | 0.010 259 1
|
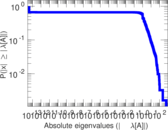
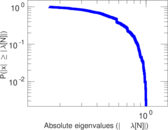
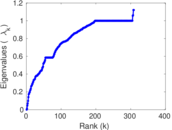
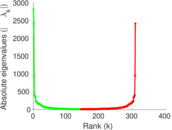
| Spectral separation | |λ1[A] / λ2[A]| = | 2.532 31
|
| Controllability | C = | 2,016
|
| Relative controllability | Cr = | 0.711 613
|
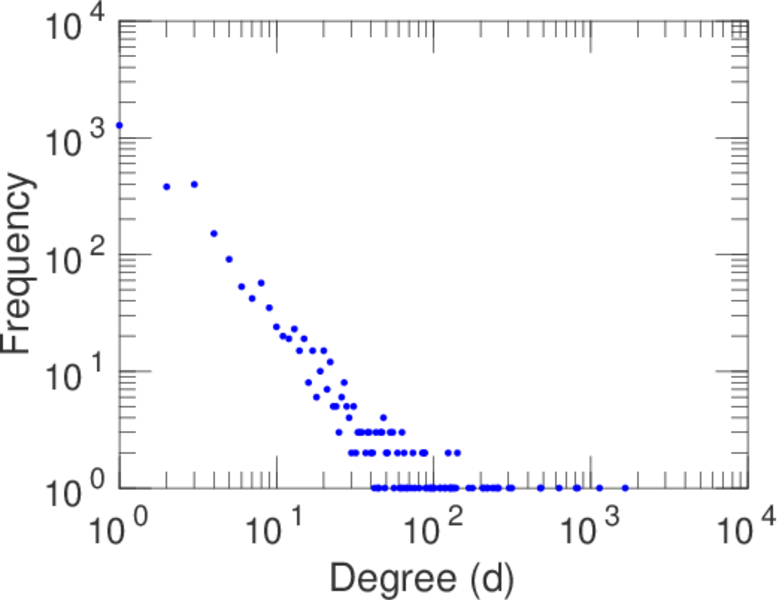
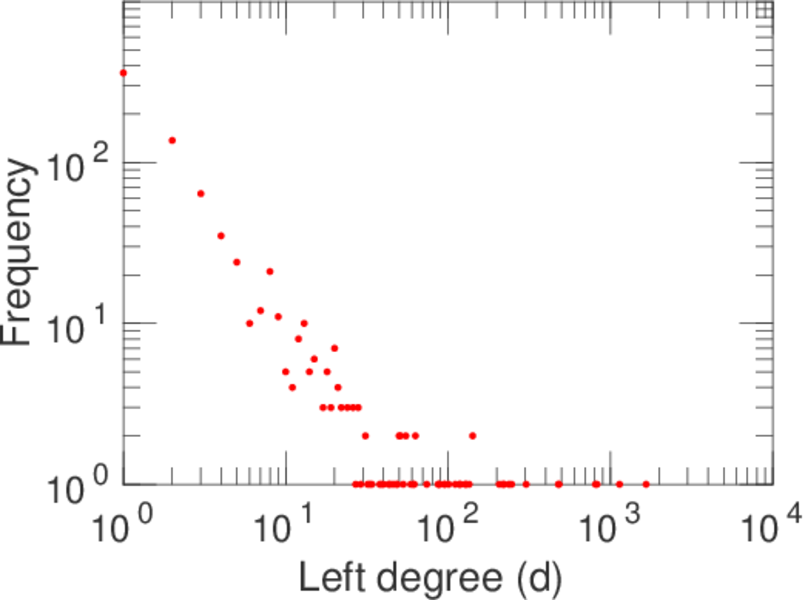
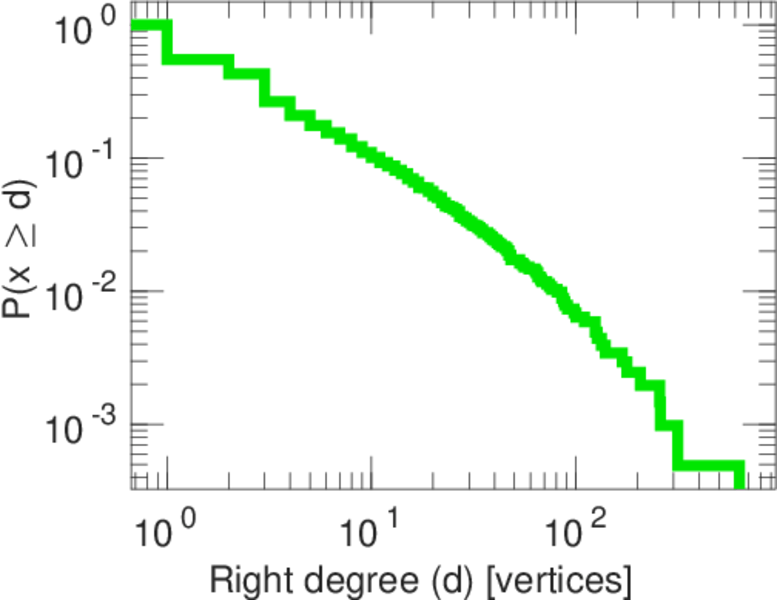
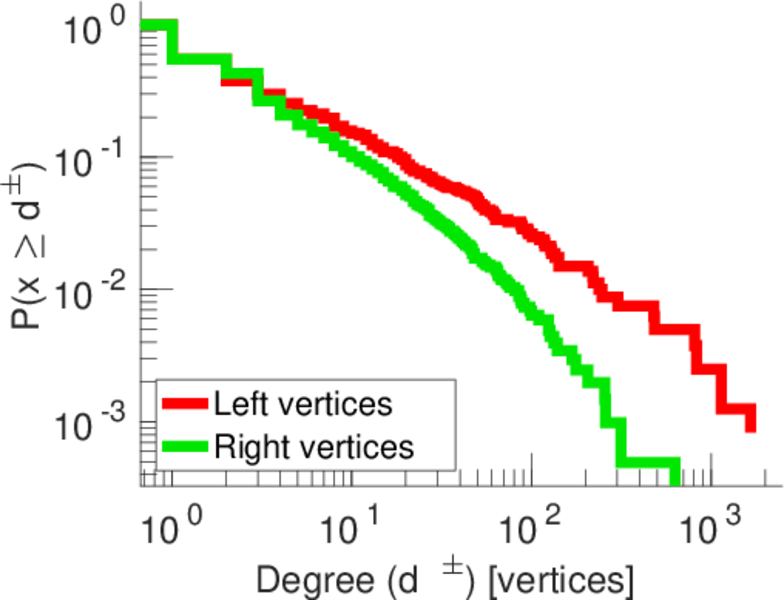
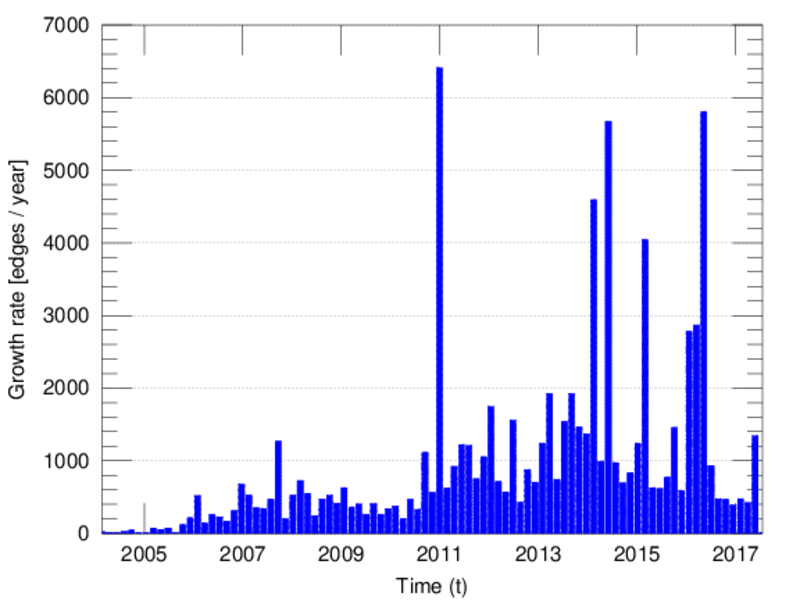
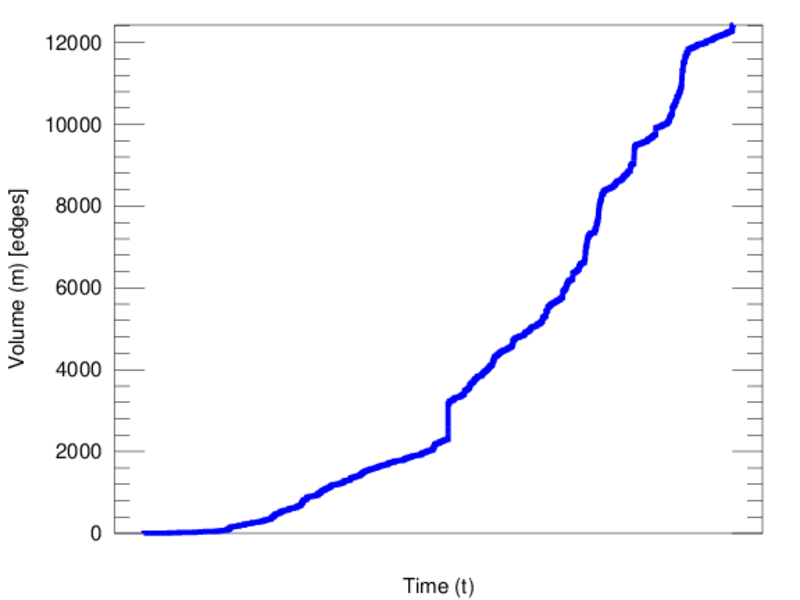
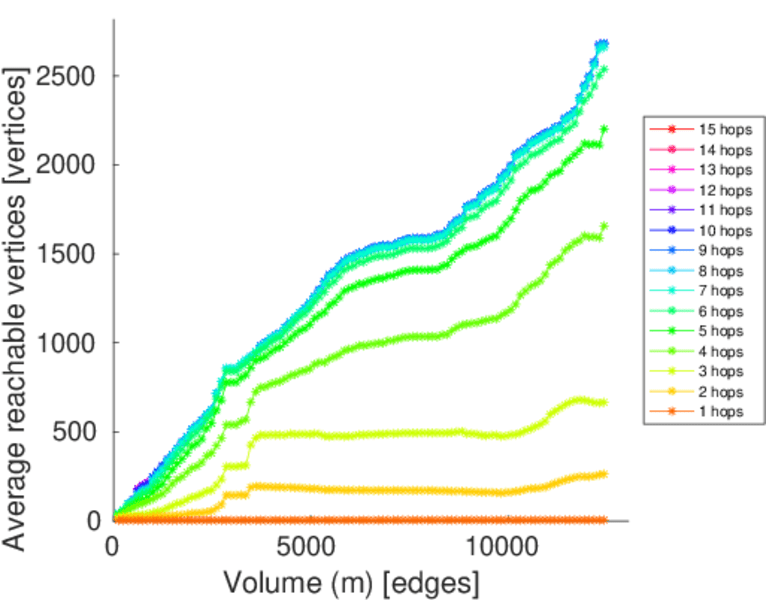
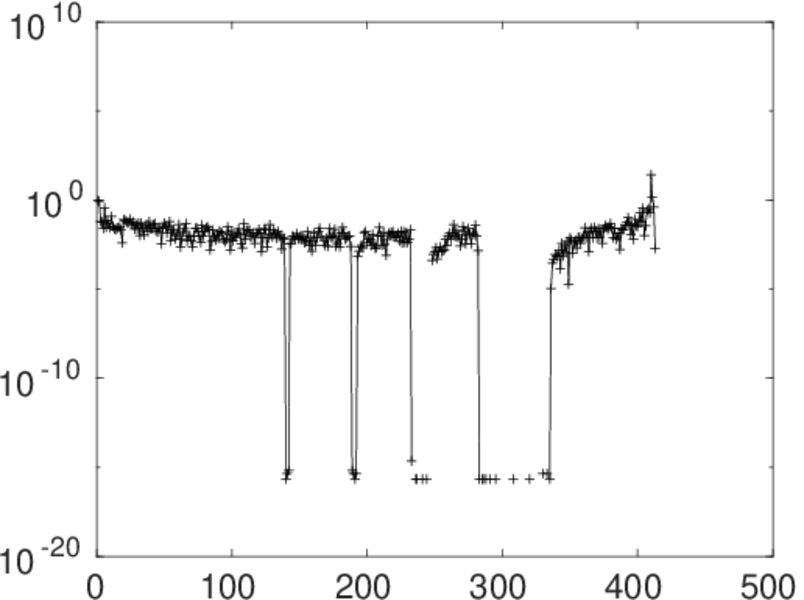
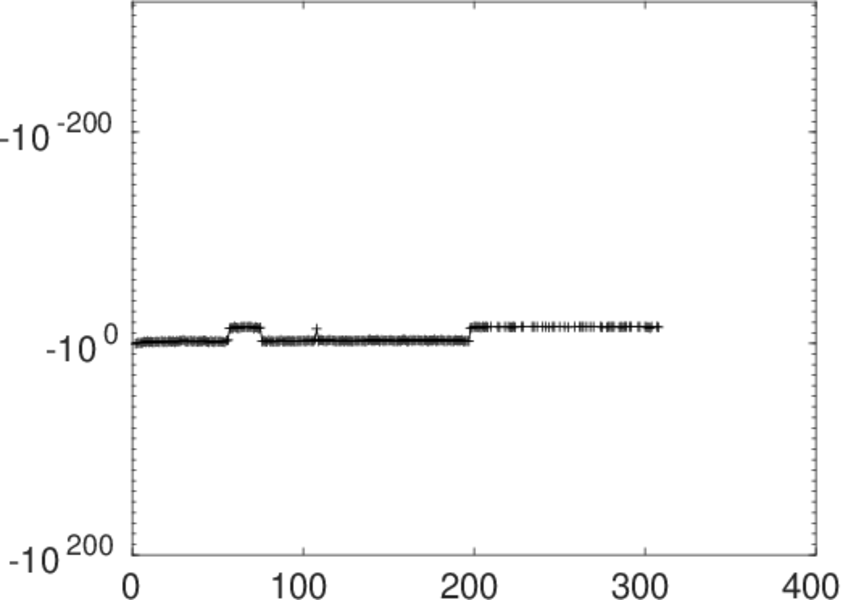
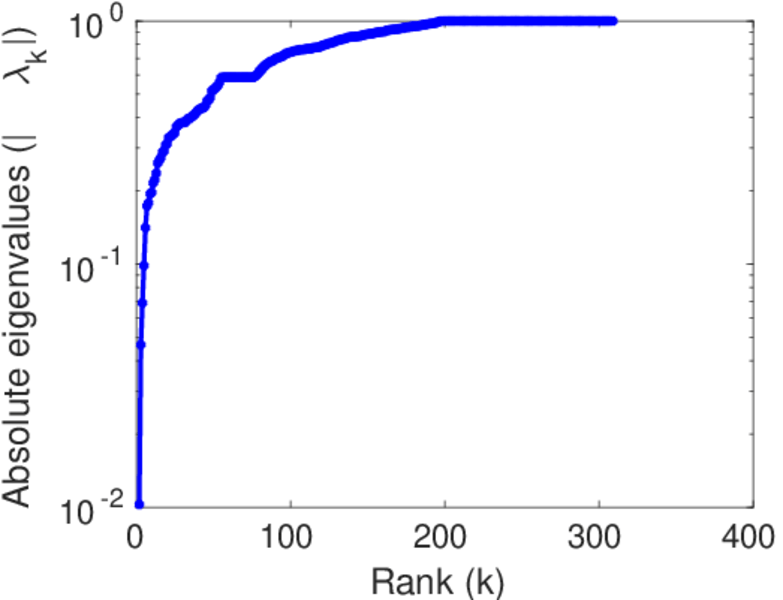
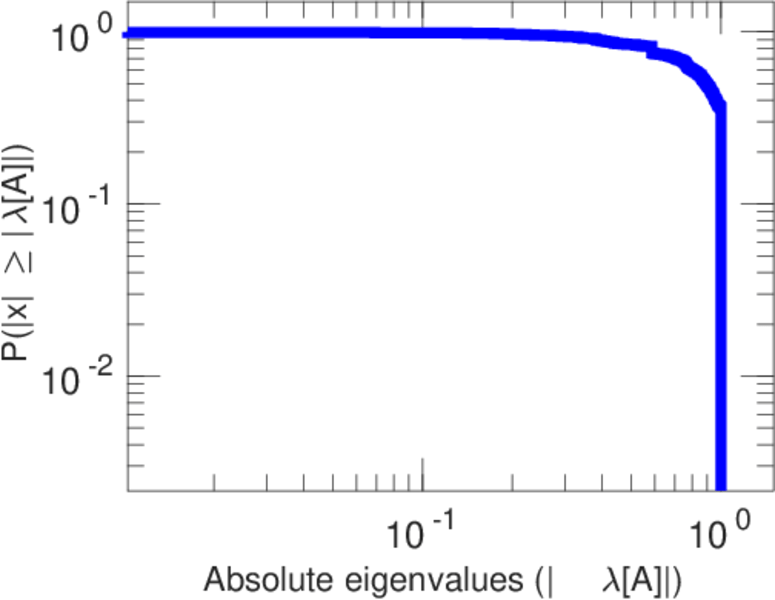
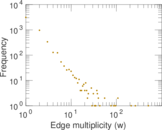
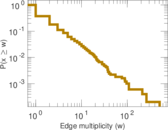
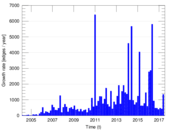
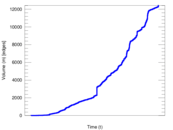
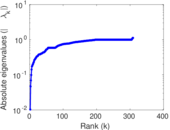
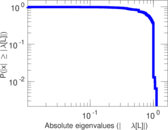
Plots


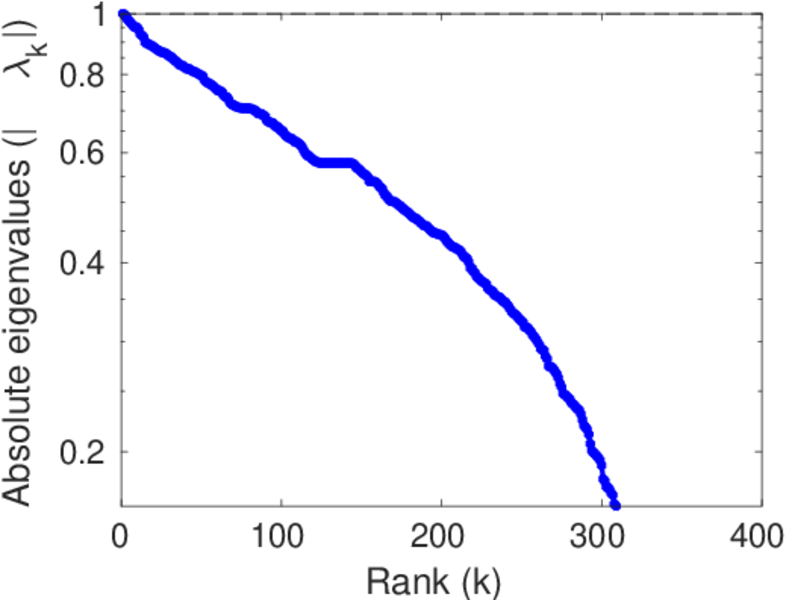
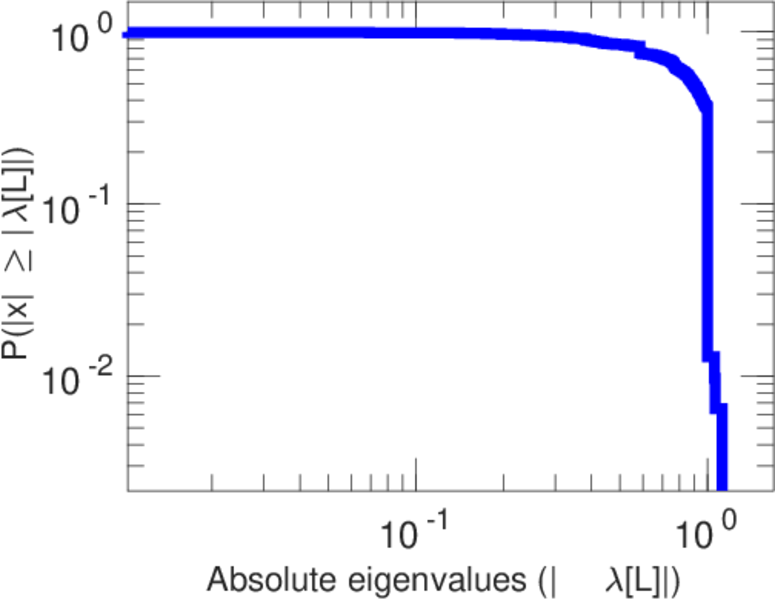
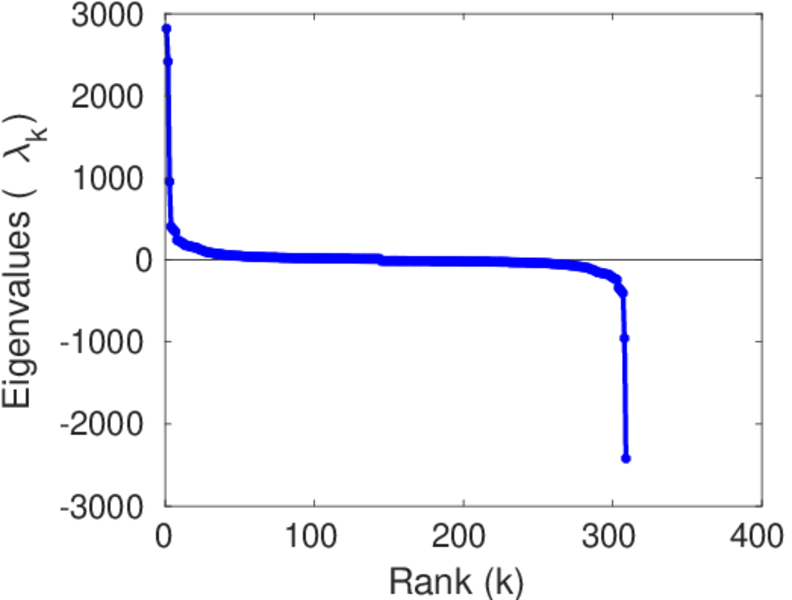
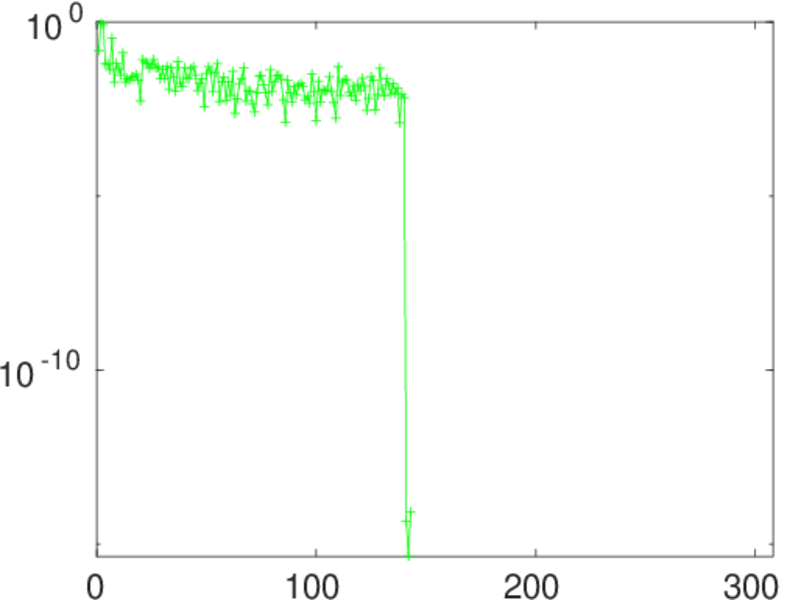
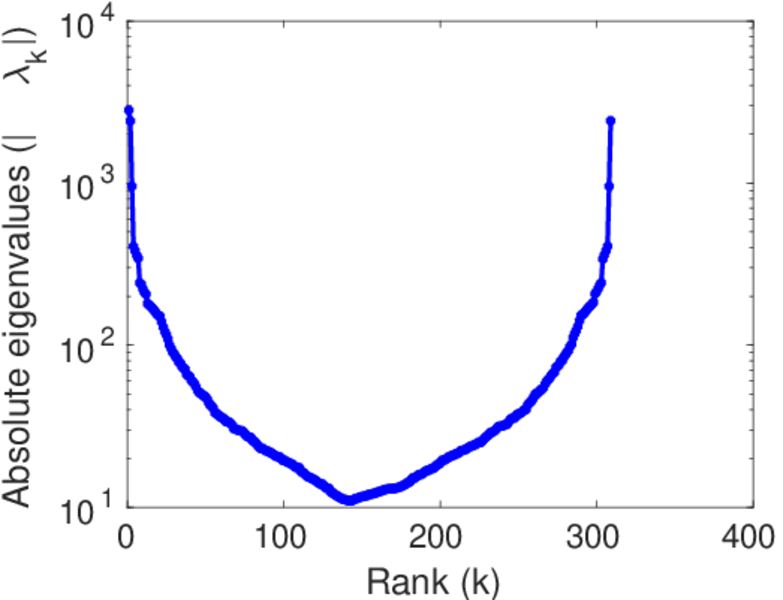
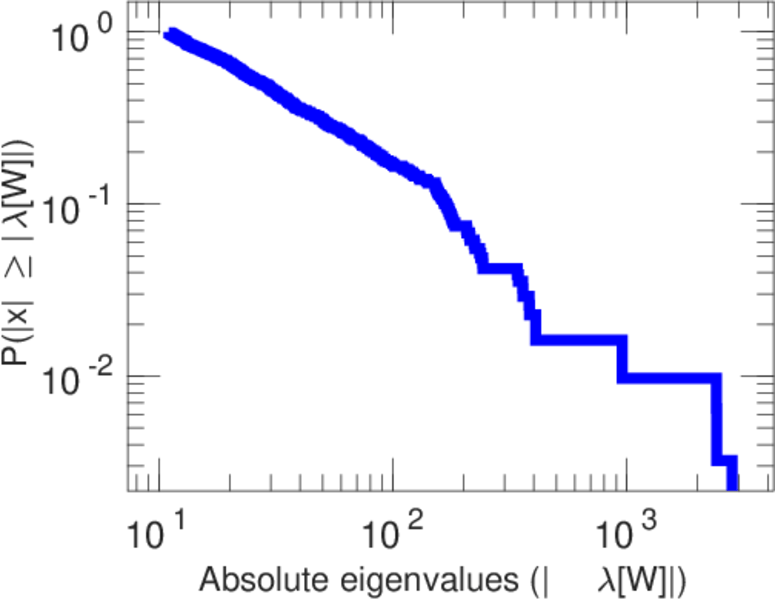
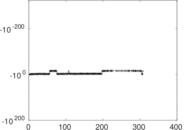
Matrix decompositions plots


Downloads
References
|
[1]
|
Jérôme Kunegis.
KONECT – The Koblenz Network Collection.
In Proc. Int. Conf. on World Wide Web Companion, pages
1343–1350, 2013.
[ http ]
|
|
[2]
|
Wikimedia Foundation.
Wikimedia downloads.
http://dumps.wikimedia.org/, January 2010.
|
 KONECT ‣ Networks ‣
Buy Me a Coffee
KONECT ‣ Networks ‣
Buy Me a Coffee