Wiktionary edits (hi)
This is the bipartite edit network of the Hindi Wiktionary. It contains users
and pages from the Hindi Wiktionary, connected by edit events. Each edge
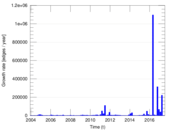
represents an edit. The dataset includes the timestamp of each edit.
Metadata
Statistics
| Size | n = | 203,894
|
| Left size | n1 = | 701
|
| Right size | n2 = | 203,193
|
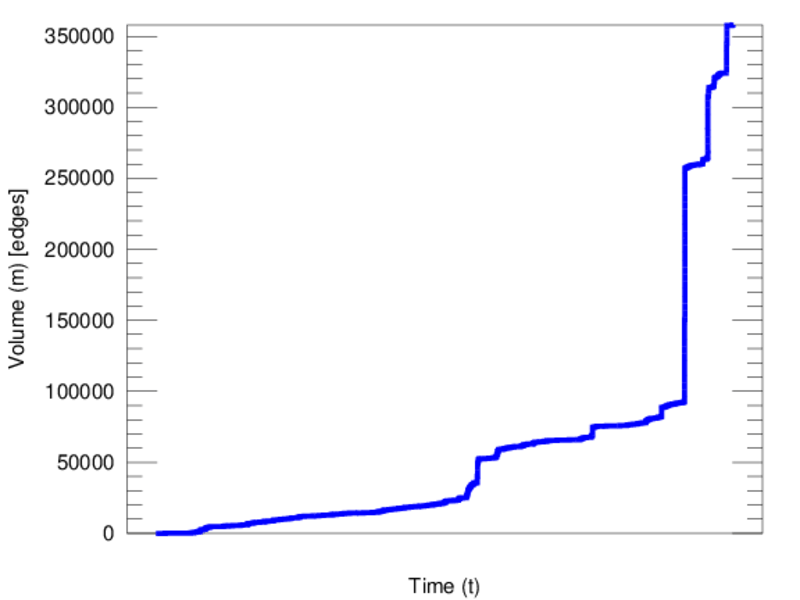
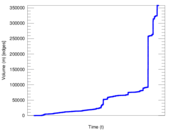
| Volume | m = | 357,938
|
| Unique edge count | m̿ = | 291,776
|
| Wedge count | s = | 14,906,633,267
|
| Claw count | z = | 752,579,042,028,454
|
| Cross count | x = | 3.012 35 × 1019
|
| Square count | q = | 559,894,680
|
| 4-Tour count | T4 = | 64,106,278,324
|
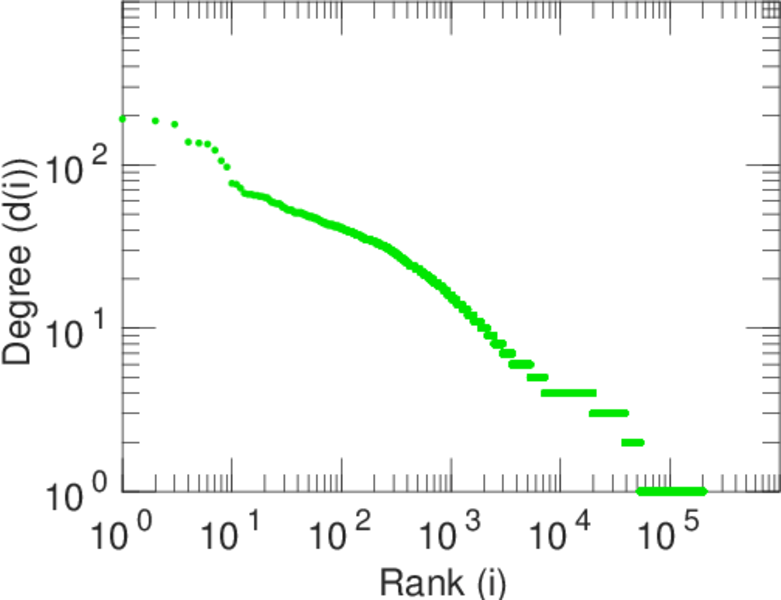
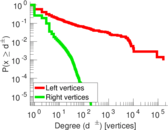
| Maximum degree | dmax = | 163,616
|
| Maximum left degree | d1max = | 163,616
|
| Maximum right degree | d2max = | 191
|
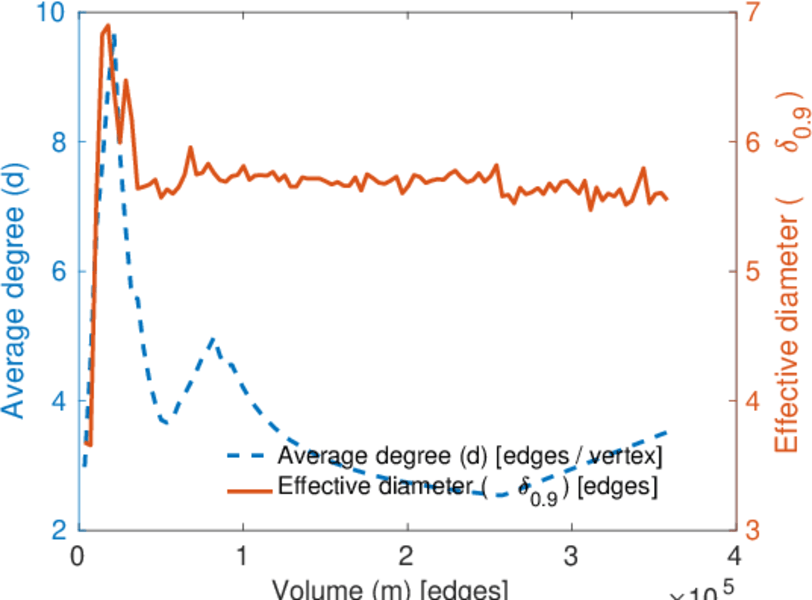
| Average degree | d = | 3.511 02
|
| Average left degree | d1 = | 510.611
|
| Average right degree | d2 = | 1.761 57
|
| Fill | p = | 0.002 048 44
|
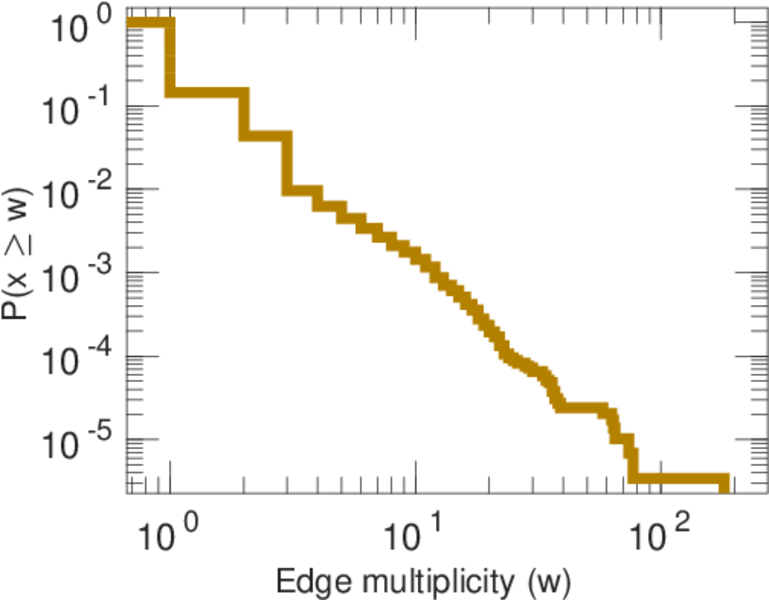
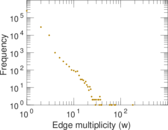
| Average edge multiplicity | m̃ = | 1.226 76
|
| Size of LCC | N = | 203,325
|
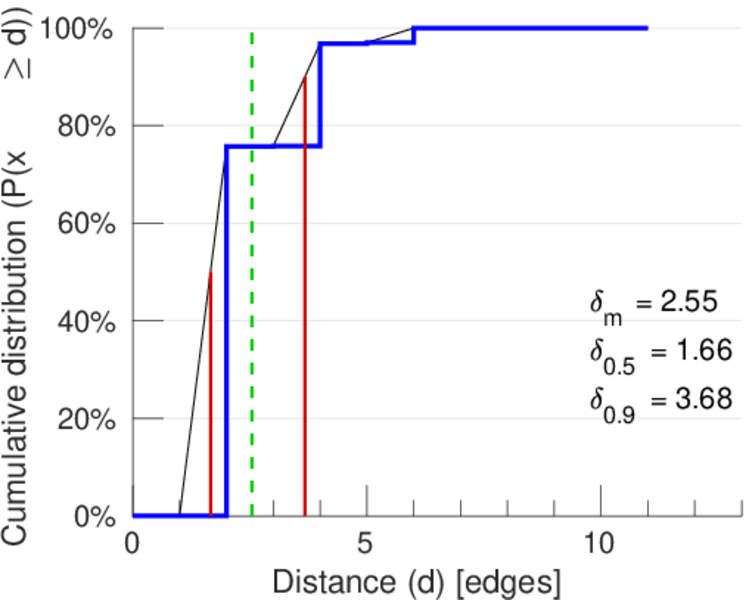
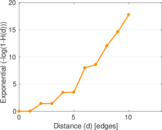
| Diameter | δ = | 14
|
| 50-Percentile effective diameter | δ0.5 = | 1.660 55
|
| 90-Percentile effective diameter | δ0.9 = | 3.676 57
|
| Median distance | δM = | 2
|
| Mean distance | δm = | 2.547 74
|
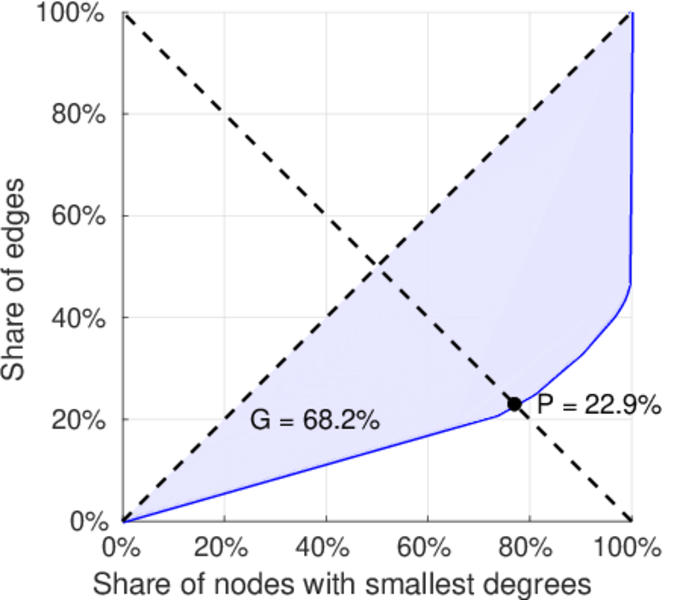
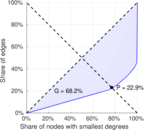
| Gini coefficient | G = | 0.682 598
|
| Balanced inequality ratio | P = | 0.227 813
|
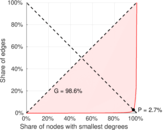
| Left balanced inequality ratio | P1 = | 0.026 655 5
|
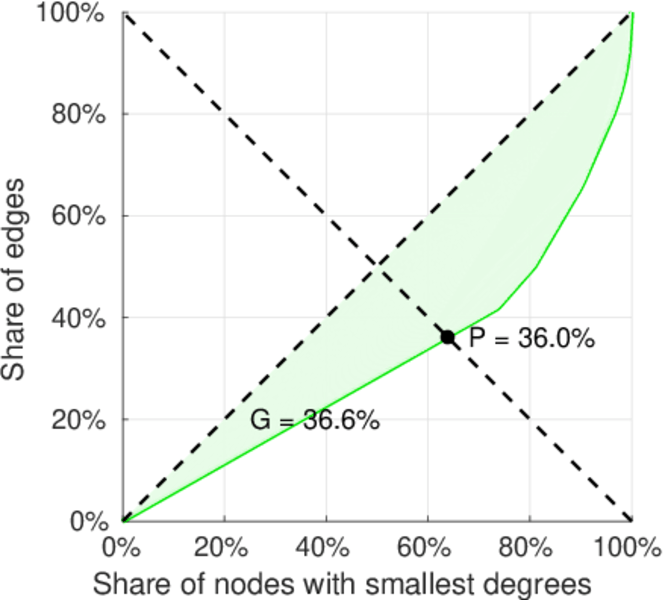
| Right balanced inequality ratio | P2 = | 0.360 113
|
| Relative edge distribution entropy | Her = | 0.622 894
|
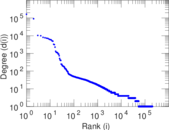
| Power law exponent | γ = | 5.265 54
|
| Tail power law exponent | γt = | 3.421 00
|
| Tail power law exponent with p | γ3 = | 3.421 00
|
| p-value | p = | 0.000 00
|
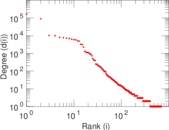
| Left tail power law exponent with p | γ3,1 = | 1.721 00
|
| Left p-value | p1 = | 0.000 00
|
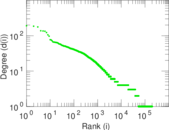
| Right tail power law exponent with p | γ3,2 = | 3.471 00
|
| Right p-value | p2 = | 0.000 00
|
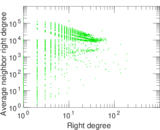
| Degree assortativity | ρ = | −0.538 486
|
| Degree assortativity p-value | pρ = | 0.000 00
|
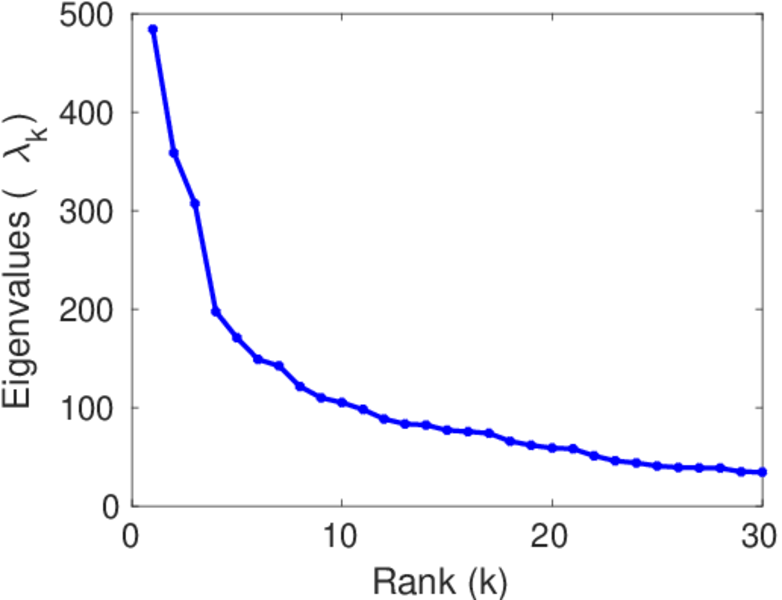
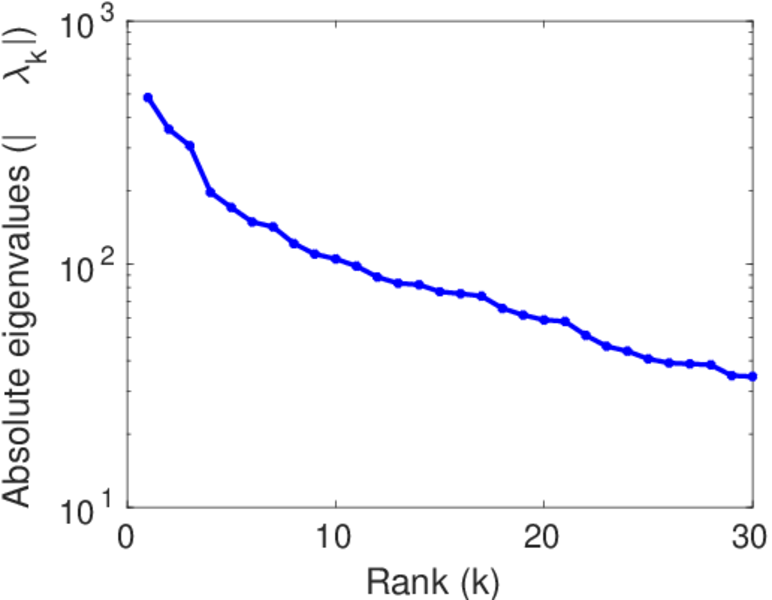
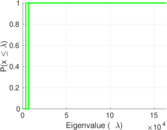
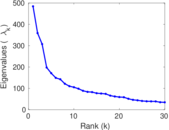
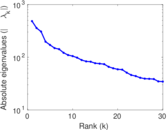
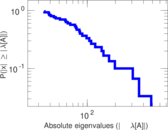
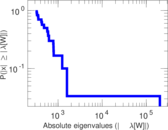
| Spectral norm | α = | 484.123
|
| Algebraic connectivity | a = | 0.013 758 5
|
| Spectral separation | |λ1[A] / λ2[A]| = | 1.349 71
|
| Controllability | C = | 202,674
|
| Relative controllability | Cr = | 0.995 012
|
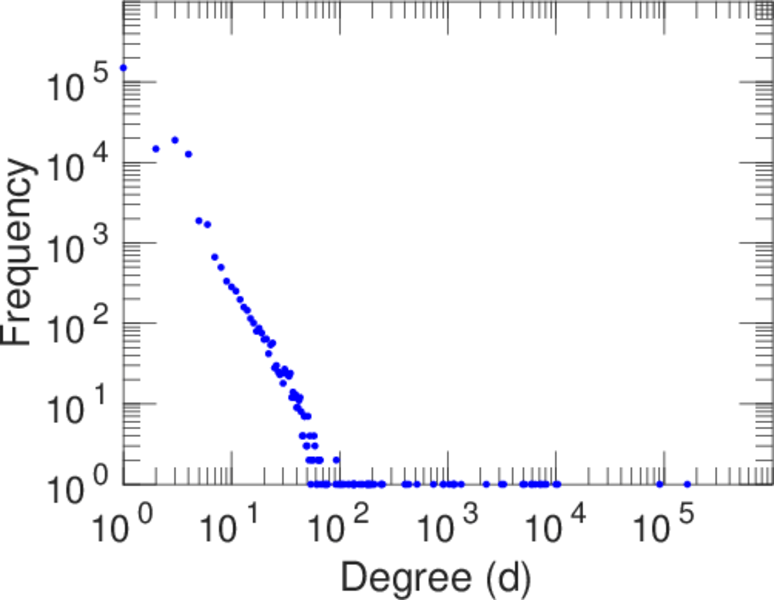
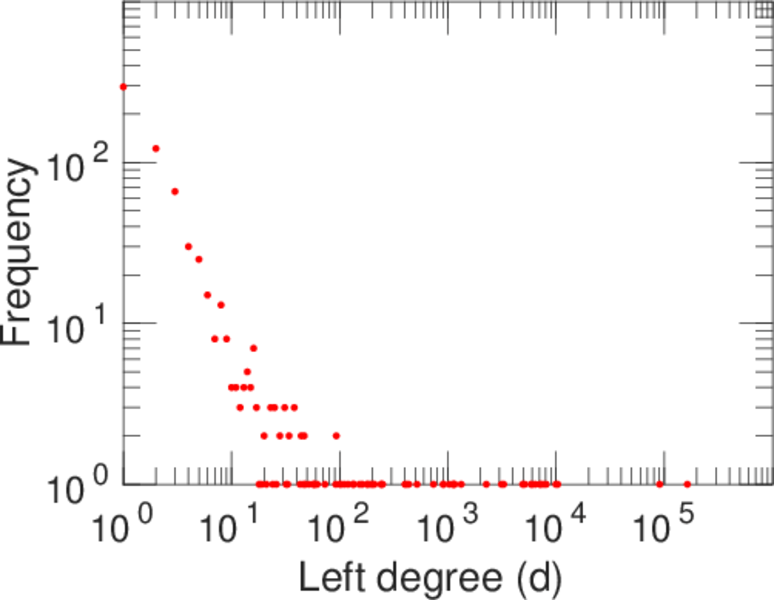
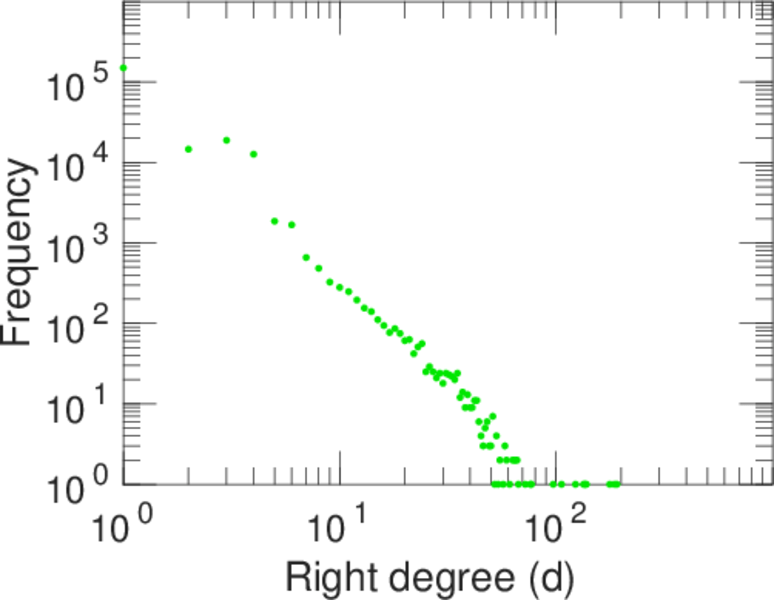
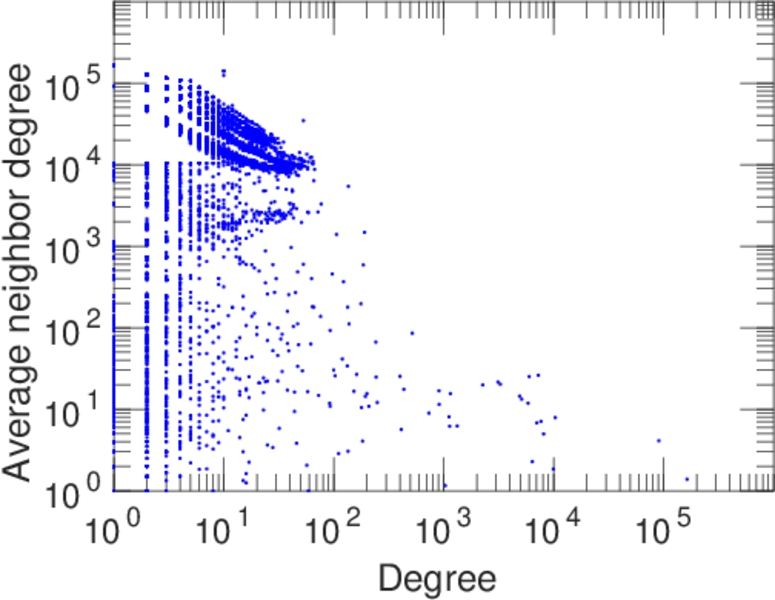
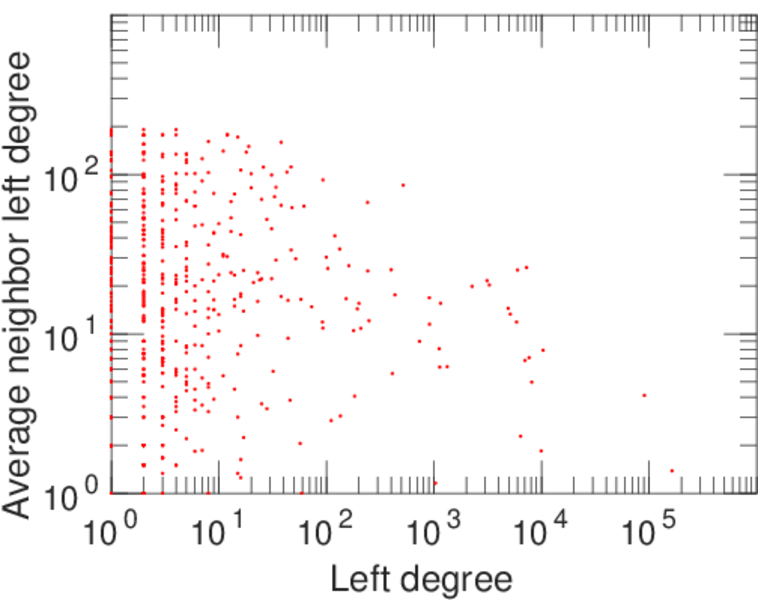
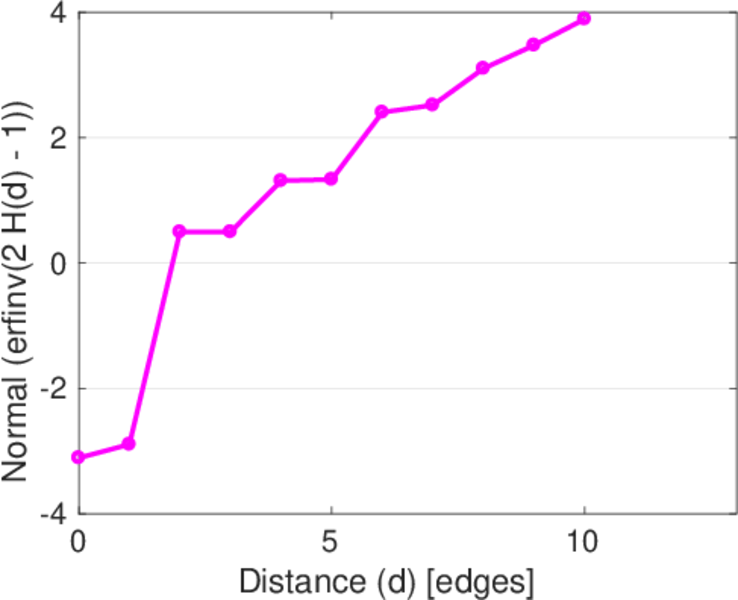
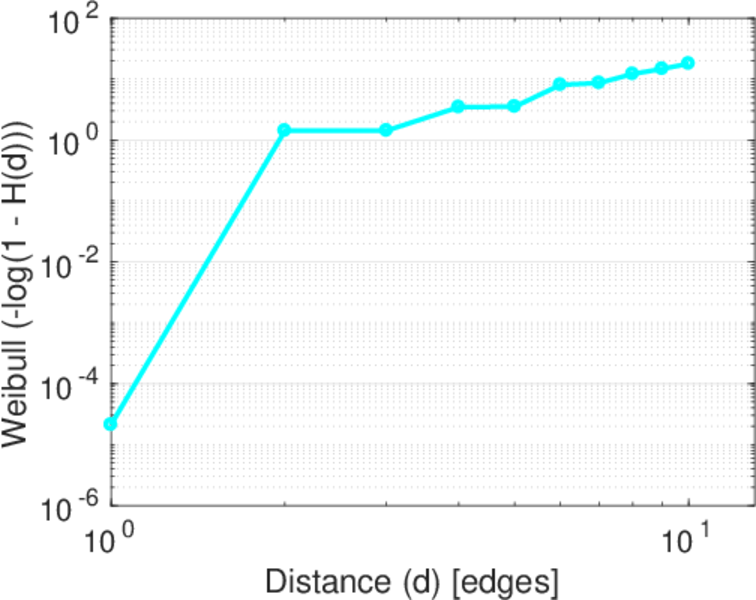
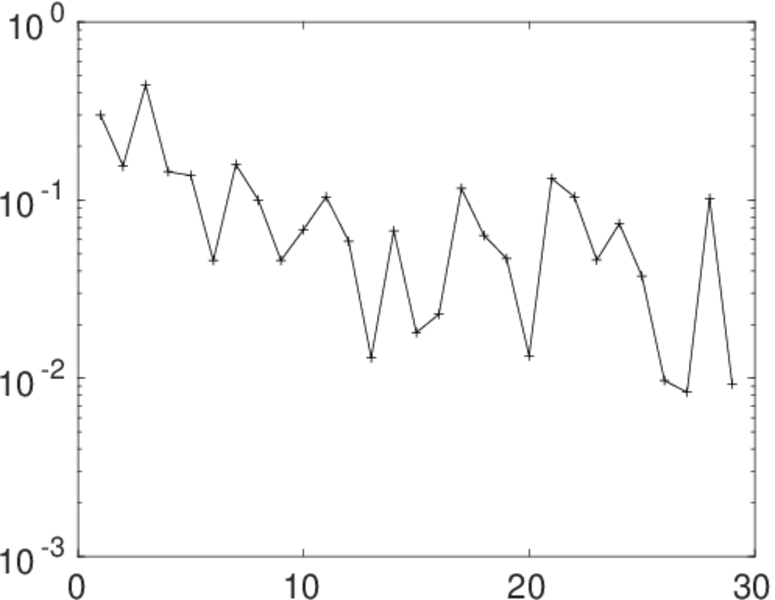
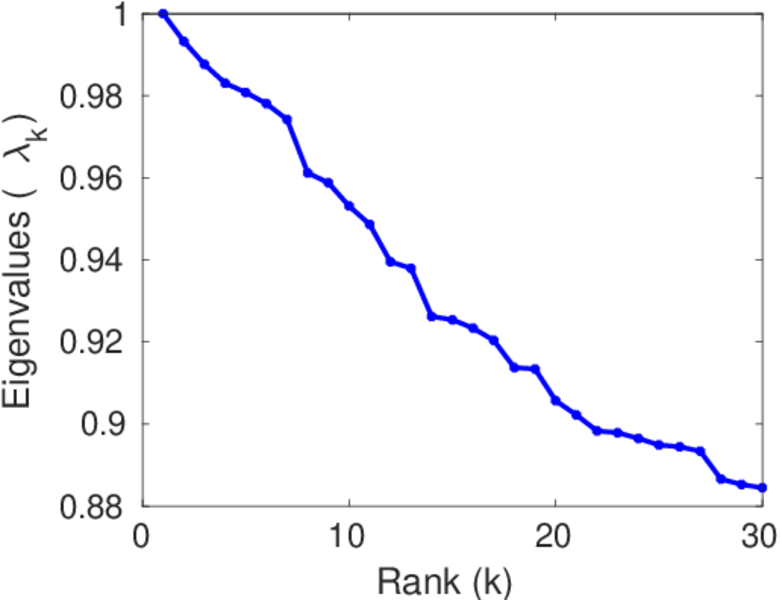
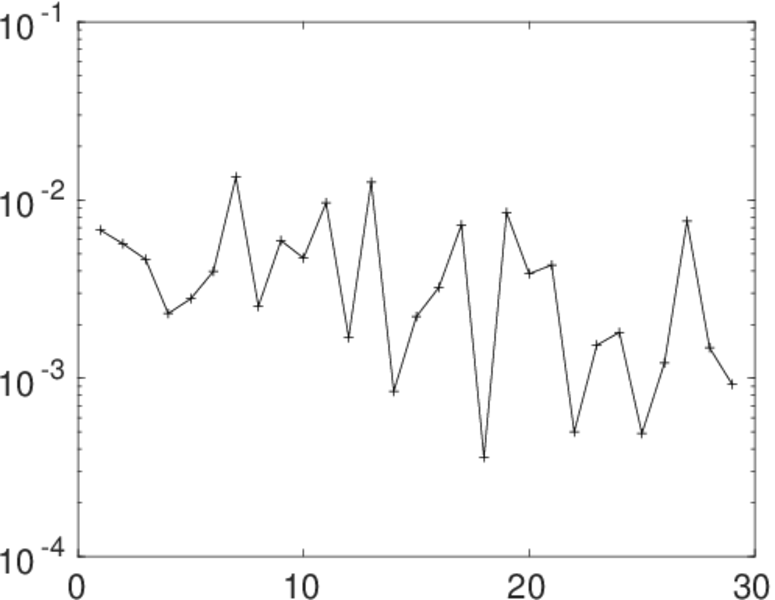
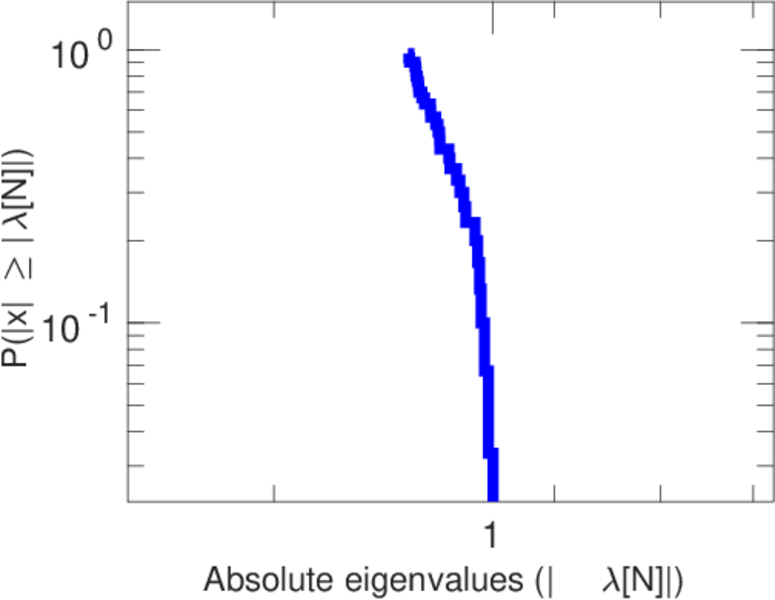
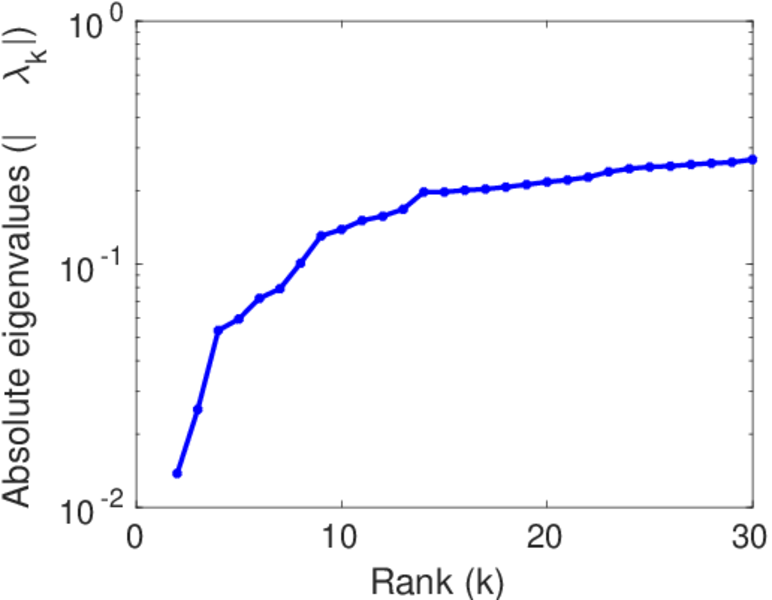
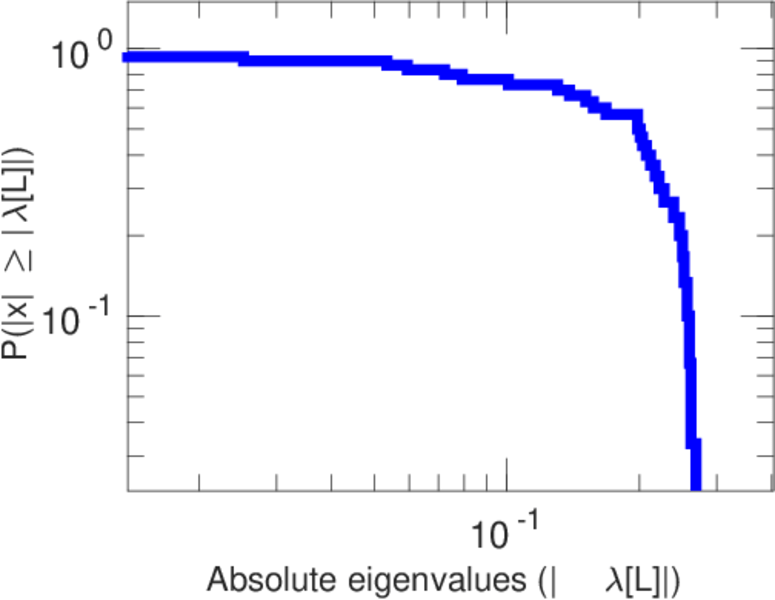
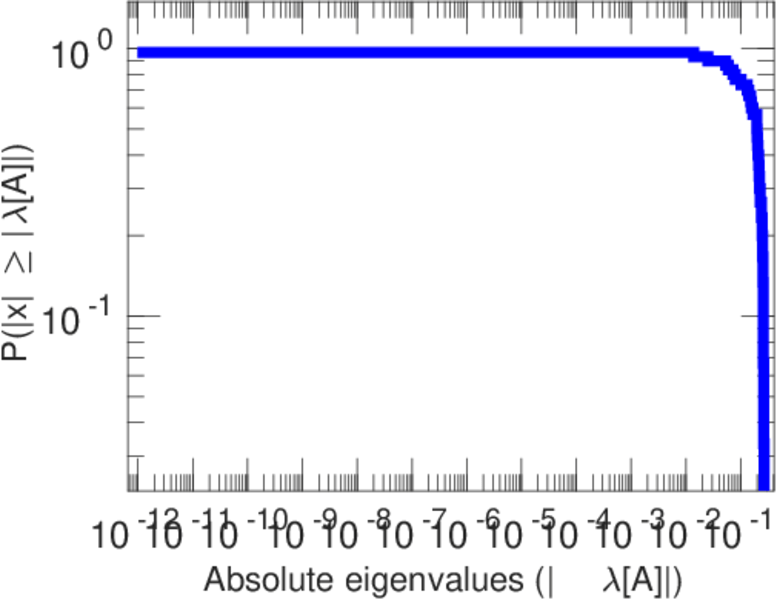
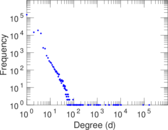
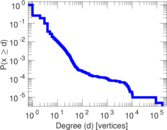
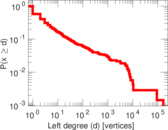
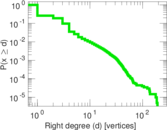
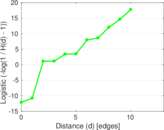
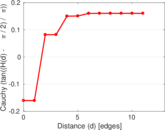
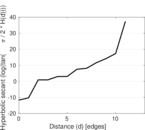
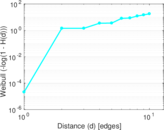
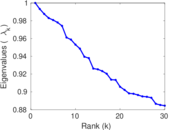
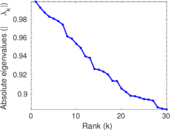
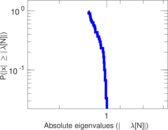
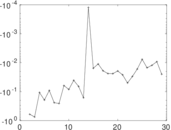
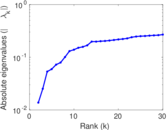
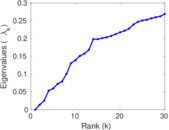
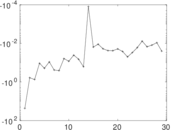
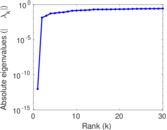
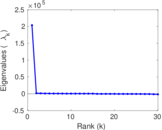
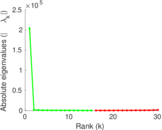
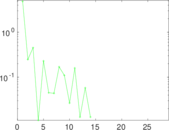
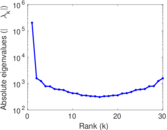
Plots


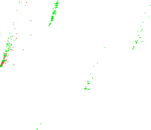
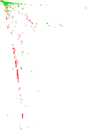
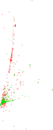


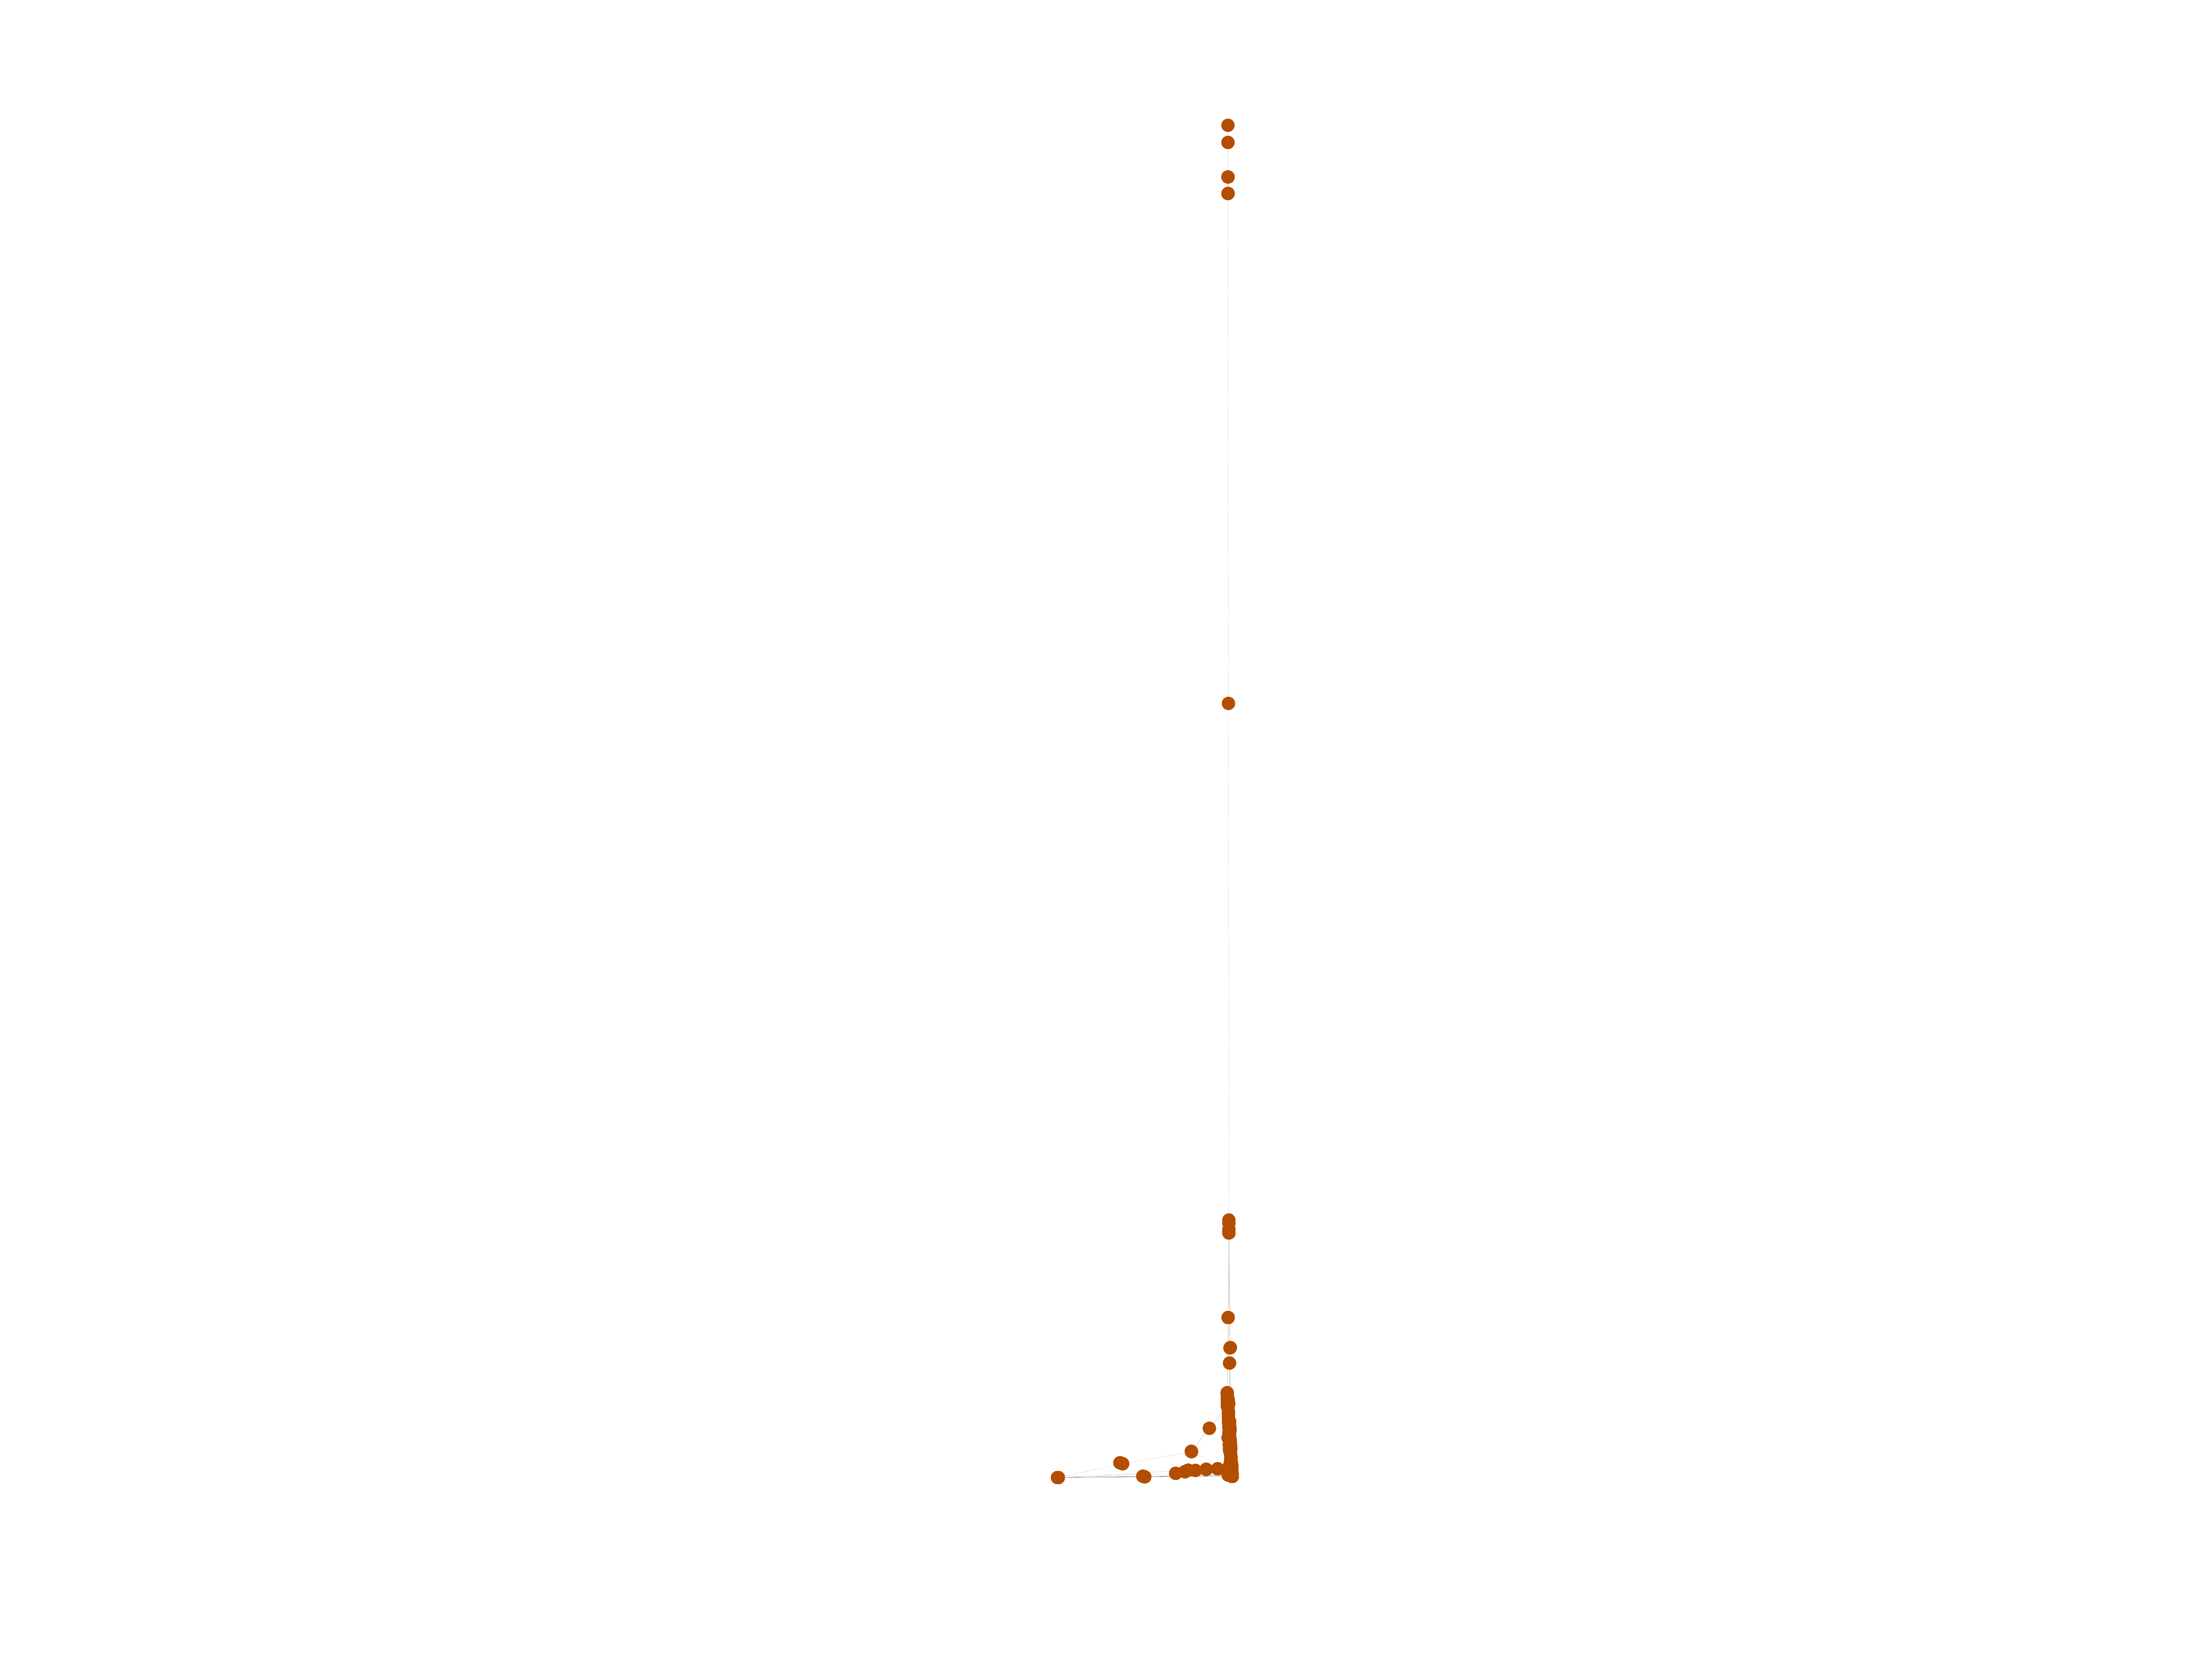
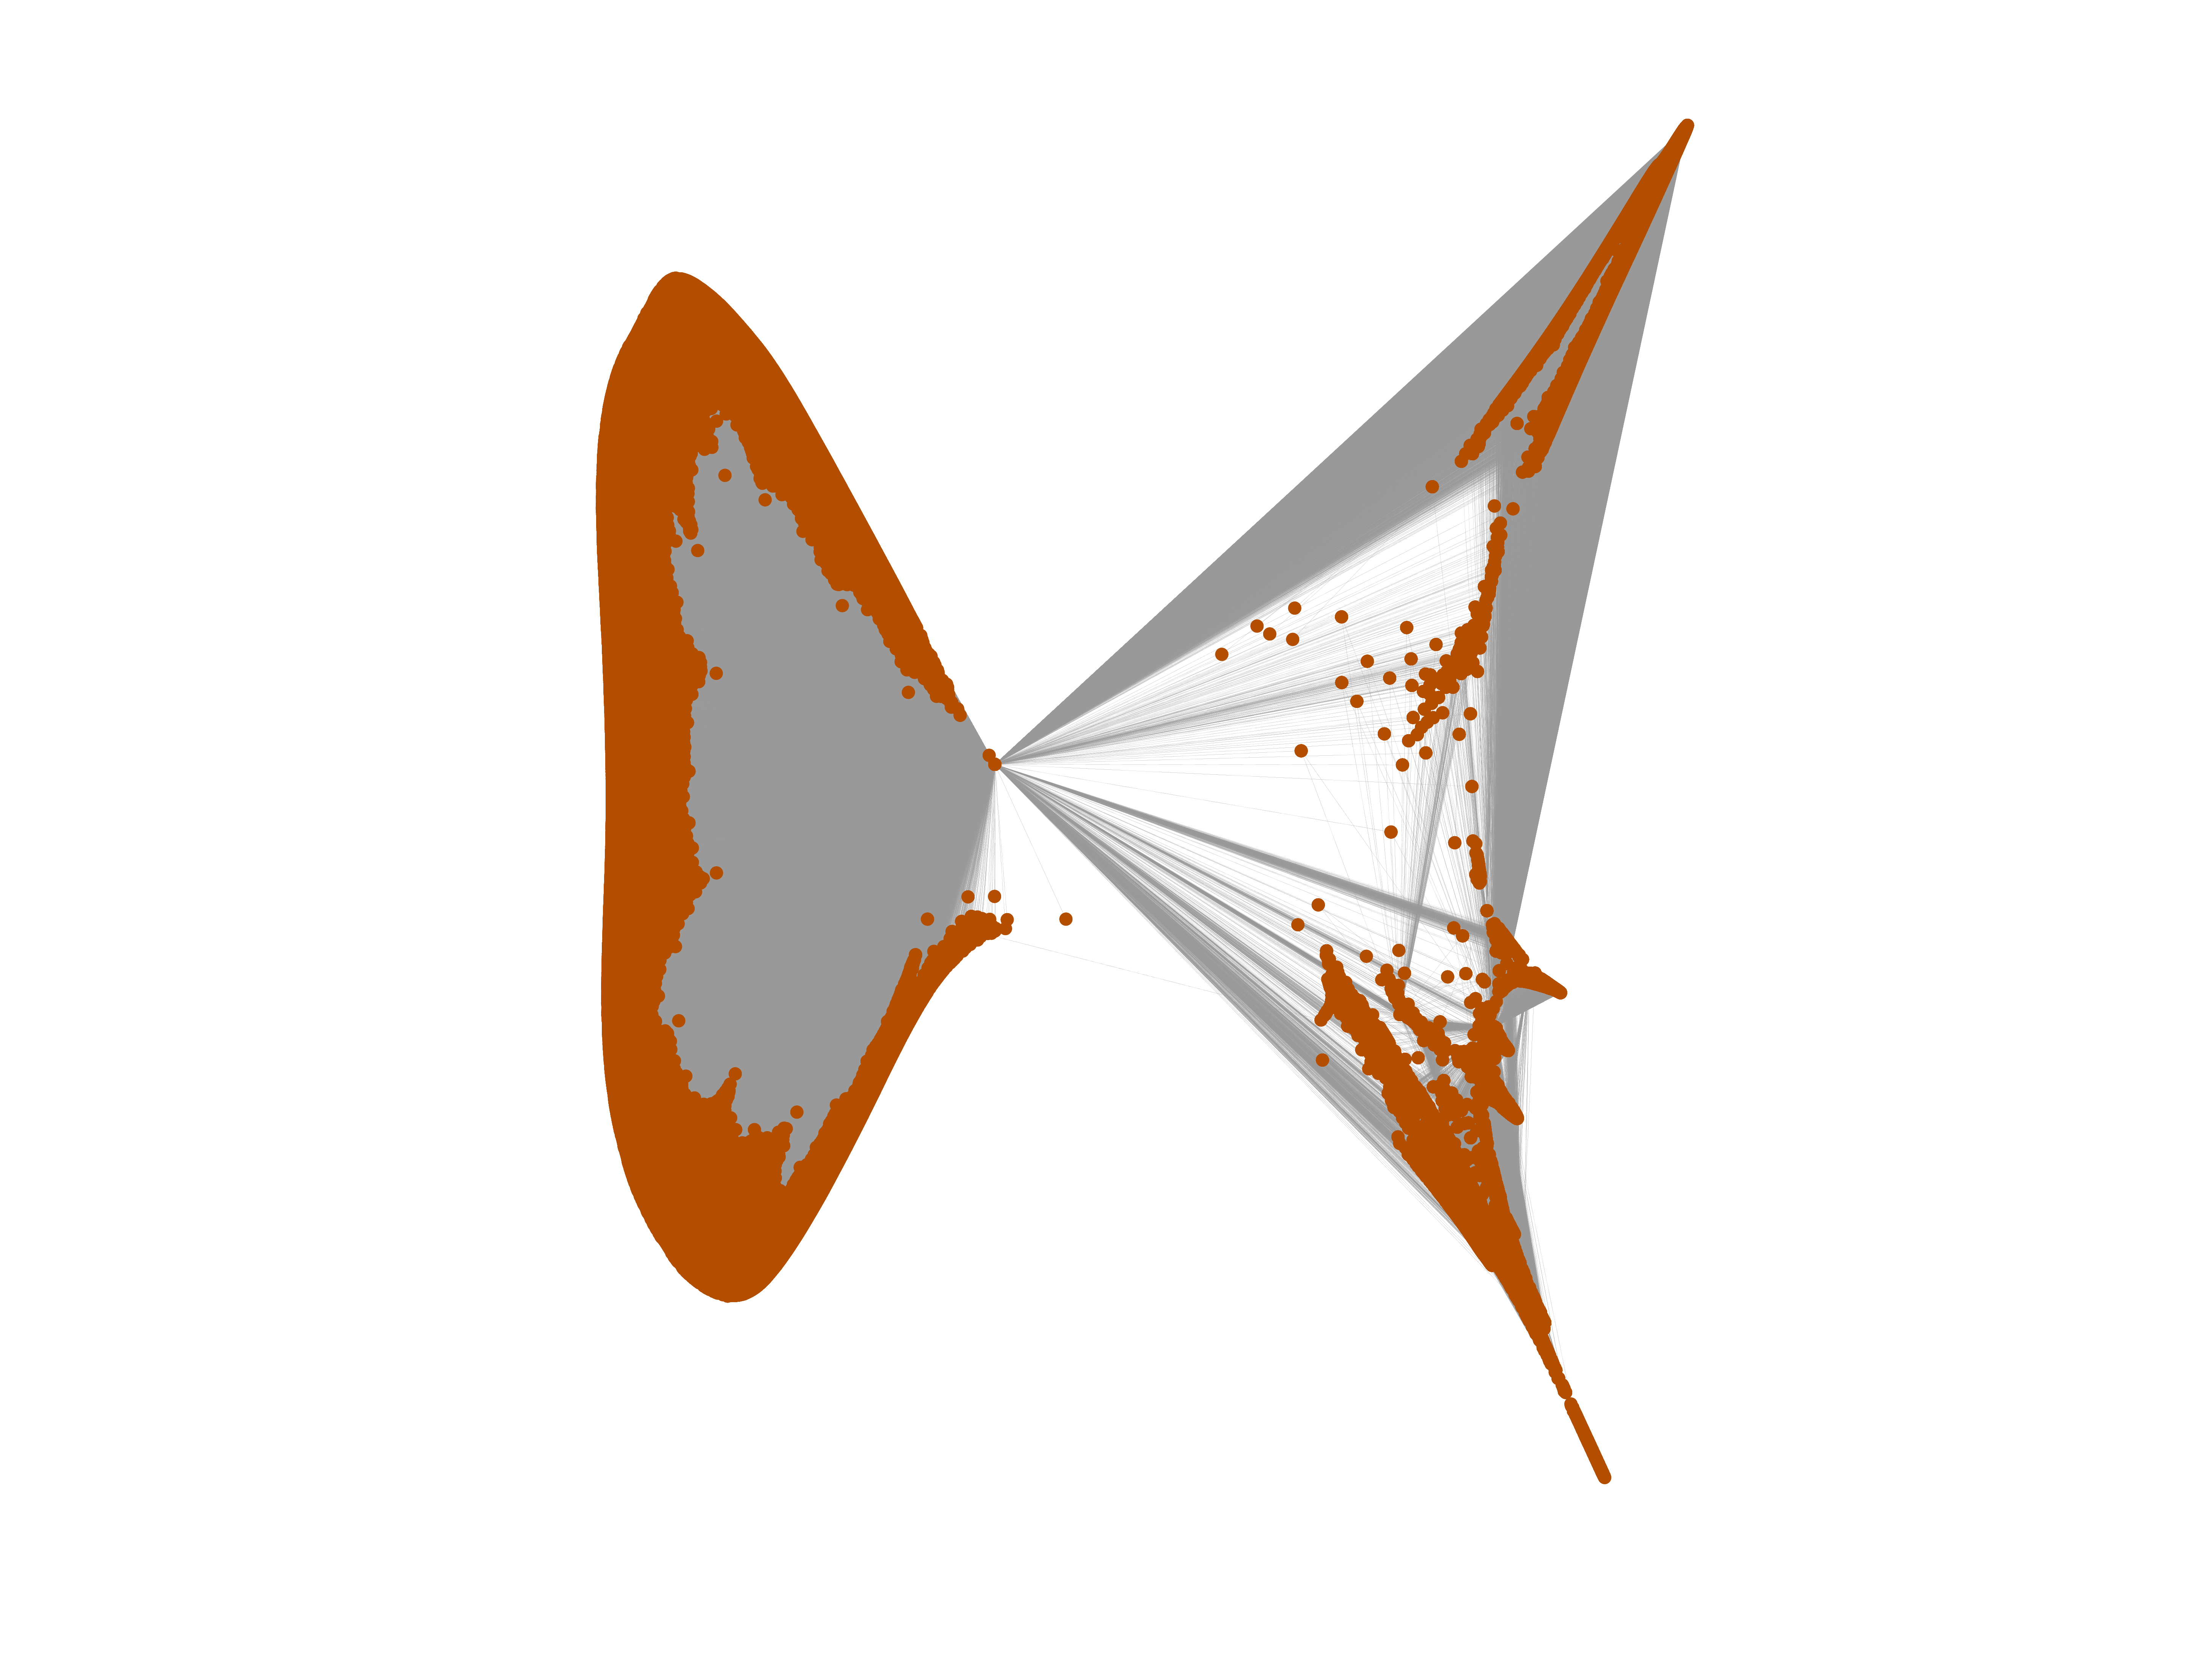
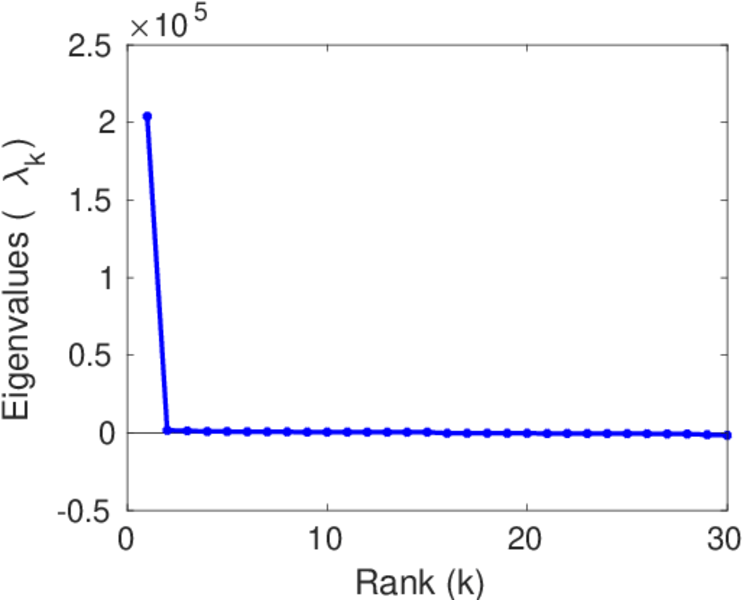
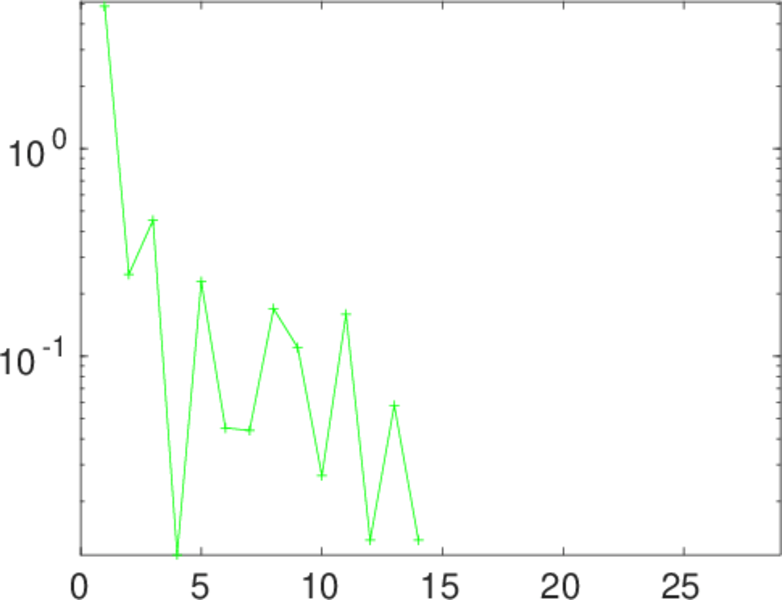
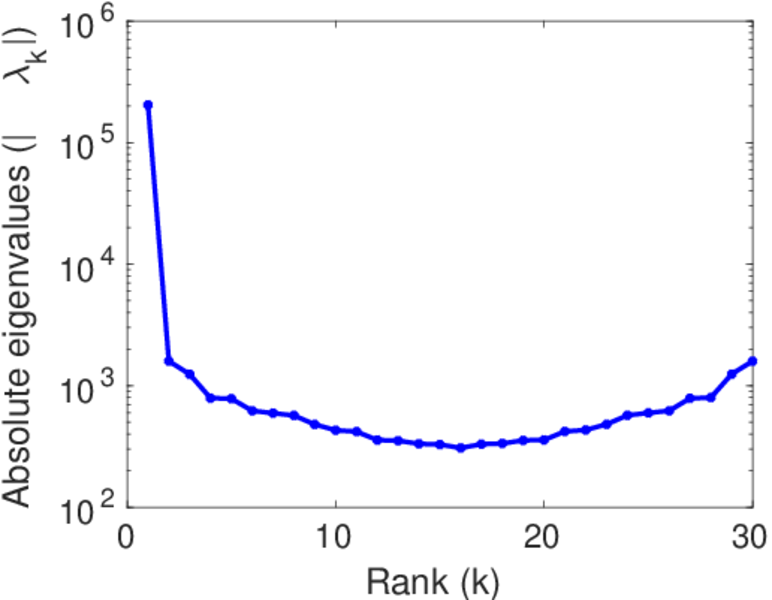
Matrix decompositions plots


Downloads
References
|
[1]
|
Jérôme Kunegis.
KONECT – The Koblenz Network Collection.
In Proc. Int. Conf. on World Wide Web Companion, pages
1343–1350, 2013.
[ http ]
|
|
[2]
|
Wikimedia Foundation.
Wikimedia downloads.
http://dumps.wikimedia.org/, January 2010.
|
 KONECT ‣ Networks ‣
Buy Me a Coffee
KONECT ‣ Networks ‣
Buy Me a Coffee