Wikipedia edits (hsb)
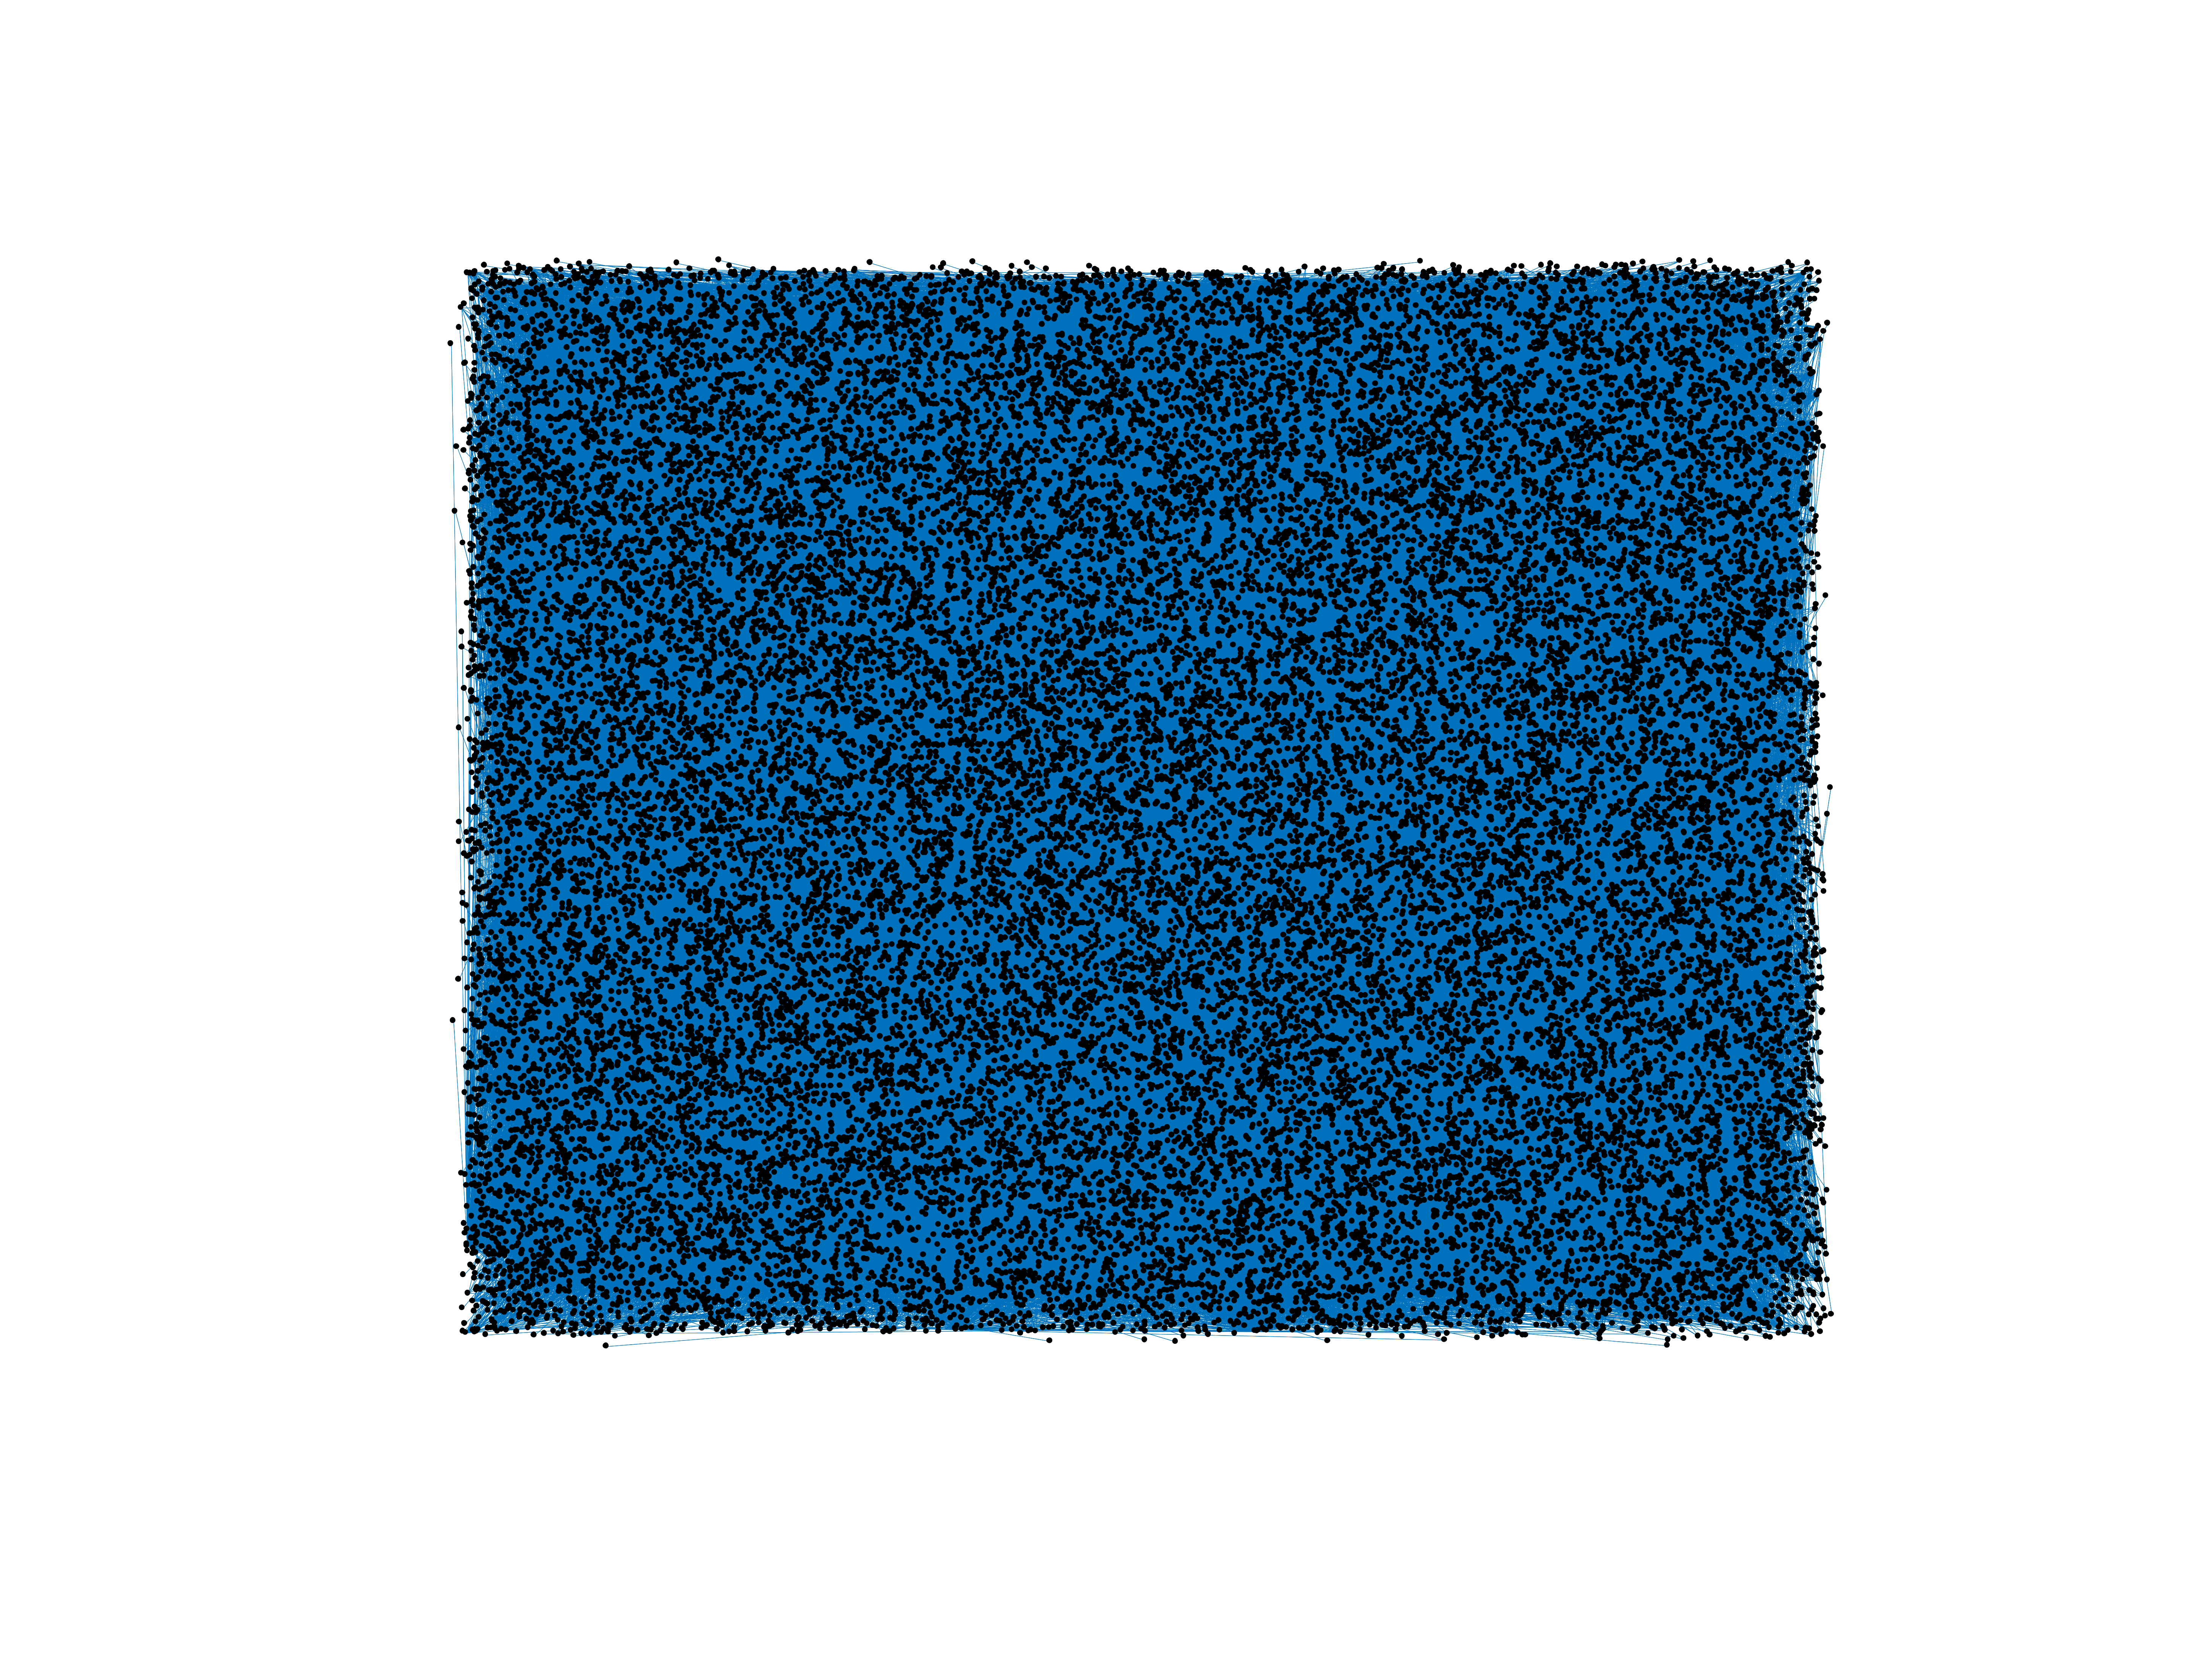
This is the bipartite edit network of the Upper Sorbian Wikipedia. It contains
users and pages from the Upper Sorbian Wikipedia, connected by edit events.
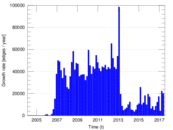
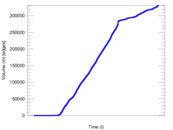
Each edge represents an edit. The dataset includes the timestamp of each edit.
Metadata
Statistics
| Size | n = | 32,373
|
| Left size | n1 = | 1,952
|
| Right size | n2 = | 30,421
|
| Volume | m = | 331,012
|
| Unique edge count | m̿ = | 150,636
|
| Wedge count | s = | 332,241,994
|
| Claw count | z = | 964,814,445,723
|
| Cross count | x = | 2,682,913,718,329,344
|
| Square count | q = | 445,805,291
|
| 4-Tour count | T4 = | 4,895,827,200
|
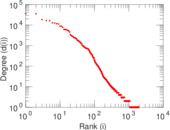
| Maximum degree | dmax = | 36,414
|
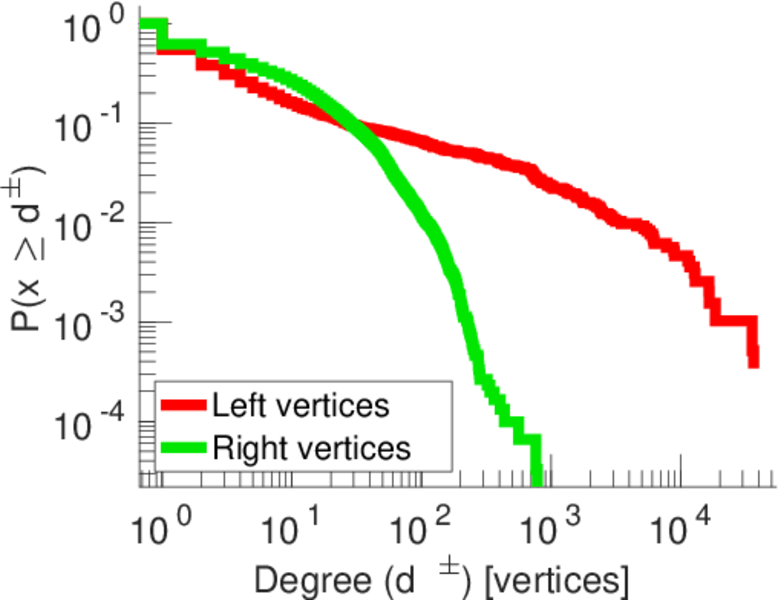
| Maximum left degree | d1max = | 36,414
|
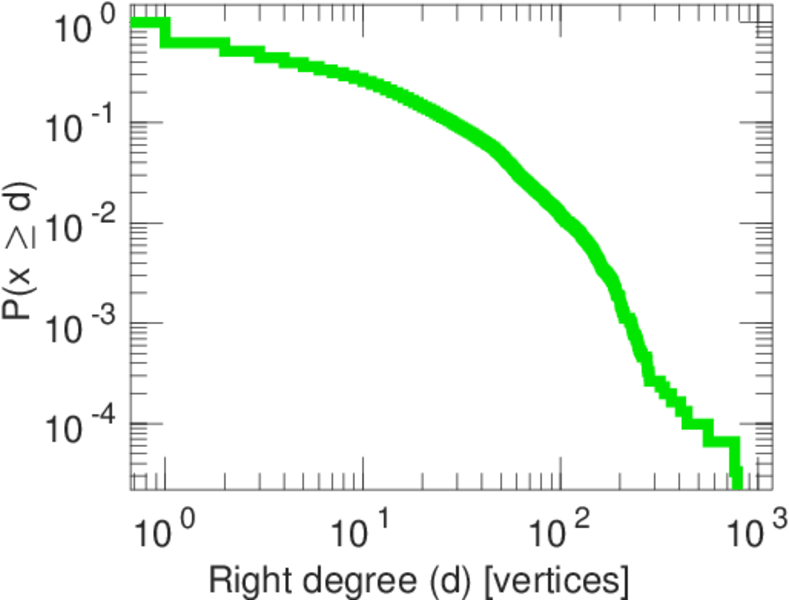
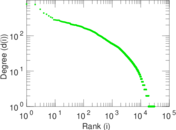
| Maximum right degree | d2max = | 784
|
| Average degree | d = | 20.449 9
|
| Average left degree | d1 = | 169.576
|
| Average right degree | d2 = | 10.881 0
|
| Fill | p = | 0.002 536 74
|
| Average edge multiplicity | m̃ = | 2.197 43
|
| Size of LCC | N = | 31,649
|
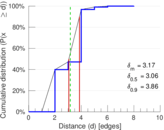
| Diameter | δ = | 10
|
| 50-Percentile effective diameter | δ0.5 = | 3.056 47
|
| 90-Percentile effective diameter | δ0.9 = | 3.863 58
|
| Median distance | δM = | 4
|
| Mean distance | δm = | 3.170 57
|
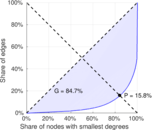
| Gini coefficient | G = | 0.848 247
|
| Balanced inequality ratio | P = | 0.158 372
|
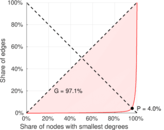
| Left balanced inequality ratio | P1 = | 0.040 007 6
|
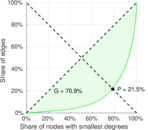
| Right balanced inequality ratio | P2 = | 0.215 300
|
| Relative edge distribution entropy | Her = | 0.738 136
|
| Power law exponent | γ = | 2.092 40
|
| Tail power law exponent | γt = | 1.721 00
|
| Degree assortativity | ρ = | −0.360 782
|
| Degree assortativity p-value | pρ = | 0.000 00
|
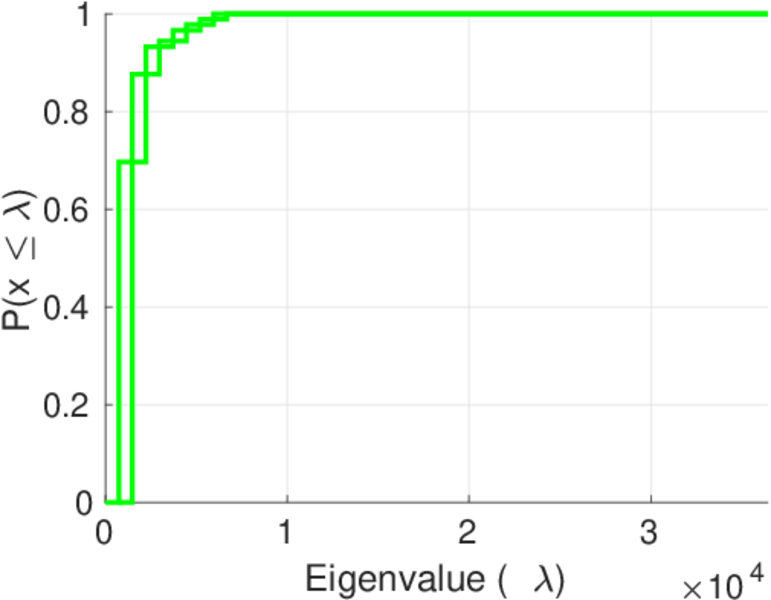
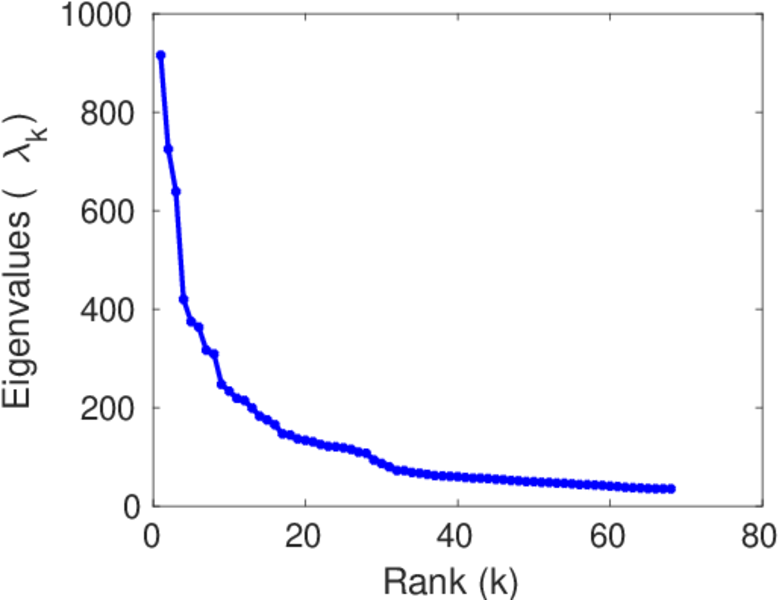
| Spectral norm | α = | 915.430
|
| Algebraic connectivity | a = | 0.050 932 4
|
| Spectral separation | |λ1[A] / λ2[A]| = | 1.262 62
|
| Controllability | C = | 28,718
|
| Relative controllability | Cr = | 0.890 619
|
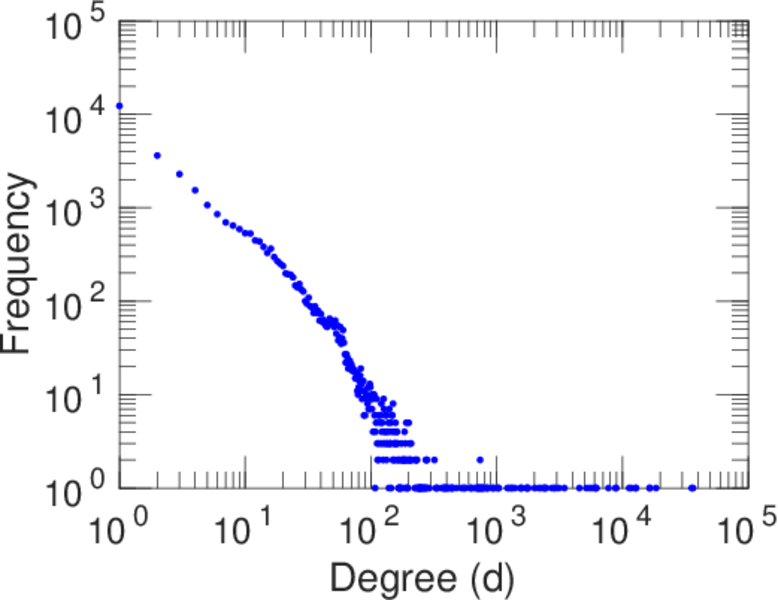
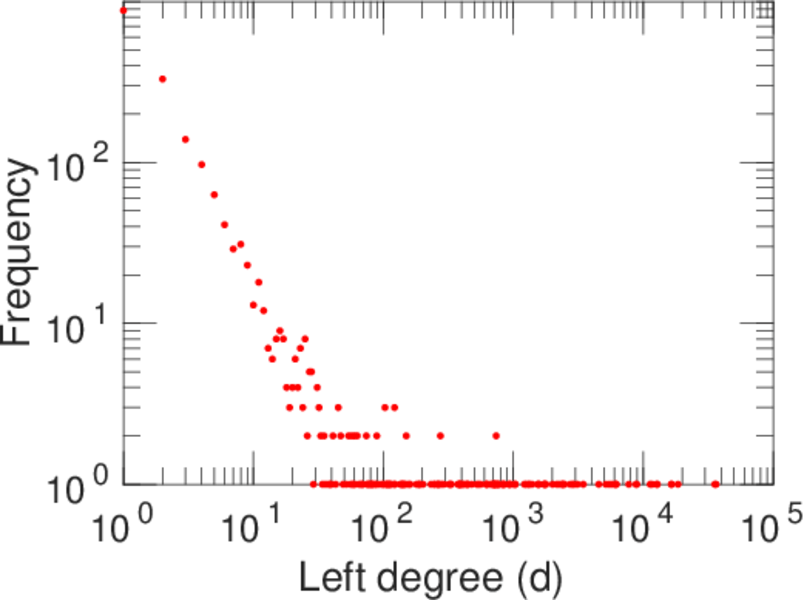
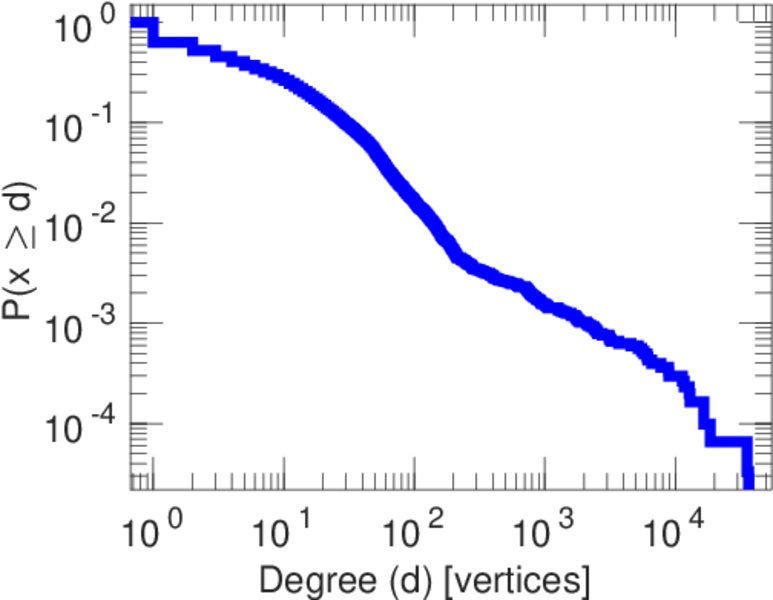
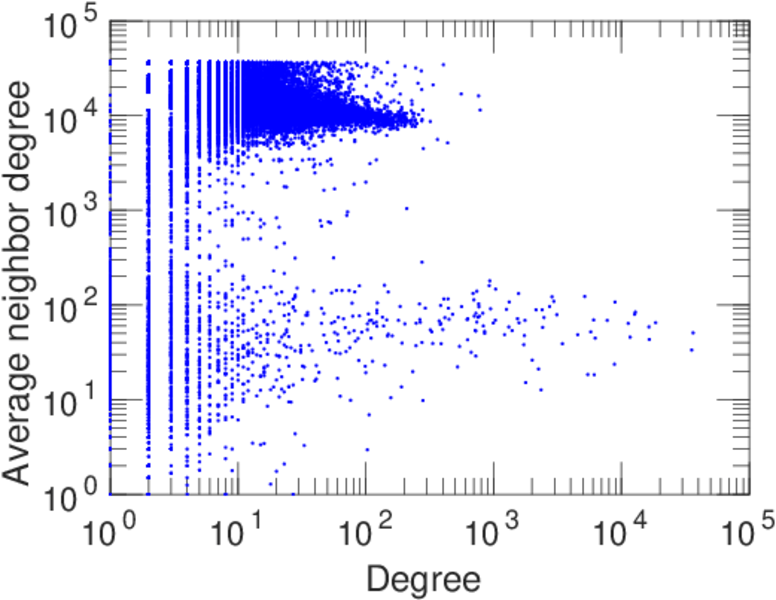
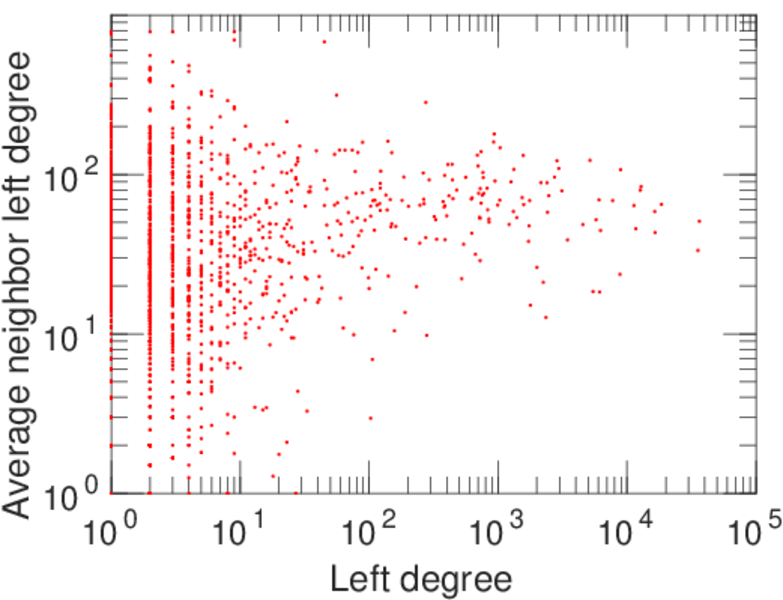
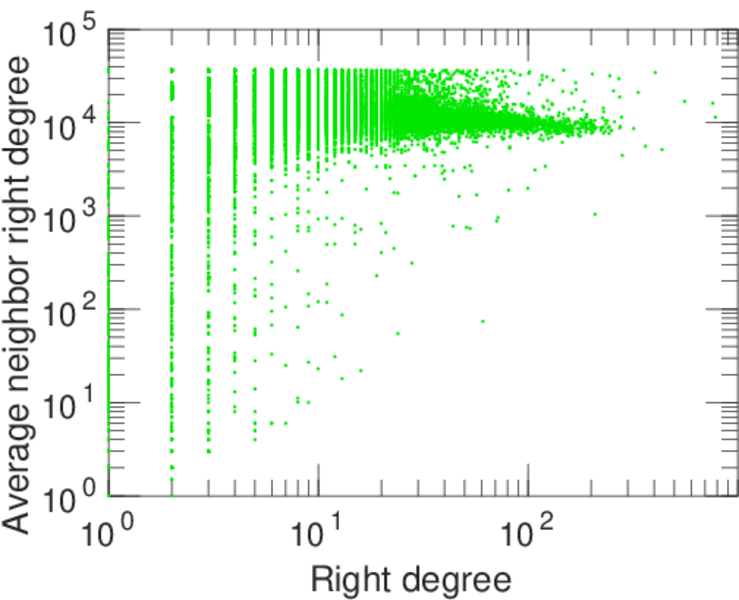
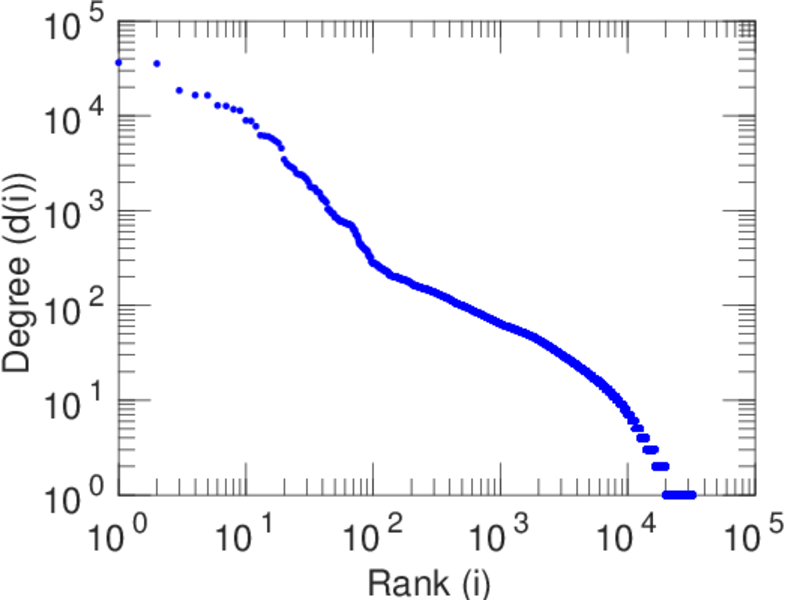
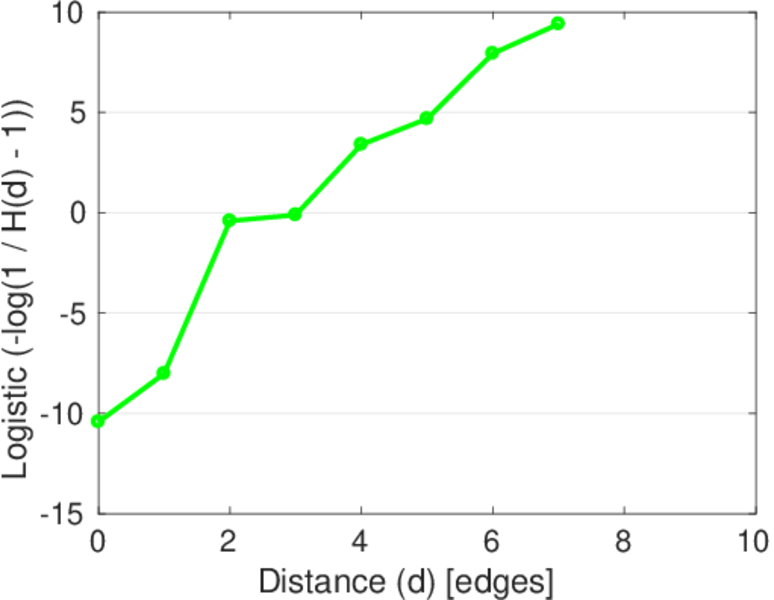
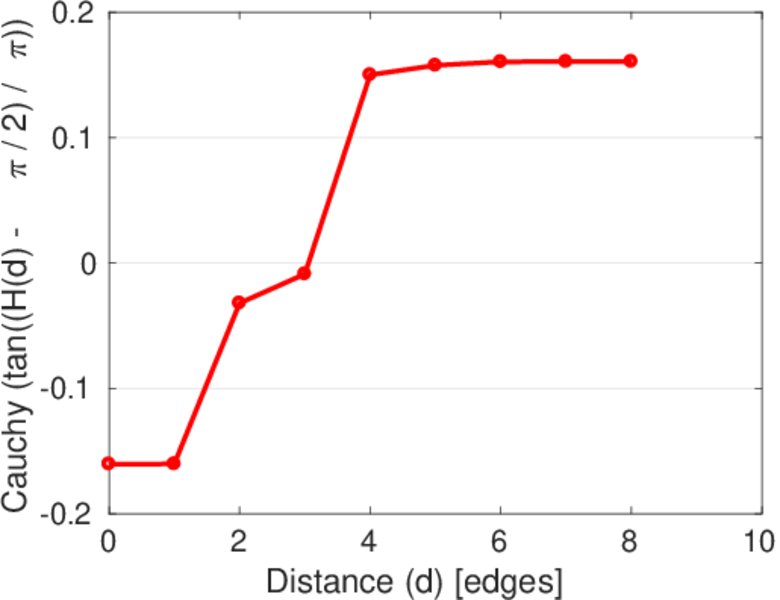
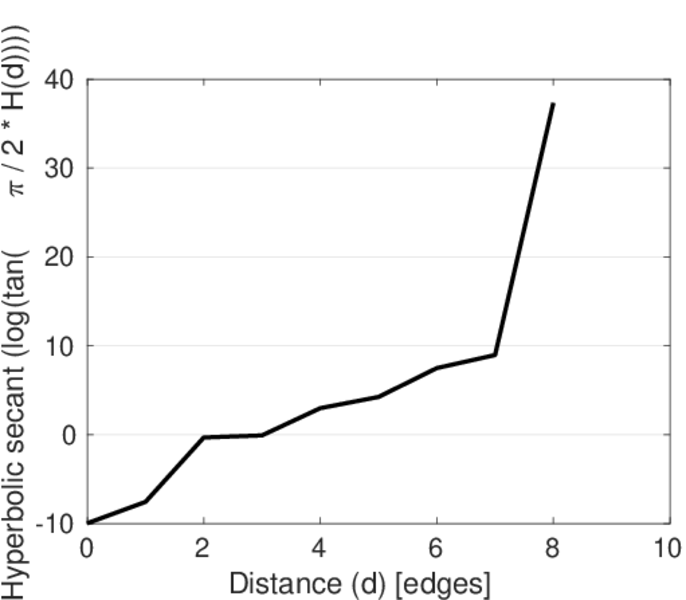
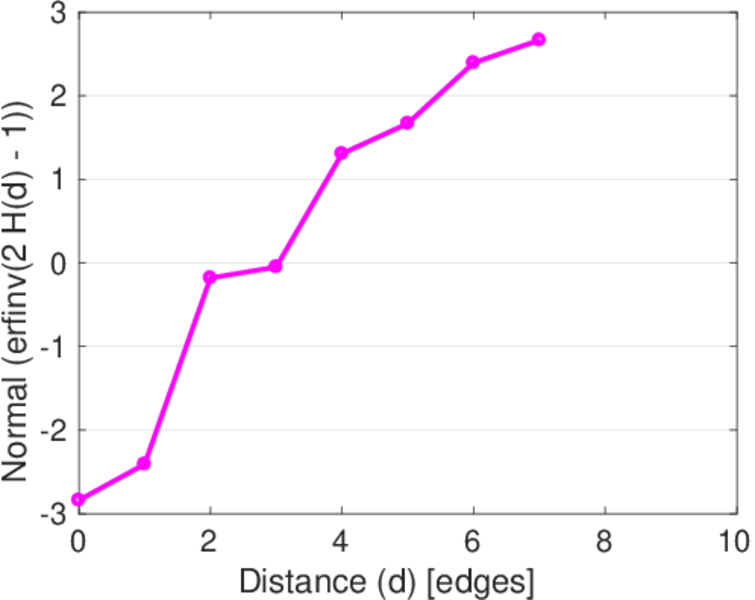
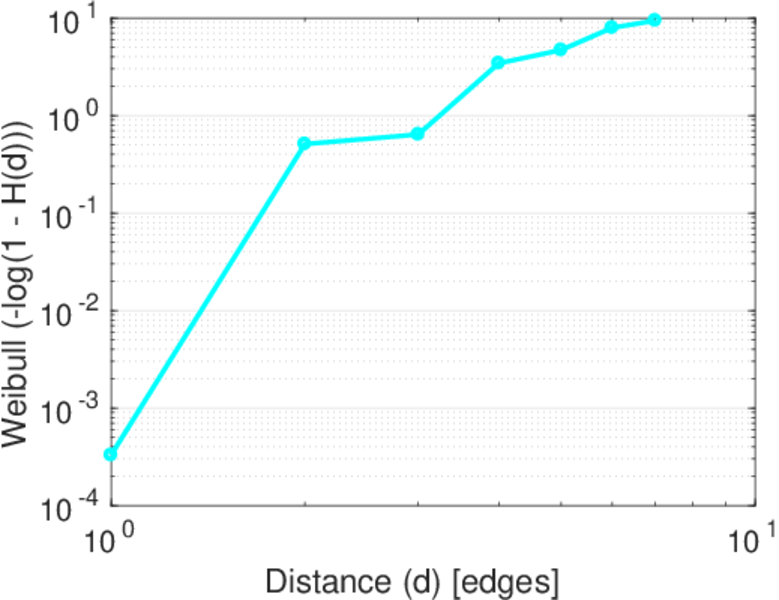
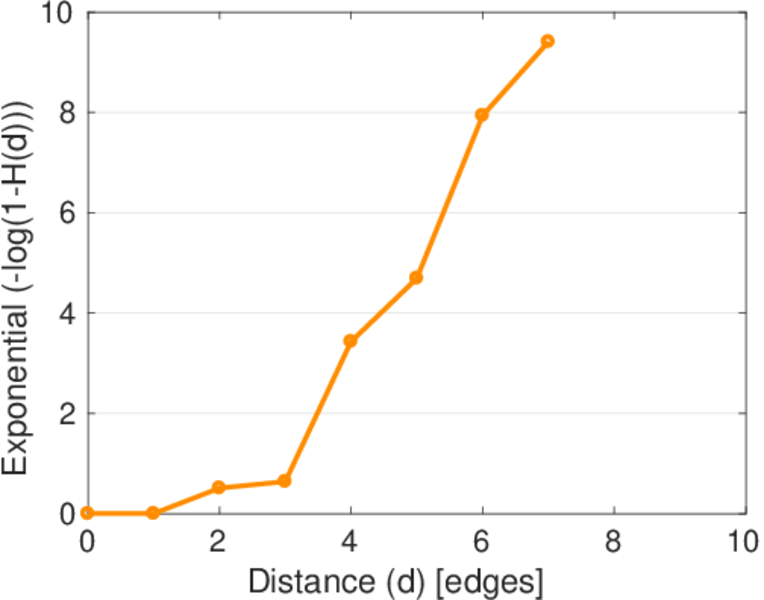
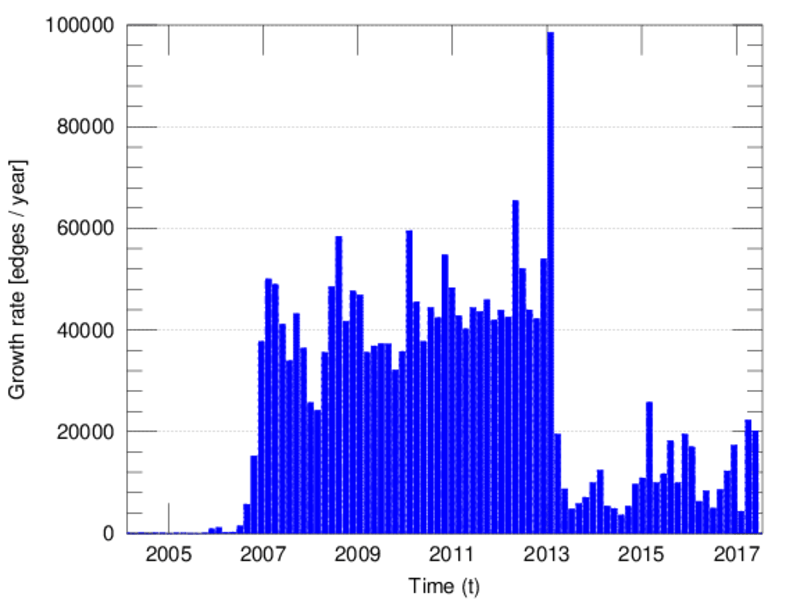
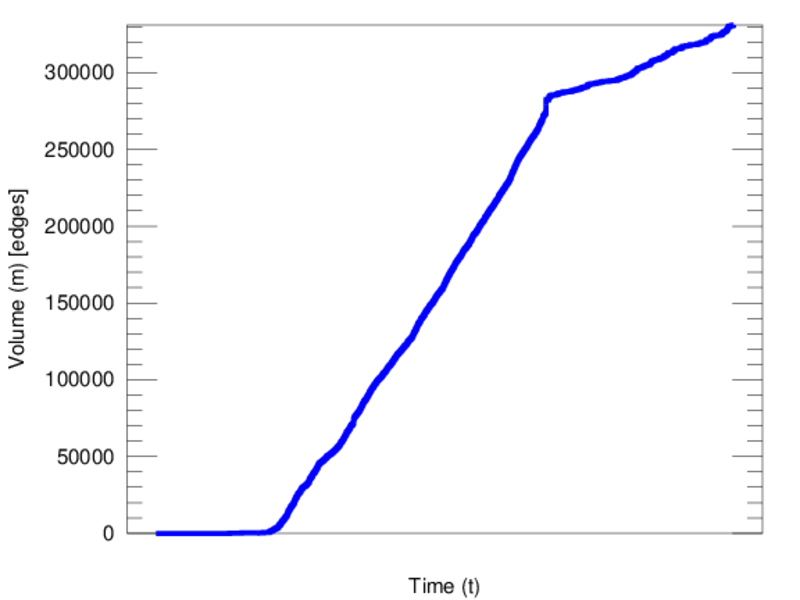
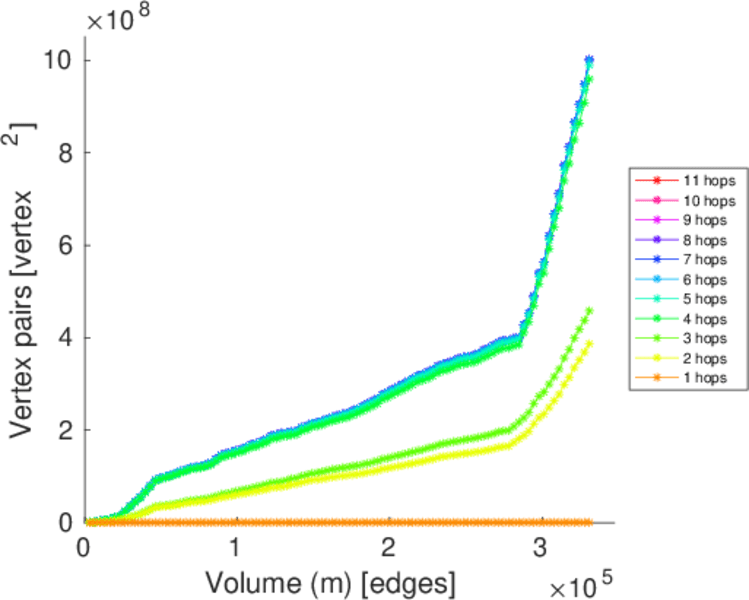
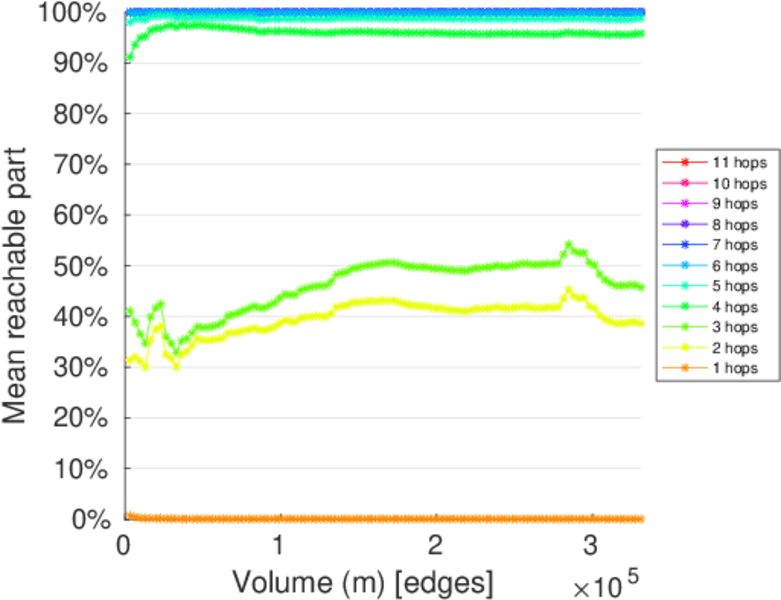
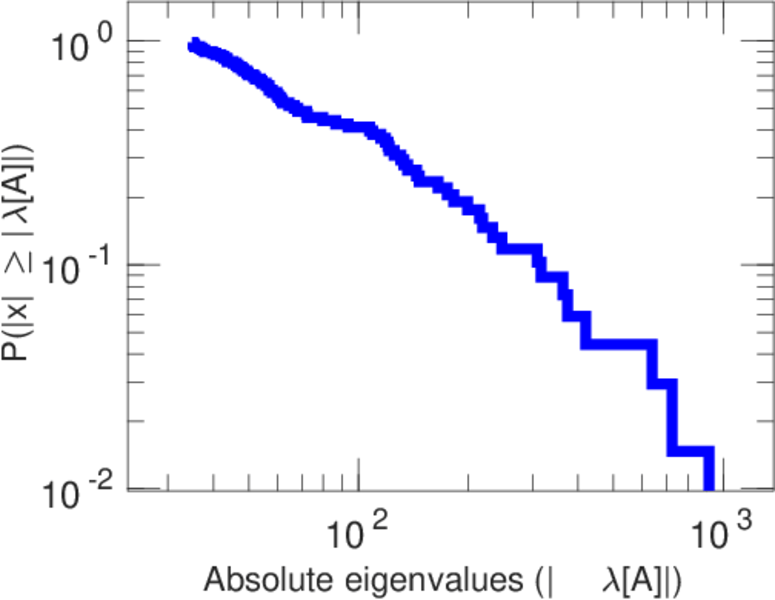
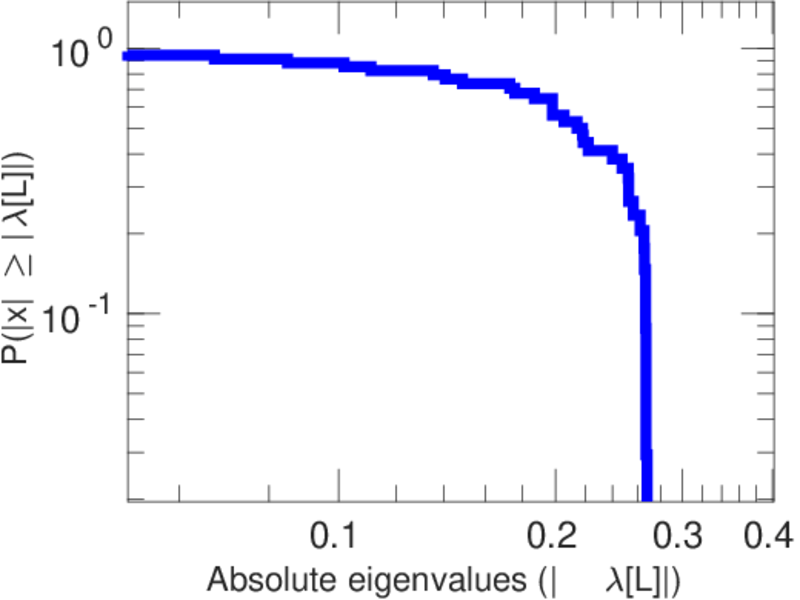
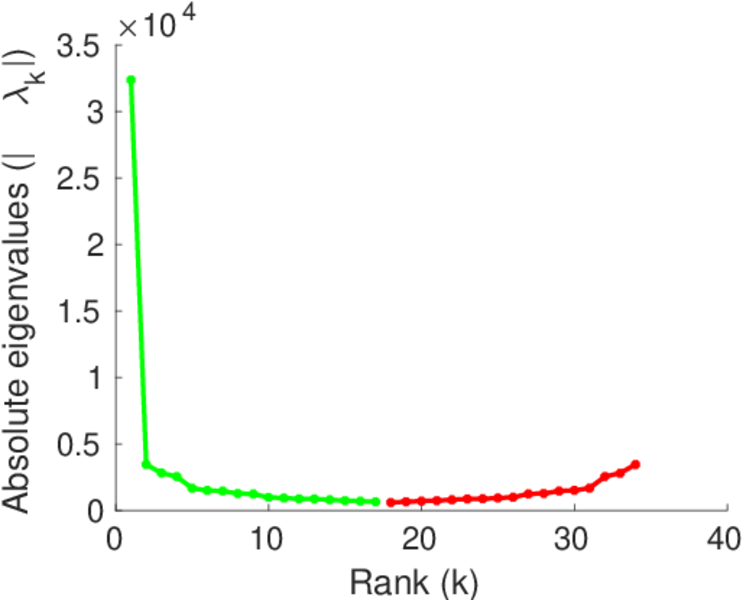
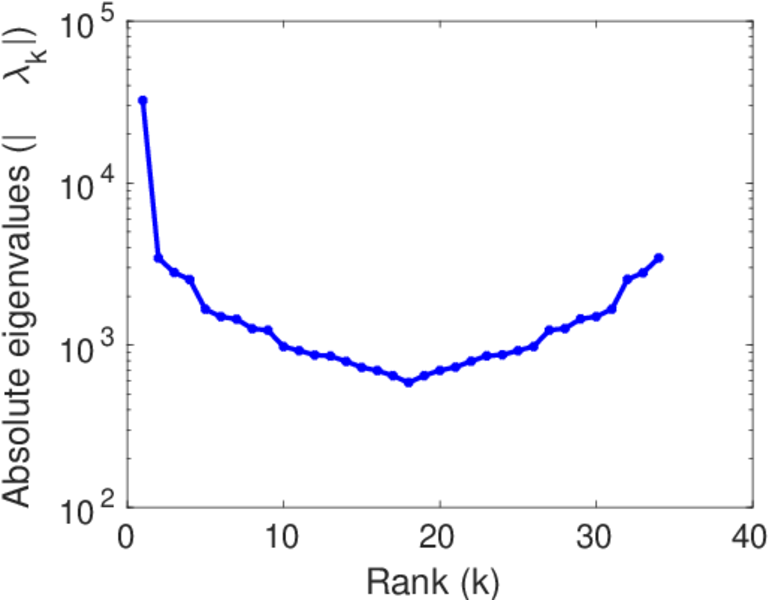
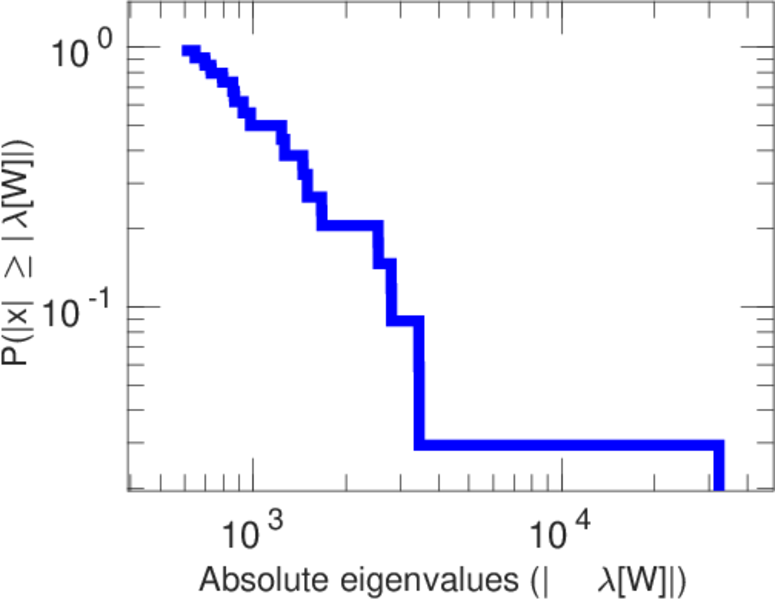
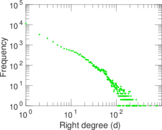
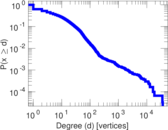
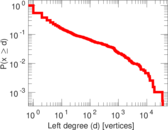
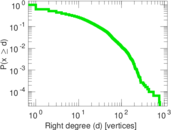
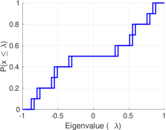
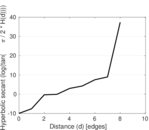
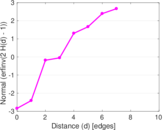
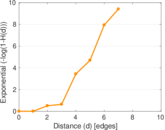
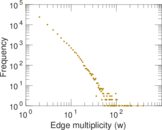
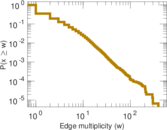
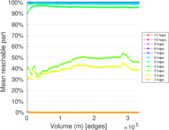
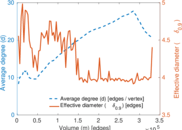
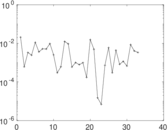
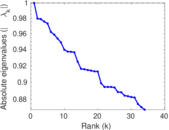
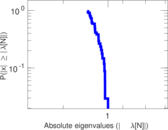
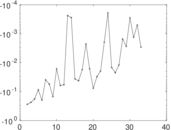
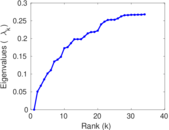
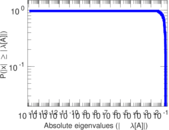
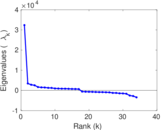
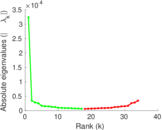
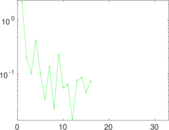
Plots


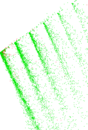
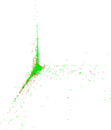
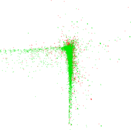


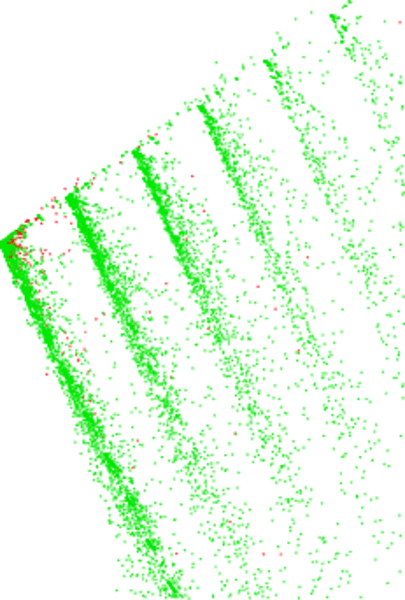
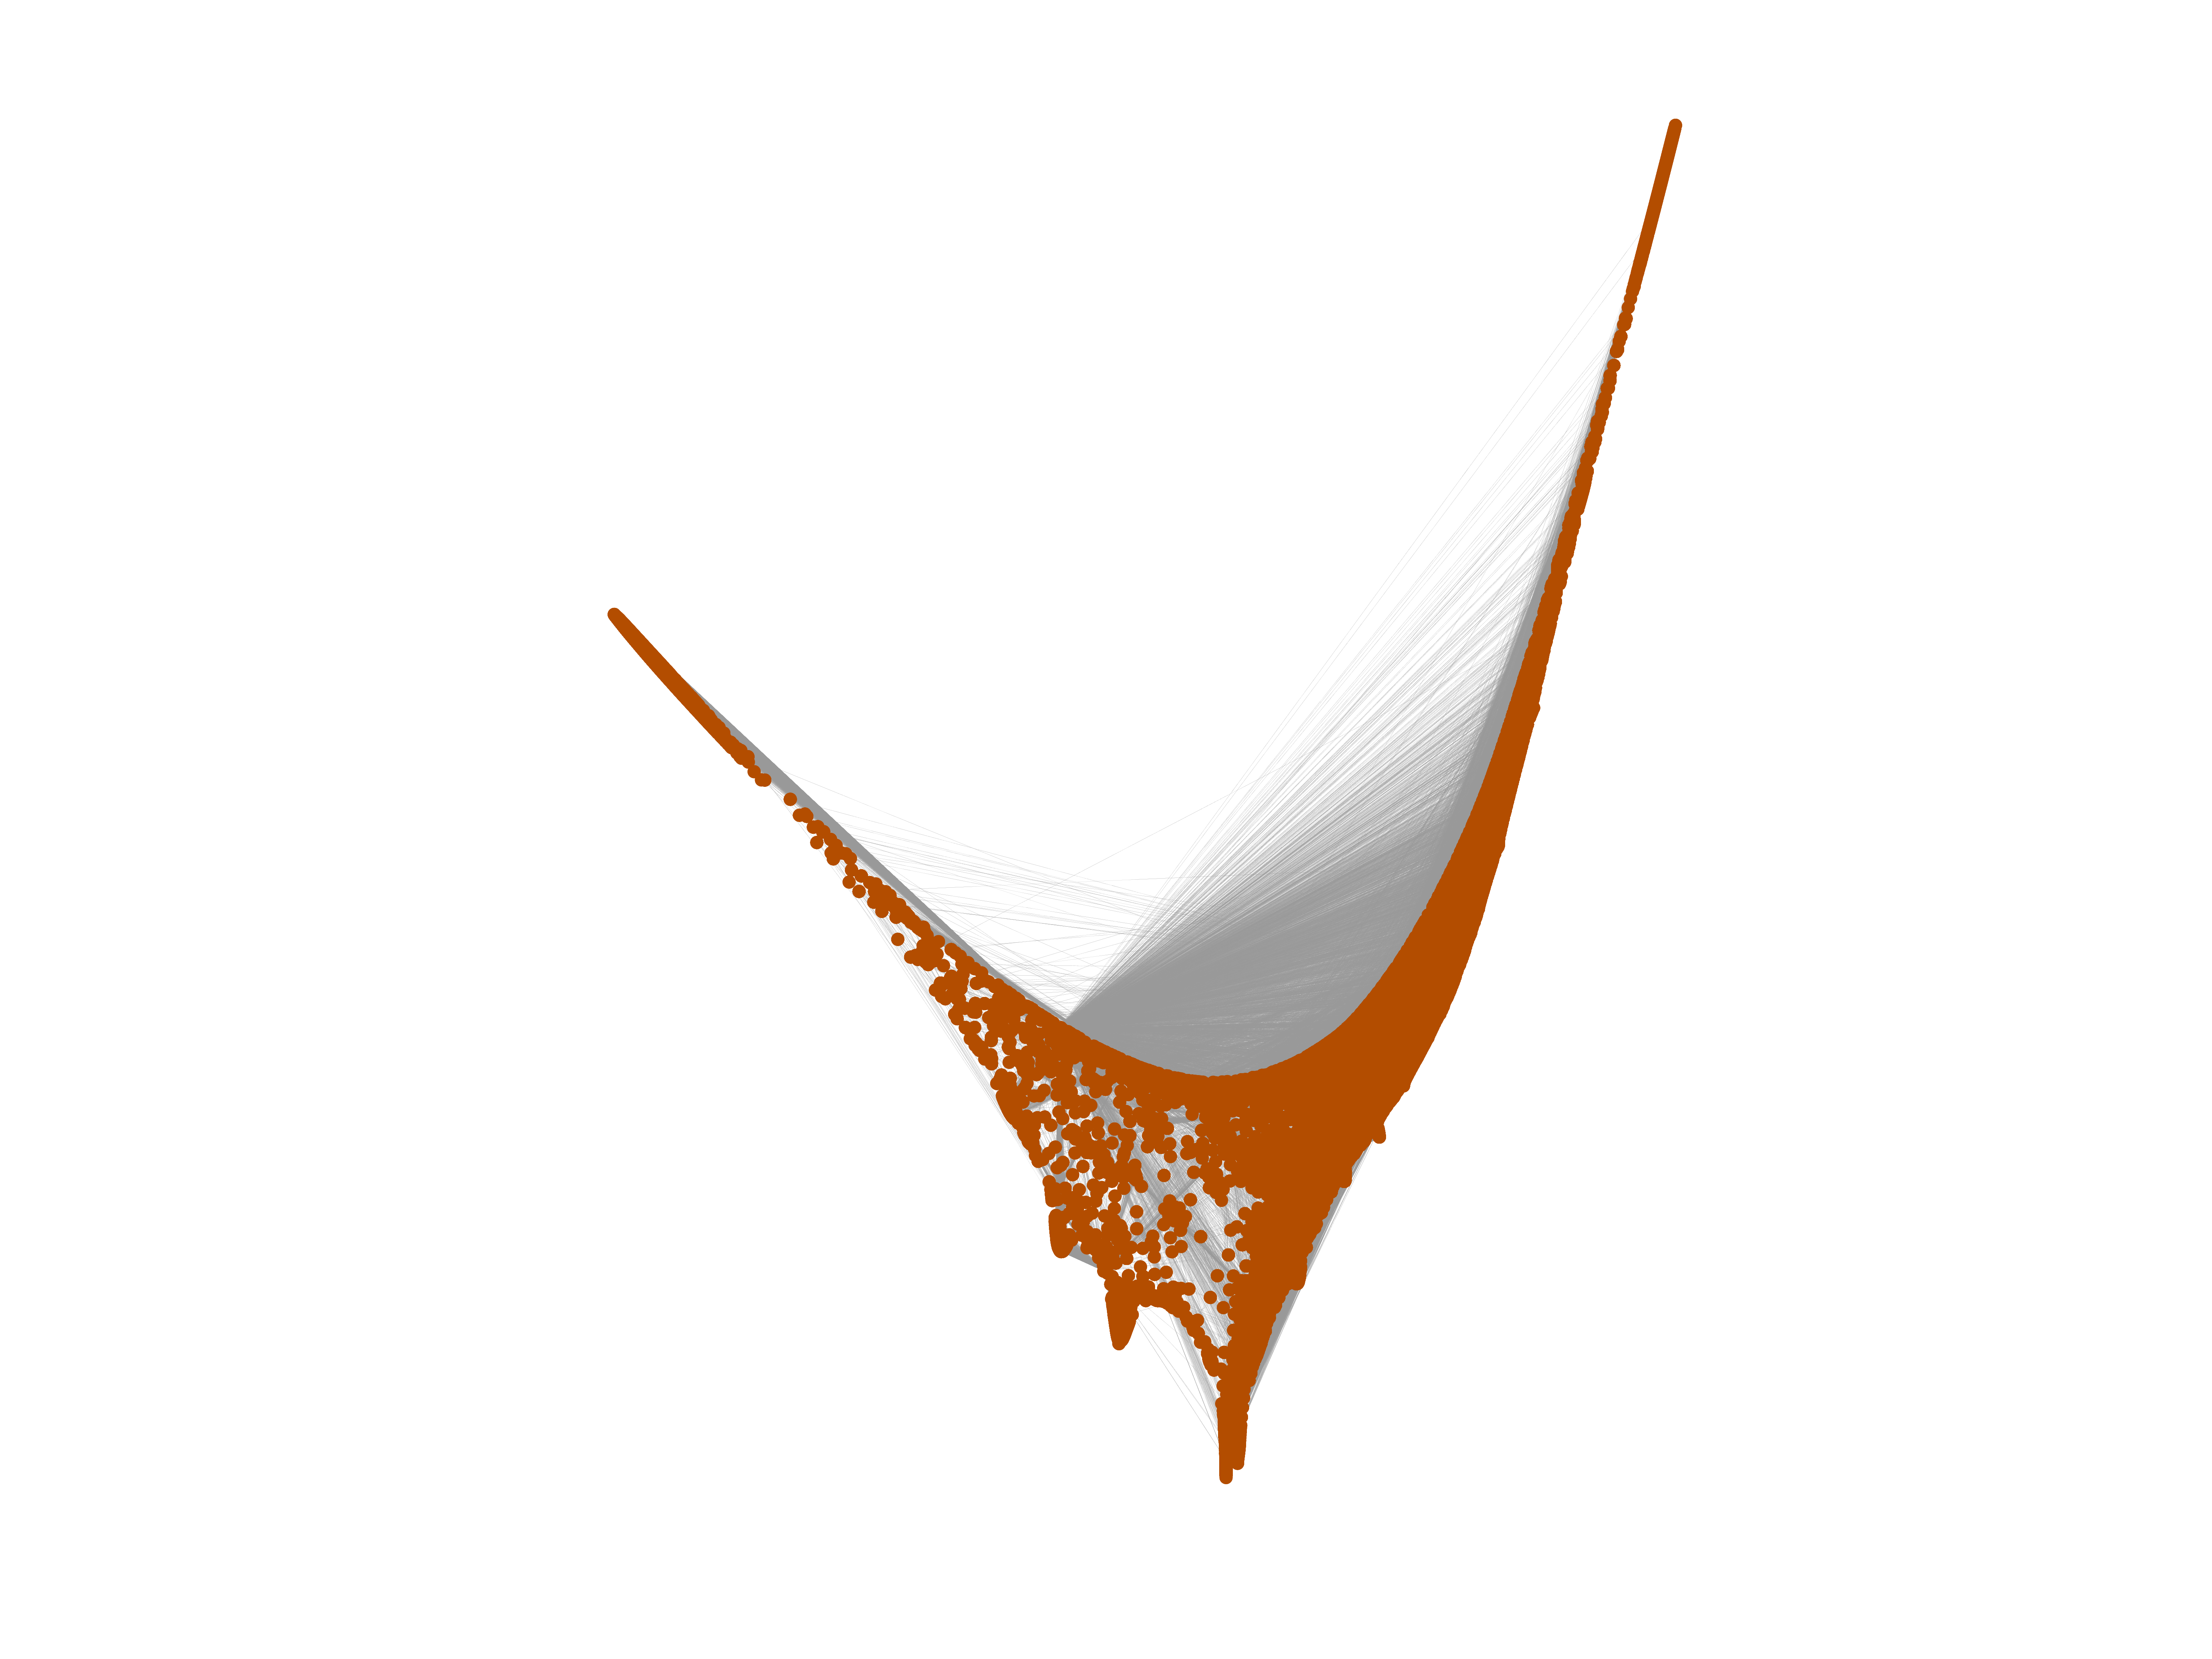
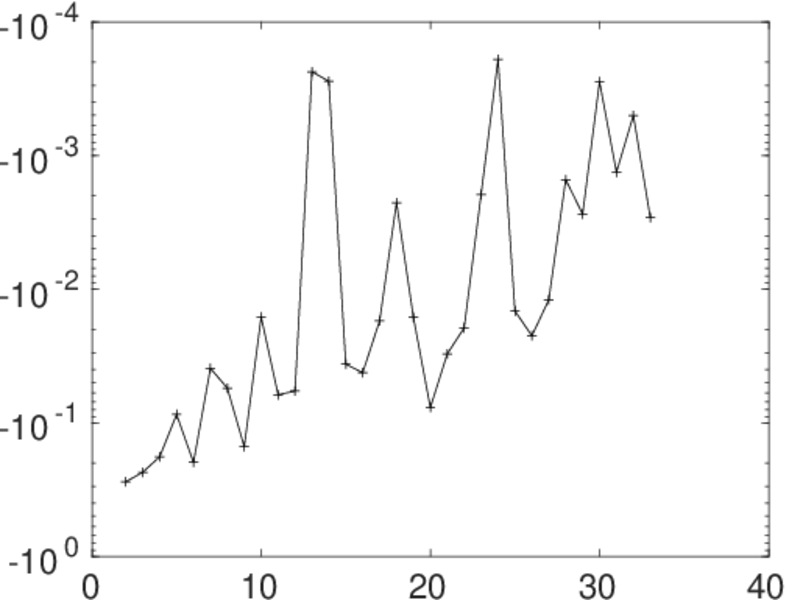
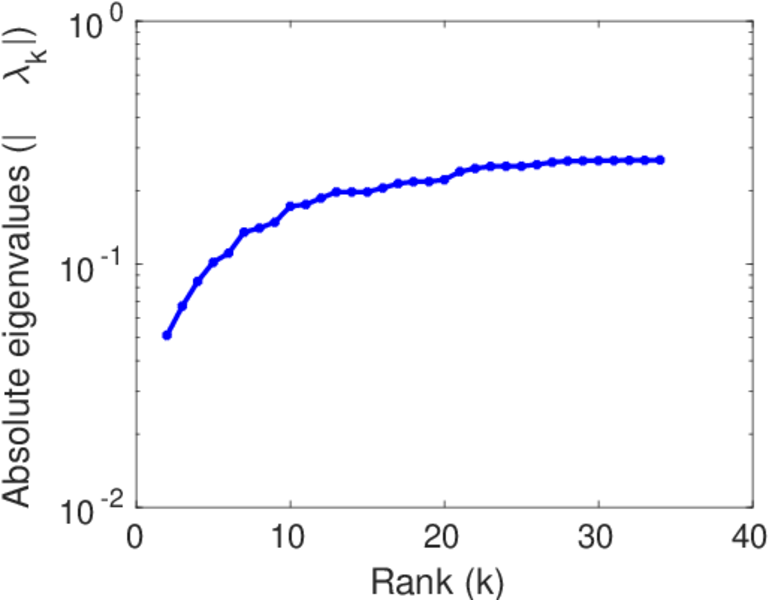
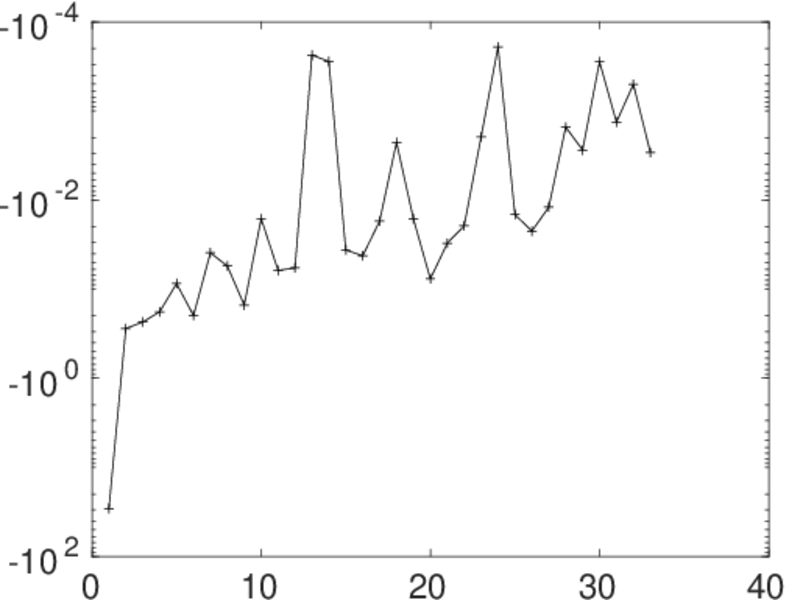
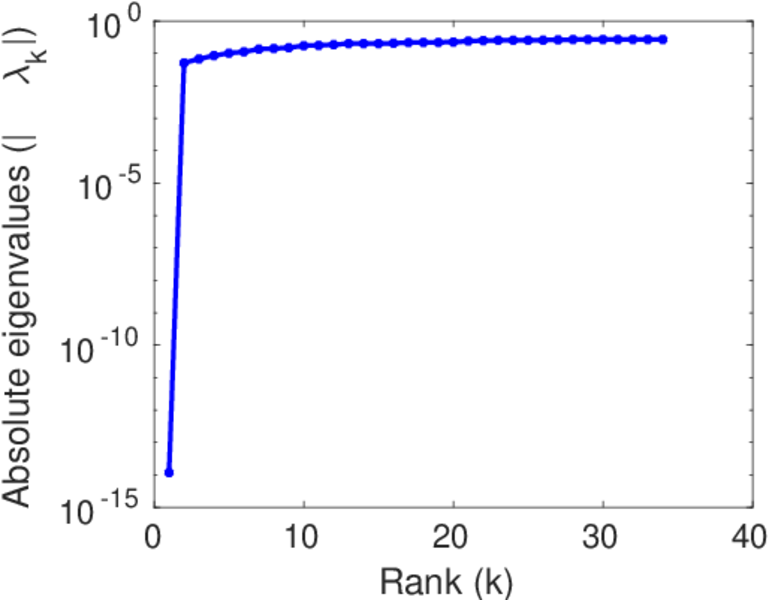
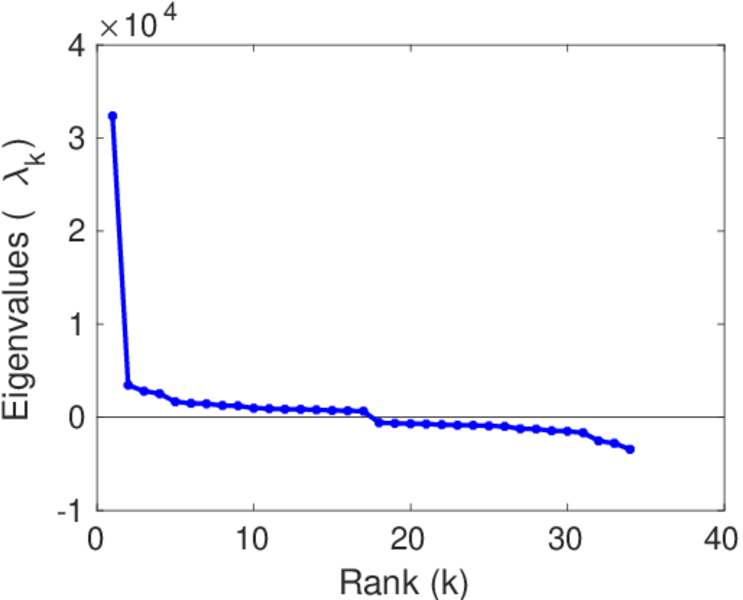
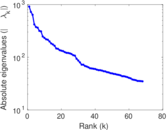
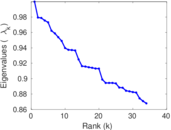
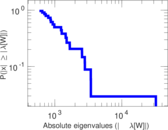
Matrix decompositions plots


Downloads
References
|
[1]
|
Jérôme Kunegis.
KONECT – The Koblenz Network Collection.
In Proc. Int. Conf. on World Wide Web Companion, pages
1343–1350, 2013.
[ http ]
|
|
[2]
|
Wikimedia Foundation.
Wikimedia downloads.
http://dumps.wikimedia.org/, January 2010.
|
 KONECT ‣ Networks ‣
Buy Me a Coffee
KONECT ‣ Networks ‣
Buy Me a Coffee